Análisis de coste efectividad de los medicamentos ... · Análisis de coste efectividad ... Ratio...
22
Análisis de coste efectividad de los medicamentos biológicos para el tratamiento de la artritis soriática (AS). Yolanda Bravo Vergel, Neil Hawkins, Christian Asseburg, Steve Palmer, Karl Claxton and Mark Sculpher Centre for Health Economics, University of York, U.K. AES, Barcelona 13-15 Julio 2005
Transcript of Análisis de coste efectividad de los medicamentos ... · Análisis de coste efectividad ... Ratio...

Análisis de coste efectividad
de los medicamentos
biológicos para el tratamiento
de la artritis soriática (AS).
Yolanda Bravo Vergel, Neil Hawkins, Christian Asseburg,
Steve Palmer, Karl Claxton and Mark Sculpher
Centre for Health Economics, University of York, U.K.
AES, Barcelona 13-15 Julio 2005
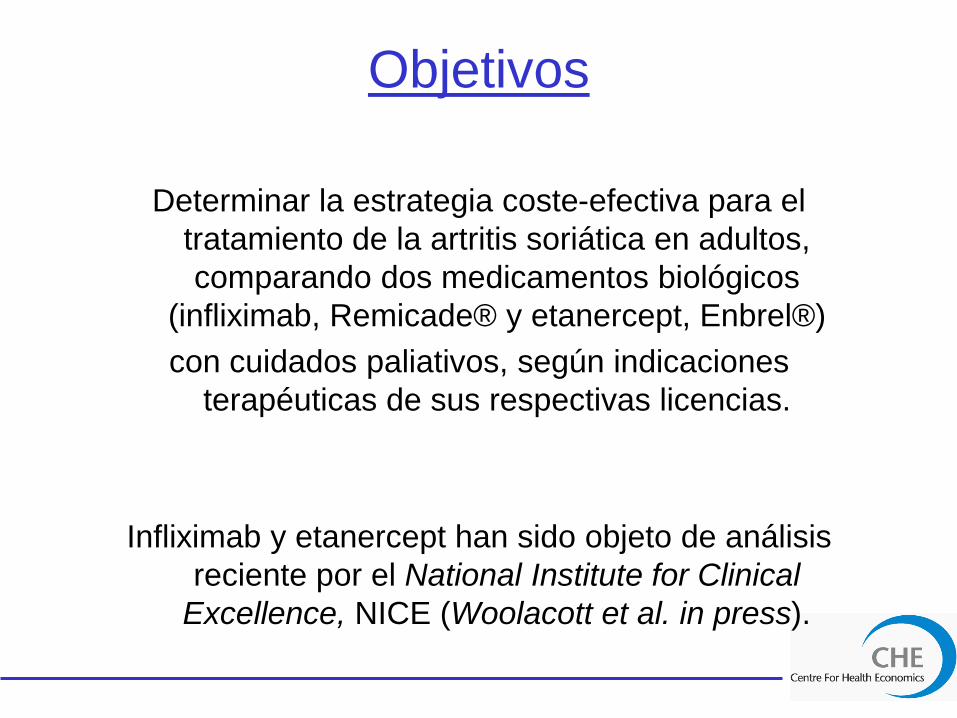
Objetivos
Determinar la estrategia coste-efectiva para el
tratamiento de la artritis soriática en adultos,
comparando dos medicamentos biológicos
(infliximab, Remicade® y etanercept, Enbrel®)
con cuidados paliativos, según indicaciones
terapéuticas de sus respectivas licencias.
Infliximab y etanercept han sido objeto de análisis
reciente por el National Institute for Clinical
Excellence, NICE (Woolacott et al. in press).
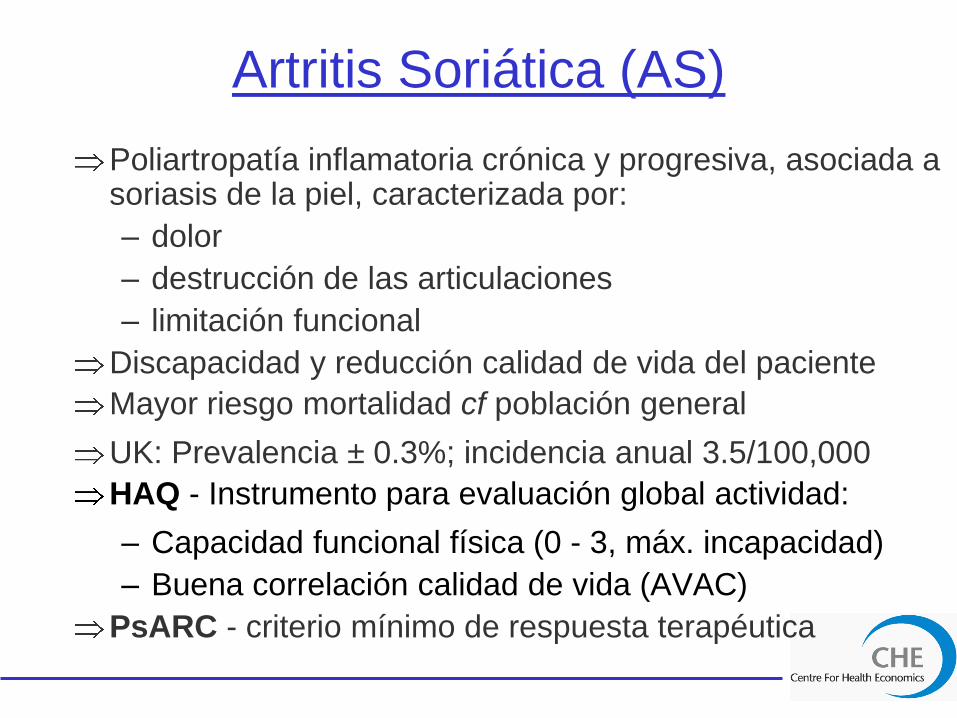
Artritis Soriática (AS)
Poliartropatía inflamatoria crónica y progresiva, asociada a soriasis de la piel, caracterizada por:
– dolor
– destrucción de las articulaciones
– limitación funcional
Discapacidad y reducción calidad de vida del paciente
Mayor riesgo mortalidad cf población general
UK: Prevalencia ± 0.3%; incidencia anual 3.5/100,000
HAQ - Instrumento para evaluación global actividad:
– Capacidad funcional física (0 - 3, máx. incapacidad)
– Buena correlación calidad de vida (AVAC)
PsARC - criterio mínimo de respuesta terapéutica

Tratamiento estándar
Tratamientos tomados de AR
AS - dolor e inflamación; deformidad e incapacidad
FARMEs:
– alivio sintomático, potencial para inducir remisión y reducir destrucción articulaciones.
– toxicidad, comorbididad, embarazo
– licencia para AS: leflunomida (Arava®)
1/3 respuesta terapéutica a cualquier FARME
Largo plazo: pacientes refractarios al tratamiento (falta de eficacia o toxicidad).
Indicación terapéutica anti-TNFs:
“Cuando la respuesta a dos o más fármacos antirreumáticos modificadores de la enfermedad ha demostrado ser inadecuada”

Agentes Anti-TNF
Receptor proteico soluble humano, bloquea la acción
inflamatoria de los TNF (factor de necrosis tumoral- ).
Eficacia y baja toxicidad demostrada a corto plazo en
estudios clínicos controlados (inflamación y dolor).
Eficaz tratamiento Soriasis
Largo plazo:
– mantenimiento de la eficacia?
– potenciales efectos adversos? (infecciones)
– freno / inhibición de la progresión radiológica?
Coste elevado

Métodos
Modelo de decisión probabilístico.
Estructura: modelo cohorte que toma la forma de un árbol
de decisión recursivo (ciclos 3 meses).
Compara las 3 estrategias objeto de analisis
Combina las 2 principales medidas eficacia:
– respuesta terapéutica inicial (3 m, PsARC)
– progresión: capacidad funcional física (HAQ).
Incorpora la probabilidad anual de fallo terapéutico
Coste incremental por AVAC.
Perspectiva financiador público (UK NHS)
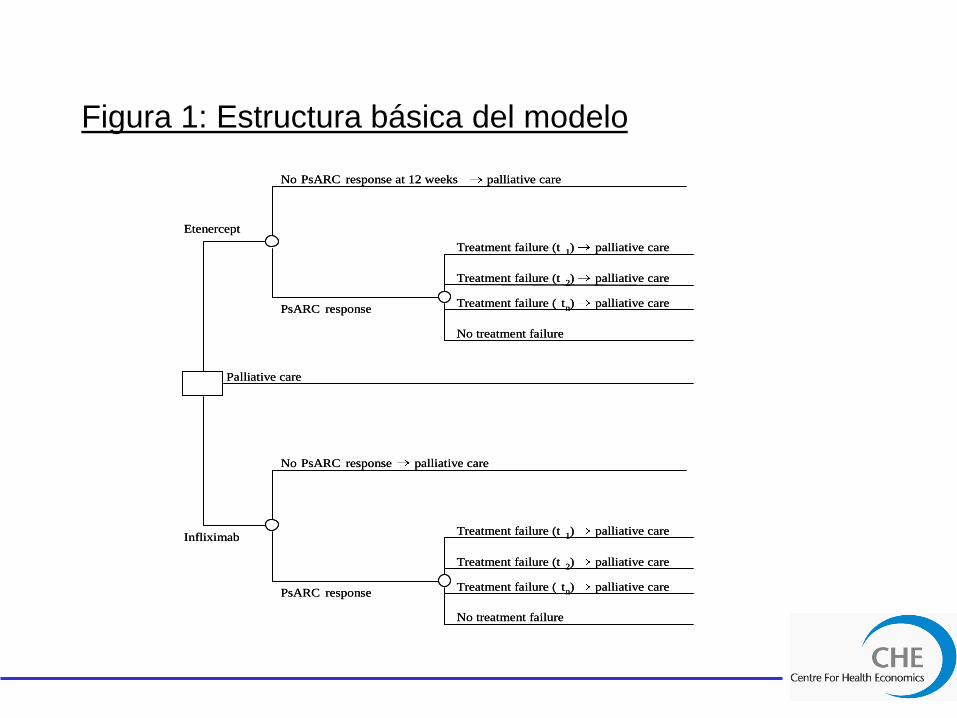
Figura 1: Estructura básica del modelo
Etenercept
Palliative care
Infliximab
PsARC response
No PsARC response at 12 weeks palliative care
Treatment failure (t 1 ) palliative care
Treatment failure (t 2 ) palliative care
Treatment failure ( t n ) palliative care
No treatment failure
PsARC response
No PsARC response palliative care
Treatment failure (t 1 ) palliative care
Treatment failure (t 2 ) palliative care
Treatment failure ( t n ) palliative care
No treatment failure
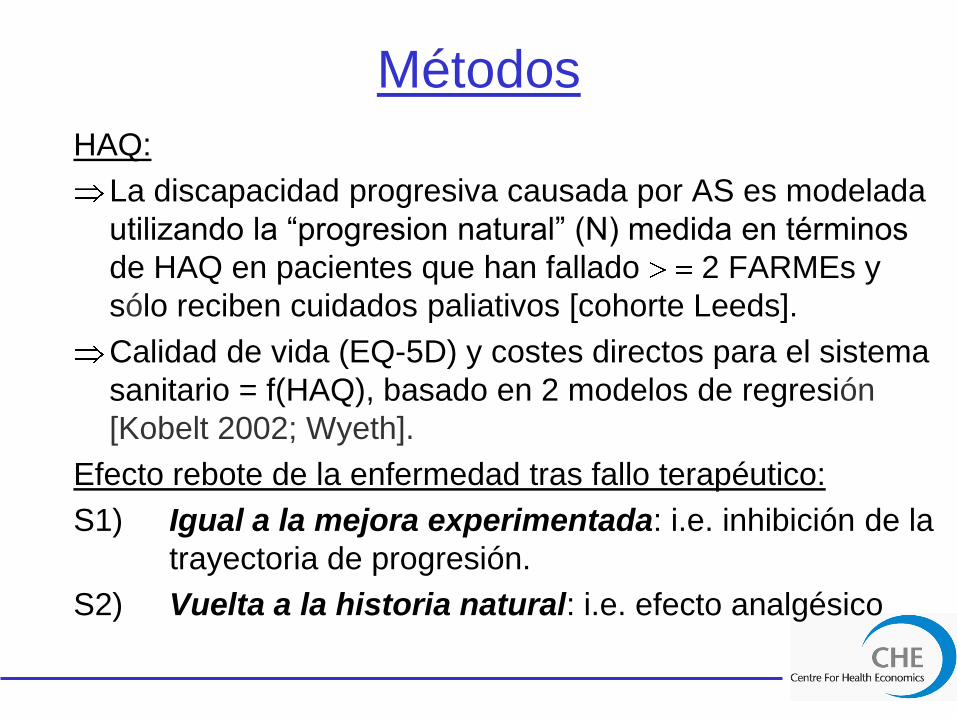
Métodos
HAQ:
La discapacidad progresiva causada por AS es modelada
utilizando la “progresion natural” (N) medida en términos
de HAQ en pacientes que han fallado 2 FARMEs y
sólo reciben cuidados paliativos [cohorte Leeds].
Calidad de vida (EQ-5D) y costes directos para el sistema
sanitario = f(HAQ), basado en 2 modelos de regresión
[Kobelt 2002; Wyeth].
Efecto rebote de la enfermedad tras fallo terapéutico:
S1) Igual a la mejora experimentada: i.e. inhibición de la
trayectoria de progresión.
S2) Vuelta a la historia natural: i.e. efecto analgésico
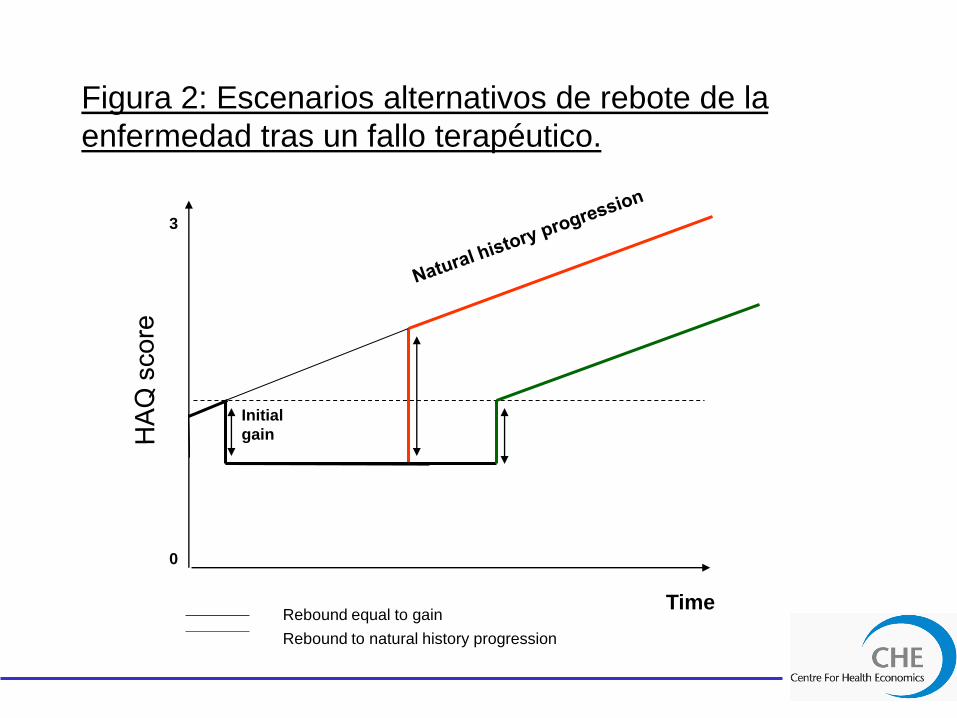
Figura 2: Escenarios alternativos de rebote de la
enfermedad tras un fallo terapéutico.
Rebound to natural history progression
Rebound equal to gain
Initial
gain
Time
3
0
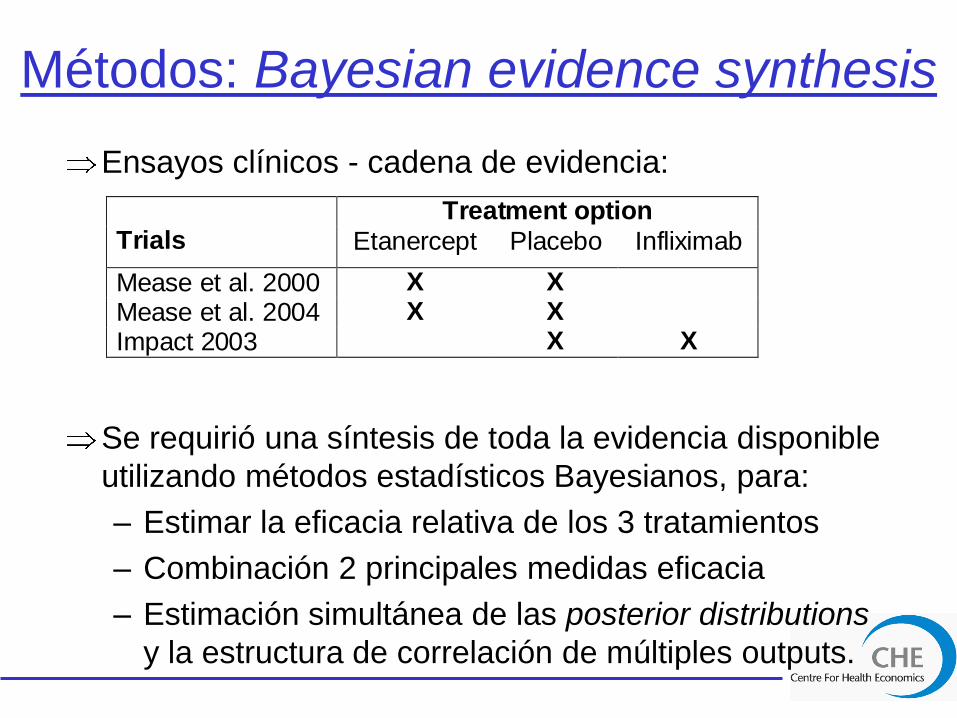
Métodos: Bayesian evidence synthesis
Ensayos clínicos - cadena de evidencia:
Se requirió una síntesis de toda la evidencia disponible
utilizando métodos estadísticos Bayesianos, para:
– Estimar la eficacia relativa de los 3 tratamientos
– Combinación 2 principales medidas eficacia
– Estimación simultánea de las posterior distributions
y la estructura de correlación de múltiples outputs.
Treatment option Trials Etanercept Placebo Infliximab
Mease et al. 2000 X X
Mease et al. 2004 X X
Impact 2003 X X

Métodos: Bayesian evidence synthesis
Consistió en 2 metaanálisis unidos, que estiman:
1. Ratio de respuesta (PsARC)
2. Cambio medio en la puntuación del indice HAQ,
condicionada por respuesta al tratamiento.
Supuestos:
Heterogeneidad ensayos clínicos – modelo de efectos
mixtos: p(resp) placebo & progresión natural HAQ (N).
Eficacia relativa – modelo de efectos fijos, usando la
escala “log-odds”:
– P(resp) etanercept, P(resp) infliximab
– Cambio medio en HAQ | criterio respuesta PsARC,
para etanercept e infliximab

Figura 3: Ajuste del efecto placebo
Treatment
Palliative care
tp
tp1
1
placplacresp ipiN
placplacnoresp ipiN
N
Treatment
Palliative care
tp
tp1
1
placplacresp ipiN
N
N
N = natural progression; iΔ = incremental HAQ change due to treatment response;
p = probability of response to either treatment or placebo.
Long-term model: We add the HAQ
increment for treatment non-
responders separately whenever
they are taken off treatment (annual
withdrawal rate)
Initial 3 months cycle: We add the
HAQ increment for treatment non-
responders
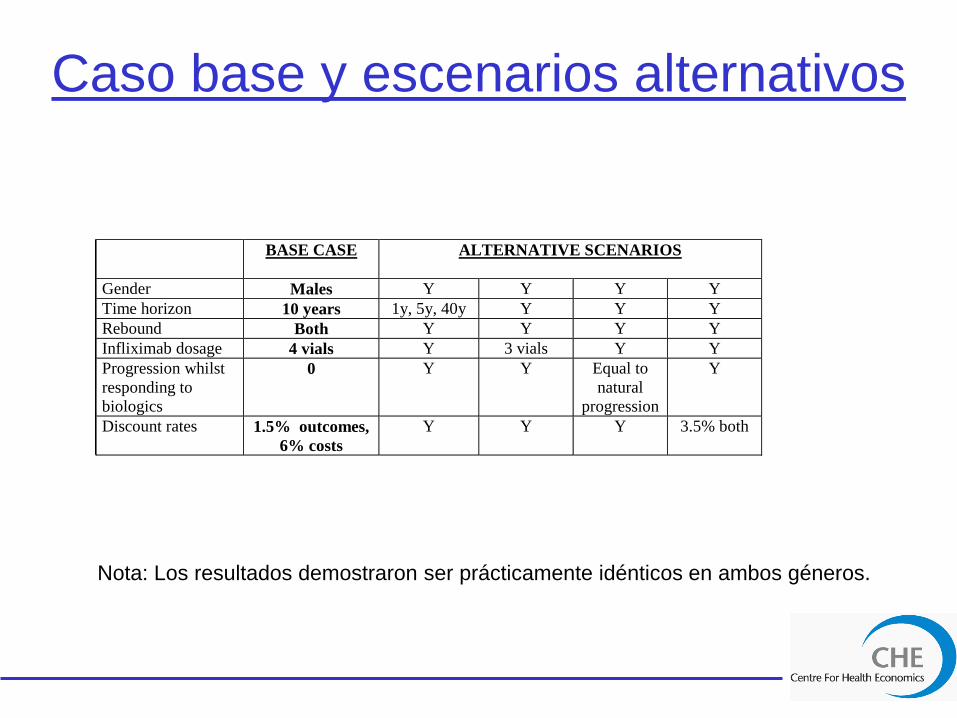
Caso base y escenarios alternativos
BASE CASE ALTERNATIVE SCENARIOS
Gender Males Y Y Y Y
Time horizon 10 years 1y, 5y, 40y Y Y Y
Rebound Both Y Y Y Y
Infliximab dosage 4 vials Y 3 vials Y Y
Progression whilst
responding to
biologics
0 Y Y Equal to
natural
progression
Y
Discount rates 1.5% outcomes,
6% costs
Y Y Y 3.5% both
Nota: Los resultados demostraron ser prácticamente idénticos en ambos géneros.

Tabla 1: Resultados caso base
a= Ratio coste-efectividad (ICER) calculado comparando inflimixab vs etanercept;
b= etanercept vs cuidados paliativos.
REBOUND EQUAL TO GAIN
Probability cost-effective for threshold of:
Treatment Mean costs Mean QALYs ICER £20,000 £30,000 £40,000
Time horizon 10 years – Males
Infliximab £64,274 4.636 £165,363a 0.000 0.001 0.009
Etanercept £44,111 4.514 £26,361b 0.070 0.693 0.931
Palliative Care £10,718 3.248 NA 0.930 0.306 0.060
Time horizon 40 years – Males
Infliximab £82,414 6.558 £84,473 a 0.000 0.041 0.159
Etanercept £58,178 6.271 £16,891 b
0.741 0.889 0.809
Palliative Care £17,355 3.854 NA 0.259 0.070 0.032
REBOUND EQUAL TO NATURAL HISTORY Probability cost-effective for threshold of:
Treatment Mean costs Mean QALYs ICER £20,000 £30,000 £40,000
Time horizon 10 years– Males
Infliximab £64,418 4.455 £205,345 a 0.000 0.000 0.005
Etanercept £44,169 4.356 £30,628 b
0.005 0.446 0.878
Palliative Care £10,679 3.263 NA 0.995 0.554 0.117
Time horizon 40 years - Males
Infliximab £83,085 5.485 £168,753 a 0.001 0.006 0.041
Etanercept £58,813 5.341 £27,805 b
0.043 0.587 0.854
Palliative Care £17,475 3.855 NA 0.956 0.407 0.105

Fig 4: Curva de coste-efectividad: Efecto rebote de la
enfermedad igual a la mejora experimentada; 10 años.
0
0.1
0.2
0.3
0.4
0.5
0.6
0.7
0.8
0.9
1
£0 £10,000 £20,000 £30,000 £40,000 £50,000 £60,000 £70,000 £80,000 £90,000 £100,000
Maximum WTP per QALY gained
Pro
ba
bil
ity
Co
st-
Eff
ec
tive
Infliximab
Etanercept
Palliative care
ICER= £26,361

Fig 5: Curva de coste-efectividad: Efecto rebote de la
enfermedad igual a la mejora experimentada; 40 años.
0
0.1
0.2
0.3
0.4
0.5
0.6
0.7
0.8
0.9
1
£0 £10,000 £20,000 £30,000 £40,000 £50,000 £60,000 £70,000 £80,000 £90,000 £100,000
Maximum WTP per QALY gained
Pro
ba
bil
ity
Co
st-
Eff
ec
tive
Infliximab
Etanercept
Palliative care
ICER= £16,891

Tabla 2. Proporción costes acumulados según diferentes
horizontes temporales (Caso base).
Nota: Resultados prácticamente idénticos para el escenario vuelta
a la historia natural.
Rebound equal to gain, males
010,00020,00030,00040,00050,00060,00070,00080,00090,000
Etanerc
ept-1
year
Inflix
imab
-1 ye
ar
Etane
rcep
t- 5
year
s
Inflix
imab
- 5 ye
ars
Etane
rcep
t- 10
years
Inflix
imab
- 10 y
ears
Etane
rcept-
40 ye
ars
Inflix
imab
- 40 y
ears
UK
co
sts
(£
2004)
Drug costs
Direct costs (HAQ)
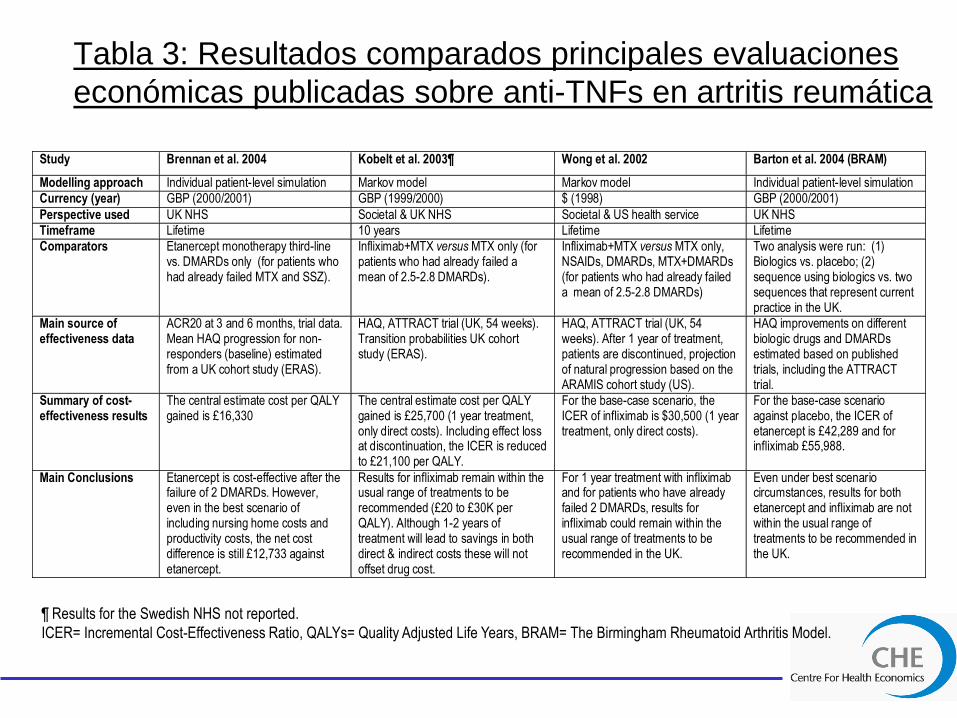
Tabla 3: Resultados comparados principales evaluaciones
económicas publicadas sobre anti-TNFs en artritis reumática
Study Brennan et al. 2004 Kobelt et al. 2003¶ Wong et al. 2002 Barton et al. 2004 (BRAM)
Modelling approach Individual patient-level simulation Markov model Markov model Individual patient-level simulation
Currency (year) GBP (2000/2001) GBP (1999/2000) $ (1998) GBP (2000/2001)
Perspective used UK NHS Societal & UK NHS Societal & US health service UK NHS
Timeframe Lifetime 10 years Lifetime Lifetime
Comparators Etanercept monotherapy third-line vs. DMARDs only (for patients who had already failed MTX and SSZ).
Infliximab+MTX versus MTX only (for patients who had already failed a mean of 2.5-2.8 DMARDs).
Infliximab+MTX versus MTX only, NSAIDs, DMARDs, MTX+DMARDs (for patients who had already failed a mean of 2.5-2.8 DMARDs)
Two analysis were run: (1) Biologics vs. placebo; (2) sequence using biologics vs. two sequences that represent current practice in the UK.
Main source of effectiveness data
ACR20 at 3 and 6 months, trial data. Mean HAQ progression for non-responders (baseline) estimated from a UK cohort study (ERAS).
HAQ, ATTRACT trial (UK, 54 weeks). Transition probabilities UK cohort study (ERAS).
HAQ, ATTRACT trial (UK, 54 weeks). After 1 year of treatment, patients are discontinued, projection of natural progression based on the ARAMIS cohort study (US).
HAQ improvements on different biologic drugs and DMARDs estimated based on published trials, including the ATTRACT trial.
Summary of cost-effectiveness results
The central estimate cost per QALY gained is £16,330
The central estimate cost per QALY gained is £25,700 (1 year treatment, only direct costs). Including effect loss at discontinuation, the ICER is reduced to £21,100 per QALY.
For the base-case scenario, the ICER of infliximab is $30,500 (1 year treatment, only direct costs).
For the base-case scenario against placebo, the ICER of etanercept is £42,289 and for infliximab £55,988.
Main Conclusions Etanercept is cost-effective after the failure of 2 DMARDs. However, even in the best scenario of including nursing home costs and productivity costs, the net cost difference is still £12,733 against etanercept.
Results for infliximab remain within the usual range of treatments to be recommended (£20 to £30K per QALY). Although 1-2 years of treatment will lead to savings in both direct & indirect costs these will not offset drug cost.
For 1 year treatment with infliximab and for patients who have already failed 2 DMARDs, results for infliximab could remain within the usual range of treatments to be recommended in the UK.
Even under best scenario circumstances, results for both etanercept and infliximab are not within the usual range of treatments to be recommended in the UK.
¶ Results for the Swedish NHS not reported.
ICER= Incremental Cost-Effectiveness Ratio, QALYs= Quality Adjusted Life Years, BRAM= The Birmingham Rheumatoid Arthritis Model.
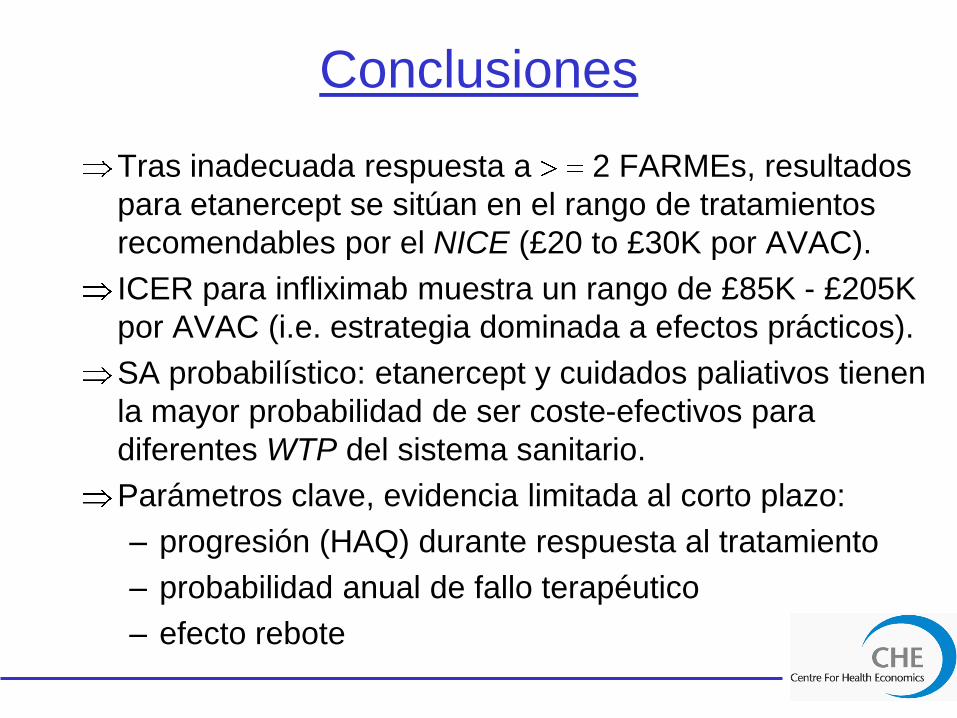
Conclusiones
Tras inadecuada respuesta a 2 FARMEs, resultados
para etanercept se sitúan en el rango de tratamientos
recomendables por el NICE (£20 to £30K por AVAC).
ICER para infliximab muestra un rango de £85K - £205K
por AVAC (i.e. estrategia dominada a efectos prácticos).
SA probabilístico: etanercept y cuidados paliativos tienen
la mayor probabilidad de ser coste-efectivos para
diferentes WTP del sistema sanitario.
Parámetros clave, evidencia limitada al corto plazo:
– progresión (HAQ) durante respuesta al tratamiento
– probabilidad anual de fallo terapéutico
– efecto rebote

Discusión
Primer estudio que compara ambos anti-TNF en términos
de coste-efectividad en AS, utilizando toda la evidencia
clinica disponible y el apoyo de expertos clinicos.
Resultados principales EE de anti-TNFs para AR: aunque
difieren en cierta medida (ensayos clínicos, supuestos),
sugieren pueden ser coste-efectivos administrados tras
inadecuada respuesta a 2 FARMEs
Limitaciones:
– falta evidencia LT
– parámetros clave basados en evidencia muy limitada
– daño radiográfico en AS avanzada (limitaciones HAQ)
– beneficio Soriasis (PASI)
Agradecimientos
Dr Nerys Woolacott and reviewers from the Centre for Reviews and Dissemination
(CRD), University of York.
Dr Robert Chalmers, Consultant Dermatologist, University of Manchester
Dr Ian Bruce, Senior Lecturer and Consultant Rheumatologist, University of
Manchester
Prof Tony Ades, MRC Health Services Research Collaboration, University of Bristol.
Project funded by the HTA Programme (04/04/01) commissioned on behalf of NICE.
The views and opinions expressed therein are those of the authors and do not
necessarily reflect those of the Department of Health.
Referencias
Spiegelhalter D, Abrams K, Mules J. (2004) Bayesian Approaches to Clinical Trials
and Health Care Evaluation. John Wiley & Sons, Ltd.
Mease PJ, Goffe BS, Metz J, VanderStoep A, Finck B, Burge DJ. Etanercept in the
treatment of psoriatic arthritis and psoriasis: a randomised trial. Lancet
2000;356:385-90.
Mease PJ, Kivitz AJ, Burch FX, Siegel EL, Cohen SB, Ory P, et al. Etanercept
treatment of psoriatic arthritis: safety, efficacy, and effect on disease progression.
Arthritis Rheum 2004;50:2264-72.
Centocor. A multicenter placebo-controlled, double-blind, randomised study of anti-
TNF chimeric monoclonal antibody (cA2, infliximab) in patients with active
psoriatic arthritis (IMPACT): protocol no. P02114 [Industry submission]. Malvern,
Pa.: Centocor; 2003 Nov 14.
Lu, G and Ades, A. Combination of direct and indirect evidence in mixed treatment
comparisons. Statistics in Medicine 2004; 23: 3105-3124.
Ades, T. A chain of evidence with mixed comparisons: models for multiparameter
synthesis and consistency of evidence. Statistics in Medicine 2003; 22: 2935-3016