Aluminium Site Presentation 08
24
Aluminium Investor Presentation Australia Analysts Site Visit 29 October 2008
Transcript of Aluminium Site Presentation 08
8/14/2019 Aluminium Site Presentation 08
http://slidepdf.com/reader/full/aluminium-site-presentation-08 1/24
Aluminium Investor Presentation
Australia Analysts Site Visit
29 October 2008

8/14/2019 Aluminium Site Presentation 08
http://slidepdf.com/reader/full/aluminium-site-presentation-08 2/24
Slide 2
Disclaimer By viewing this presentation you agree to be bound by the following conditions.Certain statements in this presentation are forward-looking statements (including statements regardingcontribution synergies, future cost savings, the cost and timingof development projects, future productionvolumes, increases in production and infrastructure capacity, the identification of additional mineral Reserves andResources and project lives and, without limitation, other statements typically containing words such as "intends,""expects," "anticipates," "targets," plans," "estimates" and words of similar import.) These statements are basedon current expectations and beliefs and numerous assumptions regarding BHP Billiton's present and futurebusiness strategies and the environments in which BHP Billiton will operate in the future and such assumptions,expectations and beliefs may or may not prove to be correct and by their nature, are subject to a number of known and unknown risks and uncertainties that could cause actual results, performance and achievements todiffer materially.Save as required by law or the rules of the UK Listing Authority and the London Stock Exchange, the UKTakeover Panel, or the listing rules of ASX Limited, BHP Billiton undertakes no duty to update any forward-looking statements in this presentation.No statement concerning expected cost savings, revenue benefits (and resulting incremental EBITDA) and EPSaccretion in this presentation should be interpreted to mean that the future earnings per share of the enlargedBHP Billiton group for current and future financial years will necessarily match or exceed the historical or published earnings per share of BHP Billiton, and the actual estimated cost savings and revenue benefits (and
resulting EBITDA enhancement) may be materially greater or less than estimated.BHP Billiton results are reported under International Financial Reporting Standards (IFRS). References toUnderlying EBIT and Underlying EBITDA exclude any exceptional items. A reconciliation to profit fromoperations is contained within the profit announcementReferences in this presentation to “$” are to United States dollars unless otherwise specified.
8/14/2019 Aluminium Site Presentation 08
http://slidepdf.com/reader/full/aluminium-site-presentation-08 3/24
Slide 3
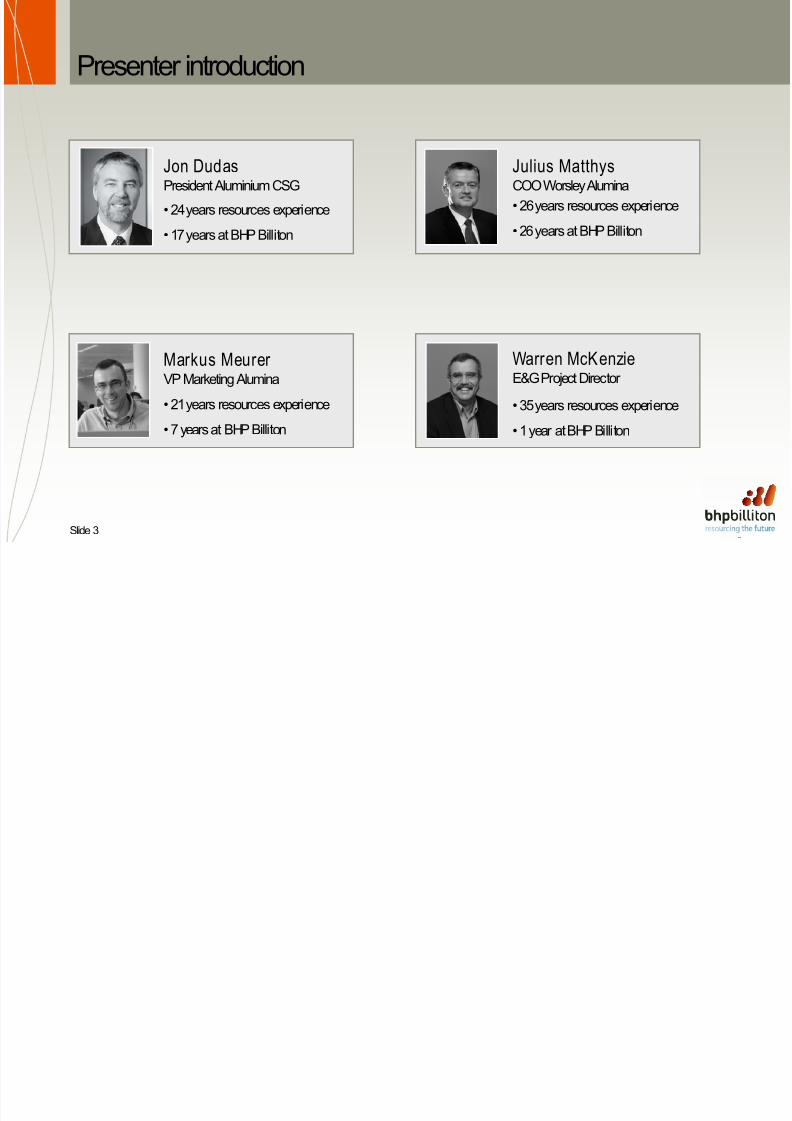
Presenter introduction
Jon Dudas
President Aluminium CSG
Julius Matthys
COO Worsley Alumina
Markus Meurer VP Marketing Alumina
• 24 years resources experience
• 17 years at BHP Billiton
• 26 years resources experience
• 26 years at BHP Billiton
• 21 years resources experience
• 7 years at BHP Billiton
Warren McKenzieE&G Project Director • 35 years resources experience
• 1 year at BHP Billiton
8/14/2019 Aluminium Site Presentation 08
http://slidepdf.com/reader/full/aluminium-site-presentation-08 4/24
8/14/2019 Aluminium Site Presentation 08
http://slidepdf.com/reader/full/aluminium-site-presentation-08 5/24Slide 5
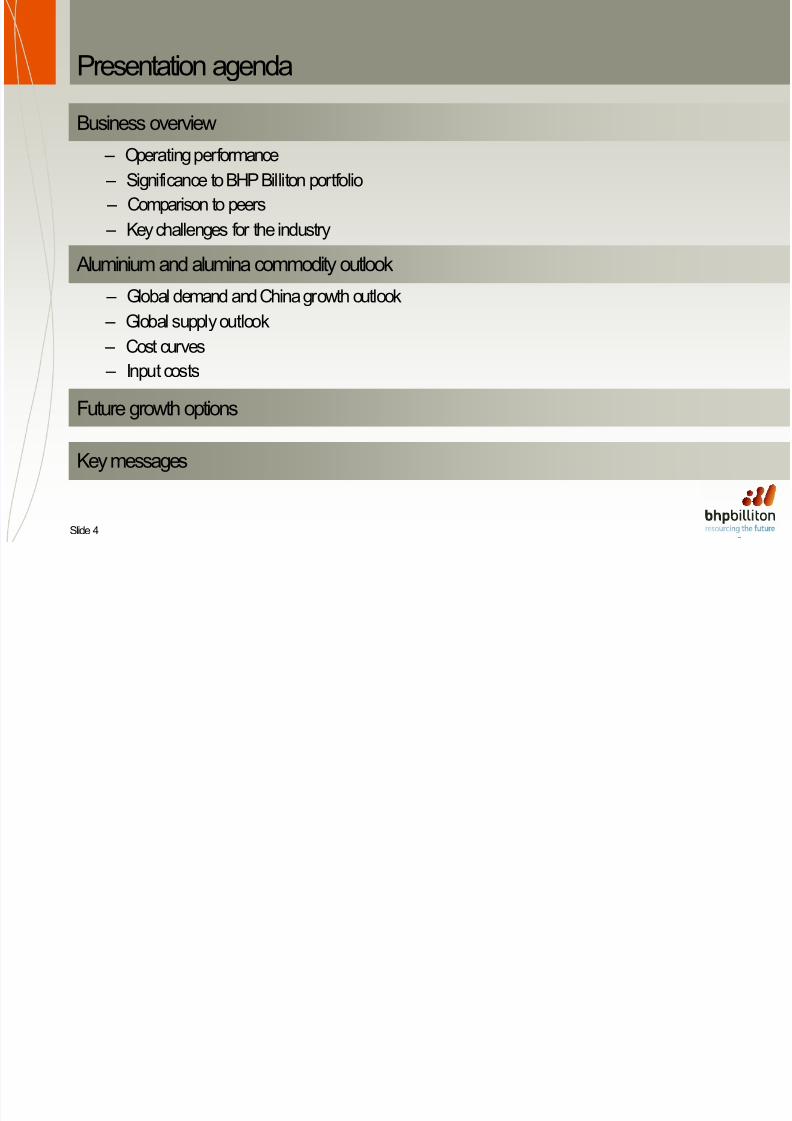
Aluminium investor presentation
Business overview – Operating performance – Significance to BHP Billiton portfolio – Comparison to peers – Key challenges for the industry
Aluminium and alumina commodity outlook – Global demand and China growth outlook – Global supply outlook – Cost curves – Input costs
Future growth options
Key messages
8/14/2019 Aluminium Site Presentation 08
http://slidepdf.com/reader/full/aluminium-site-presentation-08 6/24Slide 6
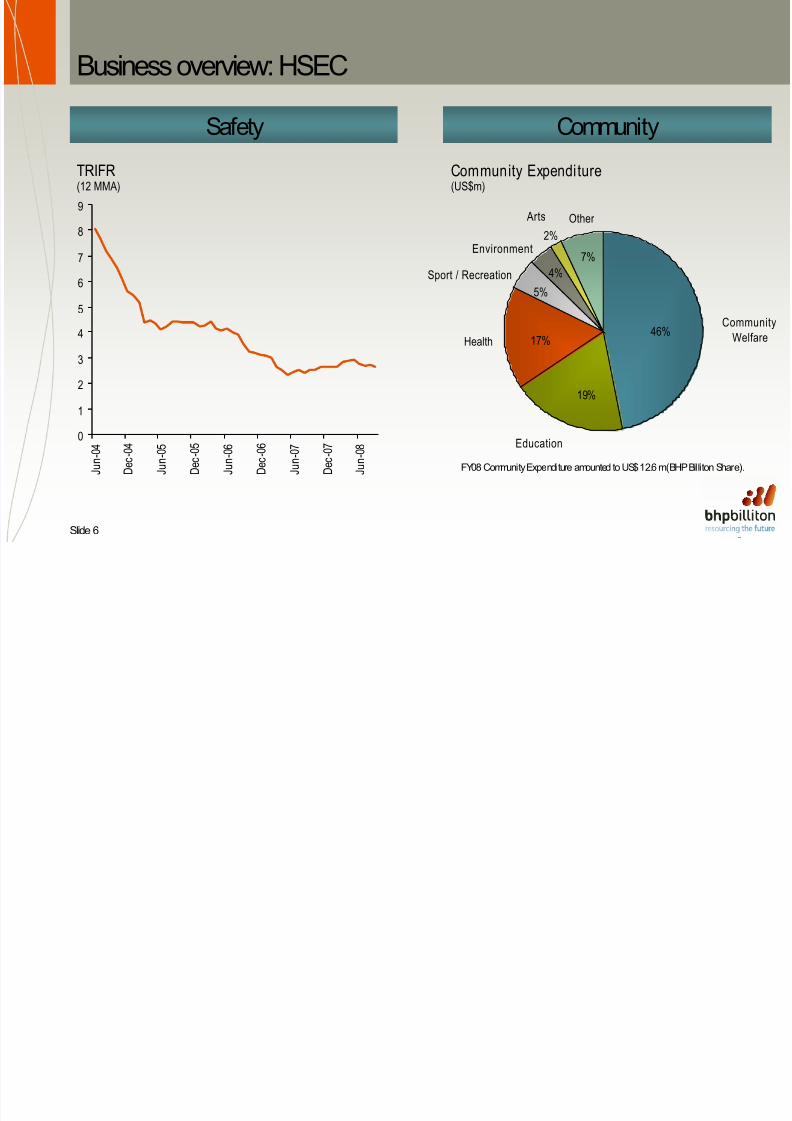
Business overview: HSEC
Safety Community
FY08 Community Expenditure amounted to US$ 12.6 m(BHP Billiton Share).
TRIFR(12 MMA)
Community Expenditure(US$m)
7%
2%
4%
5%
17%
19%
46%Communi
Welfare
Education
Health
Other
Sport / Recreation
Environment
Arts
0
1
2
3
4
5
6
7
8
9
J u n - 0
4
D e c - 0
4
J u n - 0
5
D e c - 0
5
J u n - 0
6
D e c - 0
6
J u n - 0
7
D e c - 0
7
J u n - 0
8
8/14/2019 Aluminium Site Presentation 08
http://slidepdf.com/reader/full/aluminium-site-presentation-08 7/24Slide 7
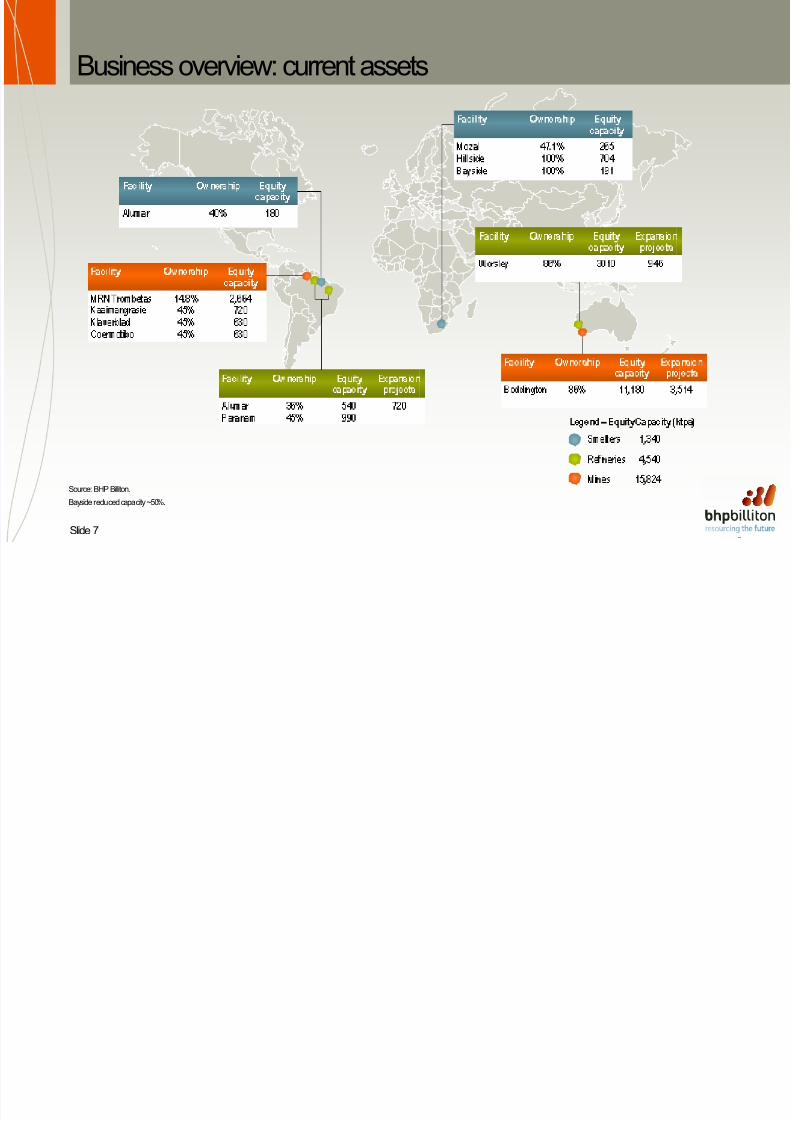
Business overview: current assets
Source: BHP Billiton.
Bayside reduced capacity ~50%.

8/14/2019 Aluminium Site Presentation 08
http://slidepdf.com/reader/full/aluminium-site-presentation-08 8/24Slide 8
0
10
20
30
40
50
20 04 2005 2006 2 007 200 8
Peers BHP Billiton
Business overview: operating performance
• Record alumina production
• South African power situation will continue toimpact metal production• Worsley E&G approved
-21.11,8561,465 Aluminium EBIT
% Change20072008Year ended June (US$m)
Source: BHP Billiton and companies’ annual and half year reports Excludes Third Party Trading* Peers include AWAC, Chalco and the aluminiumsegments Rio Tinto, Valeand the upstreamsegments of Alcoa and Alcan (until June 2007).
EBIT Margin(%)
Year Ended June

8/14/2019 Aluminium Site Presentation 08
http://slidepdf.com/reader/full/aluminium-site-presentation-08 9/24Slide 9
Business overview : contribution to group
Underlying EBIT Margin(a)
(FY2008)
(a) EBIT Margin excludes third party trading activities.
67%
30%
31%
62%
20%
25%
24%
48%
51%
58%
Underlying EBIT(FY2008, US$bn)
0
5
10
15
20
25
Iron Ore
Manganese
Energ y Coal
Metallurgical Coal
Diamonds andSpecialty Products
Base Metals
Petroleum
Stainless Steel Materials
Aluminium
Iron Ore
Manganese
Energ y Coal
Metallurgical Coal
Diamonds andSpecialty Products
Base Metals
Petroleum
Stainless St eelMaterials
Aluminium
Group
(Our portfolio is diversified and balanced across high margin commodities)
Energy(27%)
Non Ferrous(44%)
SteelmakingMaterials(29%)

8/14/2019 Aluminium Site Presentation 08
http://slidepdf.com/reader/full/aluminium-site-presentation-08 10/24Slide 10
Business overview: key challenges• Raw material price pressures
• Global power supply
• Bringing on new capacity• Quality of Chinese bauxite
8/14/2019 Aluminium Site Presentation 08
http://slidepdf.com/reader/full/aluminium-site-presentation-08 11/24
Slide 11
Aluminium investor presentation
Business overview – Operating performance – Significance to BHP Billiton portfolio – Comparison to peers – Key challenges for the industry
Aluminium and alumina commodity outlook – Global demand and China growth outlook – Global supply outlook – Cost curves
Future growth options
Key messages

8/14/2019 Aluminium Site Presentation 08
http://slidepdf.com/reader/full/aluminium-site-presentation-08 12/24
Slide 12
Aluminium and alumina commodity outlookKey China Messages
• China has a significant influence on the Aluminium market
– Aluminium is required to supply the intensive urbanisation of China – A question of self sufficiency of aluminium supply – Is power a constraining factor? – Domestic aluminium supply is positioned high on the cost curve
• Short on quality bauxite and thus alumina – Domestic alumina additions are positioned high on the cost curve
8/14/2019 Aluminium Site Presentation 08
http://slidepdf.com/reader/full/aluminium-site-presentation-08 13/24
Slide 13
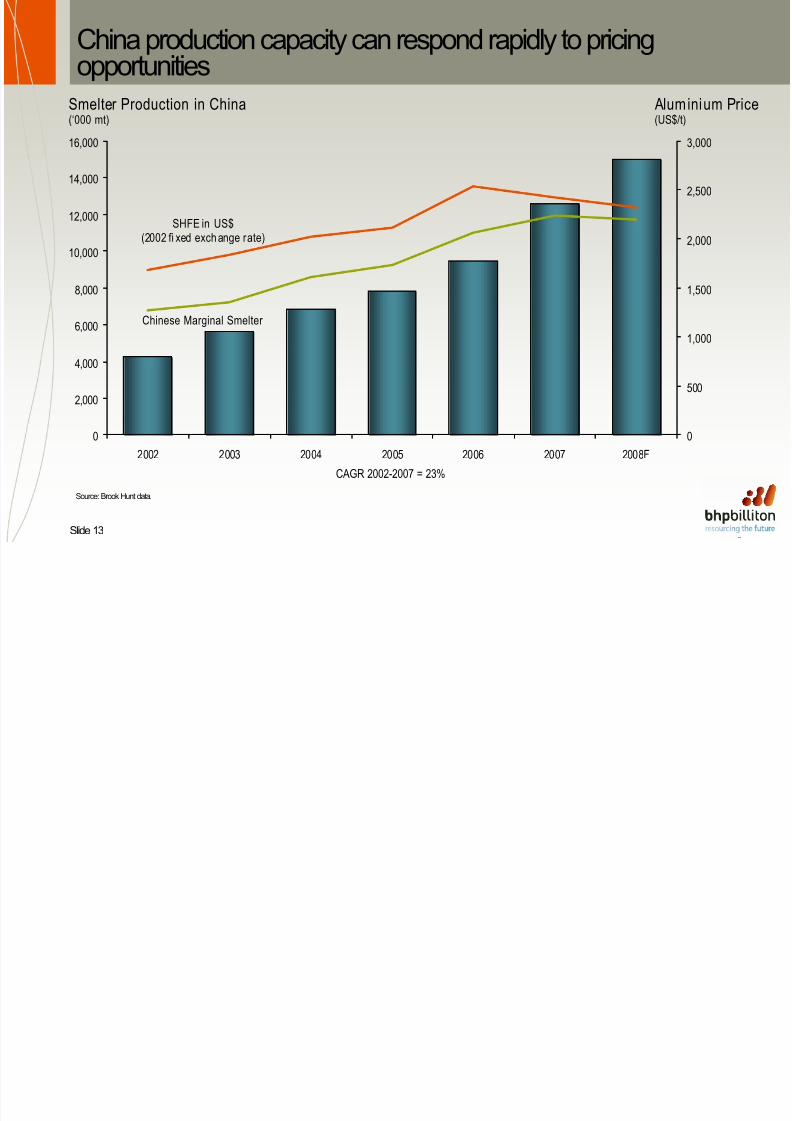
China production capacity can respond rapidly to pricingopportunities
Source: Brook Hunt data.
Smelter Production in China(‘000 mt)
Aluminium Price(US$/t)
0
2,000
4,000
6,000
8,000
10,000
12,000
14,000
16,000
2002 2003 2004 2005 2006 2007 2008F
0
500
1,000
1,500
2,000
2,500
3,000
SHFE in US$(2002 fi xed exchange rate)
Chinese Marginal Smelter
CAGR 2002-2007 = 23%
8/14/2019 Aluminium Site Presentation 08
http://slidepdf.com/reader/full/aluminium-site-presentation-08 14/24
Slide 14
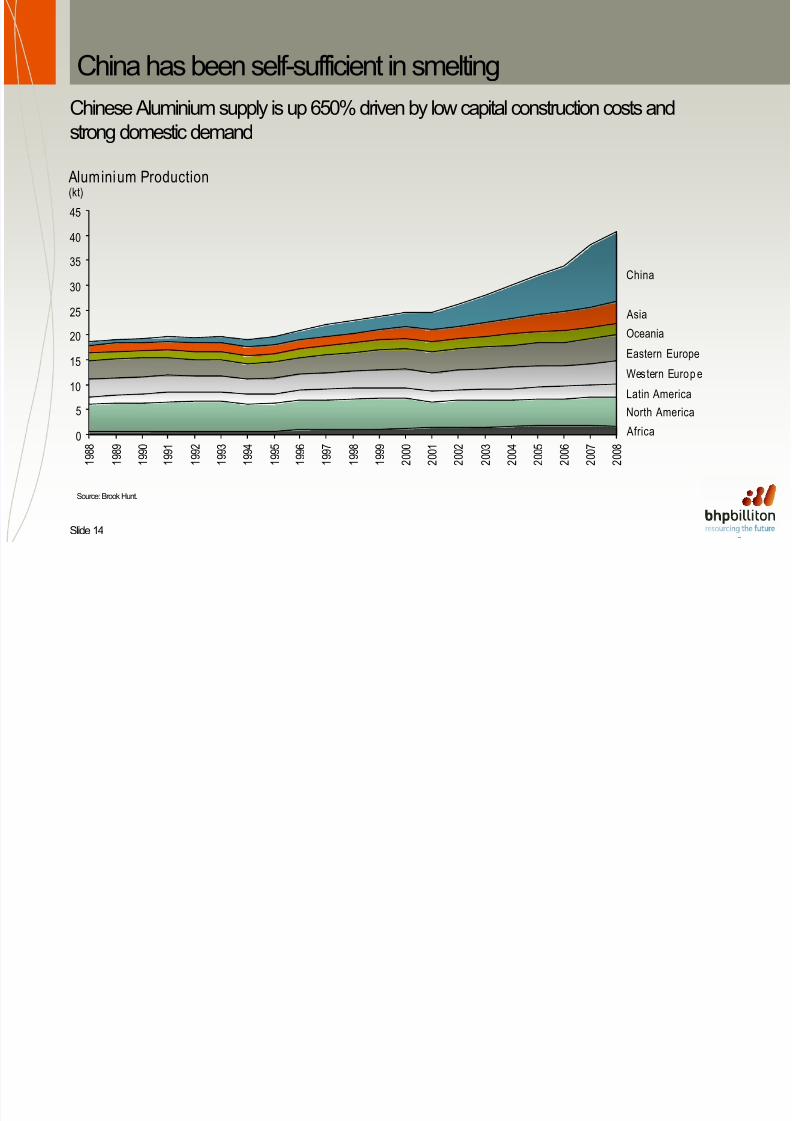
China has been self-sufficient in smeltingChinese Aluminium supply is up 650% driven by low capital construction costs andstrong domestic demand
Aluminium Production(kt)
China
AsiaOceania
Eastern Europe
Western Europ e
Latin AmericaNorth America Africa
Source: Brook Hunt.
0
5
10
15
20
2530
35
40
45
1 9 8 8
1 9 8 9
1 9 9 0
1 9 9 1
1 9 9 2
1 9 9 3
1 9 9 4
1 9 9 5
1 9 9 6
1 9 9 7
1 9 9 8
1 9 9 9
2 0 0 0
2 0 0 1
2 0 0 2
2 0 0 3
2 0 0 4
2 0 0 5
2 0 0 6
2 0 0 7
2 0 0 8
8/14/2019 Aluminium Site Presentation 08
http://slidepdf.com/reader/full/aluminium-site-presentation-08 15/24
Slide 15
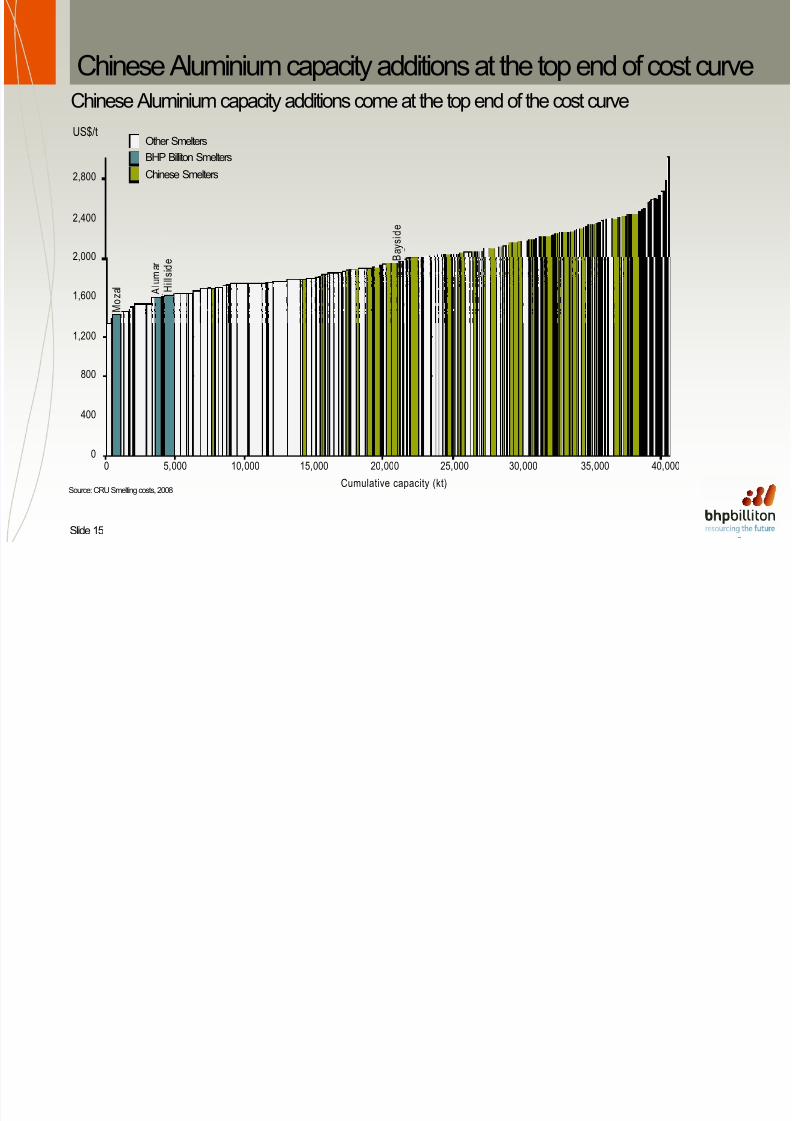
Chinese SmeltersBHP Billiton SmeltersOther Smelters
2,800
2,400
2,000
1,600
1,200
800
400
00 5,000 10,000 15,000 20,000 25,000 30,000 35,000 40,000
A l u m a r B
a y s i d e
H i l l s i d e
M o z a l
Chinese Aluminium capacity additions at the top end of cost curveChinese Aluminium capacity additions come at the top end of the cost curve
Source: CRU Smelting costs, 2008
US$/t
Cumulative capacity (kt)

8/14/2019 Aluminium Site Presentation 08
http://slidepdf.com/reader/full/aluminium-site-presentation-08 16/24
Slide 16
China has a track record of bringing on new power capacityAbility to bring on new power capacity on time as plannedSources of Chinese power (GW)
Wind / Other Nuclear
Hydro
Coal
Source: CEC.
0
150
300
450
600
750
1998 1999 2000 2001 2002 2003 2004 2005 2006 2007

8/14/2019 Aluminium Site Presentation 08
http://slidepdf.com/reader/full/aluminium-site-presentation-08 17/24
Slide 17
Aluminium stocks
Source: LME, SHFE and Comex.
Exchange Stocks(kt)
LME Cash pric($/t Nominal)
0
200
400
600
800
1,000
1,200
1,400
1,600
1,800
J a n - 0
4
A p r - 0 4
J u l - 0 4
O c t - 0 4
J a n - 0
5
A p r - 0 5
J u l - 0 5
O c t - 0 5
J a n - 0
6
A p r - 0
6
J u l - 0 6
O c t - 0 6
J a n - 0
7
A p r - 0 7
J u l - 0 7
O c t - 0 7
J a n - 0
8
A p r - 0
8
J u l - 0 8
O c t - 0 8
0
500
1,000
1,500
2,000
2,500
3,000
3,500Comex
SHFE
LME
LME Cash (RH)

8/14/2019 Aluminium Site Presentation 08
http://slidepdf.com/reader/full/aluminium-site-presentation-08 18/24
Slide 18
Chinese demand for imported Alumina and Bauxite
Source: BHP Billiton Internal Analysis, Chinese customs data, CNIA.
Alumina(kt)
0
5,000
10,000
15,000
20,000
25,000
30,000
1996 1997 1998 1999 2000 2001 2002 2003 2004 2005 2006 2007 2008YTD
Domestic Alumina Productio
Chinese Bauxite
Domestic Alumina ProductioImported Bauxit e Ore
Alumina Imports
8/14/2019 Aluminium Site Presentation 08
http://slidepdf.com/reader/full/aluminium-site-presentation-08 19/24
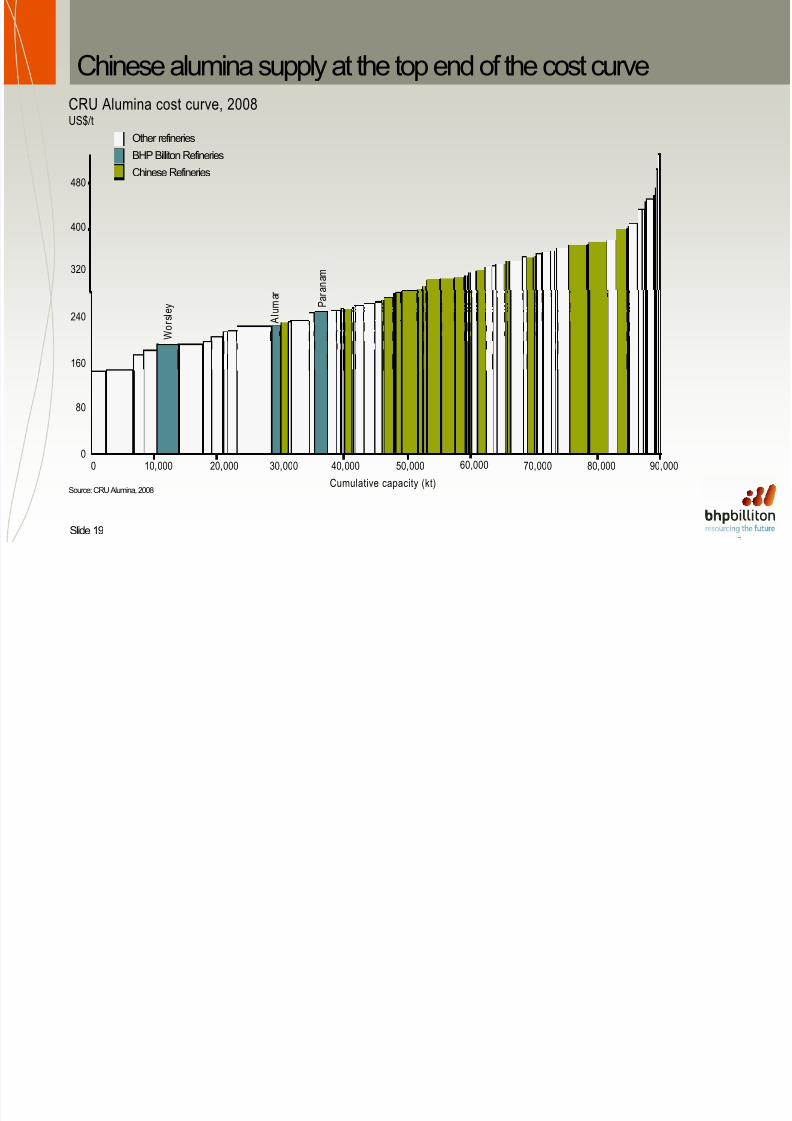
Slide 19
Chinese alumina supply at the top end of the cost curveCRU Alumina cost curve, 2008US$/t
Source: CRU Alumina, 2008 Cumulative capacity (kt)
BHP Billiton RefineriesChinese Refineries
Other refineries
0 10,000 20,000 30,000 40,000 50,000 60,000 70,000 80,000 90,000
480
400
320
240
160
80
0
A l u m a r
P a r a n a m
W o r s l e y
8/14/2019 Aluminium Site Presentation 08
http://slidepdf.com/reader/full/aluminium-site-presentation-08 20/24
Slide 20
Aluminium investor presentation
Business overview – Operating performance – Significance to BHP Billiton portfolio – Comparison to peers – Key challenges for the industry
Aluminium and alumina commodity outlook
– Global demand and China growth outlook – Global supply outlook – Cost curves – Input costs
Future growth options
Key messages
8/14/2019 Aluminium Site Presentation 08
http://slidepdf.com/reader/full/aluminium-site-presentation-08 21/24
Slide 21
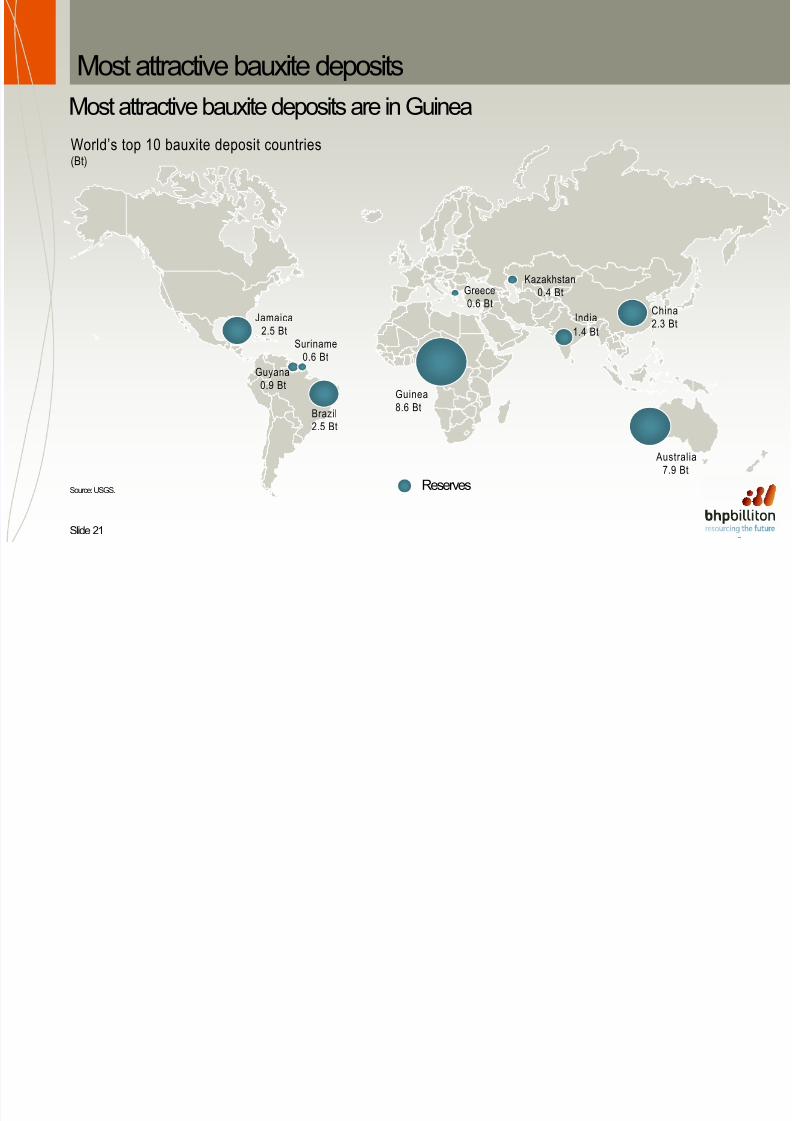
World’s top 10 bauxite deposit countries(Bt)
Reserves
Most attractive bauxite depositsMost attractive bauxite deposits are in Guinea
Guinea8.6 Bt
Australia7.9 Bt
Brazil2.5 Bt
India1.4 Bt
China2.3 BtJamaica
2.5 Bt
Greece0.6 Bt
Suriname0.6 Bt
Kazakhstan0.4 Bt
Guyana
0.9 Bt
Source: USGS.

8/14/2019 Aluminium Site Presentation 08
http://slidepdf.com/reader/full/aluminium-site-presentation-08 22/24
Slide 22
Guinea projectGuinea• Long life, world class bauxite
resource with embedded options
• Strong government support
• Currently finalising feasibility study
• Greenfield projects are morechallenging in new geographies

8/14/2019 Aluminium Site Presentation 08
http://slidepdf.com/reader/full/aluminium-site-presentation-08 23/24
Slide 23
Aluminium investor presentation
Business overview – Operating performance – Significance to BHP Billiton portfolio – Comparison to peers – Key challenges for the industry
Aluminium and alumina commodity outlook
– Global demand and China growth outlook – Global supply outlook (The key constraints) – Cost curves – Input costs
Growth profile and capital projects
Key messages

8/14/2019 Aluminium Site Presentation 08
http://slidepdf.com/reader/full/aluminium-site-presentation-08 24/24