A Global Urban Risk Index - World Bank
44
Policy Research Working Paper 6506 A Global Urban Risk Index Henrike Brecht Uwe Deichmann Hyoung Gun Wang e World Bank East Asia and Pacific Region Development Research Group Urban and Disaster Risk Management Department June 2013 WPS6506 Public Disclosure Authorized Public Disclosure Authorized Public Disclosure Authorized Public Disclosure Authorized Public Disclosure Authorized Public Disclosure Authorized Public Disclosure Authorized Public Disclosure Authorized
Transcript of A Global Urban Risk Index - World Bank

Policy Research Working Paper 6506
A Global Urban Risk IndexHenrike Brecht
Uwe Deichmann Hyoung Gun Wang
The World BankEast Asia and Pacific RegionDevelopment Research GroupUrban and Disaster Risk Management DepartmentJune 2013
WPS6506P
ublic
Dis
clos
ure
Aut
horiz
edP
ublic
Dis
clos
ure
Aut
horiz
edP
ublic
Dis
clos
ure
Aut
horiz
edP
ublic
Dis
clos
ure
Aut
horiz
edP
ublic
Dis
clos
ure
Aut
horiz
edP
ublic
Dis
clos
ure
Aut
horiz
edP
ublic
Dis
clos
ure
Aut
horiz
edP
ublic
Dis
clos
ure
Aut
horiz
ed

Produced by the Research Support Team
Abstract
The Policy Research Working Paper Series disseminates the findings of work in progress to encourage the exchange of ideas about development issues. An objective of the series is to get the findings out quickly, even if the presentations are less than fully polished. The papers carry the names of the authors and should be cited accordingly. The findings, interpretations, and conclusions expressed in this paper are entirely those of the authors. They do not necessarily represent the views of the International Bank for Reconstruction and Development/World Bank and its affiliated organizations, or those of the Executive Directors of the World Bank or the governments they represent.
Policy Research Working Paper 6506
Which cities have the highest risk of human and economic losses due to natural hazards? And how will urban exposure to major hazards change over the coming decades? This paper develops a global urban disaster risk index that evaluates the mortality and economic risks from disasters in 1,943 cities in developing countries. Concentrations of population, infrastructure, and economic activities in cities contribute to increased exposure and susceptibility to natural hazards. The three components of this risk measure are urban hazard characteristics, exposure, and vulnerability. For
This paper is a product of the Urban and Disaster Risk Management Unit; East Asia and Pacific Region; the Environment and Energy Team, Development Research Group; and the Urban and Disaster Risk Management Department. It is part of a larger effort by the World Bank to provide open access to its research and make a contribution to development policy discussions around the world. Policy Research Working Papers are also posted on the Web at http://econ.worldbank.org. The authors may be contacted at [email protected], [email protected], and [email protected].
earthquakes, cyclones, floods, and landslides, single hazard risk indices are developed. In addition, a multi-hazard index gives a holistic picture of current city risk. Demographic-economic projection of city population growth to 2050 suggests that exposure to earthquake and cyclone risk in developing country cities will more than double from today’s levels. Global urban risk analysis, as presented in this paper, can inform the prioritization of resources for disaster risk management and urban planning and promote the shift toward managing risks rather than emergencies.
A Global Urban Risk Index
Henrike Brecht, Uwe Deichmann and Hyoung Gun Wang
JEL Codes: O18, R11 Keywords: natural hazards, urban risk, urban population projections Sectors: Urban, Disaster risk management

2
A Global Urban Risk Index
Henrike Brecht, Uwe Deichmann and Hyoung Gun Wang1
1 Introduction
The potential for losses from natural hazards is particularly high in urban areas. 1.5% of the world’s land
is estimated to produce 50% of worldwide Gross Domestic Product (GDP). The same area accommodates
about one-sixth of the world’s population (World Bank 2009). Concentrations of population, industry,
infrastructure, and economic activities in cities contribute to increased exposure and susceptibility to
natural hazards. In fact, the ongoing process of urbanization is one of the main reasons for the staggering
increase in disaster death tolls and economic losses over the past decades (e.g., Quarantelli 1996, Wisner
2003, Pelling 2003, Lall and Deichmann 2012).
The impacts of disasters are on the rise. Statistics show that, even when adjusted for inflation, the losses
caused by natural catastrophes have been rising at an increasing pace since 1950, even when considering
improvements in record keeping over time that could bias such comparisons. In the period between 1990
and 1999 the costs of disasters in constant dollars were more than 15 times higher than during the period
1950-59 (World Bank 2006). The number of people affected by natural hazards each year nearly
quadrupled from 1975-84 to 1996-2005 (EM-DAT 2007). Several factors contribute to this increase, for
example land use changes, social inequalities, subsidence, and environmental degradation (e.g., Smith
2012, Mileti 1999, Blaikie et al. 1994). Studies suggest that climate change has not significantly
1 The authors are respectively in the East Asia and Pacific Region, the Development Research Group, and the Urban and Resilience Management Unit of the World Bank, 1818 H Street, NW, Washington, DC, 20433, USA (Email: [email protected], [email protected], [email protected]). The research presented in this paper received support from the Global Facility for Disaster Reduction and Recovery (GFDRR). The authors thank Saroj Kumar Jha, Apurva Sanghi, Francis Ghesquiere, and Brian Blankespoor for helpful discussions and support. The findings, interpretations, and conclusions expressed in this paper are entirely those of the authors. They do not necessarily represent the views of the International Bank for Reconstruction and Development/World Bank and its affiliated organizations, or those of the Executive Directors of the World Bank or the governments they represent.

3
contributed to this increase (e.g., Bouwer, 2011; Neumayer and Barthel, 2010; IPCC, 2012). The main
driver of risk is population pressure and economic growth in vulnerable locations, for example, in coastal
areas susceptible to cyclones. The world’s low lying coastal elevation zone covers 2% of the world’s land
area but contains 10% of the world’s population (McGranahan et al. 2007). In the last 30 years, global
population living in flood plains increased by 114% and in cyclone prone coastlines by 192% (UN-ISDR,
2011). Due to the global urbanization process, cities are becoming increasingly predestined for risks.
Estimates by the United Nations suggest that over 50% of the world’s population already lives in urban
areas (UN 2008). Cities are predicted to absorb most of the future growth in the world population: the UN
estimates that the urban population share will rise to 70% by 2050 (UN Population Division 2012). Cities
in East Asia, for instance, absorb two million new urban residents every month (Gill and Kharas 2007)
and are projected to triple their built up areas in the coming two decades (Angel et al. 2005).
While natural hazards and ongoing urbanization are inevitable, disaster losses can be minimized through
adequate disaster risk management. Reducing risks ex-ante through risk assessments, land use planning,
building codes, early warning systems, adequate watershed management, and contingency planning leads
to significantly reduced disaster impacts. The earthquake in Chile in March 2010 was one of the ten most
powerful earthquakes recorded in the last century. It released 500 times more energy than the earthquake
that struck Haiti in January 2010. Yet, only 521 people died in Chile, whereas Port-au-Prince was
catastrophically affected with tens of thousands of deaths. The main reason for this difference is that
buildings in Chile are built to codes and are regularly inspected whereas Haiti effectively has no building
codes.
Because of the enormous loss potential that has developed and is expanding in the narrowest of urban
space, disaster risk reduction efforts need to be intensified in cities. Human losses associated with natural
disasters and economic damages relative to the size of the economy are larger the poorer a country is
(Skidmore and Toya 2007). Almost 80% of deaths from disasters in the first decade of this century were
in developing nations (Zakour and Gillespie 2013) and economic losses are 20 times greater as a

4
percentage of GDP in developing countries than in developed ones (World Bank 2006, ). To secure steady
advances towards poverty alleviation and economic growth in the developing world, suitable risk
reduction strategies must be developed and mainstreamed into urban planning and development
strategies. Otherwise, years of development and accumulated wealth are repeatedly destroyed and eroded
through repeated disasters.
Given the intrinsic high loss potential from natural hazards in urban areas, it comes as a surprise that
relatively little is known about global patterns of vulnerability and risk potential of cities. Which cities are
likely to be affected by a disaster? Which cities have the highest risk of mortality due to disasters? Which
cities are most at risk of economic losses due to natural hazards? And which of the world’s regions will
experience the largest increase in urban hazard risk? Efforts to assess urban risks so far have mainly
focused on single cities, identifying inner-city hotspots. But a comprehensive ranking of the global cities’
risk to guide priorities in building resilience has been lacking. Building on complementary country level
risk assessments, this study creates a disaster risk ranking of large cities in the less developed world. Risk
levels of 1,943 cities in 110 countries are evaluated and compared. The five following features
characterize the analysis in this paper:
• Risks are assessed for urban agglomerations with more than 100,000 inhabitants.
• For each city, mortality risk and economic risk are calculated by taking into account three
components of risks: hazard, exposure, and vulnerability.
• The loss potentials are expressed in relative levels.
• Four major natural hazards, namely earthquakes, cyclones, floods, and slides are considered in
this study. Urban risks are identified for each of these hazards separately. In addition, a multi-
hazard index gives a holistic picture of city risk.
• Expected urban risk exposure to earthquakes and cyclones in the year 2050 is determined using a
demographic-economic projection model.

5
By disclosing risks to cities, the results presented here can raise awareness, inform resource planning,
inspire further research, particularly at local levels, and promote the shift towards managing risks rather
than emergencies.
2 Background
The assessment of risk is highlighted as a central activity in defining priorities and building resilience in
the Hyogo Framework for Action 2005-2015 (UN-ISDR 2005), signed by 168 nations and international
organizations at the 2005 World Conference on Disaster Reduction. Risk identification supports a wide
range of decision-making processes for different actors on how risk should be managed from the public to
the private sector (e.g., Hsu et al. 2012, Cutter and Finch 2008, Fuessel 2007). Quantifying risk and
estimating future losses are not only the first steps in any disaster risk reduction program; the resulting
scenarios of a risk assessment are increasingly incorporated into sustainable development approaches in
different sectors in order to climate- and disaster-proof investments. Once the severity and geographical
extent of risks have been assessed and the drivers of risk are better understood, appropriate and cost-
effective countermeasures can be systematically identified and implemented. Depending on the scale, risk
assessments support multiple applications, for example, urban planning, investment prioritization, land
use planning, building codes, and disaster risk financing solutions.
A range of perspectives on risk assessments and indices has emerged, ranging from quantitative
calculations on losses to qualitative analysis capturing also intangible impacts. Interesting initiatives have
developed mainly at national level but a few have also been completed at global as well as urban scale.
Global level: Two main risk assessment initiatives have been undertaken with the goal of identifying
multi-hazard risk worldwide on the basis of grid cells with sub-national extent. First, the Global Disaster
Hotspots, developed by the World Bank and Columbia University (Dilley et al. 2005, Lerner-Lam 2007)
produced detailed geospatial data on risks of mortality and economic losses for six major natural hazards.
6
The results enabled a global assessment of risk levels and the identification of areas where the potential
for disaster impacts is large. Second, the Global Assessment Report 2009 (UN-ISDR 2009) is a multiple
agencies effort that developed the Global Disaster Hotspots further by using enhanced modeling
techniques and improved data layers. An update of this 2009 global risk analysis was released in the
Global Assessment Report 2011 (UN-ISDR 2011).
National level: An example of a comprehensive multi-hazard risk index that assigns overall risk values on
a national level is the Disaster Risk Index (DRI) (Peduzzi et al. 2009). The DRI calculates three factors on
a national resolution for 200 countries: risk of mortality, the relative vulnerability of each hazard type,
and the physical exposures of populations to hazard. Another example for a risk assessment on national
scale, covering a multitude of countries, is the study by McGranahan et al. (2007), which ranks countries
according to their population shares in the low elevation coastal zones.
Urban level: With the rise of megacities, risk assessments have increasingly taken place at the city-level,
identifying inner-city areas of high risks and loss potential (e.g., World Bank 2010b). However, only a
few limited initiatives exist which assess the overall risk of numerous cities in the form of an index to
compare and rank cities with each other. Efforts in this area to date have been confined to relatively
limited sets of locations and hazards. The Munich Reinsurance Group developed the Natural Hazard
Index for Megacities for 50 cities with high global economic significance (Munich Re 2005). The index
has an economic emphasis and is geared towards the risk of material losses which is suitable from an
insurance perspective. Hanson et al. (2011) ranked 136 port cities around the world that have more than
one million inhabitants. The study examines the risks of coastal areas due to storm surge and high winds,
taking into account predictions of climate change, subsidence, and population growth. Brecht et al. (2012)
determined the impact of sea level rise and intensified storm surges in developing countries and highlight
the major cities worldwide that are located in storm-surge zones. Furthermore, methodologies have been
developed that propose indicators to estimate the overall risk of cities. Indicators include, for example,
population density or number of hospital beds (e.g., Davidson 1997, Cardona 2005). These methodologies
7
have been applied for risk identification in only a handful of cities, since data availability of the indicators
at the city level hampers the implementation of them on a broader scale.
3 Motivation
Why is a global urban risk index useful? First, an index combines a set of indicators, which are derived
from extensive datasets. It aggregates information and summarizes a body of knowledge from a wide
range of disciplines. It filters information for the reader and translates research into easy to understand
results. This makes indices appealing tools.
Second, a global urban risk index enables the comparison of risk levels in cities in a self-explanatory
manner. As the international development community gradually shifts from financing post-disaster relief
towards financing disaster prevention (see for example, Ashdown 2011), a global risk index gives
reference points for investment decisions. It yields the basis for decisions on where funding for disaster
risk reduction should be allocated. It allows comparability and the prioritization of programs in areas
where hazard risk is greatest and where investment benefits are maximized. Cutter (2001) stresses that
geographic comparisons across regions with a systematic approach in methodologies and data are crucial
to prioritize risk reduction strategies or poverty reduction goals. Yet, disaster research has usually
gravitated toward group or community studies as opposed to large-scale projects (Tierney 2002).
Third, an index facilitates comparisons over time. It can update on the progress in making cities more
resilient and points to persistent long-term urban hotspots in which integration of risk reduction in urban
planning needs to be prioritized.
4 Methodology
Risk expresses the possibility of future disaster, that is the possibility that a hazardous event will happen
and that exposed and susceptible elements are in the way. It is defined as the probable value of losses that
8
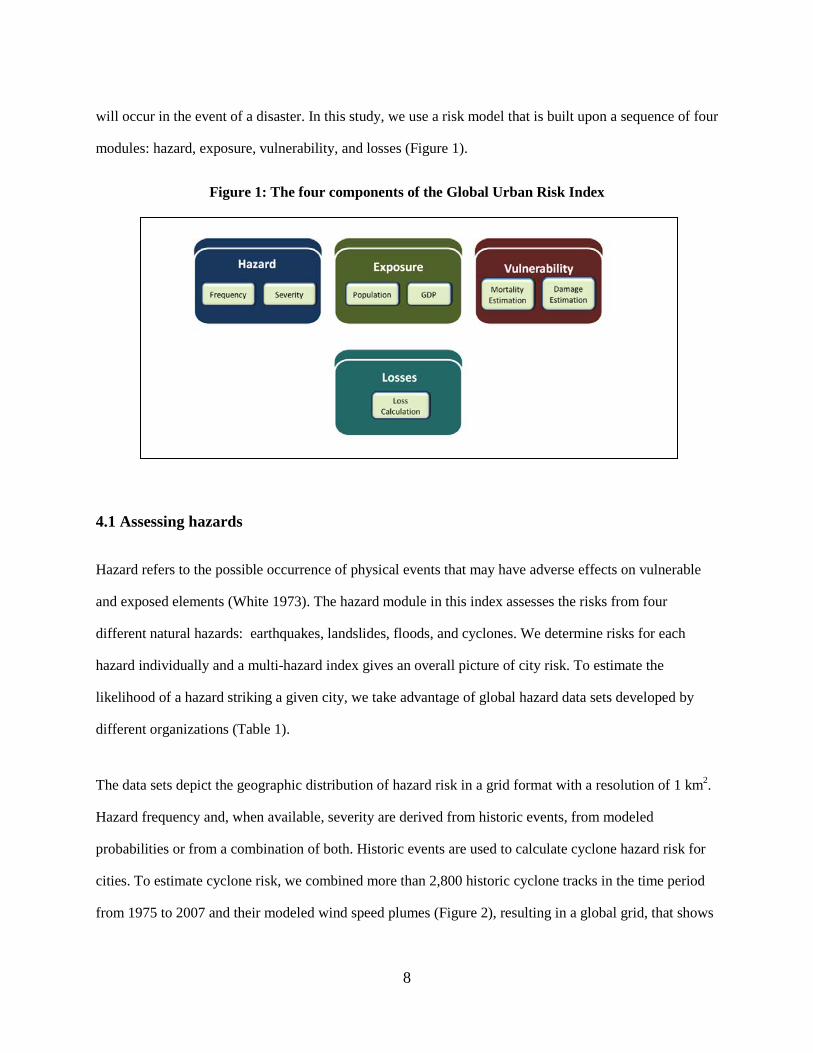
will occur in the event of a disaster. In this study, we use a risk model that is built upon a sequence of four
modules: hazard, exposure, vulnerability, and losses (Figure 1).
Figure 1: The four components of the Global Urban Risk Index
4.1 Assessing hazards
Hazard refers to the possible occurrence of physical events that may have adverse effects on vulnerable
and exposed elements (White 1973). The hazard module in this index assesses the risks from four
different natural hazards: earthquakes, landslides, floods, and cyclones. We determine risks for each
hazard individually and a multi-hazard index gives an overall picture of city risk. To estimate the
likelihood of a hazard striking a given city, we take advantage of global hazard data sets developed by
different organizations (Table 1).
The data sets depict the geographic distribution of hazard risk in a grid format with a resolution of 1 km2.
Hazard frequency and, when available, severity are derived from historic events, from modeled
probabilities or from a combination of both. Historic events are used to calculate cyclone hazard risk for
cities. To estimate cyclone risk, we combined more than 2,800 historic cyclone tracks in the time period
from 1975 to 2007 and their modeled wind speed plumes (Figure 2), resulting in a global grid, that shows

9
how many times each grid cell has been struck by a cyclone (frequency) and with what wind speed
(severity) (Figure 3).
Landslide hazards are summarized as probabilities. These probabilities are derived through a
combination of trigger and susceptibility factors defined by various parameters, including slope,
lithological or geological conditions, soil moisture condition, vegetation cover, precipitation, seismic
conditions, and Shuttle Radar Topography Mission (SRTM) elevation data.
Table 1: Data sources for the hazard component
Hazard Description Unit Source Cyclones Tropical cyclones wind speed
buffers based on compilation of tracks (1975-2007) and GIS modelling.
Estimated Saffir-Simpson categories
UNEP/GRID-Europe
Floods Flood frequencies generated by GIS modelling, observed flood data from 1999 to 2007, obtained from the Dartmouth Flood Observatory (DFO) and the UNEP/GRID-Europe PREVIEW flood dataset.
Expected average number of event per 100 years
UNEP/GRID-Europe/ Dartmouth Flood Observatory
Earthquakes Modified Mercalli Intensity based on GIS modelling using the Global Seismic Hazard Assessment Program (GSHAP) dataset.
Simulated Modified Mercalli Intensity (MMI)
Center for International Earth Science Information Network (CIESIN), Columbia University
Landslides Landslide probabilities triggered by earthquakes and precipitation based on GIS modelling taking into account slope factor, lithological (or geological) conditions, soil moisture condition, vegetation cover, precipitation, and seismic conditions.
Expected annual probability and percentage of pixel of occurrence of a potentially destructive landslide event times 1,000,000
Norwegian Geotechnical Institute / International Centre for Geohazards
Note: See Dilley et al. (2005) and UN-ISDR (2011) for details.

10
To calculate earthquake and flood risks, combinations of historic events and modeled probabilities are
used. We overlaid the resulting hazard grids with city footprints to identify the maximum hazard
probability for each of the cities. This is accomplished by assigning the value of the grid cell with highest
hazard denomination within a city footprint as the city’s hazard severity.
Figure 2: Wind field of Hurricane Katrina in 2005
Figure 3: Global cyclone frequency 1975-2007
4.2 Quantifying exposure
The exposed elements at potential risk from hazards are people, buildings, transport infrastructure,
economies, and communities. In a rapidly urbanizing world, the increasing concentration of people and
High (count 74)
Low (count 1)

11
economic assets in cities is leading a sharp rise of urban hazard risk and is a main driver for the increase
in disaster losses. Growing exposure and delays in reducing vulnerabilities result in an increased number
of natural hazards and greater levels of loss.
The impact of a disaster is dependent on the extent of the exposed elements that are in harm’s way, i.e. on
the number of people and the amount and value of infrastructure that are affected by the disaster. The
exposure module in this study is an inventory of assets at risk at the city level. We consider two asset
classes: City population and city GDP. City population numbers are based on the “Henderson City
Dataset” (Table 2).
Table 2: Data sources for the exposure component
Dataset Description Unit Source Henderson City Data
Data set of cities worldwide with more than 100,000 inhabitants. The data includes city names, countries, codes, coordinates, and population numbers of the years 1960, 1970, 1980, 1990, and 2000.
Inhabitants per urban agglomeration
Prof. J. Vernon Henderson, Brown University
GRUMP Global urban footprint grid based largely on NOAA’s night-time light satellite data from 1994/5 coupled with settlement information.
Urban population distribution and the global extents of human settlements
Center for International Earth Science Information Network (CIESIN), Columbia University
GDP Sub-national Gross Regional Product (GRP) estimates and national Gross Domestic Product (GDP) data are allocated in proportion to the population residing in that cell. The approach distinguishes between rural and urban regions.
US$ per 1 km2 grid cell
World Bank
All cities in less developed countries with more than 100,000 inhabitants in the year 2000 are selected
from this database. This results in a city dataset with 1,943 cities. Cities in this context are entire urban
agglomerations with suburban fringe and adjacent towns.

12
To determine urban GDP and hazard severity, we define a city footprint for each of the city points from
the Henderson data. To define a footprint for each city, we match the city points of the Henderson data
with the Global Rural-Urban Mapping Project (GRUMP) raster data by the Center for International Earth
Science Information Network (CIESIN) at Columbia University. GRUMP is a global urban footprint grid
based largely on NOAA’s night-time light satellite data (e.g., Elvidge et al. 2010) coupled with settlement
information. For each of the 1,943 cities, we identify a corresponding urban area in GRUMP, which
represented the city’s urban footprint. Where multiple city points fall within a large continuous area, we
use Thiessen polygons to allocate a portion of the area to each urban point, creating a unique urban
footprint for each city (Figure 4).
Figure 4: Integration of GRUMP data and Henderson Cities
We use the footprints to calculate city GDP by using a global GDP grid with a resolution of
approximately 1km2. The GDP figures for cells within a city footprint are added up which resulted in the
city GDP. By overlaying the footprints with the natural hazard grids, the footprints are the basis for
identifying if a city is exposed to natural hazards, and if so, with what maximum hazard probability.

13
4.3 Calculating vulnerability
The term ‘vulnerability’ is derived from the Latin word vulnerare, which means 'to wound'. Broadly,
vulnerability refers to the extent to which a person, structure, or service is likely to be damaged by the
impact of a disaster. It explains why, with a given hazard severity, people and assets are more or less
likely to experience damages or losses and why they do or do not fail to be resilient in the face of a
threatening event. For the purpose of a risk assessment, vulnerability is usually disaggregated into
categories such as physical, social, economic, or environmental. While physical vulnerability of the built
environment, for example, is influenced by building age and construction type, social vulnerability is
affected by lack of access to resources or limited access to political power.
Vulnerability reduction is a core element in disaster risk management. The concept of vulnerability has
helped to highlight the role of social and physical factors that have an impact on the constitution of risk
(Hewitt 1983). By using the notion of vulnerability, disasters are not simply viewed as the result of a
natural event but rather as the result of the vulnerability of a society, its infrastructure, economy, and
environment, all of which are determined by human behavior. The focus shifts to what makes a natural
hazard and unnatural disaster (World Bank 2010a). Governments and citizens can appreciably reduce
vulnerability, and therefore risk, through sensible combinations of prevention, insurance, and
preparedness.
Vulnerability is not easily quantifiable and researchers have struggled to develop appropriate metrics for
vulnerability (Adgers 2006). Ways to determine vulnerability include deductive, inductive, and combined
methods. Deductive approaches use quantitative methods based on historical patterns of past disasters and
their damages and losses. Inductive approaches determine risks through combining weighted variables for
vulnerability. For example, factors such as GDP, poverty rates, or population density are taken as
indicators of how vulnerable a place is. An obstacle to inductive modeling is the lack of accepted
procedures for assigning values and weights to the different vulnerability factors that contribute to risk.
An obstacle to deductive approaches is that the data on losses during past hazards is insufficient,

14
especially on larger scales, and often not methodologically recorded. Despite this weakness, deductive
modeling offers a viable option to risk indexing in many contexts and is helpful, especially for risk
comparisons on larger scales.
In this study, we use deductive methods to determine two dimensions of vulnerability. Vulnerability to
mortality is calculated based on historical disaster mortality in precedent hazard events and vulnerability
to economic losses is determined through past economic losses in disasters. We extract the loss data on
number of deaths and amount of economic losses from the Emergency Events Database (EM-DAT)
(http://www.em-dat.net) for the period from 1980 to 2007 (Table 3). EM-DAT is maintained by the
Centre for Research on the Epidemiology of Disasters (CRED) which classifies an event as a disaster and
includes it into EM-DAT if at least one of the following criteria applies: Ten or more people were killed,
100 or more people were affected, a declaration of a state of emergency was made, or an appeal for
international assistance was made. EM-DAT records more than 600 disasters globally each year. For each
event, the database lists the type of disaster, the country, the date, death tolls, estimated damage, and the
number of affected people. Aggregating over more than 8,000 entries in EM-DAT helps compensate for
missing data and reporting inaccuracies.
Table 3: Data sources for the vulnerability component
Dataset Description Unit Source EM-DAT (Emergency Events Database)
International disaster database for major hazards across the world, listing country, date, death tolls, estimated damage, number of homeless and affected people. The database contains over 14,000 disasters and is compiled from various sources, including UN agencies, NGOs, insurance companies, research institutes, and press agencies.
Number of fatalities/economic losses per disaster
Centre for Research on the Epidemiology of Disasters (CRED) http://www.em-dat.net/
We calculate different vulnerability coefficients, or loss weights, for the two vulnerability categories of
population and GDP. Weights are obtained for all of the four hazard types for each of the 25 World Bank

15
clusters. Clusters are agglomerations of countries according to standard classifications of the World Bank.
They stem from seven geographical regions (Africa, East Asia and the Pacific, Europe and Central Asia,
Latin America and the Caribbean, Middle East and North Africa, North America, South Asia) (Figure 5)
and four different wealth classes (high, upper-middle, lower-middle, and low). We calculate the
coefficients on a regional basis rather than for each country, or even city, due to an insufficient number of
hazard and loss events. The weights are an aggregate index of relative losses over a 27 year period. They
represent an estimate of the proportion of persons killed during that period in the area that is exposed to
that hazard. For example, to calculate mortality loss weights for a hazard h for a certain cluster c, the
death tolls for that hazard (e.g. earthquakes) in the years from 1980 to 2007 are extracted from EM-DAT
for all countries within that cluster and aggregated: Mch.
Figure 5: The six regions covered in the study
Then, using the raster layers on the extent of each hazard, we sum up the population in the earthquake
affected areas from the year 2000 for that cluster: Pch. We calculate a simple mortality rate for the hazard
for the cluster:
𝑟𝑐ℎ = 𝑀𝑐ℎ/𝑃𝑐ℎ

16
4.4 Determining urban risk
Building upon the first three modules of hazard, exposure, and vulnerability, we determine the probability
of mortality and economic losses from catastrophic events for each city. The vulnerability coefficients are
used as weights that are combined with both the exposure data per city and the city-specific hazard
severity. For example, for each city i that is in an earthquake-prone area, we compute the city-specific
earthquake mortality rate Mice by multiplying the cluster-specific earthquake mortality rate rce by the city
population Pi and the city-specific earthquake severity Wie.
𝑀𝑖𝑐𝑒 = 𝑟𝑐𝑒𝑃𝑖𝑊𝑖𝑒
To compute a weighted multi-hazard index value for mortality that reflects total estimated impacts from
all disaster types for a city, we follow this method for each hazard h. Since the degree of hazard (hd) for
each of the five hazards is measured on a different scale (for example, frequency counts for cyclones
versus probability index values for landslides), the accumulated mortality numbers are not easily
comparable across hazards and simply adding the resulting values would result in an index unduly
dominated by a hazard type h that happens to be measured on a scale with larger values. Before
combining the hazards into a multi-hazard index, we apply a uniform adjustment by deflating the
weighted hazard-specific mortality figures, so that the total mortality in each region adds up to the total
recorded in EM-DAT.
𝑀𝑖𝑐ℎ∗ = 𝑀𝑖ℎ
′ 𝑀𝑐ℎ /�𝑀𝑖ℎ′
𝑛
𝑖=1
where n is the number of cities per cluster and M’ih is the hazard-specific city mortality rate (hd Pi r).
We calculate the combined, mortality-weighted multi-hazard city risk value Yi* as the sum of the adjusted
individual hazard mortality estimates for a given city:
𝑌𝑖∗ = �𝑀𝑖ℎ∗
4
ℎ=1

17
Reporting actual mortality numbers would portray an unrealistic impression of precision. To avoid literal
interpretation of the disaster index as the number of persons expected to be killed in a 20-year period and
in recognition of the many limitations of the underlying data, we convert the resulting measures into
index values from one to ten, classifying the global risk distribution into deciles and providing relative
presentations of disaster risk.
4.5 Interpretation
The calculated risks in the index assign a value to the city as a whole and are based on the three factors of
hazard severity in the city, city population, and the vulnerability of the particular World Bank cluster. The
mortality risk in a city is the potential extent of total fatality numbers that a city could incur rather than
the extent of risk that a single person experiences in that city. Similarly, economic risk mirrors total
potential damage extent.
Result interpretation needs to consider that a number of constraints. In an index, interesting and
idiosyncratic detail is hidden, and indexing cannot replace detailed research at local level. Constraints in
globally available data limit the sophistication of the methods that were employed to investigate urban
risk on a global level. Although we use the best available data, gaps in the data limit our analysis. For
example, deductive modeling has weaknesses in determining risk in contexts where disasters occur
infrequently and where historical data are scarce. Moreover, disaster loss data in EM-DAT is recorded on
country-level and does not allow for a differentiation between urban and rural loss rates and
vulnerabilities. The relatively small number of disaster events leads us to calculate vulnerability
coefficients on regional levels using groups of countries. Aggregating across more than 8,000 entries in
EM-DAT helps compensate for missing data and inaccuracies and reflect broad patterns of vulnerability.
It cannot, however, reveal protection mechanisms (land use planning, regulations) that individual cities
might have implemented. Another limiting factor is the relatively crude delineation of some hazards. For
example, earthquakes with pathological damage patterns are represented incompletely. The cities
investigated in this study stem from the Henderson city database (see Table 2). This data set contains

18
cities worldwide with more than 100,000 inhabitants. While it has extensive coverage globally, some
cities are left out in the database and are consequently not included in the index. Finally, for a few clusters
insufficient historic loss data were available for landslide hazards (i.e. Middle East and Northern Africa
High Income, Middle East and Northern Africa Lower Middle Income, all clusters in the Africa region,
and Eastern Europe and Central Asia Lower Middle Income). The countries belonging to those clusters
were therefore not included in the landslide analysis.
In recognition of these limitations, the modest objective of the study is to provide a relative presentation
of disaster risk instead of an absolute one. We therefore convert the absolute city risk values, calculated in
the risk model, into comparative index values.
While the index cannot provide the detail needed to identify concrete risk reduction measures, it assesses
the relative importance of risk at regional level and identifies areas where more attention is needed.
5 Results
Global Distribution. The number of exposed urban dwellers to certain hazards has implications for the
weight given to reduce the risk of specific hazards. In this analysis, by far the greatest number of the
investigated urban population in less developed countries is exposed to flood hazards, approximately 1.1
billion. Around half that number (560 million) are at risk to earthquakes and also to landslides (660
million). Finally, nearly 90 million of the study’s urban population is exposed to cyclone hazards.
Regional Distribution. Between 1980 and 2006, Pakistan and the US both experienced nineteen major
earthquakes (>5.0 on Richter scale). While in Pakistan 74,112 people died during these earthquakes, in
the US only 145 people were killed. This enforces the concept that tragedies are not caused by the
earthquake itself, but rather by dire construction practices and missing policies. The deaths and
devastation in disasters result from human action or inaction. Typically, wealthy regions and countries are
at higher risk in terms of economic losses but suffer fewer fatalities whereas poor countries experience
19
high mortality risks and lesser economic risks. The results in Figure 6 reflect this trend. This figure shows
the accumulated shares of urban economic and mortality risks by region and hazard. Within the individual
regions, significant differences can be found in terms risks to mortality and economic loss risks. For
example, while urban mortality loss risk to cyclones is greatest in South Asia (68%), the share of urban
cyclone economic loss risk in the same region is only 16%. The wealthier East Asian countries bear the
greatest burden of urban economic loss risk (77%) whereas East Asia’s urban mortality risk is
comparatively lower. Next to wealth, the type of disaster is a decisive factor for overall risk. Fatalities
from severe earthquakes, for example, are usually far larger than fatalities from severe floods or cyclones
under equal vulnerability conditions.

20
Figure 6: Regional shares of urban risks for four different hazards
Earthquake mortality risk Earthquake economic loss risk
Cyclone mortality risk Cyclone economic loss risk
Landslide mortality risk Landslide economic loss risk
Flood mortality risk Flood economic loss risk
0% 4%
35%
5%
28%
28%
0% 5%
60% 9%
19%
7%
1%
22% 0%
9% 0% 68%
4%
77%
0%
3% 0% 16%
2%
28%
31%
19%
1% 19% 13%
76%
11%
28%
25%
2%
20%
3%
22% 39%
44%
5% 5% 1% 6%

21
5.1 Ranking risks by country
The five most at risk countries for urban mortality and economic loss risk from four investigated hazards
are presented in Table 4. Some risks are highly concentrated in certain countries. India, Pakistan, and
Bangladesh, for example, account for 68% of cumulative urban mortality risk to cyclones out of all
investigated cities. Economic loss risk from cyclones, on the other hand is highest in East Asia, where
China alone accounts for 53% of the cumulative urban economic loss risk for cyclones. Earthquake risk is
highly concentrated in Turkey and Iran, both of which together account for 47% of all investigated
cumulative urban earthquake risk of economic losses. Economic risk to earthquakes is also high in
Hungary and Romania, both of which lay in one of the largest well-defined seismic-active areas of
Europe. The high density of urban inhabitants in out-of-date infrastructure contributed to past significant
past earthquake losses in the category of upper middle income countries in Eastern and Central Europe,
which led a large economic vulnerability coefficient in this study.
Table 4: The five most at risk countries for urban mortality and economic loss risk per hazard
Earthquake Risk
Cyclone Risk
Mortality Economic Loss
Mortality Economic Loss 1 Turkey Turkey
India China
2 Iran Iran
Pakistan Myanmar 3 India Hungary
Bangladesh Vietnam
4 Pakistan Romania
China India 5 Egypt Russia
Myanmar Pakistan
Landslide Risk
Flood Risk
Mortality Economic Loss
Mortality Economic Loss 1 Turkey Turkey
South Africa South Africa
2 Philippines Philippines
India Vietnam 3 India Russia
China China
4 Guatemala Guatemala
Argentina Indonesia 5 Indonesia China
Bangladesh India

22
5.2 Ranking risks by city
The cities with the highest mortality and economic loss risk by hazard are listed in Table 5 to Table 8.
The tables show the five most at risk cities by hazard in each of the six investigated regions. The ranking
gives an indication of the cities most worthy of further and more detailed investigation. The data provide
for interesting comparisons. For example, Metro Manila, one of the world’s most disaster prone cities, is
listed in the tables as being highly at risks from the three hazards of earthquakes, floods and landslides. In
2012, the city again experienced devastating floods with almost two thirds of the city area being
submerged after a week of torrential rains. Tehran is also highly at risk, especially from earthquakes and
floods. This fact has sparked repeated discussions among the country’s leaders about moving the capital
to a less risky region. A striking, but also sobering, result is the magnitude of risk in certain cities. In
South Asia, the top five ranked cities for cyclone mortality risk bear 62% of all cumulative mortality loss
risk in that region. Cumulative economic loss risk for landslides in Eastern Europe and Central Asia
amounts to 51% for the top five ranked cities in that category. All of those five cities are in Turkey. In
Africa, Addis Ababa accounts for 31% of the cumulative earthquake mortality risk in that region and the
top five cities altogether bear 59% of Africa’s earthquake mortality risk.
A number of smaller cities with less population and wealth are set to swell with rapid increases in
population and asset exposure. These include, for example, Toluca in Mexico and Conakry in Guinea.
While the absolute exposure of these cities is currently relatively low, the rapid increase in population
growth will pose significant challenges for these cities in the coming years.

23
Table 5: Regional top 5 cities most at risk to earthquakes
Mortality risk Economic loss risk
Region Country City Country City Africa Ethiopia Addis Ababa Uganda Kampala
Uganda Kampala Ethiopia Addis Ababa Malawi Blantyre Malawi Blantyre Kenya Nakuru Kenya Kisumu
Burundi Bujumbura Kenya Nakuru East Asia Philippines Metro Manila Indonesia Jakarta
Indonesia Jakarta Philippines Metro Manila China Tianjin China Beijing China Beijing China Tianjin
Indonesia Bandung Indonesia Yogyakarta Eastern Europe and Central Asia
Turkey Istanbul Turkey Ankara Turkey Ankara Hungary Budapest Turkey Izmir Turkey Izmit
Romania Bucharest Turkey Istanbul Turkey Bursa Turkey Izmir
Latin America and the Caribbean
Mexico Mexico City Peru Lima Peru Lima Mexico Mexico City Chile Santiago Mexico Tijuana
Colombia Bogota Colombia Bogota Mexico Guadalajara Chile Santiago
Middle East and Northern Africa
Egypt Cairo Iran Tehran Iran Tehran Egypt Cairo Iran Mashhad Iran Raja'ishahr Iran Esfahan Egypt Shubra El-Kheima
Tunisia Tunis Iran Ahvaz South Asia India Kolkata India Delhi
Bangladesh Dhaka India Kolkata Pakistan Karachi Pakistan Karachi
India Delhi Pakistan Lahore Pakistan Lahore Bangladesh Dhaka

24
Table 6: Regional top 5 cities most at risk to cyclones
Mortality risk Economic loss risk
Region Country City Country City Africa Mozambique Quelimane Mozambique Quelimane
Mozambique Beira Mozambique Beira Madagascar Toamasina Madagascar Toamasina Madagascar Mahajanga Madagascar Mahajanga
East Asia Myanmar Yangon China Shenzhen China Shanghai Myanmar Yangon
Vietnam Hai Phong Vietnam Hai Phong China Fuzhou China Shanghai China Dongguan China Dongguan
Latin America and the Caribbean
Dominican Republic Santo Domingo Mexico Cancun Jamaica Kingston Jamaica Kingston
Cuba La Habana Mexico Ciudad Madero Mexico Cancun Dominican Republic Santo Domingo
Dominican Republic La Romana Mexico Mazatlan South Asia India Chennai India Chennai
Pakistan Karachi Pakistan Karachi Bangladesh Chittagong India Visakhpatnam
India Visakhpatnam Bangladesh Chittagong Bangladesh Khulna Bangladesh Khulna
Note: No cyclone risk was measure in the Middle East, Northern Africa, Eastern Europe, and Central Asia

25
Table 7: Regional top 5 cities most at risk to landslides
Mortality risk Economic loss risk
Region Country City Country City Africa Sierra Leone Freetown
Guinea Conakry Nigeria Lagos Côte d'Ivoire Abidjan Ethiopia Adis Abeba East Asia Philippines Metro Manila Philippines Metro Manila
Indonesia Surabaya China Shenzhen Philippines Baguio Indonesia Surabaya
Vietnam Ho Chi Minh Indonesia Yogyakarta Indonesia Padang China Hong Kong SAR, China
Eastern Europe and Central Asia
Turkey Manisa Turkey Izmit Turkey Izmir Turkey Manisa Russia Petropavlovsk-Kamatskij Turkey Kahramanmaras Turkey Kahramanmaras Turkey Izmir Turkey Erzurum Turkey Erzurum
Latin America and the Caribbean
Guatemala Guatemala City Guatemala Guatemala City Ecuador Quito Brazil Vitoria
Colombia Bogota Peru Lima Peru Lima Ecuador Quito
Brazil Vitoria El Salvador San Salvador Middle East and Northern Africa
Iran Tehran Bahrain Al-Manamah Iran Rasht Djibouti Djibouti Iran Shiraz Iran Tehran Iran Tabriz Iran Mashhad Iran Khorramabad Iran Esfahan
South Asia India Imphal India Imphal India Mumbai India Srinagar India Srinagar India Thane
Pakistan Peshawar India Bhiwandi Pakistan Islamabad India Chandigarh
Note: Due to lack of data, economic loss risk for landslides could not be calculated in Africa.

26
Table 8: Regional top 5 cities most at risk to floods
Mortality risk Economic loss risk
Region Country City Country City Africa South Africa Cape Town South Africa Cape Town
South Africa Pretoria South Africa Durban South Africa Durban South Africa Pretoria South Africa Port Elizabeth South Africa Port Elizabeth
Nigeria Lagos South Africa Alberton East Asia Indonesia Jakarta Vietnam Ho Chi Minh
China Wuhan Indonesia Jakarta Philippines Metro Manila Philippines Metro Manila
Vietnam Ho Chi Minh Vietnam Hanoi Vietnam Hanoi Cambodia Phnom Penh
Eastern Europe and Central Asia
Uzbekistan Tashkent Russia Moscow Uzbekistan Namangan Poland Warszawa Uzbekistan Andijan Uzbekistan Tashkent
Russia Moscow Poland Kattowitz Tajikistan Khujand Turkey Ankara
Latin America and the Caribbean
Argentina Buenos Aires Argentina Buenos Aires Venezuela Caracas Brazil Sao Paulo
Brazil Sao Paulo Uruguay Montevideo Argentina Rosario Venezuela Caracas Venezuela Maracaibo Mexico Mexico City
Middle East and Northern Africa
Iran Tehran Iran Ahvaz Iran Ahvaz Iran Tehran Iraq Al-Basrah Iran Rasht Iran Shiraz Iran Shiraz
Morocco Casablanca Iran Abadan South Asia Bangladesh Dhaka India Kolkata
India Kolkata India Delhi India Delhi Bangladesh Dhaka
Bangladesh Chittagong India Surat Pakistan Karachi Pakistan Karachi

27
Figure 7: Urban mortality risk
Figure 8: Urban economic loss risk
Urban multi-hazard mortality risk for all 1,943 investigated cities is shown in Figure 7. The values are
calculated as the sum of the adjusted individual mortality estimates from the four hazards, and the results
are grouped into five classes, using quintiles. Mortality risk is significant in regions exposed to repeated,

28
severe flooding and storms along the eastern continental shorelines but also in the earthquake prone
regions of Eastern Europe and the Middle East. The regional differences in risks are in part due to
differences in population size but also the degree of hazard severity and frequency across regions.
Additionally, the differences reflect the variation in vulnerability. Similarly, economic risk is shown in
Figure 8.
Figure 9 shows the cities most at risk, taking into account both economic and mortality risk from all
hazards. To determine these, we calculated percentiles of the hazard-specific mortality of all the cities
using 15 classes (6.66 percentile, 13.33 percentile, etc.). The same was done for economic risk. Cities that
fall into the class above the highest percentile (93.33) for both mortality and economic risk are included in
the maps. Of these highest ranked thirty cities, eleven are in East Asia, five are in South Asia, five are in
Eastern Europe and Central Asia, three in Latin America, three in Sub-Saharan Africa and three in the
Middle East and Northern Africa. Some of these city results are closely tied with high hazard risk from
several hazards (for example, Tehran), others are particularly at risk due their size (for example, Metro
Manila) and yet others are in the top 30 list due to their high vulnerability (for example, Ankara).
Figure 9: 30 cities most at risk

29
6 Sensitivity analysis
Sensitivity analysis, applied to a risk assessment, is a method used to understand how risk estimates
depend on the variability and uncertainty of the factors used in the analysis. It determines how the
different factors used in the index construction process affect the outputs, and it plays an important role in
the verification and validation of the model. According to Saltelli at al. (2000) a sensitivity analysis is
conducted to determine, for example, a) if the model resembles the system under study; b) the factors that
most influence the output variability and therefore require special attention; c) the model parameters that
are insignificant and that can be omitted; and d) which factors interact with each other. It is the final step
in index development analysis, which examines the sensitivity of the model to changes in its inputs, and
that gives an indication on the level of confidence or uncertainty. In existing risk and vulnerability
indices, this last step has often been omitted.
In the Urban Risk Index, sources of uncertainties include: a) the underlying hazard models, b) the
delineation of cities, c) the global grids for GDP and population, and d) the vulnerability coefficients.
Future work on the index could conduct local sensitivity analysis by varying these input factors one at a
time and examine the impact, while the other factors remain constant. Since the index measures relative
values, the sensitivity of the relative, not absolute, values would need to be examined. These analyses
could be developed for the individual four single hazard indices.
For the multi-hazard index, which simply adds the values of the single hazard indices, it would be
interesting to determine which of the four indices have the largest influence in the overall urban multi-
hazard risk. The percentage values to which the single hazard indices contribute to the overall index vary
largely from 0-100% for all four hazards. We carried out a preliminary analysis that investigates how the
top 20 cities of the multi-hazard mortality index change if one single hazard value is removed. If the

30
landslide results are omitted from the overall index, only one city out of the top 20 cities changes. If the
flood index values are omitted, three cities change in the top 20. Removing the cyclones from the overall
index, results in a change of six cities and, finally, excluding earthquakes results in a change of seven
cities in the top 20 cities. This corresponds to the fact that earthquakes, on average, cause large fatality
numbers.
7 Future urban hazard risk
Between 2010 and 2050, urban areas will receive almost 2.7 billion additional residents according to UN
estimates. Almost all of this net growth—a result of migration, natural increase and absorption of nearby
rural areas—will occur in developing countries. Larger cities also mean greater exposure of people and,
because urban dwellers tend to be more productive than rural ones, an even greater increase of exposure
of economic assets. We develop a demographic-economic model of city-level population growth to derive
an estimate of future population exposure to earthquakes and cyclones up to 2050.
Population projections for countries tend to be more accurate than those for cities. Since international
population movements are typically far smaller than within-country migration, demographic models
based on fertility and mortality work well to forecast national population totals. But at the city level,
migration and the future fertility of these new migrants become more important factors. Migration, in
turn, responds to economic dynamics, so commonly used demographic models do not yield reliable
predictions (World Bank 2009). Instead, city level projections require consideration of various
endogenous and exogenous factors, such as technological change, economic growth and development, as
well as national population growth. In order to project future urban growth locations, it is critical to
understand the underlying forces that drive this transformation.
We based our projections on a global study of determinants of city growth by Henderson and Wang
(2007). This paper empirically modeled the urbanization process between 1960 and 2000. We focus on

31
the projection of future city growth to the year 2050 at the global scale while following the city growth
modeling framework and key variables developed by Henderson and Wang (2007). The model is set up as
a three-stage procedure. In the first stage, we develop a city growth empirical model of “core cities” with
more than 100,000 population-essentially re-estimating a modified version of the Henderson–Wang
model and use the estimated parameters to produce corresponding city population projections to 2050. In
the second stage, we extend the projections to “broader cities” of more than 50,000 population by
extrapolating city growth dynamics in different city size groups. These smaller cities are important
because many will enter our category of larger cities within the next four decades. In the third and final
stage, we use the UN Population Division country level urban population projections (to 2050) to make
our city population projections conform to these national urban totals.
We extend Henderson and Wang’s (2007) modeling framework and datasets covering core cities with
more than 100,000 population (as of year 2000) and estimate corresponding city population projections in
ten year intervals from 2010 to 2050. The projection in this stage covers 2,186 cities.
The core city growth model is estimated using the Ordinary Least Squares estimation. The dependent
variable is the city population growth rate of city i in country j over a 10-year period
( )1ln ln lnijt ijt ijtn n n −∆ = − . The independent variables include both country and city level
characteristics. At the country level, we add the national population growth over the same period
( )ln nat_pop jt∆ , the share of urban population ( )1urban_rate jt− , the share of population between 15 to
24 years of age ( )1r_pop_15_24 jt− , the percentage of adults with secondary education
( )1pct_sec_edu jt− in the base year, and a dummy indicating landlocked countries.
At the city level, we include the city population growth in the previous period ( )1ln ijtn −∆ in order to
capture strong time persistence often observed in the city growth empirical literature. In addition we
consider factors that determine the economic attractiveness of a city relative to its national peers. The
growth of a city-specific market potential measure in the previous period ( )1ln ijtMP −∆ is added as a

32
crude representation of the extent of market demand for a city’s products. The market potential of city i is
the distance discounted sum of populations of all other cities in the country excluding city i. ikd is the
distance from city i to k.
kjtijt
k j ikk i
nMP
d∈≠
=∑
For other geographical control variables, we include distance to coasts ( )ln distance_coast ij and a
dummy for a capital city. Coastal locations facilitate imports and exports and make a city an attractive
location for investment. The seat of government usually attracts a disproportionate share of migrants to
capital cities. Finally, we add interaction terms to capture heterogeneous contributions of different
covariates, which include 1 1ln lnijt ijtn MP− −×∆ , and -1 1ln pct_sec_eduijt jtn −× .
The estimation results of the base sample covering 1960 to 2000 are reported in Table 9. All covariates
are significant and have expected signs, which can be easily interpreted. Henderson and Wang (2007)
provide detailed interpretation of a similar set of estimation results.

33
Table 9: City growth estimation results of core cities with more than 100,000 population
Dependent variable 1ln ln lnijt ijt ijtn n n −∆ = − Estimation method OLS
ln nat_pop jt∆ 0.699***
(0.076)
1urban_rate jt− -0.067*** (0.022)
1r_pop_15_24 jt− 0.471** (0.192)
1ln ijtn −∆ 0.181*** (0.031)
1 1ln lnijt ijtn MP− −×∆ -0.153*** (0.026)
1pct_sec_edu jt− -0.005** (0.002)
-1 1ln pct_sec_eduijt jtn −× 0.0004*** (0.00016)
1ln ijtMP −∆ 2.360*** (0.355)
Dummy for a landlocked country -0.046* (0.023)
Dummy for a capital city 0.079*** (0.018)
ln distance_coast ij 0.006*** (0.001)
Constant Yes Observations 4,014
R2 0.383 Note: 1. Robust standard errors are in parentheses. 2. * significant at 10%; ** significant at 5%; *** significant at 1%.
To project future city level population, the estimation results are sequentially applied to each city’s
decadal population. For example, the expected city population growth in year t+1 (say, 2010) is used to
compute the market potential measure in year t+1, which in turn is used to predict the city population

34
growth in year t+2 (2020). The educational attainment, specifically the percentage of adults with
secondary education, represents human capital accumulation and is an indirect measure of technological
progress. Its projection from 2010 to 2050 is imputed using a simple projection equation capturing stable
correlation with GDP per capita.2 Other national level exogenous variables, such as projections of
national population growth and urbanization rate, are from the UN Population Division projections. In
this way, we estimate city population projections of 2,175 core cities of more than 100,000 population.
In the second stage, we extend the city population projections to 8,301 cities of more than 50,000
population. The data are from the CIESIN (2010), but they only contain estimates for a single point in
time, for the year 2000. We also note that data for these 8,301 cities have been collected from different
sources and city definitions are not completely harmonized with the aforementioned city profiles of 2,175
core cities with more than 100,000 population.3
These data limitations do not allow a full-fledged panel data analysis as in the first stage core city
modeling, and we cannot identify city-specific growth dynamics. In order to circumvent this problem, we
extrapolate city growth dynamics from the first stage core city growth modeling results. A key
assumption, derived from the systems of cities literature, is that a city’s growth dynamics crucially depend
on its rank in the urban hierarchy.4 In other words, the relative city population size in a competing region
determines its future growth when other exogenous variables are controlled for.
2 The percentage of adults with secondary education of country j in year t is predicted using GDP per capita projections of Hawksworth (2006).
( ) ( )1(0.008) (2.832)
2 3
(0.384) (0.017)
pct_sec_edu 0.870 pct_sec_edu 9.537 ln
1.545 ln 0.075 ln constant
jt jt jt
jt jt
GDPpc
GDPpc GDPpc
−= × − ×
+ × − × +
Robust standard errors are in parentheses. All coefficients are significant at 1%. R2 = 0.835. 3 In contrast to the previous analysis we include cities in industrialized countries in these projections. 4 A basic model of multiple types of cities involves different types of urban specialization, where different types of cities are specialized in different products and resulting in different city sizes. See Henderson (1974), and Duranton and Puga (2002) for a review.

35
We first reclassify the 2,175 core cities (of more than 100,000 population) into 16 regions following the
regional classification employed in the 2009 World Development Report (World Bank 2009): Australia
and New Zealand, Central America and Caribbean, Central Asia, Caucasus and Turkey, Eastern Africa,
Eastern Europe and Russia, Middle Africa, North America, Northeast Asia, Northern Africa, South
America, Southeast Asia and Pacific, Southern Africa, Southern Asia, Western Africa, Western Asia, and
Western Europe. In each WDR region, we group its constituent cities into quintile subgroups according to
their relative city population size in 2000, and compute in each quintile group the mean values of each of
the regressors of Table 9. These quintile mean values represent region-specific average attributes of each
quintile group cities. For example, the largest quintile group cities in Western Africa is assumed to share
the same city-specific attributes and dynamics (such as previous growth rates of city population and
market potential), while conditioned by country-specific exogenous growth paths (such as projected
national population growth, and urbanization rates).
We repeat the same region-specific quintile grouping for 8,301 broader cities of more than 50,000
population. Based on its quintile group, each city in this broader set is then assigned the growth attributes
(listed in Table 9) extrapolated from corresponding core city statistics in the same quintile group of the
same region. In this way we identify city growth dynamics of each 8,301 broader cities, and sequentially
project city population growth rates and corresponding city population sizes backward (from 2000 to
1970) and forward (from 2000 to 2050).
In the third and final stage, we harmonize our projections with UN Population Division national urban
population projections (to year 2050) as these are the most widely used national estimates of future urban
and rural population. We adjust city population projections ( )adj. projij,tcity pop such that national urban
population growth rates are the same as the UN Population Division’s country projections. Specifically,
ini. projUNPDkj,2000
k j,tadj. proj ini. projij,t ij,t ini. proj UNPD
kj,t j,2000k
city popurban pop
city pop city popcity pop urban pop
j
j
∈
∈
= × ×∑∑ .

36
Aggregating urban population projections with data on the spatial distribution of cyclones and
earthquakes described earlier shows that population exposure to those hazards is likely to more than
double by 2050 (Figure 10 and Figure 11). The largest urban cyclone exposure is expected to be in South
Asia while the largest earthquake exposure will be found in East Asia and the Pacific. Figure 12 shows
the data for individual cities in map form.
Figure 10: Population in large cities exposed to cyclones (1970-2050)
Note: OHIE=Other high income economies, OECD=Organization for Economic Cooperation and Development, SSA=Sub-Saharan Africa, SAS=South Asia, MNA=Middle East and North Africa, LAC=Latin America and the
Caribbean, ECA=Europe and Central Asia, EAP=East Asia and the Pacific.
Figure 11: Population in large cities exposed to earthquakes (1970-2050)
0
100
200
300
400
500
600
700
800
1970 1980 1990 2000 2010 2020 2030 2040 2050
OHIE
OECD
SSA
SAS
MNA
LAC
ECA
EAP
0
100
200
300
400
500
600
700
800
900
1000
1970 1980 1990 2000 2010 2020 2030 2040 2050
OHIE
OECD
SSA
SAS
MNA
LAC
ECA
EAP

37
Figure 12: Exposure to cyclones and earthquakes in large cities in 2000 and 2050
Note: Map produced by Brian Blankespoor, DECRG; see also World Bank (2010).
8 Conclusion
This study assesses the risk of mortality and economic loss from catastrophic events in cities of
developing countries worldwide with a population greater than 100,000. We calculate risk by combining
the three modules of hazard, exposure, and vulnerability. The urban hazards are determined by overlaying
the city locations with hazard severity grids; regional vulnerability coefficients are based on loss data
from past events; and exposure is defined through city population and city GDP. We developed four
single hazard risk indices and in addition, a multi-hazard index gives a holistic picture of city risk. The
absolute risk values are converted into index values, classifying the results into relative presentations of
risk. Expected urban risk exposure in the year 2050 is determined through projections of future city

38
population growth. The results suggest that populations exposed to earthquake and cyclone risks will
more than double by 2050 in developing country cities.
By revealing risk levels, this paper contributes to the knowledge on the variation of urban risks. Such
knowledge is useful for local and national planners, as well as international donors. Disclosing risks to
cities raises awareness, informs the prioritization of resources, inspires further research, particularly at
local levels, and promotes a shift towards managing risks rather than emergencies.
The index also provides a baseline for channeling international interest and funding for detailed urban
multi-hazard risk assessments. These detailed assessments of the hazards, elements at risks, and the
present and future vulnerabilities are required to gain a deep understanding for effective risk reduction
and financial risk transfer mechanisms. Once the underlying risks in a city are known, the key drivers of
risk can be addressed through a range of policy options, for instance, through building codes,
environmental rehabilitation, land use planning, and early warning. Since the current lack of integration
of urban development and risk reduction increases vulnerabilities and expected future losses, a shift to
proactive and preventive urban planning underpinned with the principle of diminishing risk is needed.
This increased role of spatial and localized urban planning as a tool for reducing disaster is perhaps the
most important public policy recommendation from this paper.
9 References
Adger, W. N. (2006). Vulnerability. Global Environmental Change, 16(3): 268-281.
Angel S., S. Sheppard S. and D. Civco (2005). The Dynamics of Global Urban Expansion. Transport and Urban Development Department, World Bank, Washington DC.
Ashdown, L. (2011). Humanitarian Emergency Response Review (HERR). London: Department for International Development (DFID). [www.dfid.gov.uk/emergency-response-review].
Association of Southeast Asian Nations (ASEAN) (2010): ASEAN Agreement on Disaster Management and Emergency Response - Work programme for 2010-2015: Building disaster-resilient nations and safer communities. Jakarta: ASEAN.
39
Blaikie, P., T. Cannon, I. Davis and B. Wisner (1994). At Risk: Natural Hazards, People’s Vulnerability and Disasters. London: Routledge.
Bouwer, L. M. (2011). Have disaster losses increased due to anthropogenic climate change?. Bull. Amer. Meteor. Soc., 92: 39–46.
Brecht, H., S. Dasgupta, B. Laplante, S. Murray, and D. Wheeler (2012). Sea-level rise and storm surges: High stakes for a small number of developing countries. The Journal of Environment and Development, 21(1): 102-138.
Cardona, O. (2005). Indicators of Disaster Risk and Risk Management: Program for Latin America and the Carribean. Main Technical Report. Washington, DC: Inter-American Development Bank (IDB).
CIESIN (2010). Global Rural Urban Mapping Project (GRUMP), population data including city location and population estimates, http://sedac.ciesin.columbia.edu/data/collection/gpw-v3 .
Cutter, S. (ed.) (2001). American Hazardscapes: the Regionalization of Hazards and Disasters. Washington, DC: Joseph Henry Press.
Cutter, S.L. and C. Finch (2008). Temporal and spatial changes in social vulnerability to natural hazards. Proceedings of the National Academy of Sciences, 105(7): 2301-2306.
Davidson, R. (1997). A multidisciplinary urban earthquake disaster risk index. Earthquake Spectra, 13(2): 211–223.
Dilley, M., R. Chen, U. Deichmann, A. Lerner-Lam, M. Arnold, J. Agwe, P. Buys, O. Kjekstad, B. Lyon and G. Yetman (2005). Natural Disaster Hotspots: A Global Analysis. World Bank Disaster Risk Management Series, No. 5. Washington, DC: World Bank.
Duranton, G. and D. Puga (2001), "Nursery Cities: Urban Diversity, Process Innovation, and the Life Cycle of Products," American Economic Review, 91, 1454-1477.
Elvidge, C.D., P.C. Sutton, B.T. Tuttle, T. Ghosh and K.E. Baugh, Global urban mapping based on nighttime lights, in P. Gamba and M. Herold (eds), Global Mapping of Human Settlements, Taylor and Francis, London, 129-144.
Füssel, H.-M. (2007). Vulnerability: A generally applicable conceptual framework for climate change research. Global Environmental Change, 17: 155-167.
Gill, I. and H. Kharas (2007). An East Asian Renaissance: Ideas for Economic Growth. Washington, DC: World Bank.

40
Hanson, S., R. Nicholls, N. Ranger, S. Hallegatte, J. Corfee-Morlot, C. Herweijer and J. Chateau (2011). A global ranking of port cities with high exposure to climate extremes. Climatic Change, 104: 89-111.
Hawksworth, J. (2006), The World in 2050, PricewaterhouseCoopers, UK.
Henderson, J.V. (1974), The Sizes and Types of Cities, American Economic Review, 61, 640-656.
Henderson, J.V. and H.G. Wang (2007), Urbanization and City Growth: the Role of Institutions, Regional Science and Urban Economics, 37, 283-313.
Hewitt, K. (ed.) (1983). Interpretation of Calamity: From the Viewpoint of Human Ecology. Boston: Allen and Unwin.
Hsu, W.-K., C.-P. Tseng, W.-L. Chiang and C.-W. Chen (2012). Risk and uncertainty analysis in the planning stages of a risk decision-making process. Natural Hazards, 61: 1355-1365.
IPCC (2012). Managing the Risks of Extreme Events and Disasters to Advance Climate Change Adaptation. A Special Report of Working Groups I and II of the Intergovernmental Panel on Climate Change. Field, C.B., V. Barros, T.F. Stocker, D. Qin, D.J. Dokken, K.L. Ebi, M.D. Mastrandrea, K.J. Mach, G.-K. Plattner, S.K. Allen, M. Tignor, and P.M. Midgley (eds.). Cambridge, UK: Cambridge University Press.
Lall, S.V. and U. Deichmann (2012), Density and Disasters, World Bank Research Observer, 27-74-105.
Lerner-Lam, A. (2007). Assessing global exposure to natural hazards: Progress and future trends. Environmental Hazards, 7(1): 10–19.
McGranahan, G., D. Balk and B. Anderson (2007). The rising tide: assessing the risks of climate change and human settlements in low elevation coastal zones. Environment and Urbanization, 19(1): 17-37.
Mileti, D. (1999). Disasters by Design. Washington, DC : Joseph Henry Press.
Munich Re (2003a). Annual Review: Natural Catastrophes 2002, Topics. Munich: Author. [http://www.munichre.com/publications/302-03631_en.pdf].
Neumayer, E. and F. Barthel (2010). Normalizing economic loss from natural disasters: A global analysis. Global Environmental Change, 21: 13-24.
Peduzzi, P., H. Dao, C. Herold and F. Mouton. (2009). Assessing global exposure and vulnerability towards natural hazards: the Disaster Risk Index. Natural Hazards and Earth System Sciences, 9: 1149-1159.

41
Pelling, M. (2003). The Vulnerability of Cities: Social Resilience and Natural Disaster. London: Earthscan.
Plate, E. J. (2002). Flood risk and flood management. Journal of Hydrology, 267(1): 2–11.
Saltelli, A., K. Chan, and E. M. Scott (eds.) (2000). Sensitivity Analysis, Wiley Series in Probability and Statistics. New York: John Wiley & Sons, Ltd.
Smith, K. (2012). Environmental Hazards: Assessing Risk and Reducing Disaster, 6nd edn. London: Routledge.
Tierney, K. (2002). Methods of Disaster Research, Xlibris Corporation, chapter The Field Turns Fifty: Social Change and the Practice of Disaster Fieldwork, pp. 349–374.
Skidmore, M. and H. Toya (2007). Economic development and the impacts of natural disasters. Economics Letters, 94(1): 20-25.
UN (2012). World Urbanization Prospects 2012 Revision, United Nations Population Division, New York.
UN-ISDR (2005). Hyogo Framework for Action 2005-2015: Building the Resilience of Nations and Communities to Disasters, United Nations International Strategy for Disaster Risk Reduction, Geneva.
UN-ISDR (2009). Global Assessment Report on Disaster Risk Reduction: Invest Today for a Safer Tomorrow, United Nations, Geneva, Switzerland.
UN-ISDR (2011). Global Assessment Report on Disaster Risk Reduction: Revealing Risks, Redefining Development, United Nations, Geneva, Switzerland.
White, G.F. (1973). Natural hazards research. In Directions in Geography, ed. R.J. Chorley, 193-216. London: Methuen.
Wisner, B. (2003). Building Safer Cities: The Future of Disaster Risk. In Disaster Risk Reduction in Megacities: Making the Most of Human and Social Capital. World Bank Disaster Risk Management Series, No. 3, 181–196. Washington, DC: The World Bank.
World Bank (2006). Hazards of Nature, Risks to Development: An IEG Evaluation of World Bank Assistance for Natural Disaster. Washington, DC: World Bank.
World Bank (2009). Reshaping Economic Geography. World Development Report 2009. Washington DC: World Bank.

42
World Bank (2010a), Natural Hazards, Unnatural disasters. The Economics of Effective Prevention, Washington, D.C.
World Bank (2010b). Climate Risks and Adaptation in Asian Coastal Megacities. Washington, DC: World Bank.
Zakour, M.J. and D.F. Gillespie (2013): Disasters and the Promise of Disaster Vulnerability Theory. In Community Disaster Vulnerability: Theory, Research, and Practice, eds. Zakour, M.J. and D.F. Gillespie, 1-15. New York: Springer.