52351416 DSC Presentation
16
Differential Scanning Calorimetry Stephen Collins
-
Upload
pramendra-singh -
Category
Documents
-
view
219 -
download
0
Transcript of 52351416 DSC Presentation

8/6/2019 52351416 DSC Presentation
http://slidepdf.com/reader/full/52351416-dsc-presentation 1/16
Differential Scanning
Calorimetry
Stephen Collins

8/6/2019 52351416 DSC Presentation
http://slidepdf.com/reader/full/52351416-dsc-presentation 2/16
Technical Group Talk
Definitions
• A calorimeter measures the heat into or out of a
sample.
• A differential calorimeter measures the heat of a
sample relative to a reference.• A differential scanning calorimeter does all of the
above and heats the sample with a linear temperature
ramp.
• Endothermicheat flows into the sample.• Exothermicheat flows out of the sample.
8/6/2019 52351416 DSC Presentation
http://slidepdf.com/reader/full/52351416-dsc-presentation 3/16
Technical Group Talk
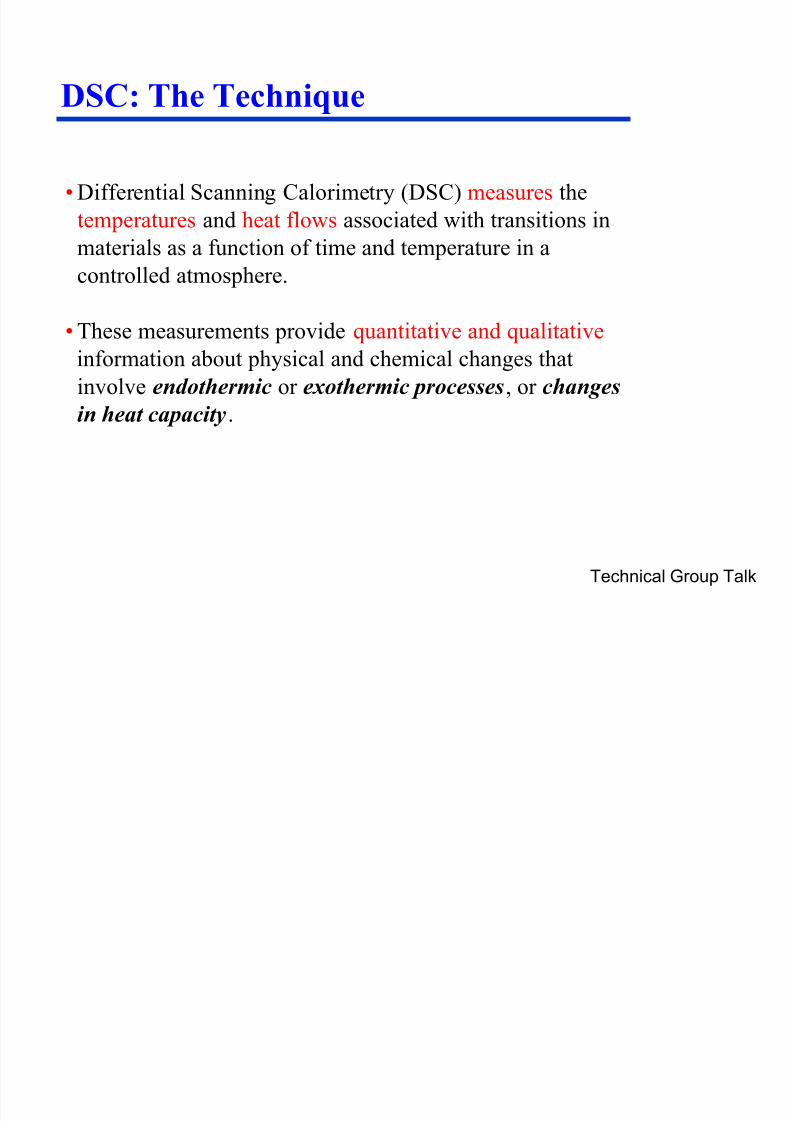
• Differential Scanning Calorimetry (DSC) measures the
temperatures and heat flows associated with transitions in
materials as a function of time and temperature in a
controlled atmosphere.
• These measurements provide quantitative and qualitative
information about physical and chemical changes that
involve endothermic or exothermic processes, or changes
in heat capacity.
DSC: The Technique

8/6/2019 52351416 DSC Presentation
http://slidepdf.com/reader/full/52351416-dsc-presentation 4/16
Technical Group Talk
Conventional DSC
Metal
1
Metal
2
Metal
1Metal
2
Sample Empty
Sample
TemperatureReference
Temperature
Temperature
Difference =
Heat Flow
•A “linear” heating profile even for isothermal methods

8/6/2019 52351416 DSC Presentation
http://slidepdf.com/reader/full/52351416-dsc-presentation 5/16
Technical Group Talk
What can DSC measure?
•Glass transitions
•Melting and boiling points
•Crystallisation time and temperature
•Percent crystallinity•Heats of fusion and reactions
•Specific heat capacity
•Oxidative/thermal stability
•Rate and degree of cure
•Reaction kinetics
•Purity

8/6/2019 52351416 DSC Presentation
http://slidepdf.com/reader/full/52351416-dsc-presentation 6/16
Technical Group Talk
6
DSC Thermogram
Temperature
H
eatFlow
->exot
hermic
Glass
Transition
Crystallisation
Melting
Cross-Linking
(Cure)
Oxidation

8/6/2019 52351416 DSC Presentation
http://slidepdf.com/reader/full/52351416-dsc-presentation 7/16
79.70°C(I)
75.41°C81.80°C
144.72°C
137.58°C20.30J/g
245.24°C
228.80°C22.48J/g
Cycle 1
-0.5
0.0
0.5
1.0
1.5
HeatFlow(W
/ g
)
0 50 100 150 200 250 300
Temperature(°C)
Sample: PET80PC20_MM1 1minSize: 23.4300 mgMethod: standard dsc heat-cool-heatComment: 5/4/06
DSCFile: C:...\DSC\Melt Mixed1\PET80PC20_MM1.001Operator: SACRun Date: 05-Apr-2006 15:34Instrument: DSC Q1000 V9.4 Build 287
Exo Down Universal V4.2E TA Instruments
Technical Group TalkTechnical Group Talk
Example DSC - PET
Tg
Tc
Tm
8/6/2019 52351416 DSC Presentation
http://slidepdf.com/reader/full/52351416-dsc-presentation 8/16
Technical Group Talk
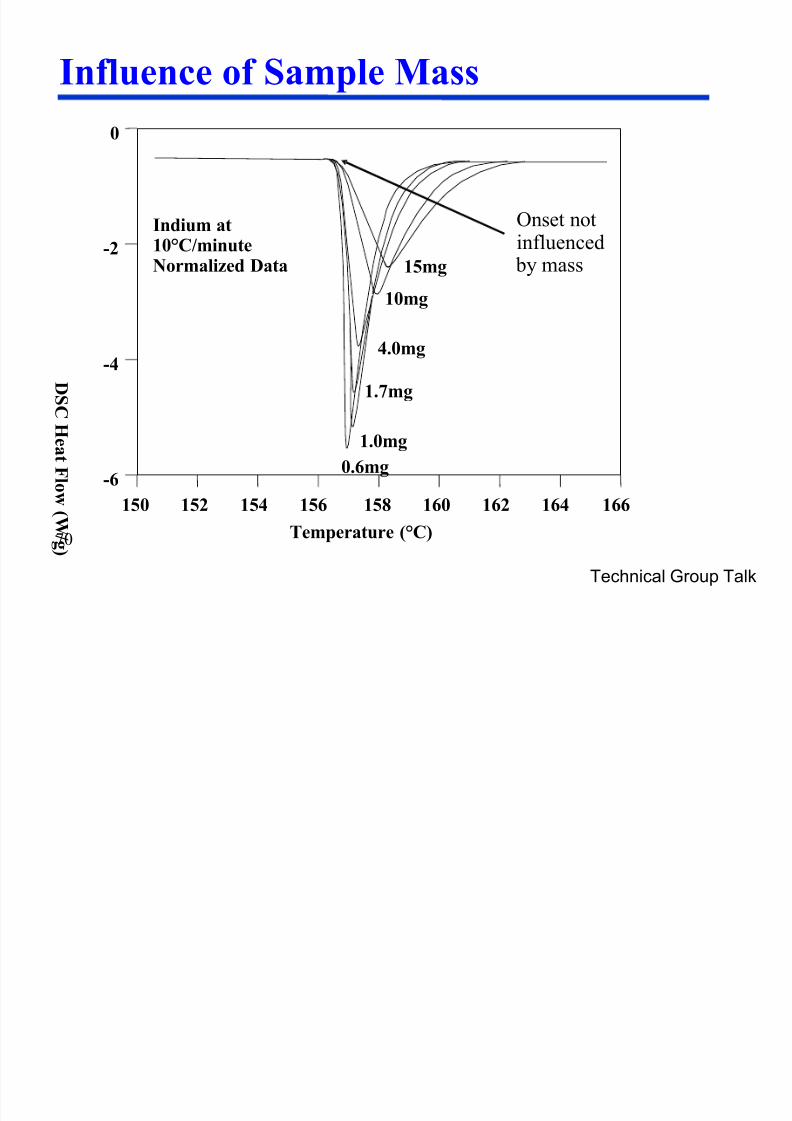
670
Influence of Sample Mass
Temperature (°C)
150 152 154 156
0
-2
-4
-6
DSCHeatFlow
(W
/g)
10mg
4.0mg
15mg
1.7mg
1.0mg
0.6mg
Indium at10°C/minuteNormalized Data
158 160 162 164 166
Onset notinfluenced
by mass
8/6/2019 52351416 DSC Presentation
http://slidepdf.com/reader/full/52351416-dsc-presentation 9/16
Technical Group Talk
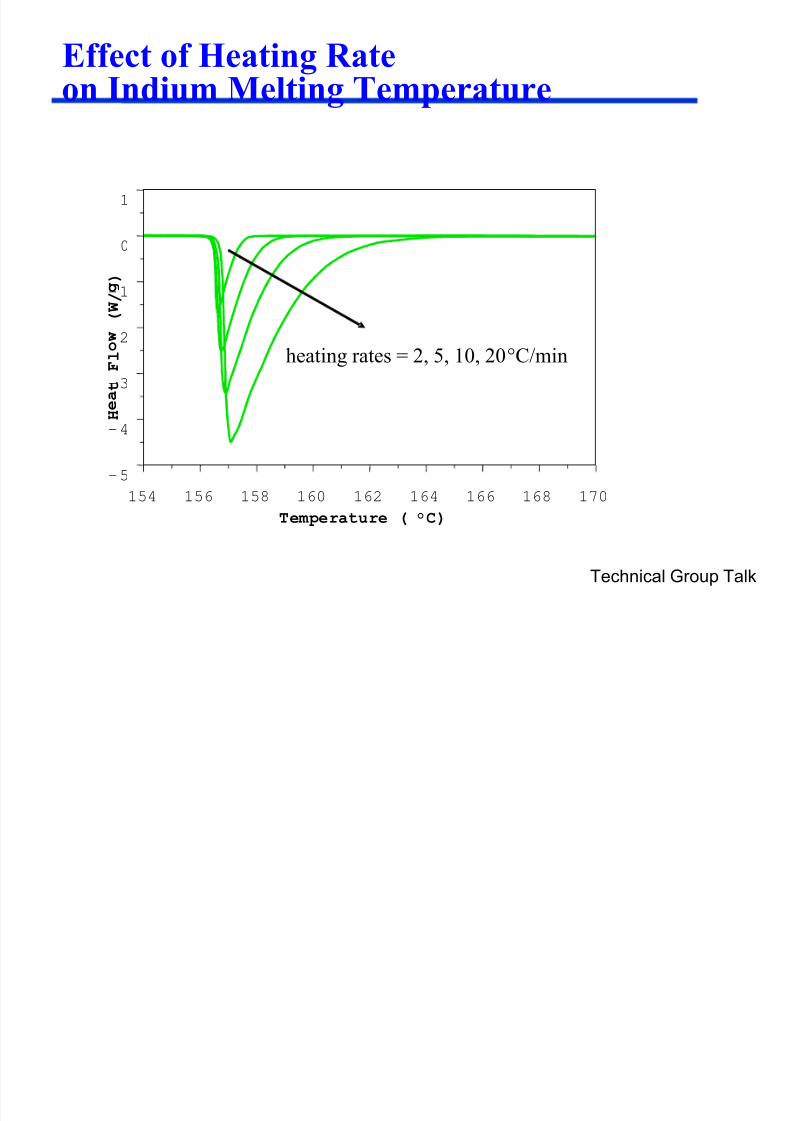
6
Effect of Heating Rateon Indium Melting Temperature
154 156 158 160 162 164 166 168 170
- 5
- 4
- 3
- 2
- 1
0
1
Temperature ( °C)
H
e a t
F l
o w
( W / g )
heating rates = 2, 5, 10, 20°C/min

8/6/2019 52351416 DSC Presentation
http://slidepdf.com/reader/full/52351416-dsc-presentation 10/16
Technical Group Talk
DSC: Main Sources of Errors
•Calibration
•Contamination
•Sample preparation – how sample is loaded into a pan
•Residual solvents and moisture.
•Thermal lag
•Heating/Cooling rates
•Sample mass
•Processing errors

8/6/2019 52351416 DSC Presentation
http://slidepdf.com/reader/full/52351416-dsc-presentation 11/16
Technical Group Talk
99
Sample Preparation : Shape
• Keep sample as thin as possible (to minimise thermalgradients)
• Cover as much of the pan bottom as possible
• Samples should be cut rather than crushed to obtain a
thin sample (better and more uniform thermal contactwith pan)

8/6/2019 52351416 DSC Presentation
http://slidepdf.com/reader/full/52351416-dsc-presentation 12/16
Technical Group Talk
Other DSC Techniques
Hyper-DSC
Based on principle that high heating rates give large broad
transitions.
•Heating rates typically 400-500oC/min
•Need very small sample sizes (~nanograms)
Good for:
•A quick overview of new sample
•Picking out minute transition
Poor for:
•Accuracy: transitions can be shifted by as much as 40oC
•Repeatabiliy: Very sensitive to thermal lag.

8/6/2019 52351416 DSC Presentation
http://slidepdf.com/reader/full/52351416-dsc-presentation 13/16
Technical Group Talk
Other DSC Techniques
Modulated DSC
•Composite heating profile:•Determines heat capacity and separates heat flow into that due
to reversible and non-reversible events.
Note that temperature is not decreasing duringModulation i.e. no cooling
Modulate +/- 0.42 °C every 40 secondsRamp 4.00 °C/min to 290.00 °C
52
54
56
58
60
62
M o d u l a t e d T e m p e r a t u r e ( ° C )
52
54
56
58
60
62
T e m p e r a t u r e ( ° C )
13.0 13.5 14.0 14.5 15.0
Time (min)
Typicaly:
Heating rates: 0 - 50C
Modulation:
Period: 60 second
Amplitude: +/-10C

8/6/2019 52351416 DSC Presentation
http://slidepdf.com/reader/full/52351416-dsc-presentation 14/16
Benefits• Increased Sensitivity for Detecting Weak (Glass) Transitions
– Eliminates baseline curvature and drift
• Increased Resolution Without Loss of Sensitivity
– Two heating rates (average and instantaneous)
• Ability to Separate Complex Thermal Events and Transitions IntoTheir Heat Capacity and Kinetic Components
• Ability to Measure Heat Capacity (Structure) Changes DuringReactions and Under Isothermal Conditions
Downside
• Slow data collection
Technical Group Talk
Modulated DSC
8/6/2019 52351416 DSC Presentation
http://slidepdf.com/reader/full/52351416-dsc-presentation 15/16
Technical Group Talk
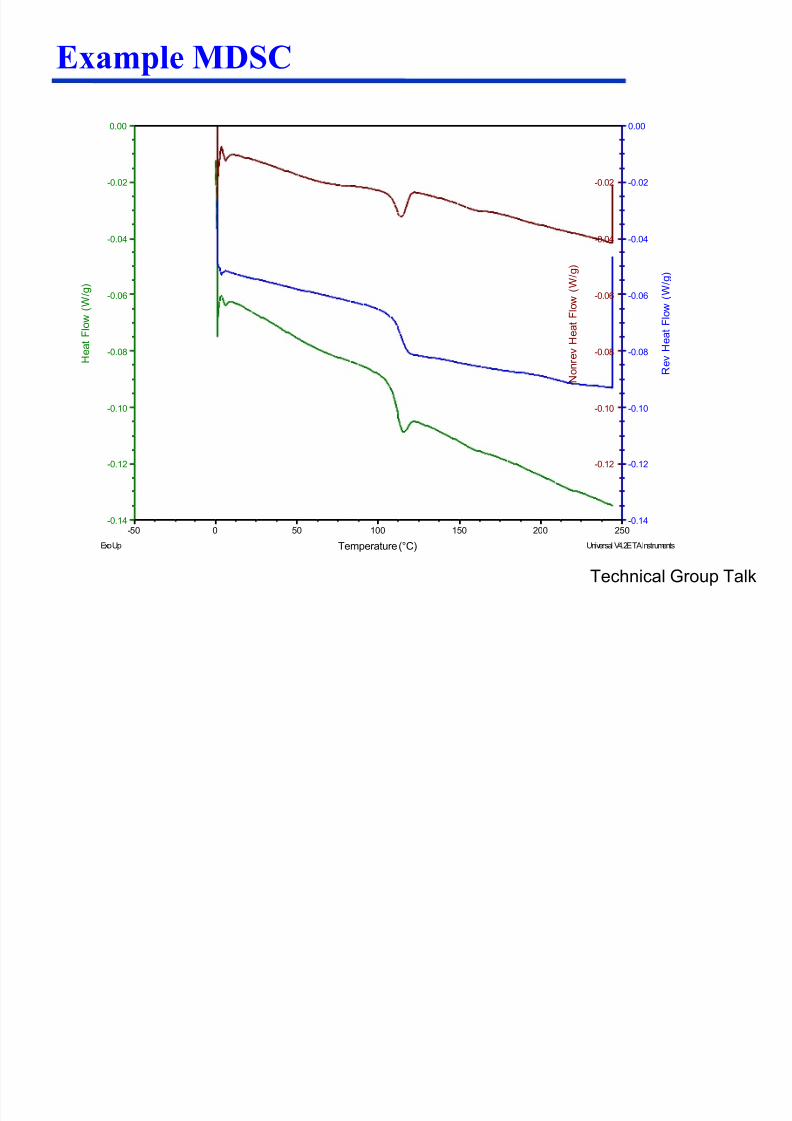
Example MDSC
-0.12
-0.10
-0.08
-0.06
-0.04
-0.02
N o n r e v H e a t F l o w ( W / g )
-0.14
-0.12
-0.10
-0.08
-0.06
-0.04
-0.02
0.00
R e v H e a t F l o w ( W / g )
-0.14
-0.12
-0.10
-0.08
-0.06
-0.04
-0.02
0.00
H e a t F l o w ( W / g )
-50 0 50 100 150 200 250
Temperature (°C)Exo Up Universal V4.2E TA Instruments
8/6/2019 52351416 DSC Presentation
http://slidepdf.com/reader/full/52351416-dsc-presentation 16/16
Technical Group Talk
Modulated DSC
Reversible Transitions
•Glass Transition
•Melting
Non-reversible
•Crystallisation
•Curing•Oxidation/degradation
•Evaporation