2018 Stakeholder Presentation - Final · 2017-09-28 · last year’s presentation compared to...
20
atcllc.com 2018 Budget Stakeholder Presentation October 10, 2017
Transcript of 2018 Stakeholder Presentation - Final · 2017-09-28 · last year’s presentation compared to...

atcllc.com
2018 BudgetStakeholder Presentation
October 10, 2017

atcllc.com 2
• Welcome – Randy Karls
• ROE Complaints – Brian Drumm
• Budget Overview – Kevin Szalacinski
– ATC – Network
– MISO – Other charges
• Asset Management – Jim Vespalec
• Capital Investment – Matt Weber
• Pre-certification – Matt Weber
• Q&A - All
• Summary & Close – Randy Karls
Welcome & Overview

atcllc.com
Key Budget Assumptions
3
• ROE Complaints – ATC posted rates on September 29, 2017 for the 2018 billing year
• We assumed no FERC order in complaint #2 (Docket No. EL15-45) before the posting date
• Per the tariff, Network and MISO revenues must be based on the current approved ROE of 10.82% (This reflects the FERC approved 10.32% under Docket No. EL14-12 and a 50 basis point adder for RTO participation)
– Budgeted pre-tax earnings reflect a FERC order in Docket No. EL15-45 effective January 1, 2018
• ATC assumes FERC accepts the administrative law judge’s recommended ROE of 9.70% plus the 50 basis point adder for RTO participation for an ROE of 10.20%.
• When FERC ruling is issued, ATC must re-post revenue requirements
• Bonus Depreciation– Assumes 50% bonus depreciation is in effect through 2020
• Slightly more conservative than phase-out in current law

atcllc.com 4
• Total revenue requirement for 2018 is $764.2M compared to $723.4M in 2017
– Revenue requirements reflects the current FERC approved ROE of 10.82% (including the RTO adder)
• Network billed revenue for 2018 is $589.7M compared to $563.3M in 2017
• 2018 O&M budget is $155.3M – flat from the 2017 approved budget
Budget Highlights

atcllc.com 5
2018 Projected Network Revenue Requirement ($Millions)
1 Includes CWIP and new assets placed in-service. 2 Comprised of 50% Weighted Cost of Debt and 50% Allowed Return on Equity.3 This includes revenues collected under Schedule 26 (RECB), Schedule 26-A (MVP), Schedule 1 and other credits such as Point-to-Point revenues4 Actual billed revenue will be decreased by $2.4M for a prior year true-ups
13 Month Average Rate
Base 1
$3,703.7
Weighted Return 2
7.69%
Return on Rate Base
$285.0
Recoverable Operating
Expenses and Taxes
$479.2
Gross Revenue
Requirement
$764.2
Return on Rate Base
$285.0
Gross Revenue
Requirement
$764.2
Revenues Received
from MISO 3
$172.1
Revenue Requirement
Collected Under
Attachment O 4
$592.1

atcllc.com 6
Network Revenue Requirement ($Thousands)
Footnotes:
1. Return on rate base for 2018 reflects a 10.82% ROE and 2019-21 reflects a 10.20% ROE.
2. Includes O&M, Project O&M, Precertification and Taxes other than Income Taxes.
3. Variance in 2018 due to lower assumed ROE of 10.20% in last year’s presentation compared to current authorized ROE of 10.82%. Adjusting the ROE would result in a decrease of $10.5M.
2017
Budget
2018
Forecast
2019
Forecast
2020
Forecast
2021
Forecast
Return on Rate Base 1 $ 270,394 $ 284,975 $ 286,629 $ 297,811 $ 304,168
Income Taxes 110,247 116,078 114,243 118,281 121,017
Depreciation 153,081 167,488 186,021 195,609 201,068
Operating Expenses 2 189,681 195,612 197,571 206,623 207,721
Offsets
RECB (Schedule 26) (103,236) (111,754) (113,474) (110,247) (106,160)
MVP (Schedule 26-A) (21,896) (33,435) (39,537) (38,883) (40,462)
Point-to-Point (Schedule 7 & 8) (9,000) (8,400) (8,400) (8,400) (8,400)
Load Dispatch (Schedule 1) (16,500) (17,172) (17,688) (18,218) (18,765)
Other Operating Revenue (1,300) (1,300) (1,300) (1,300) (1,300)
Over/(Under) collection - - - - -
Network Revenue Requirement 571,471 592,092 604,067 641,275 658,888
Network True-up Adjustments (8,159) (2,414) - - -
Network Billed Revenue $ 563,312 $ 589,678 $ 604,067 $ 641,275 $ 658,888
Network Billed Revenue (Oct 2016) $ 563,312 $ 586,490 $ 603,808 $ 633,119 $ -
Network Billed Change from Oct 2016 3 $ - $ 3,188 $ 259 $ 8,156

atcllc.com 7
Asset Management

atcllc.com 8
• From a reliability perspective, ATC is top quartile or better compared to our industry peers
• Improved Maintenance practices– Identified efficiencies to reduce costs coming to fruition– Increased funding for greater needs to improve safety, reliability and long-term
savings– Overall spending remains nearly flat
• Vegetation Management– Emerald Ash Borer (EAB) advancement is slower than anticipated– Right-of-way reclamation leading to lower anticipated costs within 5 years
• LiDAR (Light Detection and Ranging)– Survey collection method for transmission lines to verify field conditions match
system of record– Data collection is tapering down after 2017– Processing and modeling of collected data to continue for another 3 to 4 years
Asset Management

atcllc.com 9
Asset Management – Asset Renewal Drivers

atcllc.com 10
Other MISO Charges

atcllc.com 11
Regional Cost Sharing Impact on ATC Zone
• The MISO estimated charges to the ATC pricing zone are updatedevery June and December
– MISO projections for the total RECB charges can be found at the following websites:
• https://www.misoenergy.org/Planning/TransmissionExpansionPlanning/Pages/MTEPStudies.aspx
– Under the MTEP Study Information heading select: Indicative annual charges for approved BRP, GIP
and MEP (Schedule 26) (Tab – Indicative Sch 26 Charges)
– MISO projections for Multi Value Project (MVP) charges can be found at the following websites:
• https://www.misoenergy.org/Planning/TransmissionExpansionPlanning/Pages/MTEPStudies.aspx
– Under the MTEP Study Information heading select: Indicative annual charges for approved Multi Value
Projects (Schedule 26-A) (Tab – Schedule 26-A Projections)

atcllc.com 12
Capital Investment
atcllc.com 13
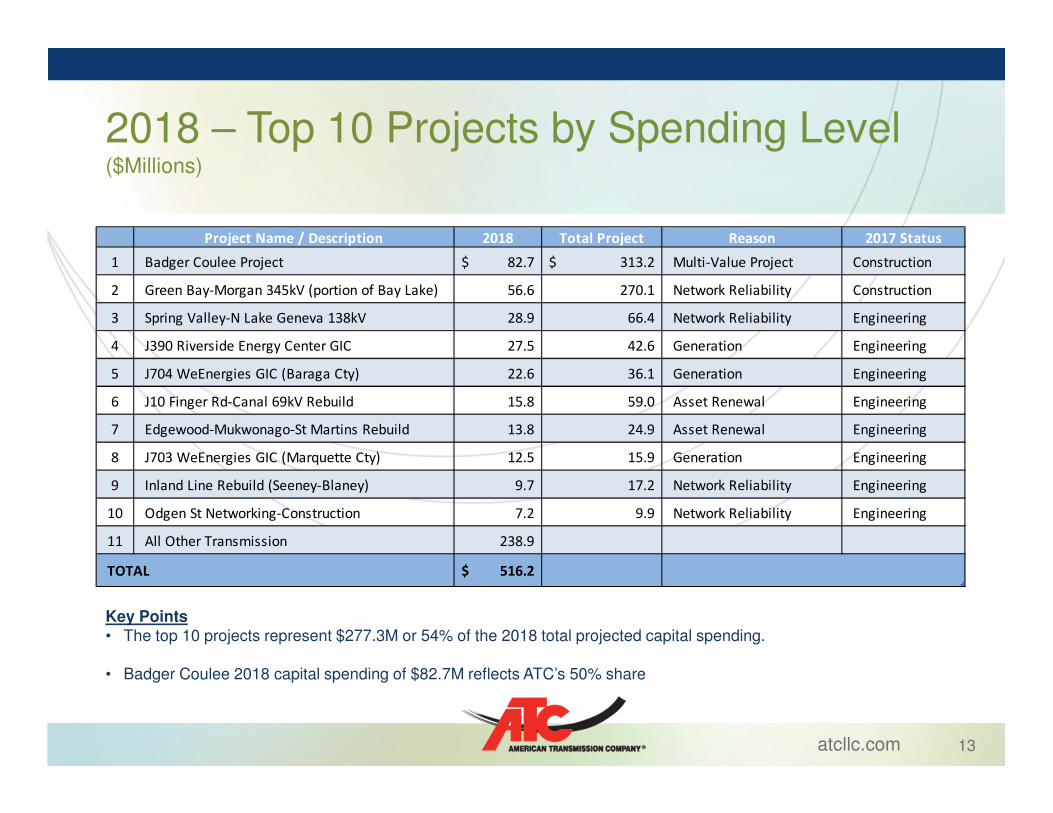
2018 – Top 10 Projects by Spending Level ($Millions)
Column1 Project Name / Description 2018 Total Project Reason 2017 Status
1 Badger Coulee Project 82.7$ 313.2$ Multi-Value Project Construction
2 Green Bay-Morgan 345kV (portion of Bay Lake) 56.6 270.1 Network Reliability Construction
3 Spring Valley-N Lake Geneva 138kV 28.9 66.4 Network Reliability Engineering
4 J390 Riverside Energy Center GIC 27.5 42.6 Generation Engineering
5 J704 WeEnergies GIC (Baraga Cty) 22.6 36.1 Generation Engineering
6 J10 Finger Rd-Canal 69kV Rebuild 15.8 59.0 Asset Renewal Engineering
7 Edgewood-Mukwonago-St Martins Rebuild 13.8 24.9 Asset Renewal Engineering
8 J703 WeEnergies GIC (Marquette Cty) 12.5 15.9 Generation Engineering
9 Inland Line Rebuild (Seeney-Blaney) 9.7 17.2 Network Reliability Engineering
10 Odgen St Networking-Construction 7.2 9.9 Network Reliability Engineering
11 All Other Transmission 238.9
TOTAL 516.2$
Key Points • The top 10 projects represent $277.3M or 54% of the 2018 total projected capital spending.
• Badger Coulee 2018 capital spending of $82.7M reflects ATC’s 50% share

atcllc.com 14
Capital History and Forecast by Category($Millions)
• 2018 capital expenditures were estimated to be $489.1M in the October 2016 Customer Presentation

atcllc.com 15
2018 – Top 5 Project O&M Drivers ($Thousands)
• The top 5 projects represent 38% of the 2018 total Project O&M
Project Name / Description Project Type
2018
Total
1 Projects resulting from NERC Alerts / Ratings Issues Asset Renewals 1,140$
2 Inland Line Rebuild (Seeney-Blaney) Asset Renewals 599$
3 Wood Structure Replacements Maintenance 441$
4 Shunt Installs South Central WI Maintenance 327$
5 X42 POE SGL 29-30 172-173 Rerate Asset Renewals 306$
6 All Others 4,629$
TOTAL 7,443$

atcllc.com 16
2018 – Top 5 Pre-cert Projects ($Thousands)
Column1Project Name / Description 2018
1 Cardinal Hickory Creek 3,886$
2 Bayport to Pioneer Line Rebuild 2,900
3 Crivitz-Sobieski Rebuild 800
4 Custer-New Holstein Rebuild 632
5 Wesmark-Rapids Manwrap Rebuild 632
6 Other Projects (5 Projects) 602
TOTAL 9,451$
Key Points The top 2 projects represent 72% of the 2018 total precertification expense

atcllc.com 17
Questions

atcllc.com 18
Appendix

atcllc.com 19
Five-Year Outlook ($Thousands)
• The RECB (line 11) and MVP (line 12) amounts represent credits to ATC’s expected portion of RECB and MVP revenues received from MISO relating to ATC projects
• Each company should use their load ratio share multiplied by the Network Billed Revenue (line 19) above to arrive at an estimate of Schedule 9 (Network Service) expense for each year
(C) (D) (E) (F) (G) (H) (I) (J) (K) (L)
(1) Return on Rate Base 270,229 37.5% 284,975 37.3% 286,629 36.5% 297,811 36.4% 304,168 36.5%
(2) Income Taxes 110,245 15.3% 116,078 15.2% 114,243 14.6% 118,281 14.5% 121,017 14.5%
(3) Depreciation 154,717 21.5% 167,488 21.9% 186,021 23.7% 195,609 23.9% 201,068 24.1%
(4) Capital Costs 535,191 74.2% 568,540 74.4% 586,894 74.8% 611,701 74.8% 626,252 75.1%
Total O&M Expense 154,428 155,257 155,257 155,257 155,257
Non-Recovered O&M Expense (494) (518) (515) (541) (542)
(5) Operations and Maintenance Expense 153,934 21.3% 154,740 20.2% 154,743 19.7% 154,716 18.9% 154,715 18.6%
(6) Project O&M 7,143 1.0% 7,443 11,199 13,318 13,644
(7) Precertification Expense 4,726 0.7% 9,451 1.2% 5,816 0.7% 12,000 1.5% 12,000 1.4%
(8) Property and Other Taxes 20,211 2.8% 23,979 3.1% 25,814 3.3% 26,589 3.2% 27,362 3.3%
(9) Operatng Expenses 186,013 25.8% 195,612 25.6% 197,571 25.2% 206,623 25.2% 207,721 24.9%
(10) Total Revenue Requirement 721,204 100.0% 764,153 100.0% 784,465 100.0% 818,324 100.0% 833,974 100.0%
Offsets
(11) RECB (102,764) (111,754) (113,474) (110,247) (106,160)
(12) MVP (21,943) (33,435) (39,537) (38,883) (40,462)
(13) Other MISO Revenue (24,837) (25,572) (26,088) (26,618) (27,165)
(14) Other Operating Revenue (1,503) (1,300) (1,300) (1,300) (1,300)
(15) (Over)/Under Network Collection 1,313 - - - -
(16) 2015 True-up (920) - - - -
(17) 2016 True-up (7,239) (380) - - -
(18) 2017 True-up - (2,034) - - -
(19) Network Billed Revenue 563,312 589,678 604,067 641,275 658,888
2020 Forecast 2021 Forecast2017 6+6 Forecast 2018 Forecast 2019 Forecast

atcllc.com 20
Timing of True-ups
1) Annual Rates are posted on OASIS on or before October 1st and True-ups on or before June 1st
2) ATC is required to refund any over-collected network amounts, plus interest, within two years subsequent to the rate year, with the option to accelerate all or a portion of any such refund, and is permitted to include any under-collected amounts, plus interest, in annual network billings two fiscal year subsequent to the rate year
6/1/2016
CalculateActual
2015 TU
FERCFiling Deadline1
2016 Rate
1/1/16 - 12/31/16Projected '16 RR
+/- Prior Year True-ups + Interest2
2017 Rate
1/1/16 - 12/31/17Projected '17 RR
+/- Prior Year True-ups + Interest2
2018 Rate
1/1/18 - 12/31/18Projected '18 RR
+/- Prior Year True-ups + Interest2
Annual Customer Rate
6/1/2017
CalculateActual
2016 TU
10/1/2016
CalculateProjected 2016 RR
10/1/2017
CalculateProjected 2018 RR
6/1/2018
CalculateActual
2017 TU
10/1/2018
CalculateProjected 2019 RR
1/1/20171/1/2016 1/1/2018 1/1/2019