2 Mercado Mundial del Vino Evolución,TendenciasyPerspectivas20WEB-PAC/ocm... · Variación de la...
22
Política Agraria 5º agrónomos EL MERCADO MUNDIAL DEL VINO: EVOLUCIÓN, TENDENCIAS Y PERSPECTIVAS BERNARDO ALBIÑANA Curso 2006-07
Transcript of 2 Mercado Mundial del Vino Evolución,TendenciasyPerspectivas20WEB-PAC/ocm... · Variación de la...
Política Agraria5º agrónomos
EL MERCADO MUNDIAL DEL
VINO:EVOLUCIÓN, TENDENCIAS Y PERSPECTIVAS
BERNARDO ALBIÑANA
Curso 2006-07

SUPERFICIE
DE
VIÑEDO
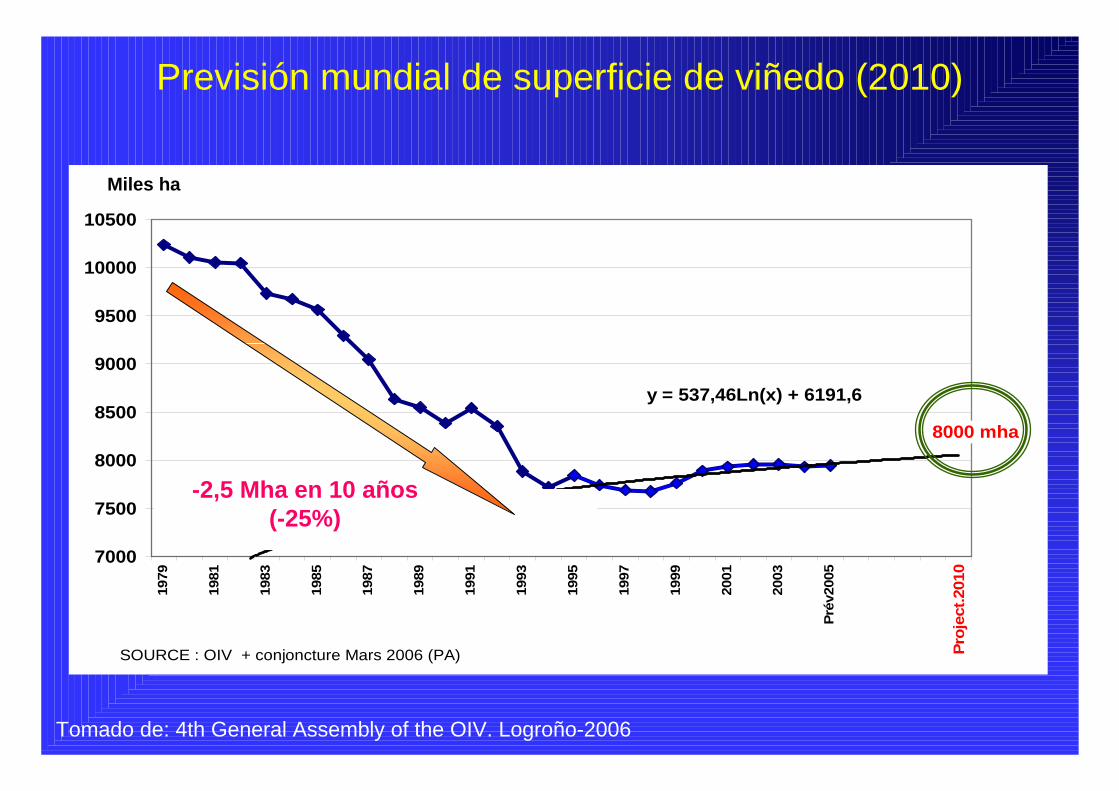
y = 537,46Ln(x) + 6191,6
7000
7500
8000
8500
9000
9500
10000
10500
1979
1981
1983
1985
1987
1989
1991
1993
1995
1997
1999
2001
2003
Prév
2005
SOURCE : OIV + conjoncture Mars 2006 (PA) Proj
ect.2
010
8000 mha
Tomado de: 4th General Assembly of the OIV. Logroño-2006
Previsión mundial de superficie de viñedo (2010)
Miles ha
-2,5 Mha en 10 años(-25%)
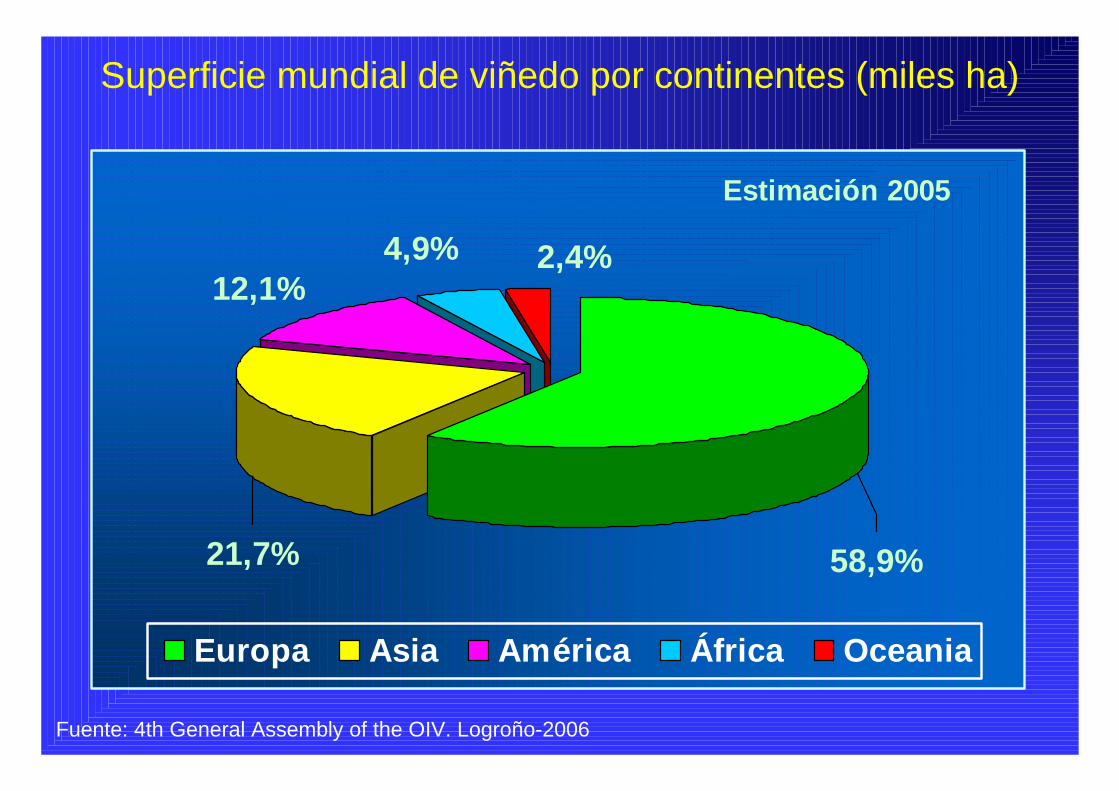
Superficie mundial de viñedo por continentes (miles ha)
Estimación 2005
12,1%2,4%
58,9%
4,9%
21,7%
Europa Asia América África Oceania
Fuente: 4th General Assembly of the OIV. Logroño-2006

Superficie de viñedo en los 12 principales países
1.180
890847
570 487399
296 250 218 217 191 167
0
200
400
600
800
1.000
1.200
Mile
s ha
ESFran
cia Italia
Turkia
China
USA
Iran
Portugal
Ruman
iaArgen
tina
Chile
Austra
liaEstimación 2005
Fuente: 4th General Assembly of the OIV. Logroño-2006
25%
28%41%
87%
19%18%
62%
23% 20%
84%
ES: España

Variación de la superficie de viñedo por países (1971-75/2001)
-316
-403
-461
-106
-81
135
-118
48
13
80
-550 -500 -450 -400 -350 -300 -250 -200 -150 -100 -50 0 50 100 150 200
España
Francia
Italia
Portugal
Grecia
USA
Argentina
Chile
Sudáfrica
Australia
Miles ha
Fuente: A partir de Federación Española del Vino. 2004
-1367
77
-20,4%
-30,6%
-33,7%
-29,9%
-39,9%
48,2%
-36,5%
36,9%
12,4%
117,7%
Resto
TOTAL
-20,2%
-20,8%
-859
-2068

PRODUCCIONES
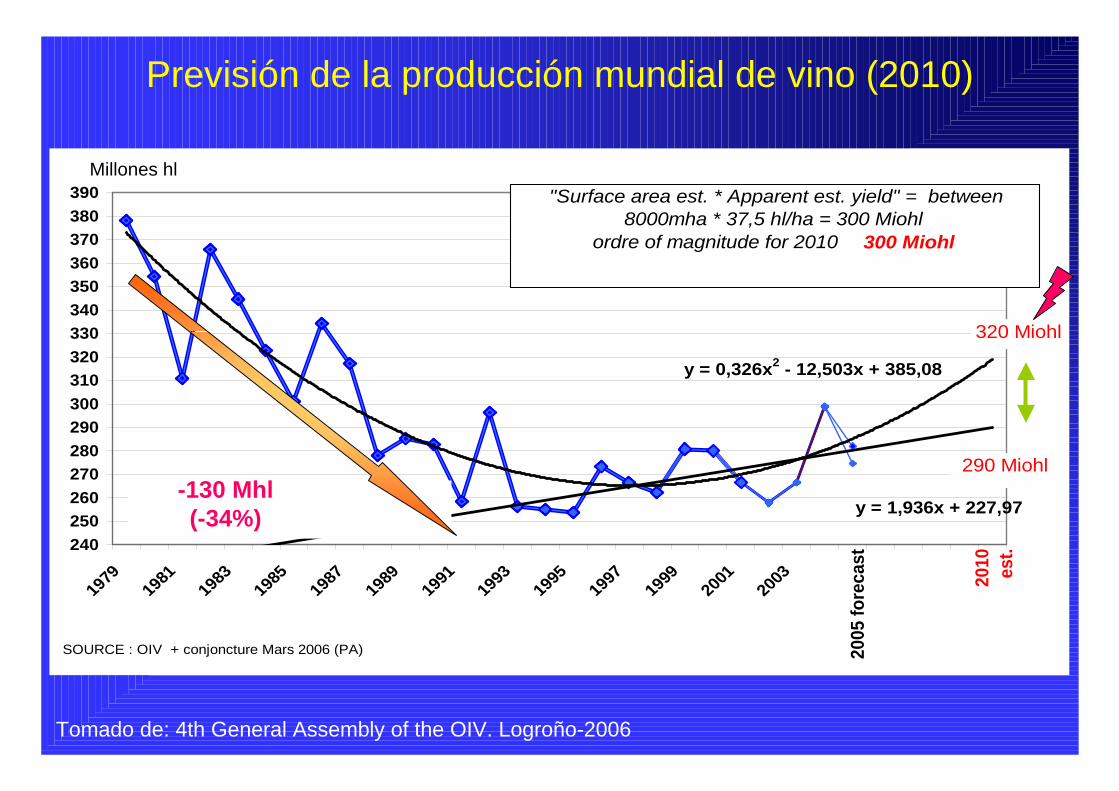
y = 1,936x + 227,97
y = 0,326x2 - 12,503x + 385,08
240250260270280290300310320330340350360370380390
1979
1981
1983
1985
1987
1989
1991
1993
1995
1997
1999
2001
2003 20
10 est.
320 Miohl
290 Miohl
"Surface area est. * Apparent est. yield" = between 8000mha * 37,5 hl/ha = 300 Miohl
ordre of magnitude for 2010 300 Miohl
SOURCE : OIV + conjoncture Mars 2006 (PA) 2005
fore
cast
Millones hl
Tomado de: 4th General Assembly of the OIV. Logroño-2006
Previsión de la producción mundial de vino (2010)
-130 Mhl(-34%)
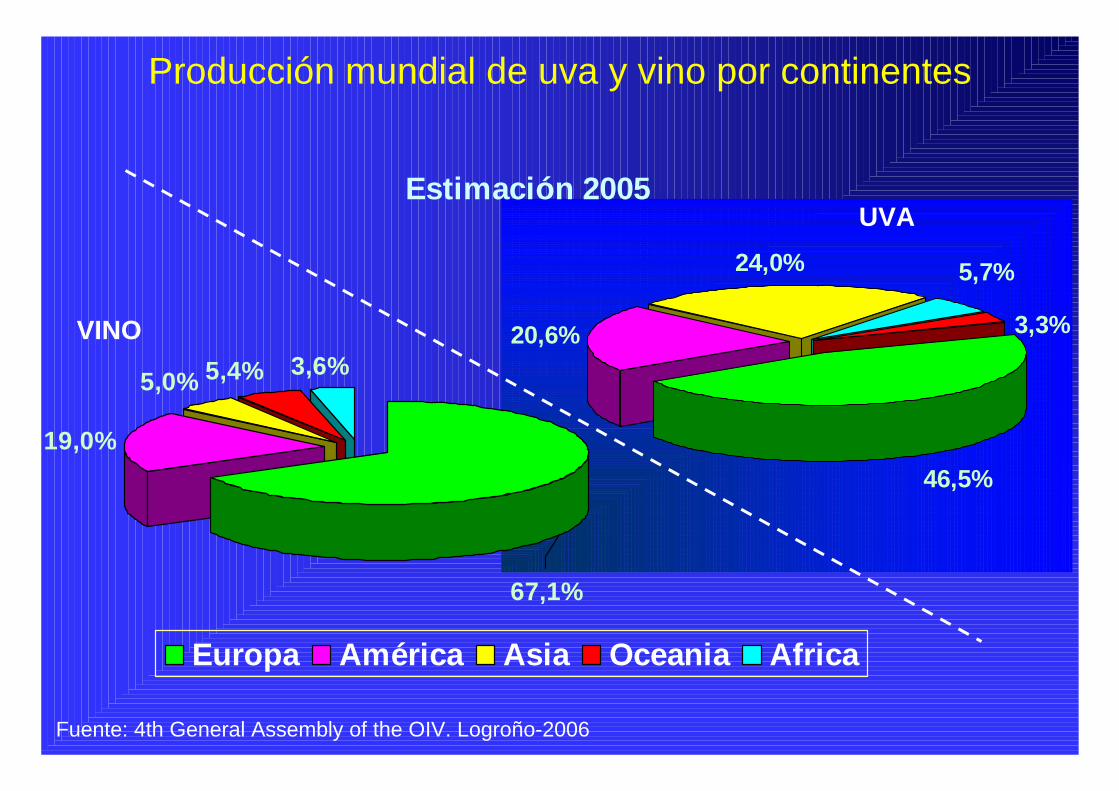
Producción mundial de uva y vino por continentes
Fuente: 4th General Assembly of the OIV. Logroño-2006
46,5%
20,6%
24,0% 5,7%
3,3%
UVAEstimación 2005
5,0% 5,4% 3,6%
19,0%
67,1%
Europa América Asia Oceania Africa
VINO
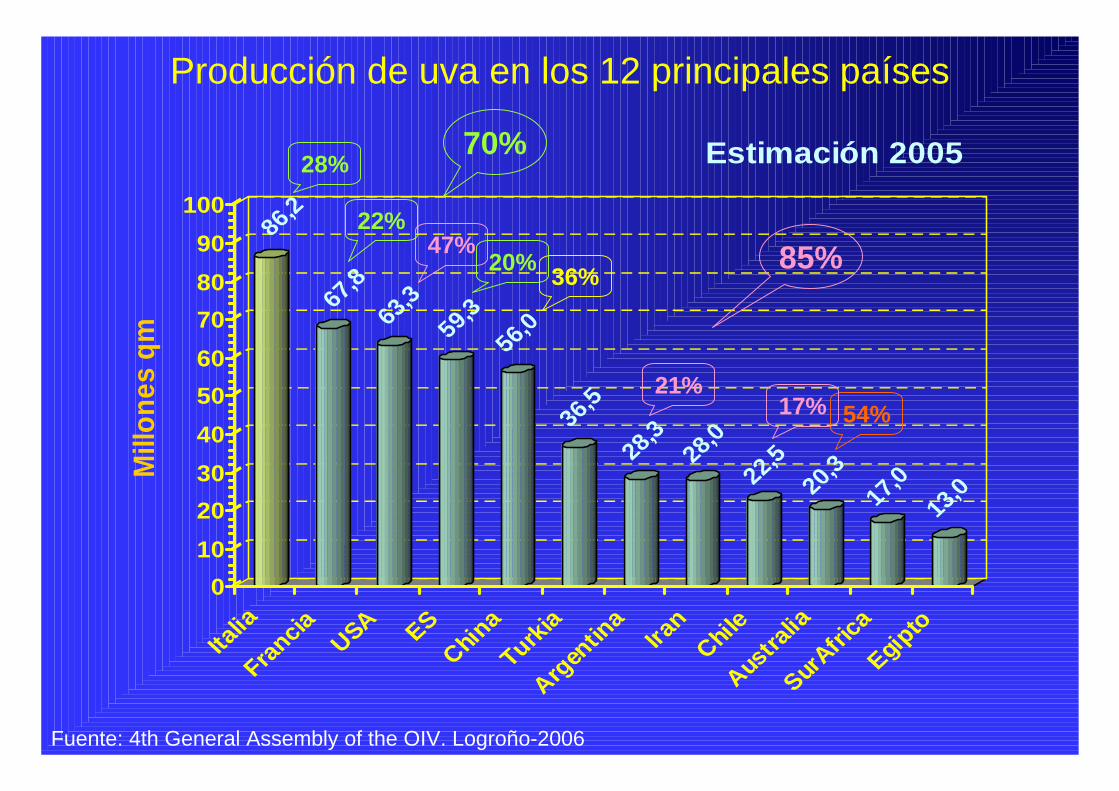
Producción de uva en los 12 principales países
86,2
67,8
63,3
59,3
56,0
36,5
28,3
28,0
22,5
20,3
17,0
13,0
0102030405060708090
100
Mill
ones
qm
Italia
Francia USA ES
China
Turkia
Argentin
aIra
nChil
eAus
tralia
SurAfric
aEgip
toEstimación 2005
Fuente: 4th General Assembly of the OIV. Logroño-2006
28%
36%47%
54%
22%20%
70%
21%17%
85%
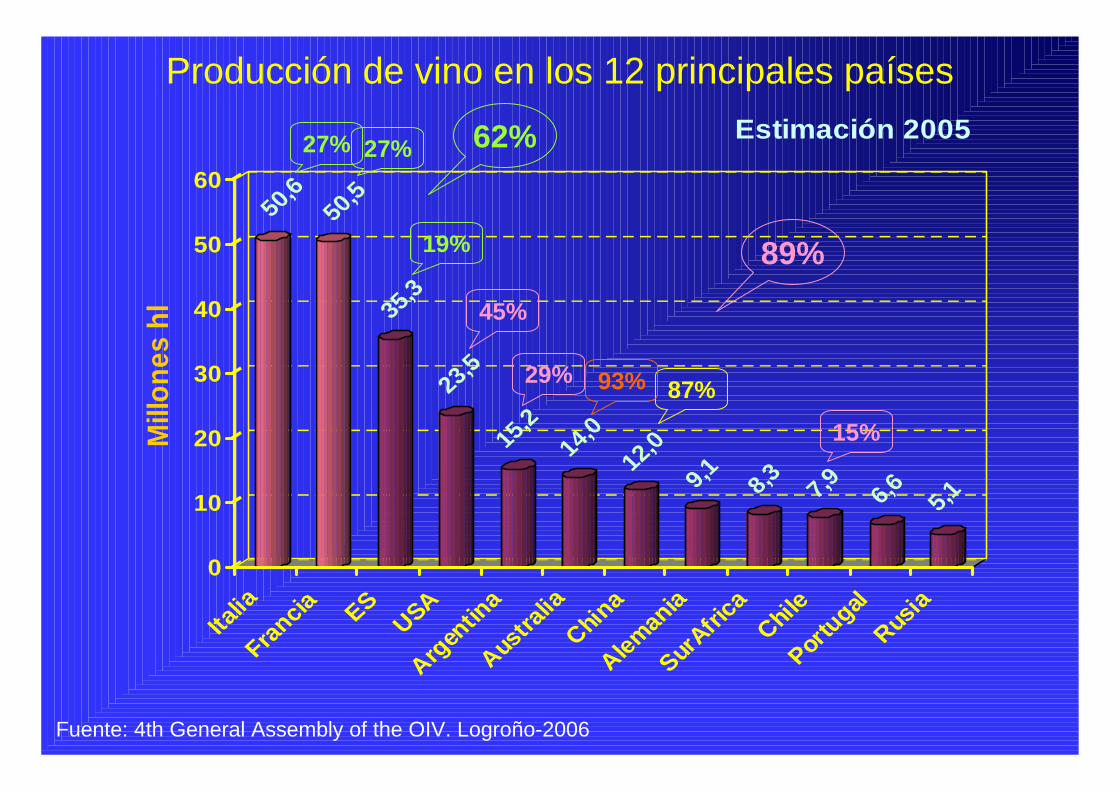
Producción de vino en los 12 principales países
50,6
50,5
35,3
23,5
15,2
14,0
12,0
9,1 8,3 7,9 6,6 5,1
0
10
20
30
40
50
60M
illon
es h
l
Italia
Francia ESUSA
Argentin
aAus
tralia
China
Aleman
iaSurA
frica
Chile
PortugalRus
ia
Estimación 2005
Fuente: 4th General Assembly of the OIV. Logroño-2006
71,29 76,5 7 76 ,2 8 74 ,38 7 7,51 8 2,02 76,96 77,81 79 ,4 84 ,4 4 82 ,61
27%
87%
45%
93%
27%
19%
62%
29%
15%
89%
CONSUMO
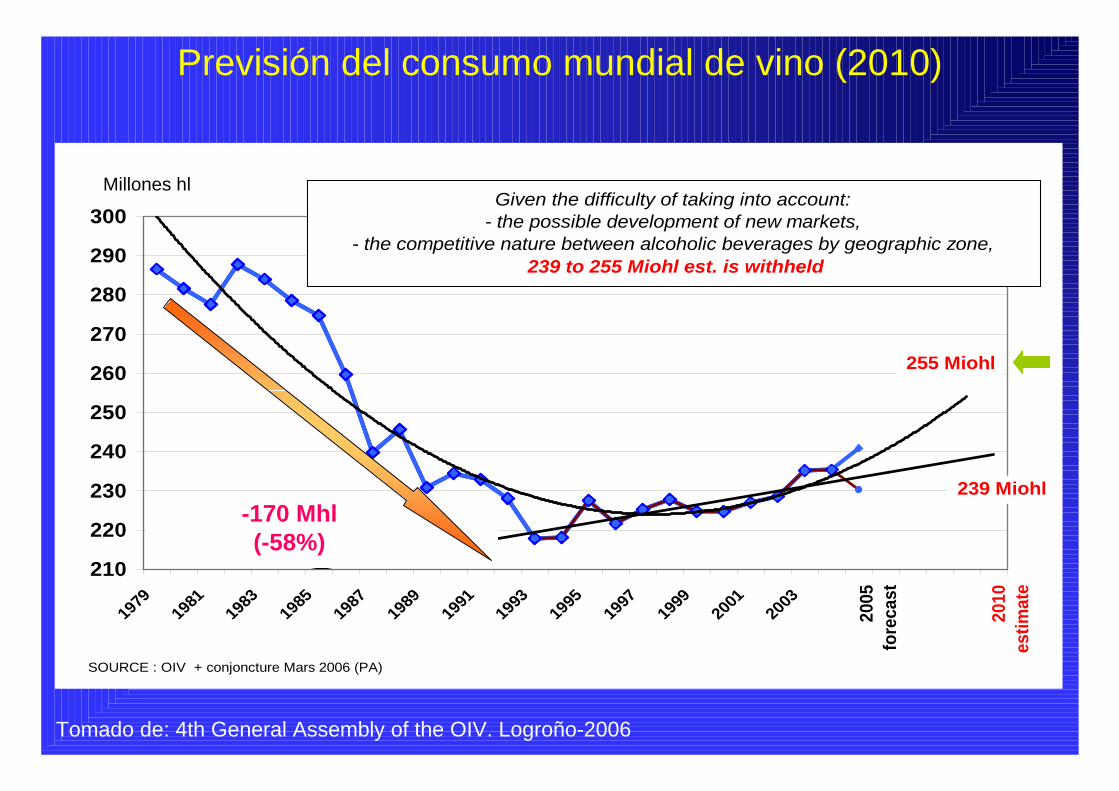
Previsión del consumo mundial de vino (2010)
Tomado de: 4th General Assembly of the OIV. Logroño-2006
1000 hl
210
220
230
240
250
260
270
280
290
300
1979
1981
1983
1985
1987
1989
1991
1993
1995
1997
1999
2001
2003
2010
es
timat
e
239 Miohl
Given the difficulty of taking into account:- the possible development of new markets,
- the competitive nature between alcoholic beverages by geographic zone, 239 to 255 Miohl est. is withheld
SOURCE : OIV + conjoncture Mars 2006 (PA)
255 Miohl
200
5 fo
reca
st
Millones hl
-170 Mhl(-58%)
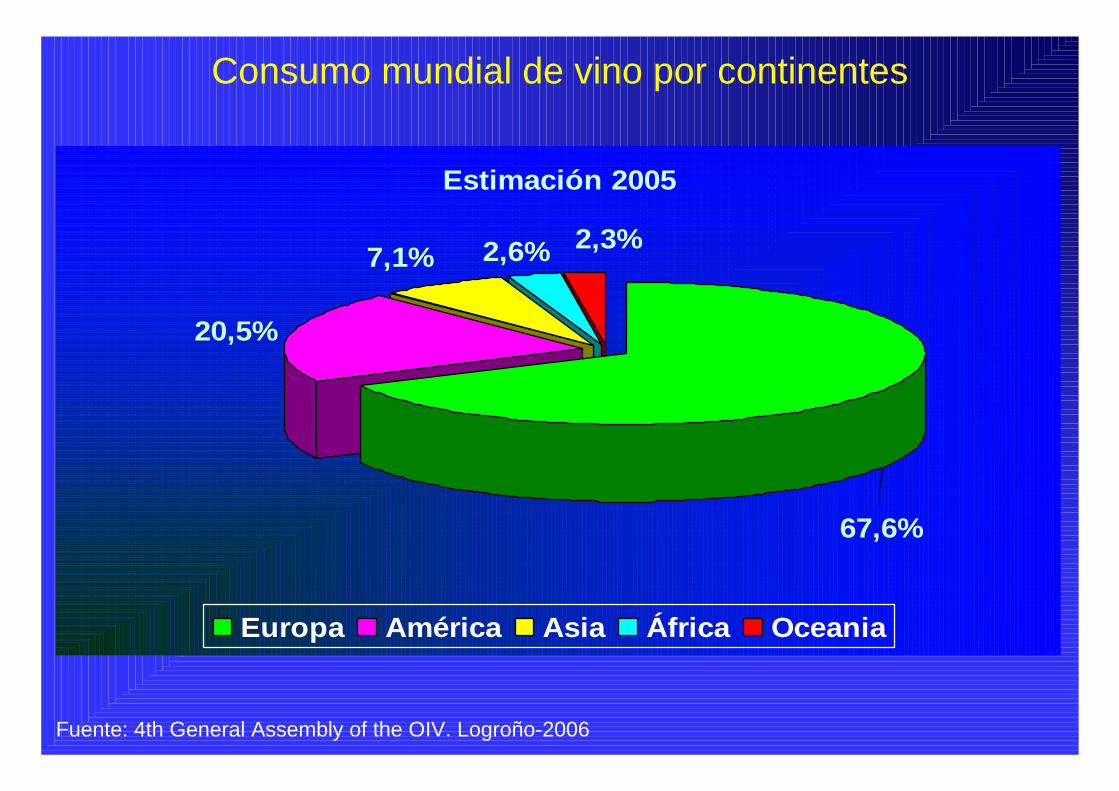
Consumo mundial de vino por continentes
Fuente: 4th General Assembly of the OIV. Logroño-2006
Estimación 2005
20,5%
7,1% 2,6% 2,3%
67,6%
Europa América Asia África Oceania

Consumo de vino en los 12 principales países
32,6
28,0
25,4
19,6
13,7
13,3
12,9
11,0
10,2
4,7 4,5 3,5
0
5
10
15
20
25
30
35
40M
illon
es h
l
Francia Ita
liaUSA
Aleman
ia ESChin
a UKArg
entin
aRus
iaPor
tugalAus
tralia
Hungria
Estimación 2005
Fuente: 4th General Assembly of the OIV. Logroño-2006
20%
18%
12%
59%
9% 87%
45%
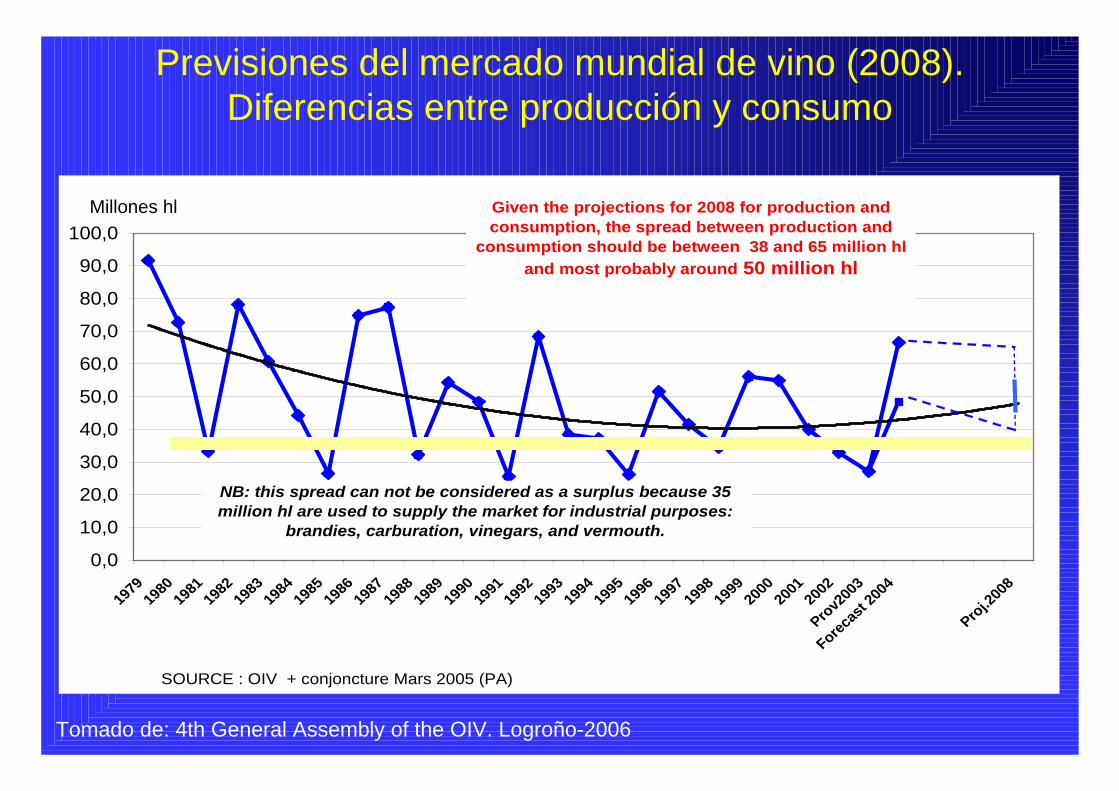
Previsiones del mercado mundial de vino (2008).Diferencias entre producción y consumo
Tomado de: 4th General Assembly of the OIV. Logroño-2006
1000 hl
0,0
10,0
20,0
30,0
40,0
50,0
60,0
70,0
80,0
90,0
100,0
1979
1980
1981
1982
1983
1984
1985
1986
1987
1988
1989
1990
1991
1992
1993
1994
1995
1996
1997
1998
1999
2000
2001
2002
Prov200
3
Forecas
t 200
4
Proj.200
8
SOURCE : OIV + conjoncture Mars 2005 (PA)
NB: this spread can not be considered as a surplus because 35 million hl are used to supply the market for industrial purposes:
brandies, carburation, vinegars, and vermouth.
Given the projections for 2008 for production and consumption, the spread between production and
consumption should be between 38 and 65 million hl and most probably around 50 million hl
Millones hl
COMERCIOINTERNACIONAL
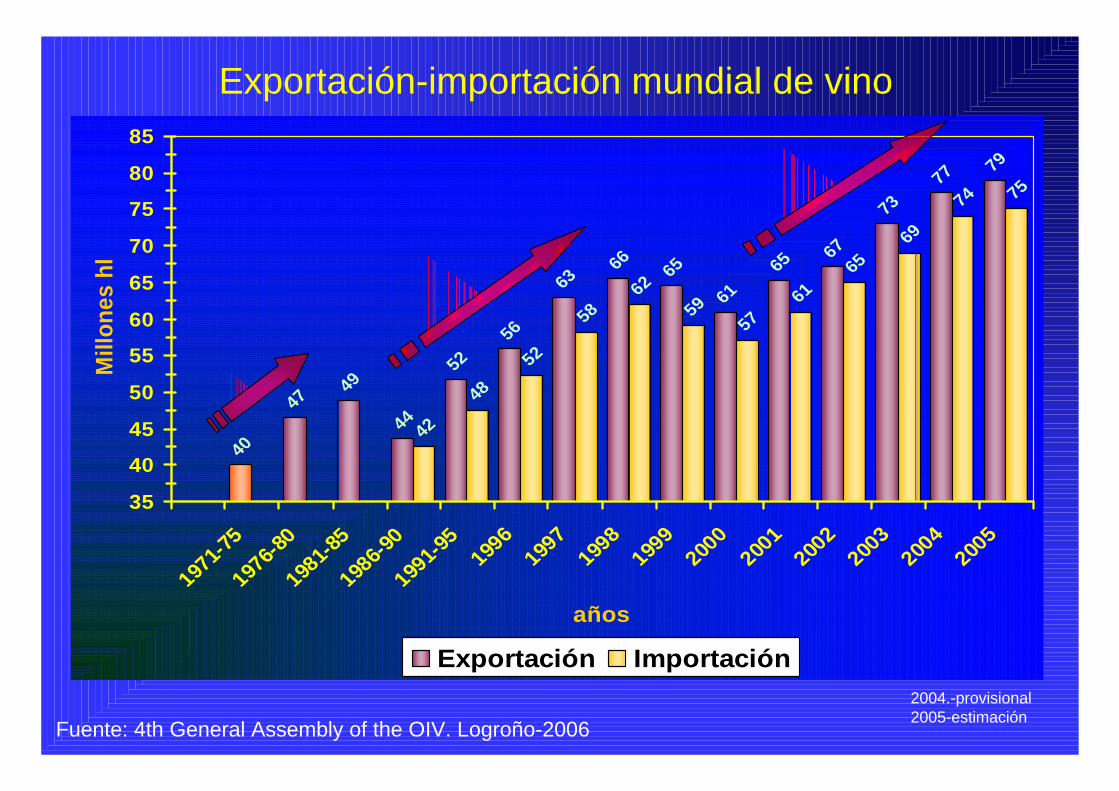
Exportación-importación mundial de vino
40
47
49
44
52
56
63
66 65
61
65
67
73
77
79
42
48
52
58
62
59
57
61
65
69
74 75
35
40
45
50
55
60
65
70
75
80
85
1971-7
5197
6-80
1981-8
5198
6-90
1991-9
5199
6199
7199
8199
9200
0200
1200
2200
3200
4200
5
años
Mill
ones
hl
Exportación Importación
Fuente: 4th General Assembly of the OIV. Logroño-20062004.-provisional2005-estimación
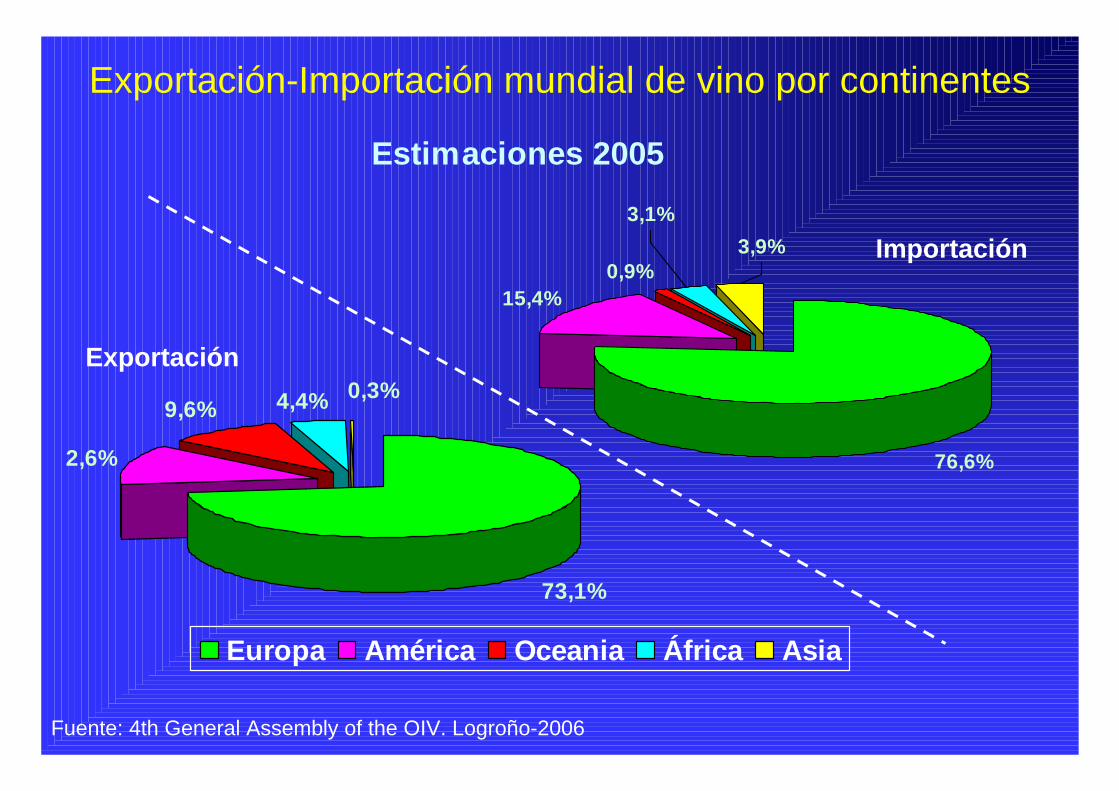
Exportación-Importación mundial de vino por continentes
Estimaciones 2005
73,1%
2,6%
9,6% 4,4% 0,3%
Europa América Oceania África Asia
Fuente: 4th General Assembly of the OIV. Logroño-2006
76,6%
15,4%0,9%
3,1%3,9%
Exportación
Importación
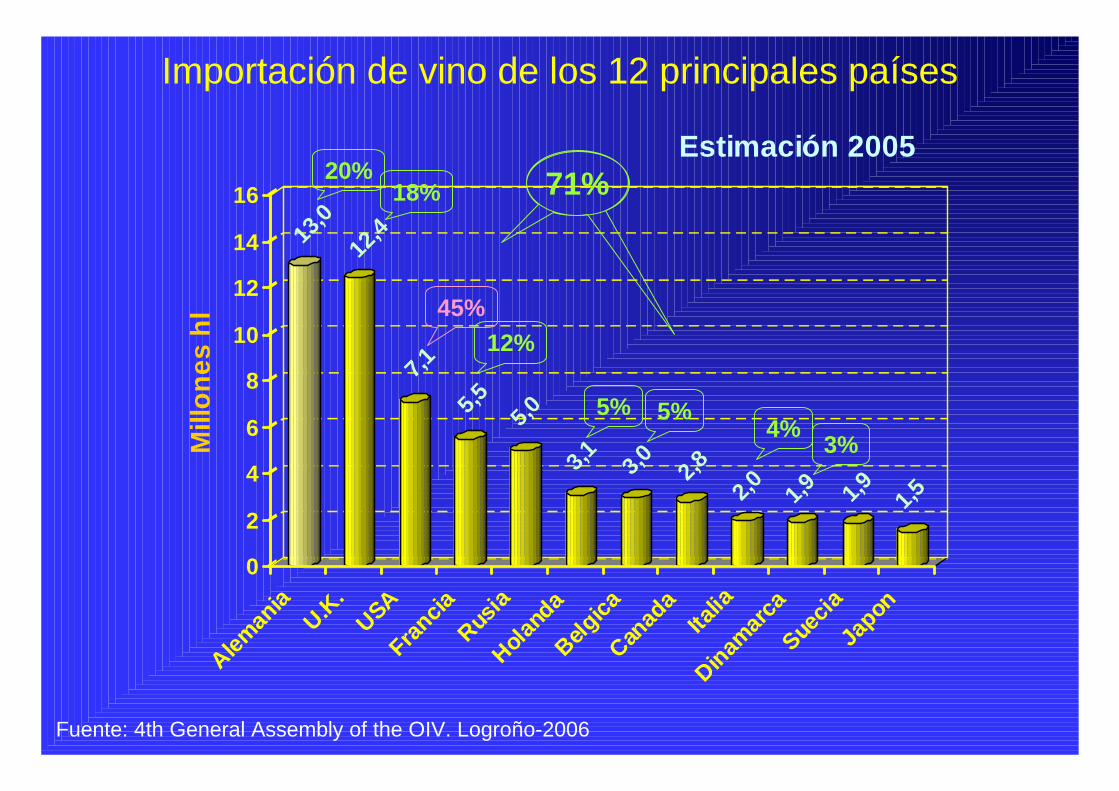
Importación de vino de los 12 principales países
Fuente: 4th General Assembly of the OIV. Logroño-2006
13,0
12,4
7,1
5,5 5,0
3,1 3,0 2,8
2,0 1,9 1,9 1,5
0
2
4
6
8
10
12
14
16M
illon
es h
l
Aleman
iaU.K
.USA
Francia
Rusia
Holand
aBelg
icaCan
ada
Italia
Dinamarc
aSue
ciaJa
pon
Estimación 200520%
18%
12%
5%
45%
5%4%
71%
3%
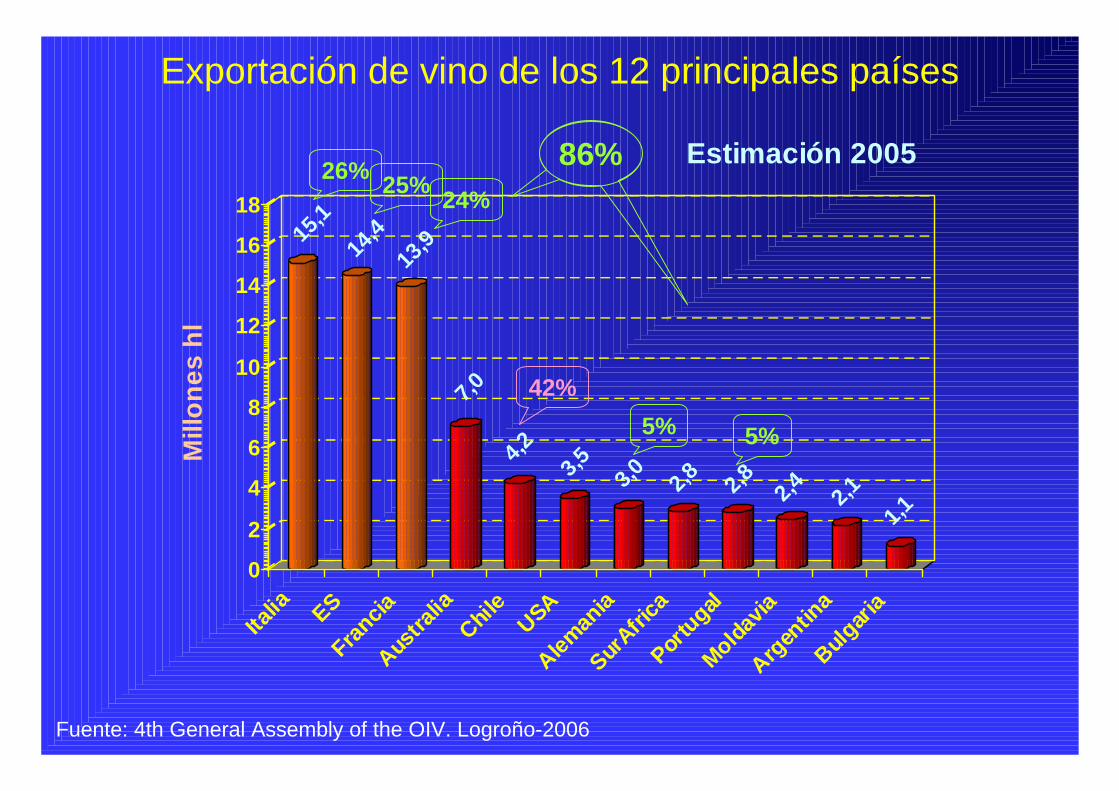
Exportación de vino de los 12 principales países
Fuente: 4th General Assembly of the OIV. Logroño-2006
15,1
14,4
13,9
7,04,2 3,5 3,0 2,8 2,8 2,4 2,1
1,1
0
2
4
6
8
10
12
14
16
18M
illon
es h
l
Italia ES
Francia
Austra
liaChil
eUSA
Aleman
iaSur
Africa
Portugal
Moldavia
Argen
tina
Bulgari
a
Estimación 200526% 25% 24%
5% 5%
86%
42%
Bibliografía
OIV, 2006. 4th General Assembly of the OIV. Logroño• http://www.oiv.int/es/accueil/index.php• http://news.reseau-
concept.net/images/oiv_es/Client/Conjoncture_mars_2006_ES.pdf
• http://www.oiv2006esp.org/doc_comunes/esp_informeFedericoCastellucci.pdf
• http://news.reseau-concept.net/images/oiv_es/Client/Commentaire_diapo_presentation_stat_Logrono_2006_ES.pdf
Federación Española del Vino, 2004. El mundo del vino en cifras: 2003.– http://www.fev.es/– http://www.fev.es/el_mundo_del_vIno_en_2005.pdf