08 16 investor presentation
39
Investor Presentation August 2016
-
Upload
investorplygem -
Category
Investor Relations
-
view
1.588 -
download
0
Transcript of 08 16 investor presentation

Investor PresentationA u g u s t 2 0 1 6
These slides and the accompanying oral discussion may contain “forward-looking statements” within the meaning of the Private SecuritiesLitigation Reform Act of 1995. Such statements involve known and unknown risks, uncertainties and other factors that could cause the actualresults of Ply Gem Holdings, Inc. (the “Company”) to differ materially from the results expressed or implied, including: downturns in the homerepair and remodeling or the new construction end markets, or the economy or the availability of consumer credit; competition from otherexterior building products manufacturers and alternative building materials; inability to successfully develop new products or improve existingproducts; changes in the costs and availability of raw materials; consolidation and further growth of our customers; loss of, or a reduction inorders from, any of our significant customers; inclement weather conditions; increases in union organizing activity and work stoppages at ourfacilities or the facilities of our suppliers; our ability to employ, train and retain qualified personnel at a competitive cost; claims arising from theoperations of our various businesses prior to our acquisitions; product liability claims, including class action claims, relating to the products wemanufacture; litigation outside of product liability claims; loss of certain key personnel; interruptions in deliveries of raw materials or finishedgoods; environmental costs and liabilities; inability to realize anticipated synergies and cost savings with respect to acquisitions; manufacturing orassembly realignments; threats to, or impairments of, our intellectual property rights; increases in transportation and fuel costs; changes inforeign currency exchange and interest rates; material non-cash impairment charges; our significant amount of indebtedness; covenants in theABL Facility, the credit agreement governing our Senior Secured Term Loan Facility and the indenture governing the 6.50% Senior Notes;limitations on our net operating losses and payments under the tax receivable agreement to our stockholders; failure to successfullyconsummate and integrate acquisitions; actual or perceived security vulnerabilities or cyberattacks on our networks; failure to effectivelymanage labor inefficiencies associated with increased production and new employees added to the Company; failure to generate sufficient cashto service all of our indebtedness and make capital expenditures; control by the CI Partnerships; and the risks set forth in the Company’s filingswith the Securities and Exchange Commission. Consequently such forward-looking statements should be regarded as the Company’s currentplans, estimates and beliefs. Except as required by law, the Company does not undertake and specifically declines any obligation to publiclyrelease the results of any revisions to these forward-looking statements that may be made to reflect any future events or circumstances after thedate of such statements or to reflect the occurrence of anticipated or unanticipated events.
In addition, these slides and the accompanying oral discussion reference financial information determined by methods other than in accordance with accounting principles generally accepted in the United States of America (“GAAP”), such as adjusted EBITDA. The Company’s management uses these non-GAAP measures in its analysis of the Company’s performance. The Company believes that the presentation of certain non-GAAP measures provides useful supplemental information that is essential to a proper understanding of the operating results of the Company’s core business. These non-GAAP measures should not be viewed as a substitute for operating results determined in accordance with GAAP, nor are they necessarily comparable to non-GAAP performance measures that may be presented by other companies. A reconciliation of each non-GAAP financial measure to the most directly comparable GAAP financial measure is provided in the appendix to the slides.
LegalDisclaimer
1

Ply Gem Overview

• Exceeding $1.8 Billion in net sales (1)
• Approximately 9,000 associates
One of the Largest Manufacturers of Exterior Building and Home Improvement Products in North America
3
CompanyOverview
(1) LTM 2Q16
46%54% 46%54%
NEW CONSTRUCTION / R&R(1)WINDOWS / SIDING (1)
11%
89%
U.S. / Canada(1)
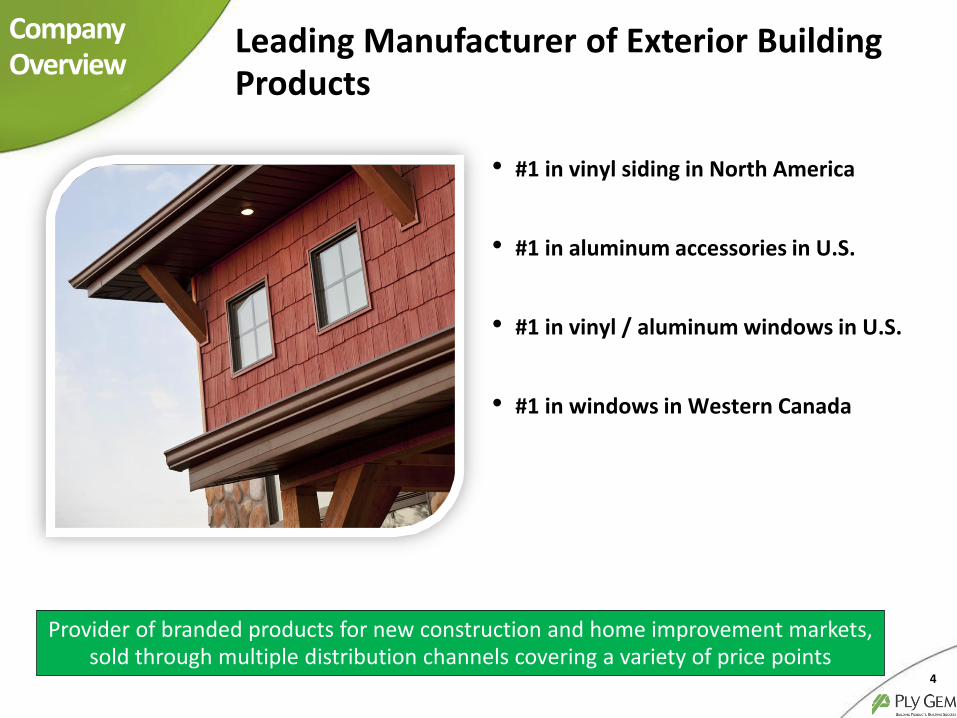
• #1 in vinyl siding in North America
• #1 in aluminum accessories in U.S.
• #1 in vinyl / aluminum windows in U.S.
• #1 in windows in Western Canada
Leading Manufacturer of Exterior Building Products
4
CompanyOverview
Provider of branded products for new construction and home improvement markets, sold through multiple distribution channels covering a variety of price points
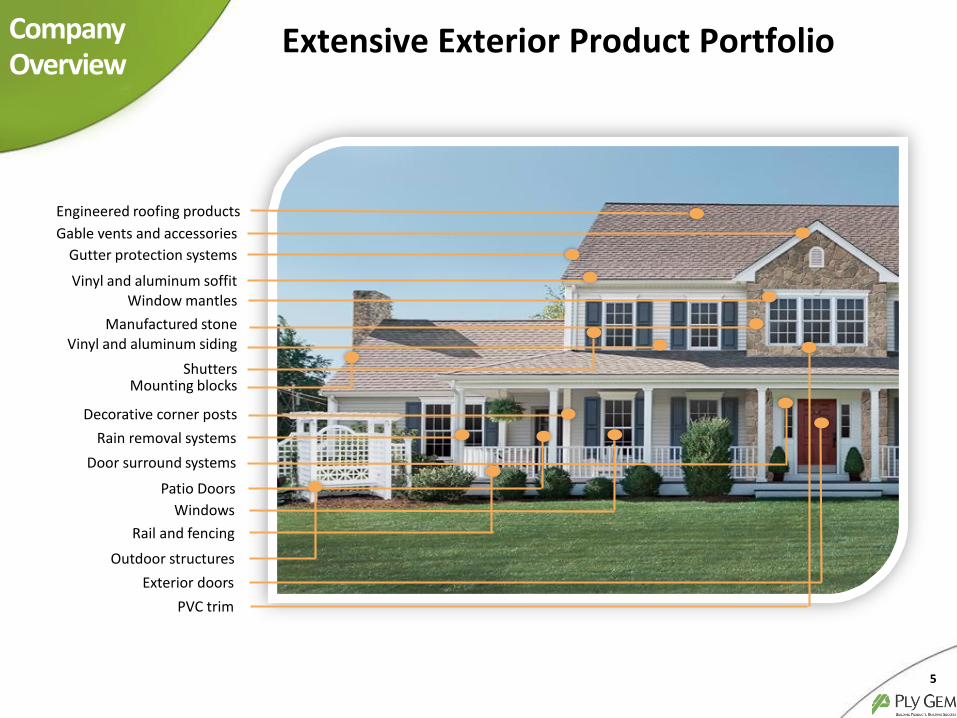
Extensive Exterior Product Portfolio
5
CompanyOverview
Engineered roofing products
Gable vents and accessories
Gutter protection systems
Vinyl and aluminum soffitWindow mantles
Manufactured stoneVinyl and aluminum siding
ShuttersMounting blocks
Decorative corner posts
Rain removal systems
Door surround systems
Patio Doors
Windows
Rail and fencing
Outdoor structures
Exterior doors
PVC trim
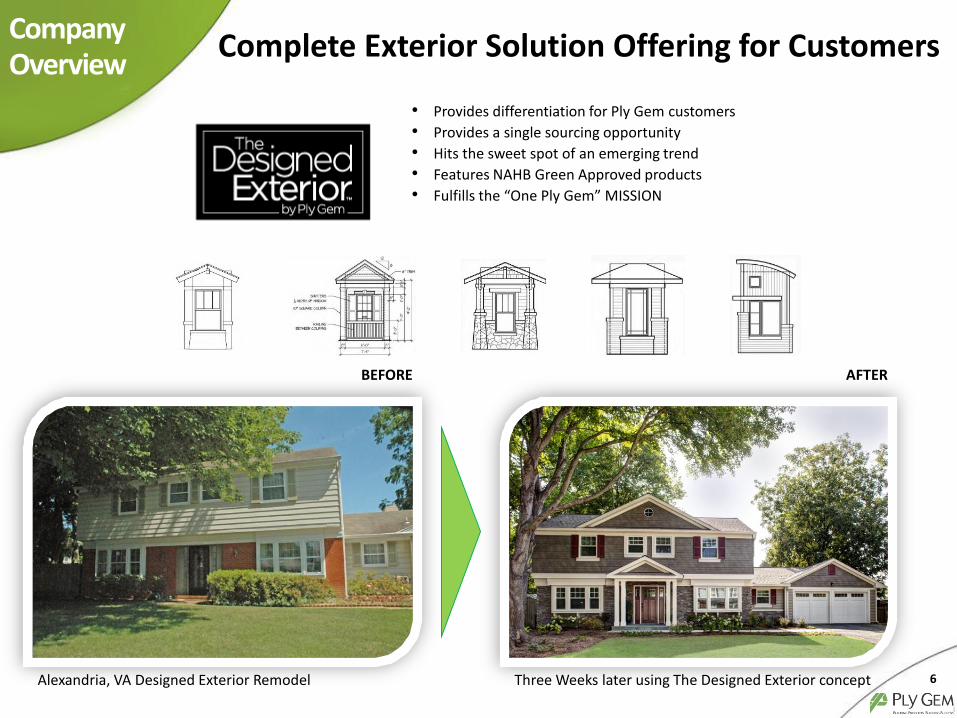
• Provides differentiation for Ply Gem customers
• Provides a single sourcing opportunity
• Hits the sweet spot of an emerging trend
• Features NAHB Green Approved products
• Fulfills the “One Ply Gem” MISSION
Alexandria, VA Designed Exterior Remodel
BEFORE
Three Weeks later using The Designed Exterior concept
AFTER
Complete Exterior Solution Offering for CustomersCompanyOverview
6
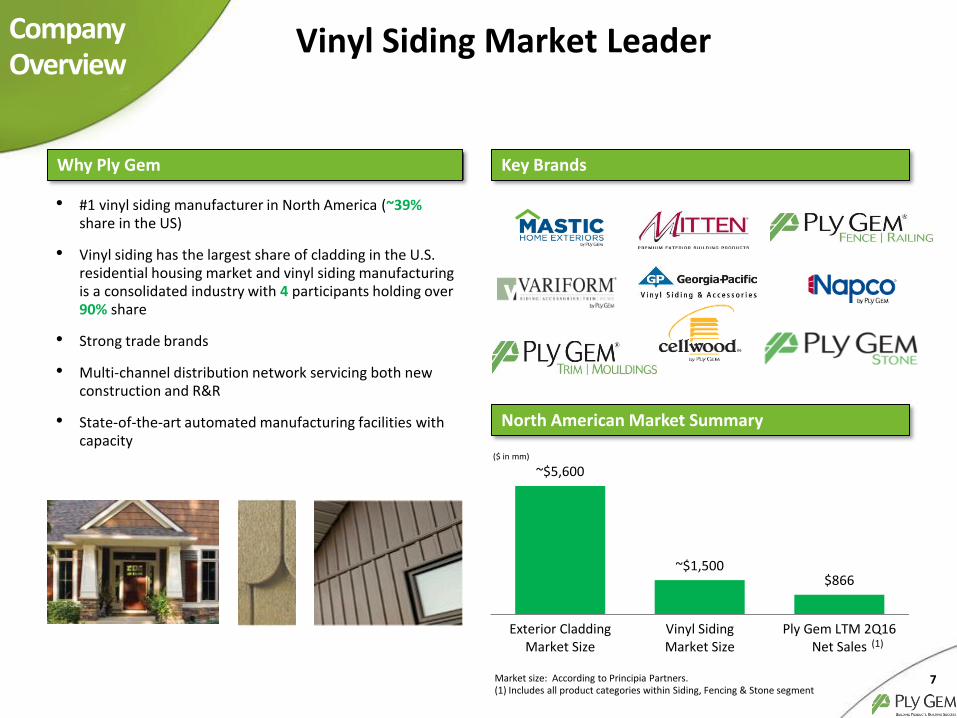
Vinyl Siding Market Leader
• #1 vinyl siding manufacturer in North America (~39% share in the US)
• Vinyl siding has the largest share of cladding in the U.S. residential housing market and vinyl siding manufacturing is a consolidated industry with 4 participants holding over 90% share
• Strong trade brands
• Multi-channel distribution network servicing both new construction and R&R
• State-of-the-art automated manufacturing facilities with capacity
~$5,600
~$1,500$866
Exterior CladdingMarket Size
Vinyl SidingMarket Size
Ply Gem LTM 2Q16Net Sales
($ in mm)
Why Ply Gem Key Brands
North American Market Summary
7
CompanyOverview
(1)
Market size: According to Principia Partners.(1) Includes all product categories within Siding, Fencing & Stone segment

• #1 vinyl and aluminum window manufacturer in the U.S.
• #1 window and door manufacturer in Western Canada
• Multi-channel distribution network servicing both new construction and R&R covering every price point
• Highly efficient, vertically integrated production
• Continued to gain market share during downturn
$9,000
$1,015
Market Size Ply Gem LTM 2Q16Net Sales
($ in mm)
Market size: Company estimate – new construction and R&R.
~
Vinyl and Aluminum Windows Market Leader
Why Ply Gem Key Brands
North American Market Summary
8
CompanyOverview
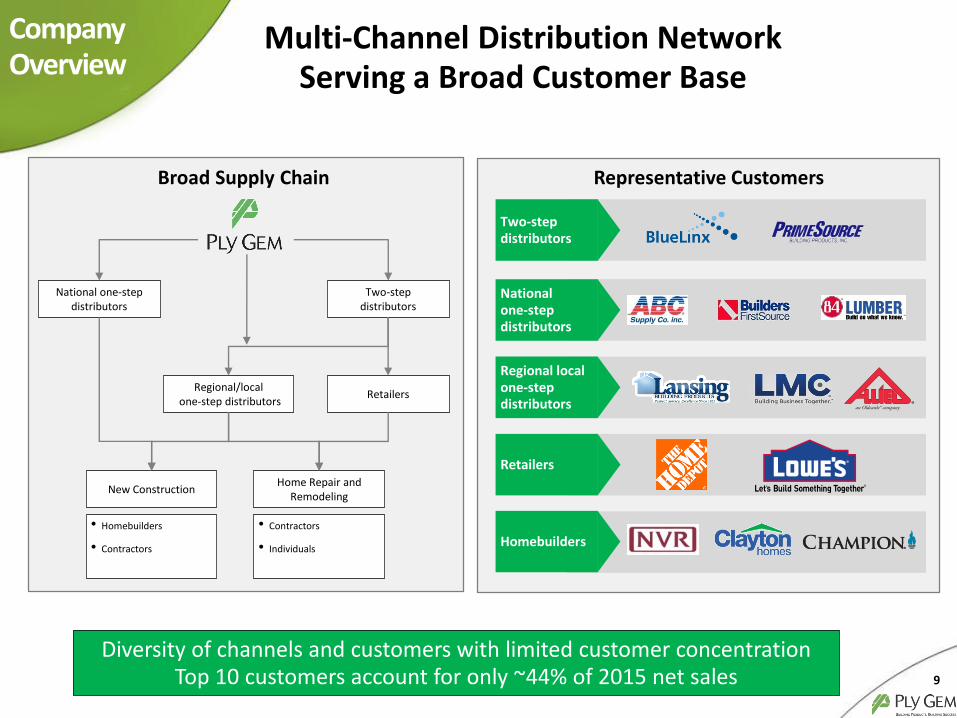
Regional local one-step distributors
Two-step distributors
National one-step distributors
Retailers
Homebuilders
New Construction
Regional/localone-step distributors
National one-stepdistributors
Retailers
Two-stepdistributors
Home Repair and Remodeling
• Homebuilders
• Contractors
• Contractors
• Individuals
Multi-Channel Distribution Network Serving a Broad Customer Base
CompanyOverview
9
Broad Supply Chain Representative Customers
Diversity of channels and customers with limited customer concentration Top 10 customers account for only ~44% of 2015 net sales
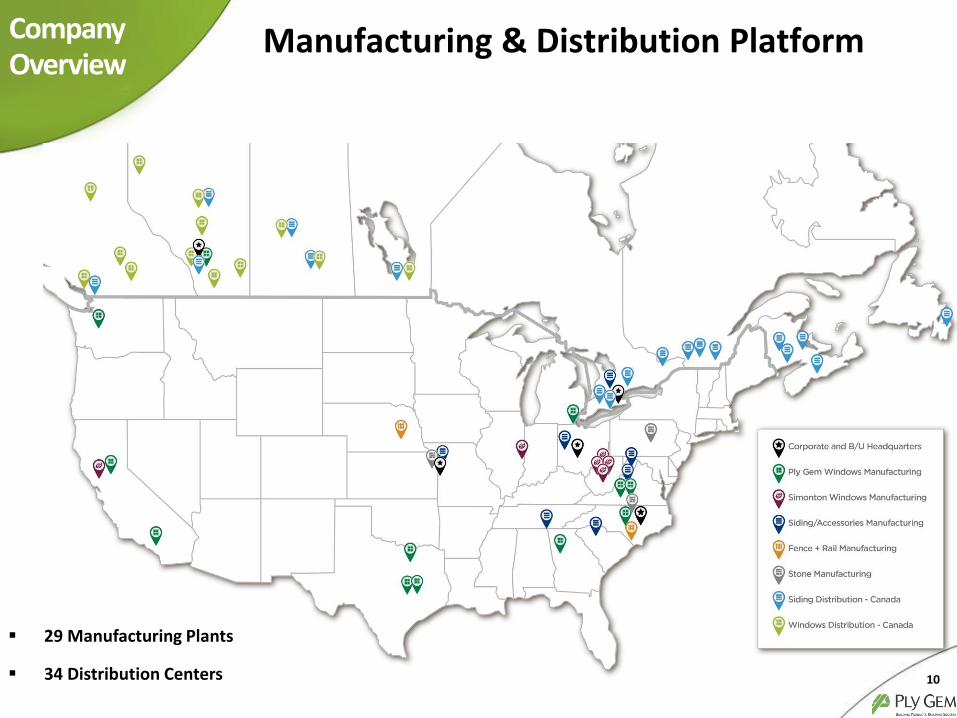
Manufacturing & Distribution Platform
10
CompanyOverview
29 Manufacturing Plants
34 Distribution Centers
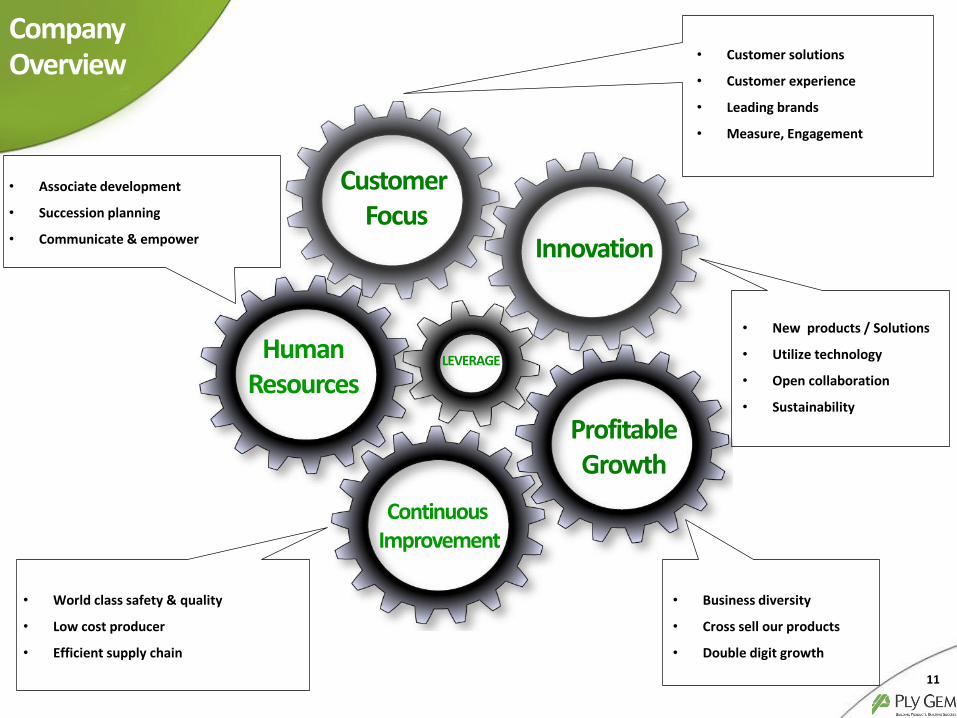
• Business diversity
• Cross sell our products
• Double digit growth
• World class safety & quality
• Low cost producer
• Efficient supply chain
Customer Focus
Innovation
ProfitableGrowth
Continuous Improvement
HumanResources
LEVERAGE
Company Overview
11
• Associate development
• Succession planning
• Communicate & empower
• Customer solutions
• Customer experience
• Leading brands
• Measure, Engagement
• New products / Solutions
• Utilize technology
• Open collaboration
• Sustainability

Market and Housing Update

Crisis of Confidence is Starting to Improve
13
MarketUpdate
-8.0
-3.0
2.0
7.0
4.0
6.0
8.0
10.0
40.0
60.0
80.0
100.0
2011 2012 2013 2014 2015 2016
Source: Bureau of Labor Statistics, Zillow, University of Michigan,Government of Canada, CREA, Conference Board of Canada
(*) Excluding Greater Vancouver and Greater Toronto
Unemployment RateAnnual Change in Home ValuesConsumer Sentiment
4.9%
5.4%
90.0
Canada
6.9%
8.4%(*)
104.6
U.S.
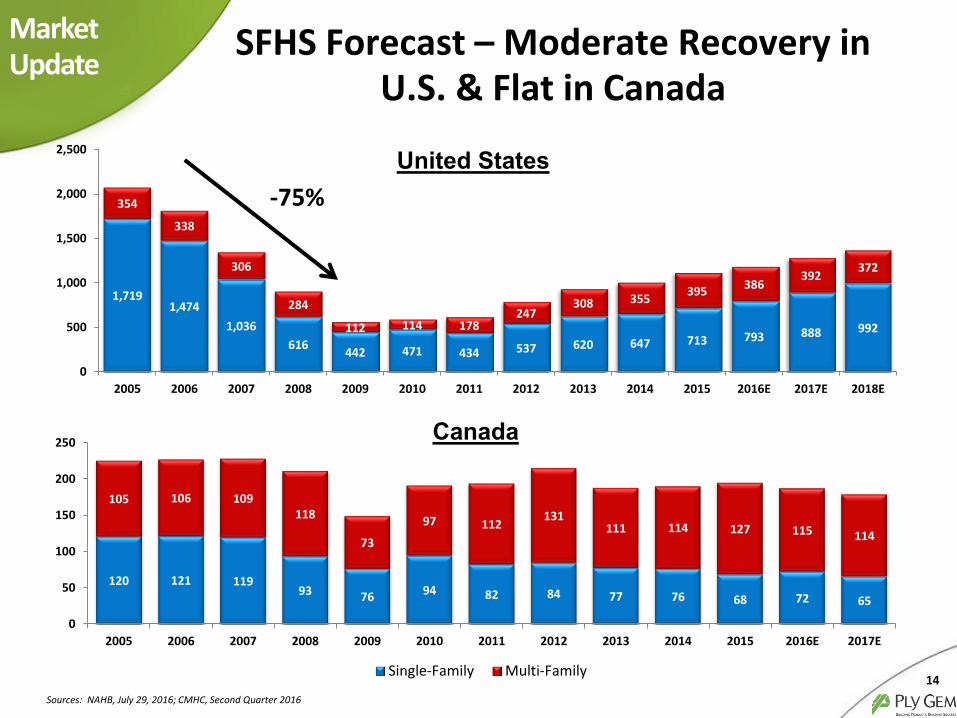
SFHS Forecast – Moderate Recovery in U.S. & Flat in Canada
14
MarketUpdate
1,7191,474
1,036
616442 471 434 537 620 647 713 793 888 992
354
338
306
284
112 114 178247
308 355395
386392
372
0
500
1,000
1,500
2,000
2,500
2005 2006 2007 2008 2009 2010 2011 2012 2013 2014 2015 2016E 2017E 2018E
120 121 11993 76 94 82 84 77 76 68 72 65
105 106 109118
73
97 112131
111 114 127 115 114
0
50
100
150
200
250
2005 2006 2007 2008 2009 2010 2011 2012 2013 2014 2015 2016E 2017E
Single-Family Multi-Family
United States
Canada
Sources: NAHB, July 29, 2016; CMHC, Second Quarter 2016
-75%

Growth Will be in Healthier Markets
15
MarketUpdate
Source: NAHB
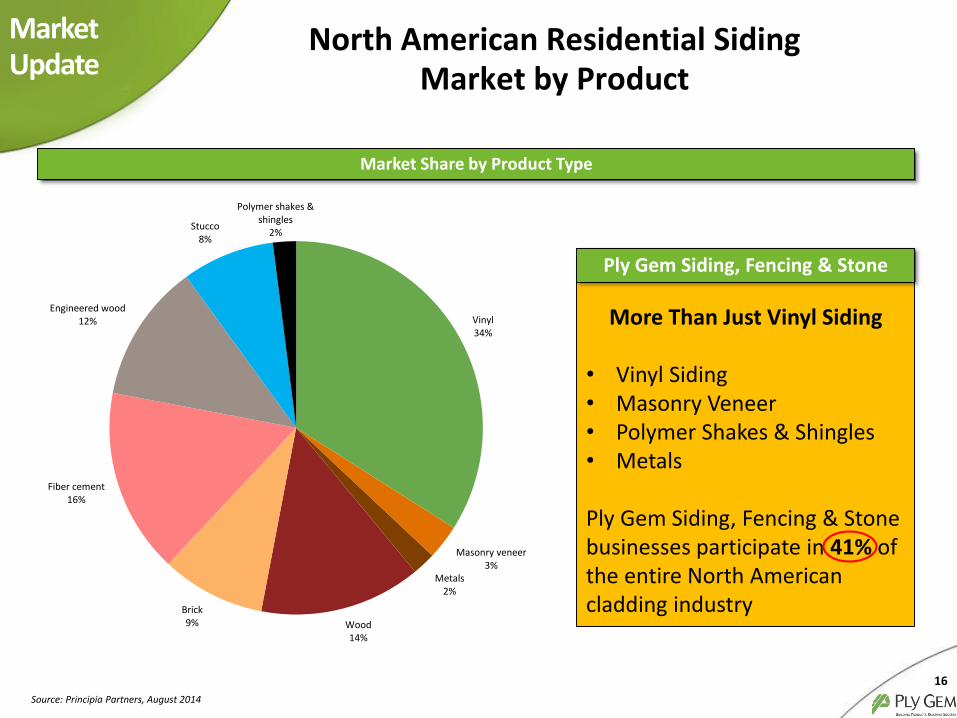
North American Residential Siding Market by Product
16
MarketUpdate
Source: Principia Partners, August 2014
Vinyl34%
Masonry veneer3%
Metals2%
Wood14%
Brick9%
Fiber cement16%
Engineered wood12%
Stucco8%
Polymer shakes & shingles
2%
Market Share by Product Type
More Than Just Vinyl Siding
• Vinyl Siding • Masonry Veneer • Polymer Shakes & Shingles• Metals
Ply Gem Siding, Fencing & Stone businesses participate in 41% of the entire North American cladding industry
Ply Gem Siding, Fencing & Stone

Vinyl Siding Regional Dominance
17
MarketUpdate
74%
57%
22%
3%
0%
10%
20%
30%
40%
50%
60%
70%
80%
Northeast U.S. Midwest U.S. South U.S. West U.S.
Vinyl Siding Brick Stucco Fiber Cement Wood Other
Source: 2015 U.S. Census Bureau
Vinyl Siding Share by Region

Median Age of Owner-Occupied Housing
18
MarketUpdate
Source: 2013 AHS, U.S. Census Bureau
27 27
29 2930
31 3132
3435
37
0
5
10
15
20
25
30
35
40
1993 1995 1997 1999 2001 2003 2005 2007 2009 2011 2013
Year
s o
f A
ge
• Aging trend signals a growing market for remodelers
• Implied additional demand for more new construction over longer term
• Approximately 2/3 of owner-occupied home in the U.S. were built before 1980
• Homes constructed after 2000 represent just 17% of the U.S. owner-occupied homes, with only 2% built after 2010

Top Growth Products for Replacement Contractors
19
55
3027
25 2421
1310
8
0
10
20
30
40
50
60
2014
Windows
Siding
Doors
Roofing
Bathtubs & Showers
Decking
Flooring
Kitchen Cabinets
Water Pipes
MarketUpdate
Source: Hanley Wood August 2013 Audience Survey

Financial Overview
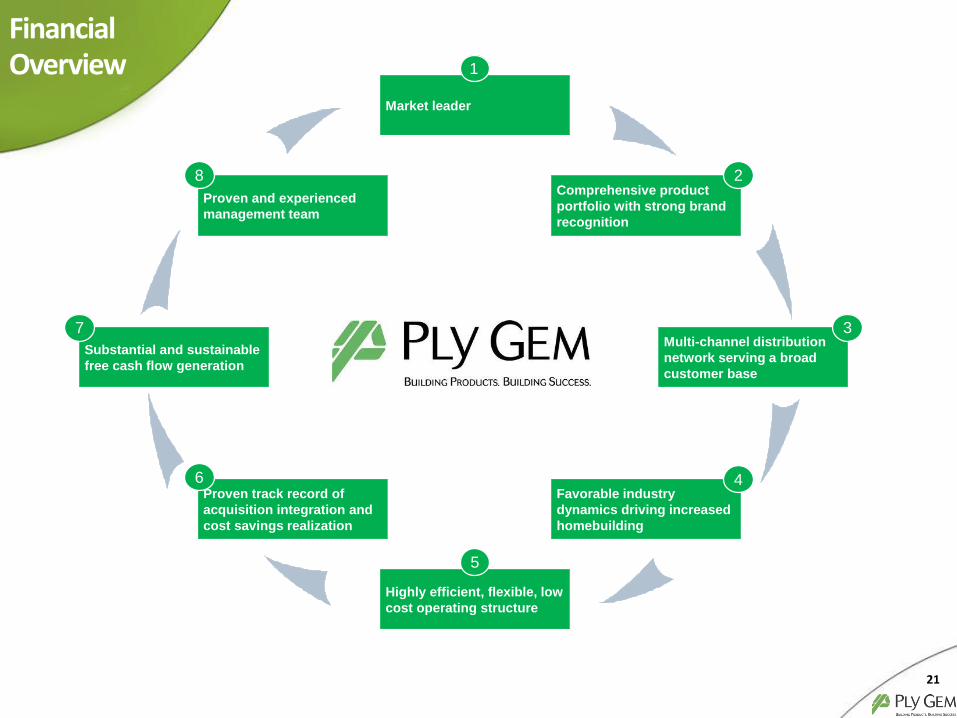
Market leader
Highly efficient, flexible, low
cost operating structure
Comprehensive product
portfolio with strong brand
recognition
Proven and experienced
management team
Favorable industry
dynamics driving increased
homebuilding
Proven track record of
acquisition integration and
cost savings realization
Multi-channel distribution
network serving a broad
customer base
Substantial and sustainable
free cash flow generation
FinancialOverview 1
2
3
4
5
6
7
8
21

Proven Track Record of Acquisition Integration / Cost Savings Realization
AcquisitionSynergies
22
Expected Achieved
MW Windows
($331M)
2004 2005 2006 2007 2008
Alenco
Windows
($127M)
MHE (Alcoa) siding business
($296M)
CT Windows
($37M)
United Stone
Veneer
($4M)
Ply Gem
purchased
by CI Capital
Expected Achieved Expected Achieved
2013
Gienow
(CAD$20M)
Acq
uis
itio
ns
Co
st s
avin
gs($
in M
)
Mitten
(CAD$79M)
$6.8$11.0 $4.0 $4.9
$22.0
$55.0
2014
Simonton
($130M)
2015
Canyon
Stone
($21M)
Acquisitions provide incremental capabilities and growth along with significant synergy opportunities
• Expected and realized $18.1M in cost savings for combined Gienow / Mitten acquisitions
• Simonton acquisition cost savings and synergies expected to be $18.0M
• Canyon Stone acquisition cost savings and synergies expected to be $1.0M
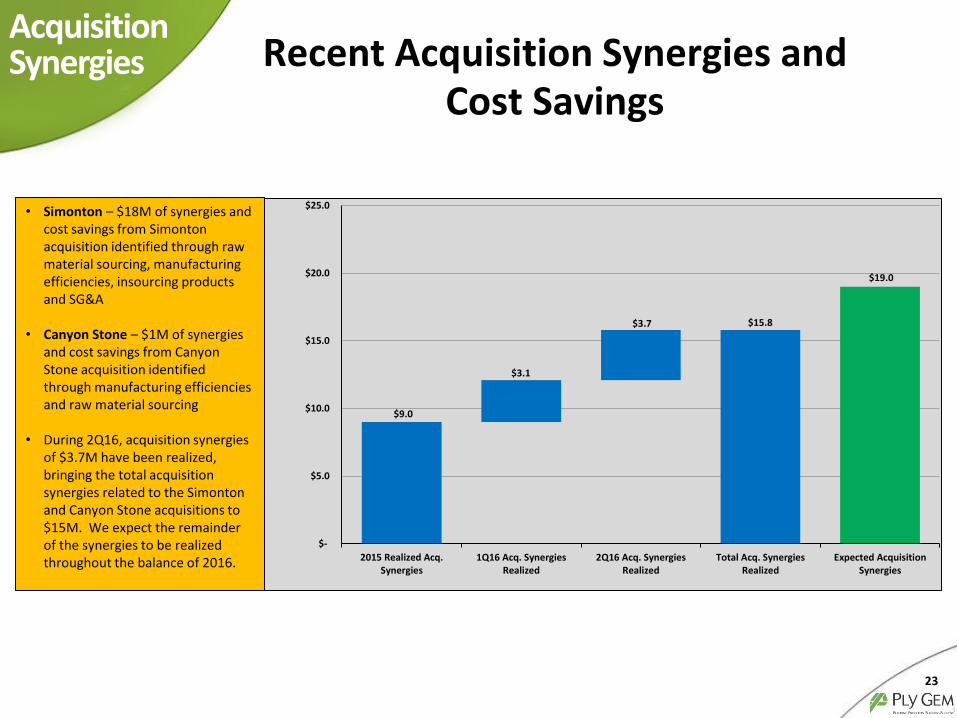
Recent Acquisition Synergies and Cost Savings
AcquisitionSynergies
• Simonton – $18M of synergies and cost savings from Simonton acquisition identified through raw material sourcing, manufacturing efficiencies, insourcing products and SG&A
• Canyon Stone – $1M of synergies and cost savings from Canyon Stone acquisition identified through manufacturing efficiencies and raw material sourcing
• During 2Q16, acquisition synergies of $3.7M have been realized, bringing the total acquisition synergies related to the Simonton and Canyon Stone acquisitions to $15M. We expect the remainder of the synergies to be realized throughout the balance of 2016.
$15.8
$19.0
$9.0
$3.1
$3.7
$-
$5.0
$10.0
$15.0
$20.0
$25.0
2015 Realized Acq.Synergies
1Q16 Acq. SynergiesRealized
2Q16 Acq. SynergiesRealized
Total Acq. SynergiesRealized
Expected AcquisitionSynergies
23
Net Sales Adjusted EBITDA
$176
$96$116 $123 $115
$127$117 $124
$185
$221
0%
5%
10%
15%
20%
25%
2007 2008 2009 2010 2011 2012 2013 2014 2015 LTM2Q16
Adj. EBITDA % of Sales
$1,364$1,175
$951 $996 $1,035$1,121
$1,366
$1,567
$1,840 $1,881
-
400
800
1,200
1,600
2,000
2007 2008 2009 2010 2011 2012 2013 2014 2015 LTM2Q16
Ply Gem sales Single family housing starts
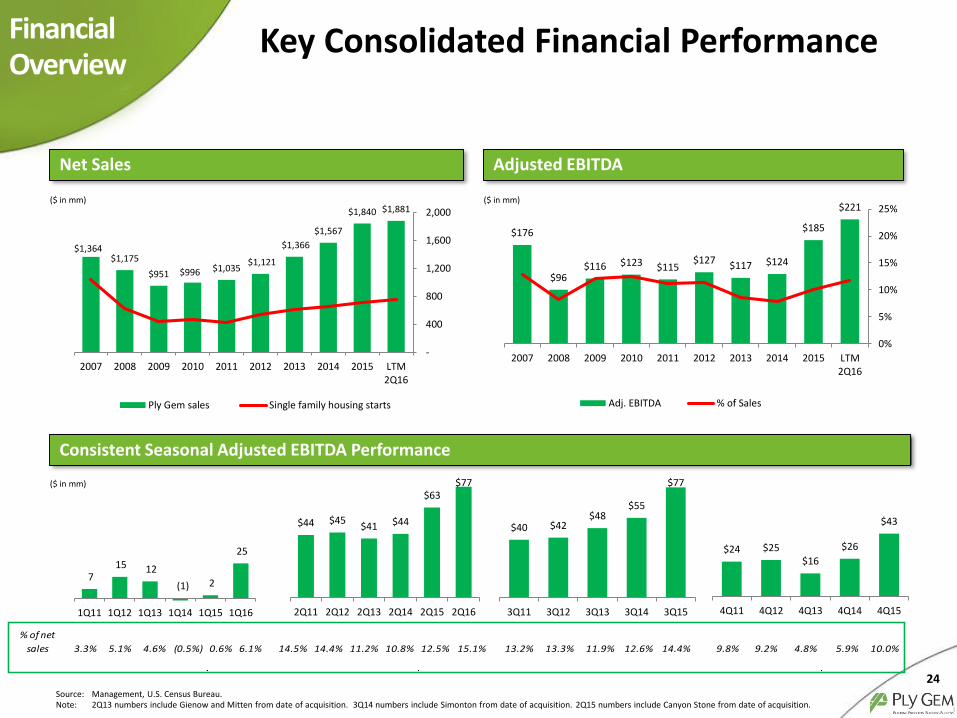
Key Consolidated Financial Performance
($ in mm)($ in mm)
Source: Management, U.S. Census Bureau.Note: 2Q13 numbers include Gienow and Mitten from date of acquisition. 3Q14 numbers include Simonton from date of acquisition. 2Q15 numbers include Canyon Stone from date of acquisition.
24
FinancialOverview
Consistent Seasonal Adjusted EBITDA Performance
7 15 12
(1) 2
25
1Q11 1Q12 1Q13 1Q14 1Q15 1Q16
$44 $45$41 $44
$63$77
2Q11 2Q12 2Q13 2Q14 2Q15 2Q16
$24 $25$16
$26
$43
4Q11 4Q12 4Q13 4Q14 4Q15
$40 $42$48
$55
$77
3Q11 3Q12 3Q13 3Q14 3Q15
% of net
sales 3.3% 5.1% 4.6% (0.5%) 0.6% 6.1% 14.5% 14.4% 11.2% 10.8% 12.5% 15.1% 13.2% 13.3% 11.9% 12.6% 14.4% 9.8% 9.2% 4.8% 5.9% 10.0%
($ in mm)
Ply Gem38%
CertainTeed26%
Associated Materials12%
Exterior/Royal15%
Kaycan5%
Other4%
Ply Gem14%
Atrium3%
Other(1)
26%
Pella16%
Jeld Wen (includes doors)13%
Marvin8%
Anderson 20%
$535$466
$374$392 $396
$463
$628
$765
$1,000 $1,015
(10.0%)
(5.0%)
0.0%
5.0%
10.0%
$0
$200
$400
$600
$800
$1,000
$1,200
2007 2008 2009 2010 2011 2012 2013 2014 2015 LTM 2Q16
Sales Operating earnings margin
AndersenPellaMarvinJELD-WENAtriumAssociated MaterialsMilgard
Windows manufacturers(all substrates)
Source: Principia Partners 2014 study, management estimates.
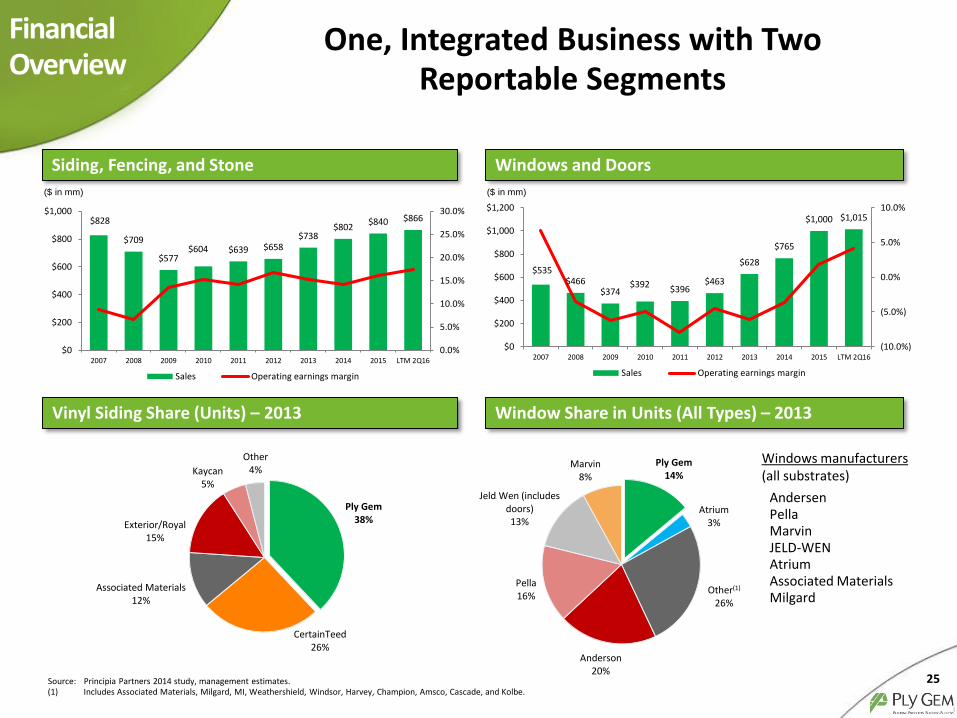
One, Integrated Business with Two Reportable Segments
($ in mm) ($ in mm)
Siding, Fencing, and Stone Windows and Doors
Window Share in Units (All Types) – 2013Vinyl Siding Share (Units) – 2013
25
FinancialOverview
(1) Includes Associated Materials, Milgard, MI, Weathershield, Windsor, Harvey, Champion, Amsco, Cascade, and Kolbe.
$828
$709
$577$604 $639 $658
$738$802
$840 $866
0.0%
5.0%
10.0%
15.0%
20.0%
25.0%
30.0%
$0
$200
$400
$600
$800
$1,000
2007 2008 2009 2010 2011 2012 2013 2014 2015 LTM 2Q16
Sales Operating earnings margin
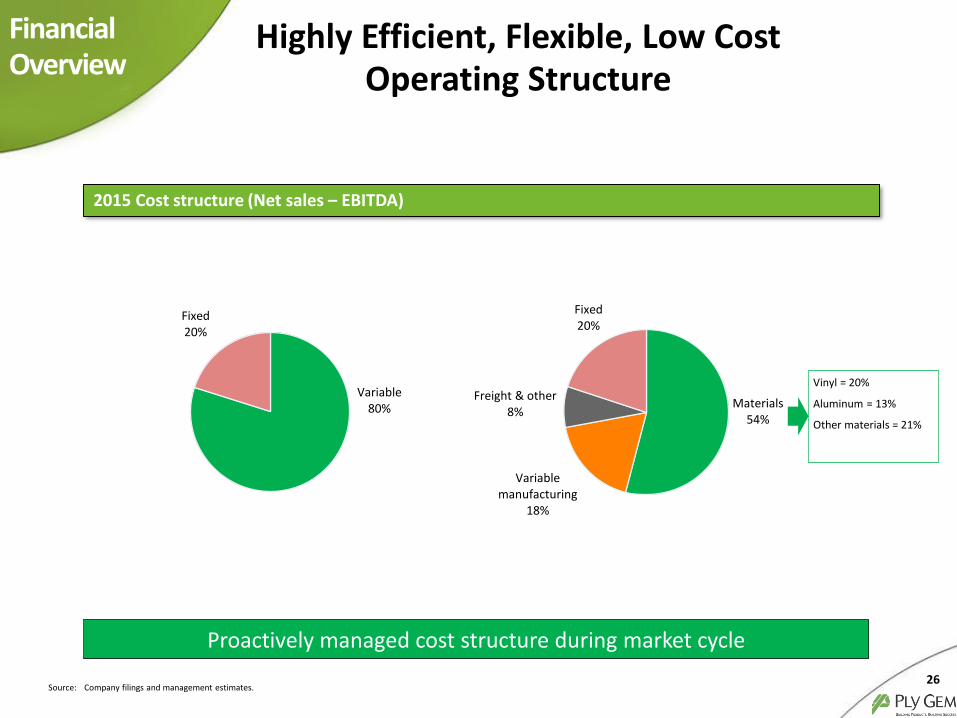
2015 Cost structure (Net sales – EBITDA)
Variable80%
Fixed20%
Materials54%
Variable manufacturing
18%
Freight & other8%
Fixed20%
Vinyl = 20%
Aluminum = 13%
Other materials = 21%
Highly Efficient, Flexible, Low Cost Operating Structure
Source: Company filings and management estimates.26
FinancialOverview
Proactively managed cost structure during market cycle

$20$17
$8$11 $11
$25 $26$24
$34$38
0.0%
1.0%
2.0%
3.0%
4.0%
2007 2008 2009 2010 2011 2012 2013 2014 2015 LTM2Q16
Capex % of Sales
FCF: Adjusted EBITDA – Capital Expenditures Capital Spending
$390
$650
2016 2017 2018 2019 2020 2021 2022
ABL Term Loan Senior Notes
Debt Maturity – 2Q16
Substantial / Sustainable Free Cash Flow
History of strong EBITDA performance, modest capital expenditure requirements and efficient use of working capital27
FinancialOverview
$156
$80
$108 $112$103 $103
$91$101
$151
$183
2007 2008 2009 2010 2011 2012 2013 2014 2015 LTM2Q16
($ in mm) ($ in mm)
($ in mm)
No near-term maturities

28
8.9
7.8
6.7
8.4
5.2 4.9
4.4
-
2.0
4.0
6.0
8.0
10.0
2011 2012 2013 2014 2015 1Q16 LTM 2Q16 LTM
Leve
rage
Rat
io
Leverage Ratio
($ in Millions) 2011 2012 2013 2014 2015 1Q16 LTM 2Q16 LTM
Senior Notes $950.0 $1,000.0 $852.0 $650.0 $650.0 $650.0 $650.0
Term Loan Facility - - - 426.8 422.5 391.4 390.3
ABL 55.0 15.0 - - - 10.0 -
Total Debt $1,005.0 $1,015.0 $852.0 $1,076.8 $1,072.5 $1,051.4 $1,040.3
Cash 11.7 27.2 69.8 33.2 109.4 34.3 64.5
Net Debt $993.3 $987.8 $782.2 $1,043.6 $963.1 $1,017.1 $975.8
Adj. EBITDA $112.2 $126.8 $117.5 $124.2 $184.6 $207.1 $221.4
Interest Coverage 1.2 1.3 1.4 1.9 3.1 3.4 3.7
Leverage Ratio 8.9 7.8 6.7 8.4 5.2 4.9 4.4
Historical Leverage Ratio
Significant De-Leveraging
One-Half Turn Improvement
in 2Q16

29
$-
$100
$200
$300
$400
2007 Trough LTM 2Q16 Mid-Cycle
Adjusted EBITDA(in millions)
Previous Mid-Cycle (2007)
Cycle Trough (2009-2011)
LTM 2Q16 Future Mid-Cycle
U.S. Single Family Housing Starts (in thousands) 1,036 450 760 (*) 1,000
Net Sales $1.4B $0.9B $1.9B ~$2.8B
Gross Margin 20.6% 21.1% 24.3% >25%
Adj. EBITDA $176M $118M $221.4M ~$350M - $400M
• The U.S. housing market can support approximately 1 million single family housing starts based on current household formation rates
• Gross margin improvement from leverage on volume, regional/custom builders returning to the market, and continued pricing discipline within the window industry
Mid-CycleOutlook Mid-Cycle Outlook
(*) Source: U.S. Census Bureau
Appendix
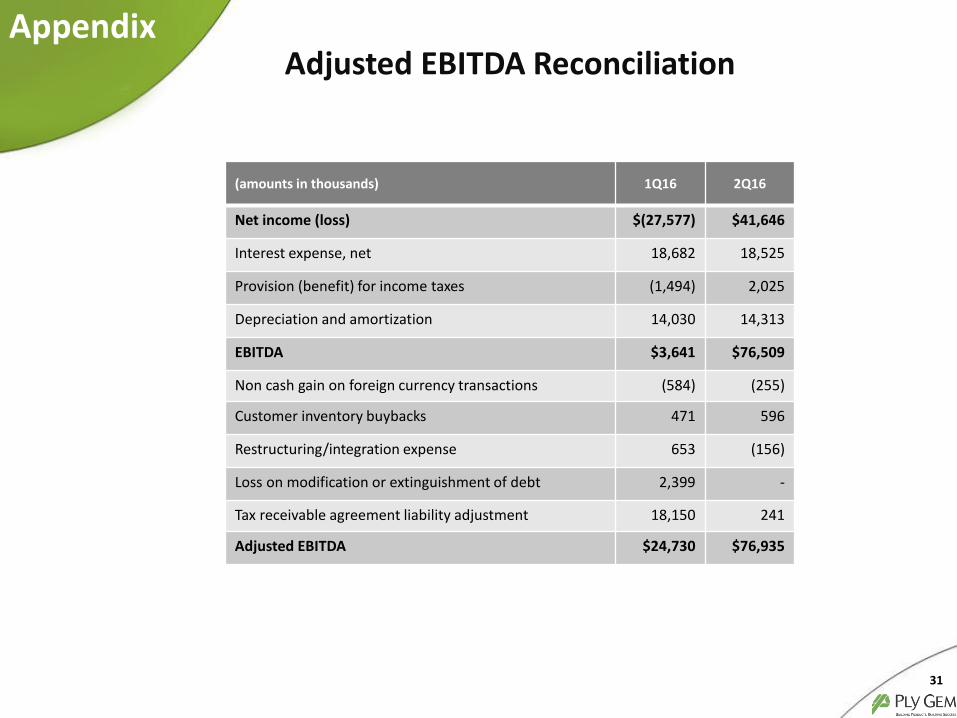
(amounts in thousands) 1Q16 2Q16
Net income (loss) $(27,577) $41,646
Interest expense, net 18,682 18,525
Provision (benefit) for income taxes (1,494) 2,025
Depreciation and amortization 14,030 14,313
EBITDA $3,641 $76,509
Non cash gain on foreign currency transactions (584) (255)
Customer inventory buybacks 471 596
Restructuring/integration expense 653 (156)
Loss on modification or extinguishment of debt 2,399 -
Tax receivable agreement liability adjustment 18,150 241
Adjusted EBITDA $24,730 $76,935
Appendix
31
Adjusted EBITDA Reconciliation
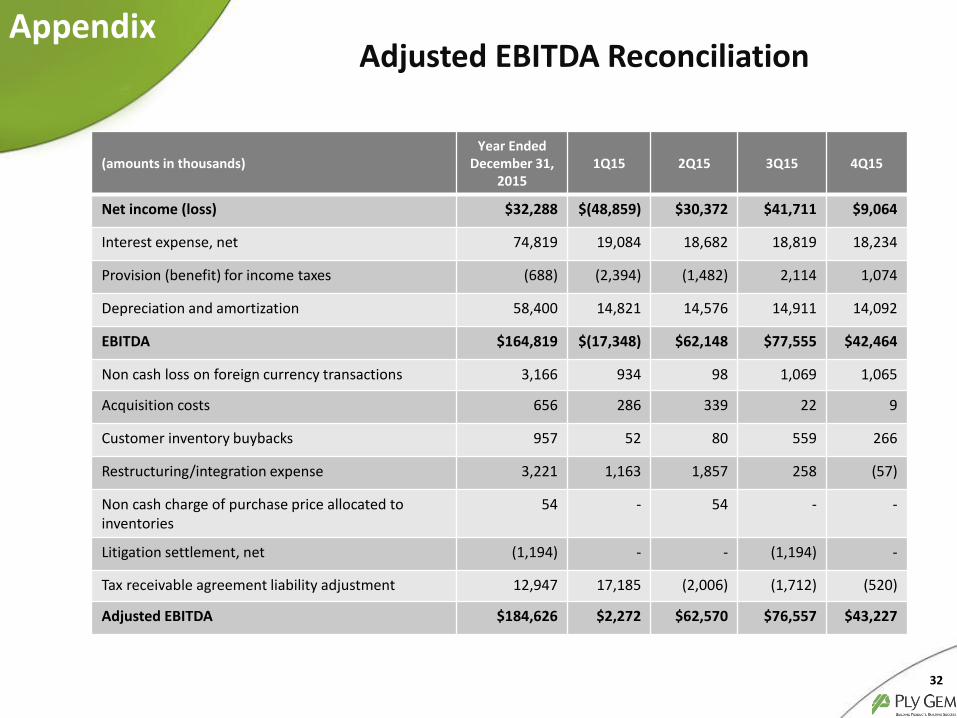
(amounts in thousands)Year Ended
December 31, 2015
1Q15 2Q15 3Q15 4Q15
Net income (loss) $32,288 $(48,859) $30,372 $41,711 $9,064
Interest expense, net 74,819 19,084 18,682 18,819 18,234
Provision (benefit) for income taxes (688) (2,394) (1,482) 2,114 1,074
Depreciation and amortization 58,400 14,821 14,576 14,911 14,092
EBITDA $164,819 $(17,348) $62,148 $77,555 $42,464
Non cash loss on foreign currency transactions 3,166 934 98 1,069 1,065
Acquisition costs 656 286 339 22 9
Customer inventory buybacks 957 52 80 559 266
Restructuring/integration expense 3,221 1,163 1,857 258 (57)
Non cash charge of purchase price allocated to inventories
54 - 54 - -
Litigation settlement, net (1,194) - - (1,194) -
Tax receivable agreement liability adjustment 12,947 17,185 (2,006) (1,712) (520)
Adjusted EBITDA $184,626 $2,272 $62,570 $76,557 $43,227
Appendix
32
Adjusted EBITDA Reconciliation
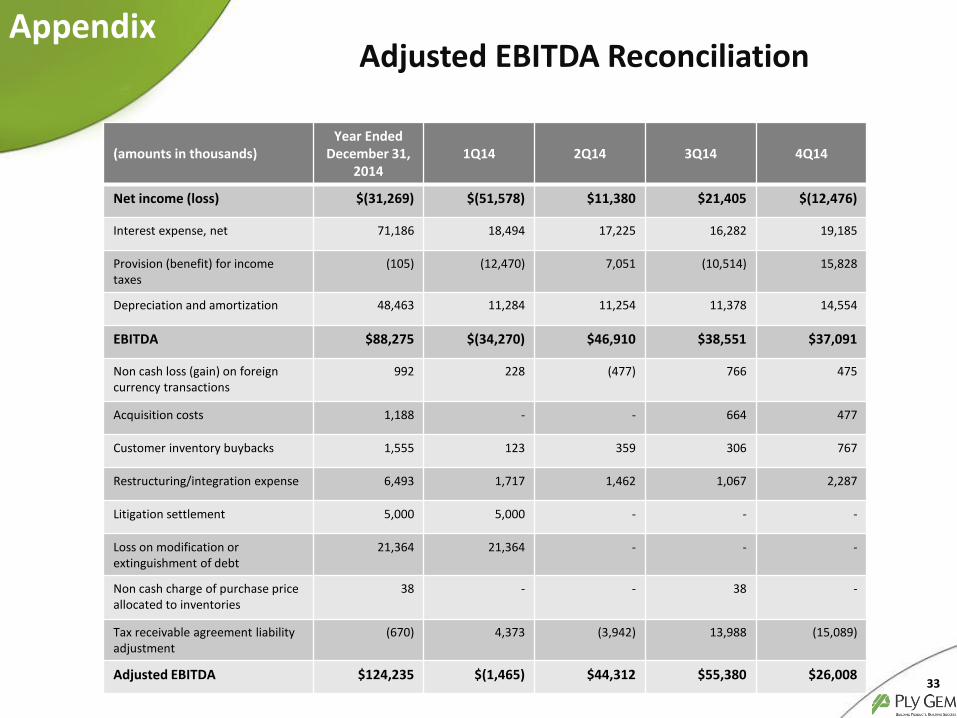
(amounts in thousands)Year Ended
December 31, 2014
1Q14 2Q14 3Q14 4Q14
Net income (loss) $(31,269) $(51,578) $11,380 $21,405 $(12,476)
Interest expense, net 71,186 18,494 17,225 16,282 19,185
Provision (benefit) for income taxes
(105) (12,470) 7,051 (10,514) 15,828
Depreciation and amortization 48,463 11,284 11,254 11,378 14,554
EBITDA $88,275 $(34,270) $46,910 $38,551 $37,091
Non cash loss (gain) on foreign currency transactions
992 228 (477) 766 475
Acquisition costs 1,188 - - 664 477
Customer inventory buybacks 1,555 123 359 306 767
Restructuring/integration expense 6,493 1,717 1,462 1,067 2,287
Litigation settlement 5,000 5,000 - - -
Loss on modification or extinguishment of debt
21,364 21,364 - - -
Non cash charge of purchase price allocated to inventories
38 - - 38 -
Tax receivable agreement liability adjustment
(670) 4,373 (3,942) 13,988 (15,089)
Adjusted EBITDA $124,235 $(1,465) $44,312 $55,380 $26,008
Appendix
33
Adjusted EBITDA Reconciliation

(amounts in thousands)Year Ended
December 31, 2013
1Q13 2Q13 3Q13 4Q13
Net income (loss) $(79,520) $(28,107) $(50,877) $16,895 $(17,431)
Interest expense, net 91,684 23,653 24,833 21,760 21,438
Provision (benefit) for income taxes 298 3,849 (731) (1,442) (1,378)
Depreciation and amortization 45,646 9,715 11,171 12,097 12,663
EBITDA $58,108 $9,110 $(15,604) $49,310 $15,292
Non cash loss (gain) on foreign currency transactions
1,533 33 346 376 778
Acquisition costs 1,490 315 1,025 150 -
Customer inventory buybacks 4,837 - 2,172 2,503 162
Restructuring/integration expense 11,759 2,380 1,439 1,529 6,411
Non cash charge of purchase price allocated to inventories
2,015 - 883 1,132 -
Management fee 410 235 175 - -
Loss on modification or extinguishment of debt
18,948 - 18,948 - -
Initial public offering costs 23,527 - 23,527 - -
Tax receivable agreement liability adjustment
(5,167) - 8,143 (6,669) (6,641)
Adjusted EBITDA $117,460 $12,073 $41,054 $48,331 $16,002
Appendix
34
Adjusted EBITDA Reconciliation

(amounts in thousands)Year Ended
December 31, 2012
1Q12 2Q12 3Q12 4Q12
Net income (loss) $(39,055) $(25,642) $5,267 $(3,673) $(15,007)
Interest expense, net 103,042 25,041 25,919 27,526 24,557
Provision (benefit) for income taxes
2,835 1,872 (204) (89) 1,256
Depreciation and amortization 52,277 13,317 13,189 13,073 12,698
EBITDA $119,099 $14,588 $44,171 $36,837 $23,504
Non cash loss (gain) on foreign currency transactions
(409) (68) (96) (100) (145)
Customer inventory buybacks 768 445 119 59 144
Restructuring/integration expense
1,677 - 152 339 1,186
Management fee 2,520 302 902 859 457
Loss on modification or extinguishment of debt
3,607 - - 3,607 -
Adjusted EBITDA $127,262 $15,267 $45,248 $41,601 $25,146
Appendix
35
Adjusted EBITDA Reconciliation

(amounts in thousands)Year Ended
December 31, 2011
1Q11 2Q11 3Q11 4Q11
Net income (loss) $(84,507) $(70,892) $2,063 $(458) $(15,220)
Interest expense, net 101,384 26,424 24,911 25,176 24,873
Provision (benefit) for income taxes
683 2,472 (959) 466 (1,296)
Depreciation and amortization 54,020 13,690 13,393 13,471 13,466
EBITDA $71,580 $(28,306) $39,408 $38,655 $21,823
Non cash loss (gain) on foreign currency transactions
(492) (133) (218) (115) (26)
Environmental remediation 1,580 - - - 1,580
Customer inventory buybacks 10,087 6,692 2,971 315 110
Restructuring/integration expense
1,616 429 477 547 163
Gain on modification or extinguishment of debt
27,863 27,863 - - -
Management fee 2,267 100 900 800 467
Adjusted EBITDA $114,501 $6,645 $43,538 $40,201 $24,117
Appendix
36
Adjusted EBITDA Reconciliation
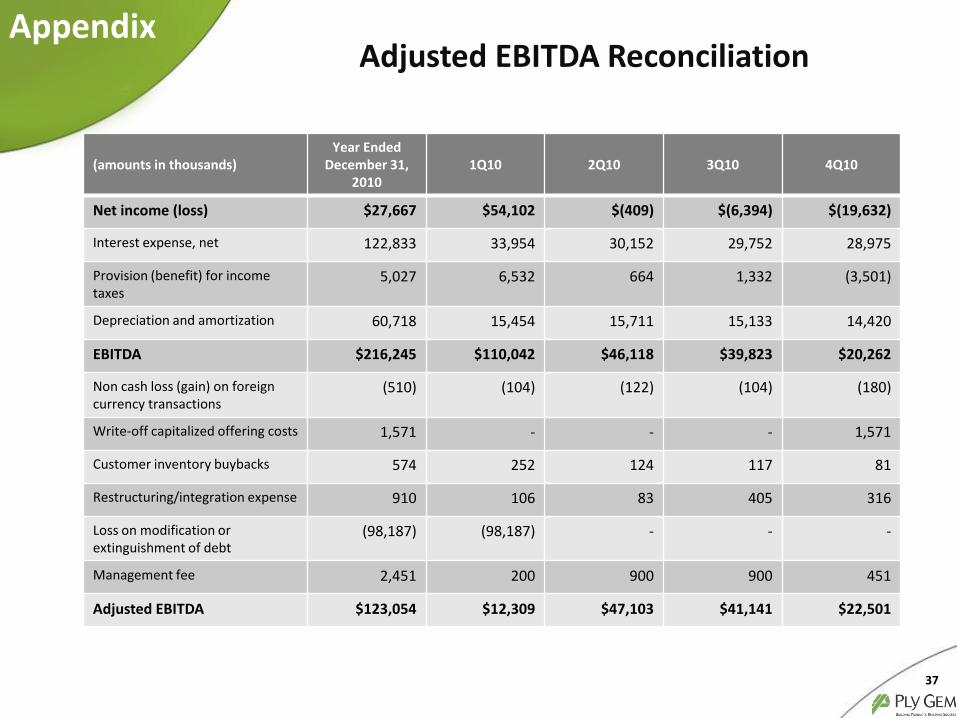
(amounts in thousands)Year Ended
December 31, 2010
1Q10 2Q10 3Q10 4Q10
Net income (loss) $27,667 $54,102 $(409) $(6,394) $(19,632)
Interest expense, net 122,833 33,954 30,152 29,752 28,975
Provision (benefit) for income taxes
5,027 6,532 664 1,332 (3,501)
Depreciation and amortization 60,718 15,454 15,711 15,133 14,420
EBITDA $216,245 $110,042 $46,118 $39,823 $20,262
Non cash loss (gain) on foreign currency transactions
(510) (104) (122) (104) (180)
Write-off capitalized offering costs 1,571 - - - 1,571
Customer inventory buybacks 574 252 124 117 81
Restructuring/integration expense 910 106 83 405 316
Loss on modification or extinguishment of debt
(98,187) (98,187) - - -
Management fee 2,451 200 900 900 451
Adjusted EBITDA $123,054 $12,309 $47,103 $41,141 $22,501
Appendix
37
Adjusted EBITDA Reconciliation
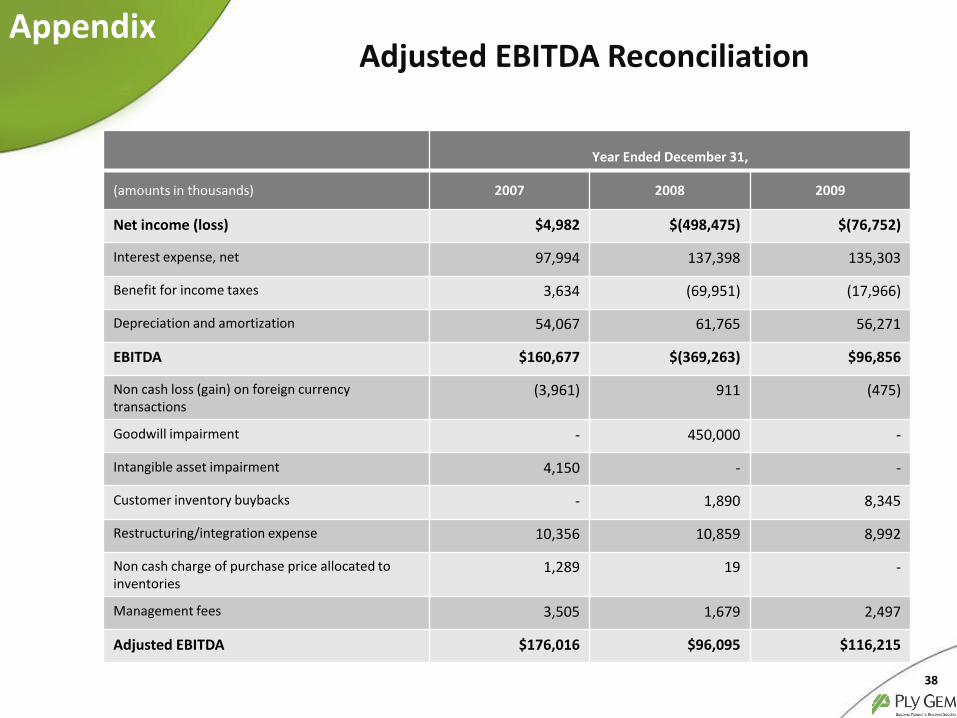
Year Ended December 31,
(amounts in thousands) 2007 2008 2009
Net income (loss) $4,982 $(498,475) $(76,752)
Interest expense, net 97,994 137,398 135,303
Benefit for income taxes 3,634 (69,951) (17,966)
Depreciation and amortization 54,067 61,765 56,271
EBITDA $160,677 $(369,263) $96,856
Non cash loss (gain) on foreign currency transactions
(3,961) 911 (475)
Goodwill impairment - 450,000 -
Intangible asset impairment 4,150 - -
Customer inventory buybacks - 1,890 8,345
Restructuring/integration expense 10,356 10,859 8,992
Non cash charge of purchase price allocated to inventories
1,289 19 -
Management fees 3,505 1,679 2,497
Adjusted EBITDA $176,016 $96,095 $116,215
Adjusted EBITDA ReconciliationAppendix
38