06.03.14 Presentation by Yue Liu
27
Filamentous Sludge Bulking Control by Nano Zero-valent Iron in Activated Sludge Treatment Systems East China University of Science and Technology Presenter: Yue Liu Advisor: Dr. Zhiqiang Hu Professor Shuguang Lu
Transcript of 06.03.14 Presentation by Yue Liu

Filamentous Sludge Bulking Control by Nano Zero-valent
Iron in Activated Sludge Treatment Systems
East China University of Science and Technology
Presenter: Yue LiuAdvisor: Dr. Zhiqiang Hu Professor Shuguang Lu

Outline Introduction Materials and Methods Results and Discussion Conclusions
2

Introduction
3

Activated Sludge ProcessThe most used biological wastewater treatment
method in the world.A process using air and a biological floc composed
of bacteria and protozoa.Settling tank to allow the biological flocs to settle,
thus separating the biological sludge from the clear treated water.
4
Fig. 1. A generalized, schematic diagram of an activated sludge process

Sludge Bulking When: The sludge fails to separate out in the
sedimentation tanks.
Causes: Foaming
Pin-point flocs
Viscous bulking
Results: Looser and less settleable sludge flocs and in
serve cases, the whole operation may fail.
Control: specific & non-specific methods
5
Fig. 2. Sludge bulking
Filamentous bulking
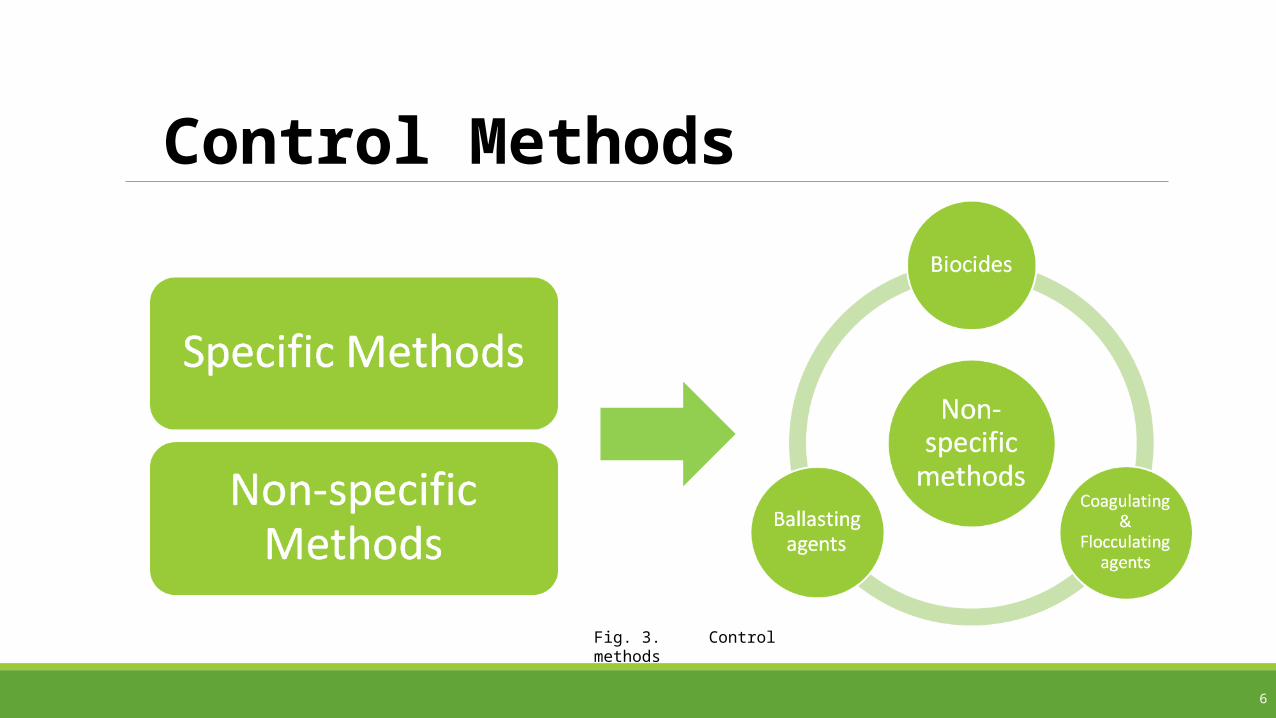
Control Methods
6
Fig. 3. Control methods
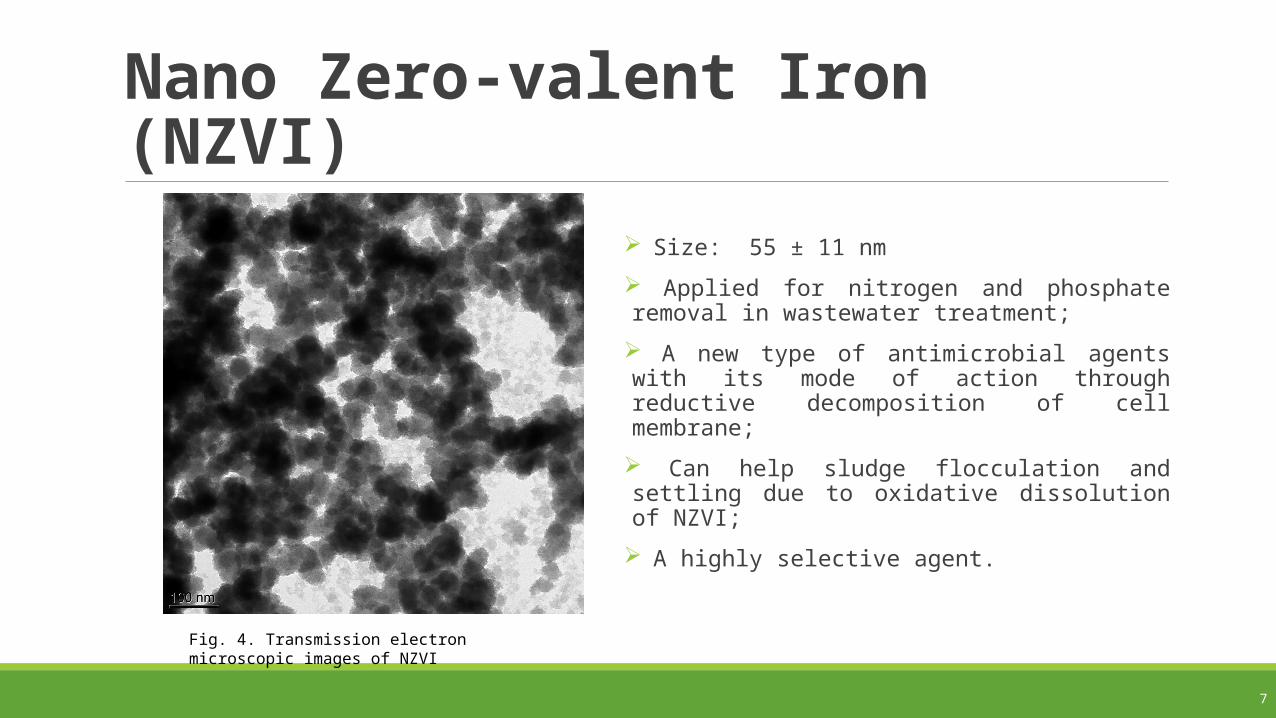
Nano Zero-valent Iron (NZVI)
Size: 55 ± 11 nm
Applied for nitrogen and phosphate removal in wastewater treatment;
A new type of antimicrobial agents with its mode of action through reductive decomposition of cell membrane;
Can help sludge flocculation and settling due to oxidative dissolution of NZVI;
A highly selective agent.
7
Fig. 4. Transmission electron microscopic images of NZVI
Objectives To explore the use of NZVI for sludge bulking control
Try to reduce the side effect of the use of NZVI
8

9
Materials and Methods

Nano Zero-valent Iron Synthesis
10
Fig. 5. The schematic configuration diagram of NZVI fabrication. (1-NaBH4 2-CMC+FeCl2 4H∙ 2O 3-N2 gas)
Fig. 6. The process of NZVI preparation
NZVI concentration: 0.11 M (6060 mg/L)
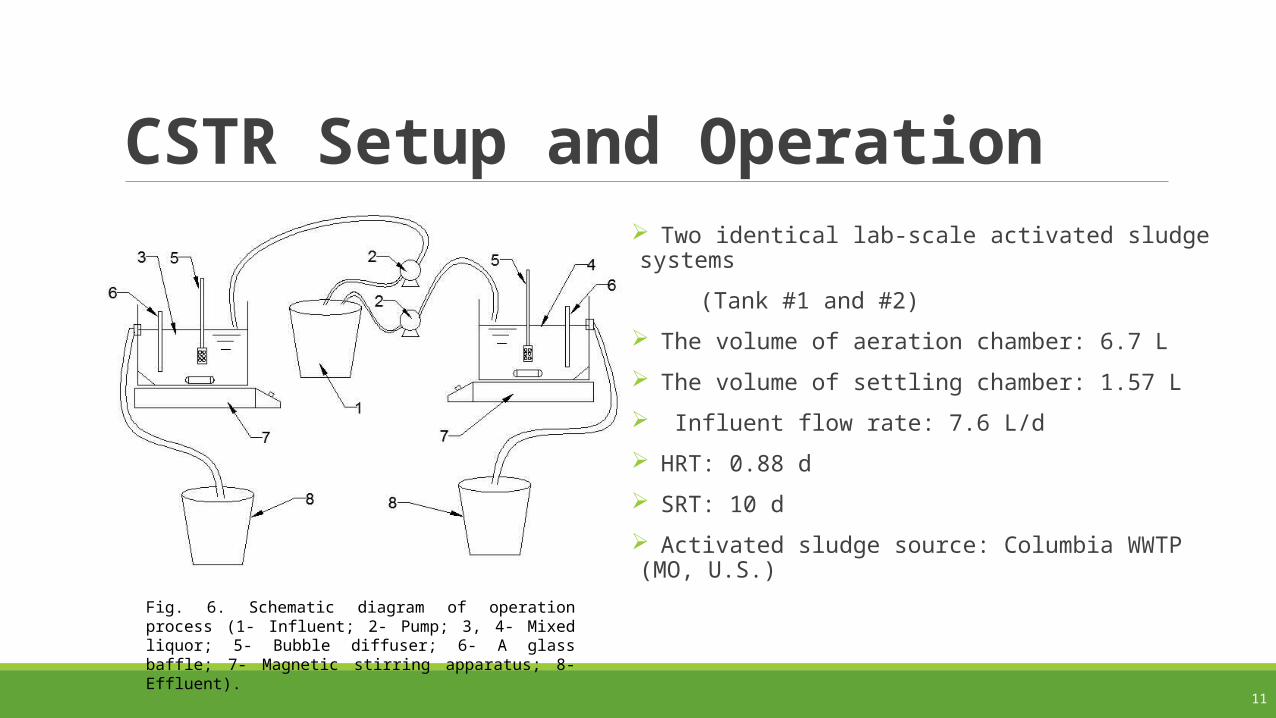
CSTR Setup and Operation Two identical lab-scale activated sludge systems
(Tank #1 and #2)
The volume of aeration chamber: 6.7 L
The volume of settling chamber: 1.57 L
Influent flow rate: 7.6 L/d
HRT: 0.88 d
SRT: 10 d
Activated sludge source: Columbia WWTP (MO, U.S.)
11
Fig. 6. Schematic diagram of operation process (1- Influent; 2- Pump; 3, 4- Mixed liquor; 5- Bubble diffuser; 6- A glass baffle; 7- Magnetic stirring apparatus; 8- Effluent).

Synthetic WastewaterChemical agents Concentration (mg/L)
Non-fat dry milk powder (COD) 500
NH4Cl 89.18
Na2HPO4 7H∙ 2O 51.89
MgSO4 44
CaCl2 2H∙ 2O 14
FeCl2 4H∙ 2O 2
MnSO4 3
(NH4)6Mo7O24 4H∙ 2O 1.2
CuSO4 0.8
Zn(NO3)2 6H∙ 2O 1.8
12
Table 2. Feedstock for CSTR systems
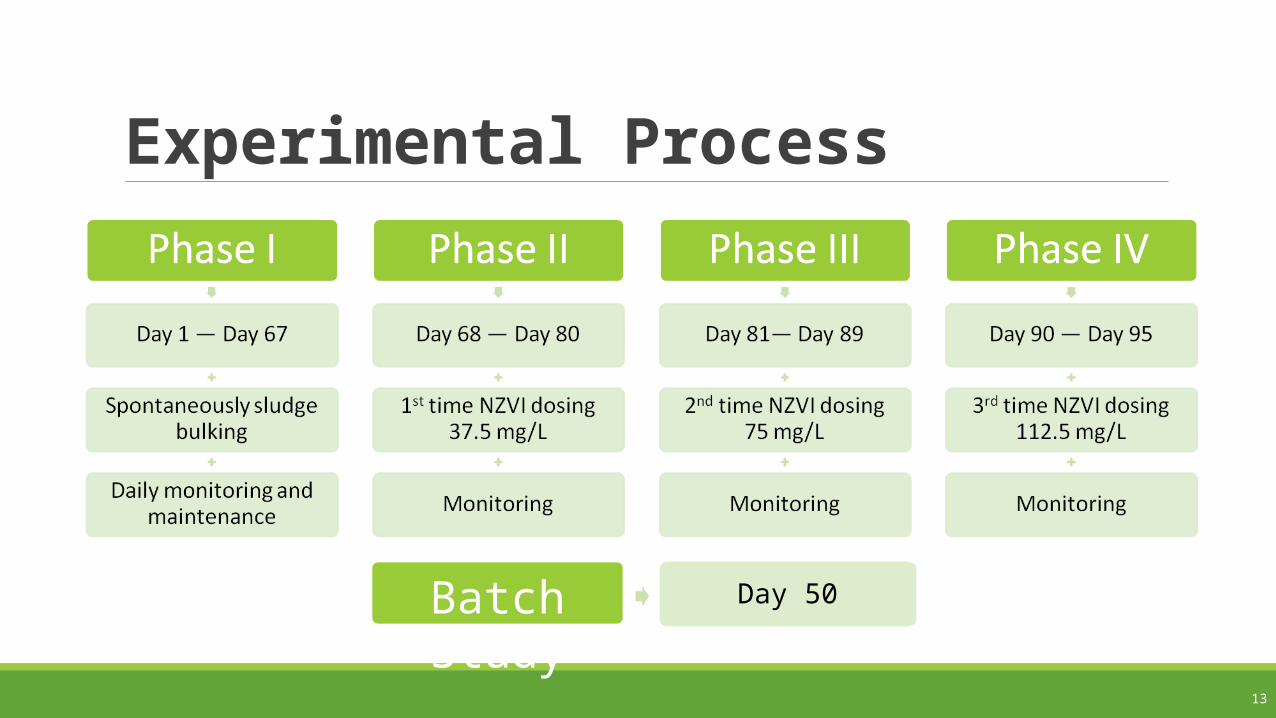
Experimental Process
13
Batch Study Day 50

Analysis methods
Sludge COD Live and dead staining
Mixed Liquor Suspended Solids (MLSS) Effluent COD
Specific Oxygen Uptake Rate (SOUR) Effluent NO3--N
Sludge Volume Index (SVI)/ Sludge Volume (SV30) Effluent NO2--N
Microscopic observations Effluent NH4+-N
14
Table 3. Experimental methods involved in the experiment

15
Results and Discussion
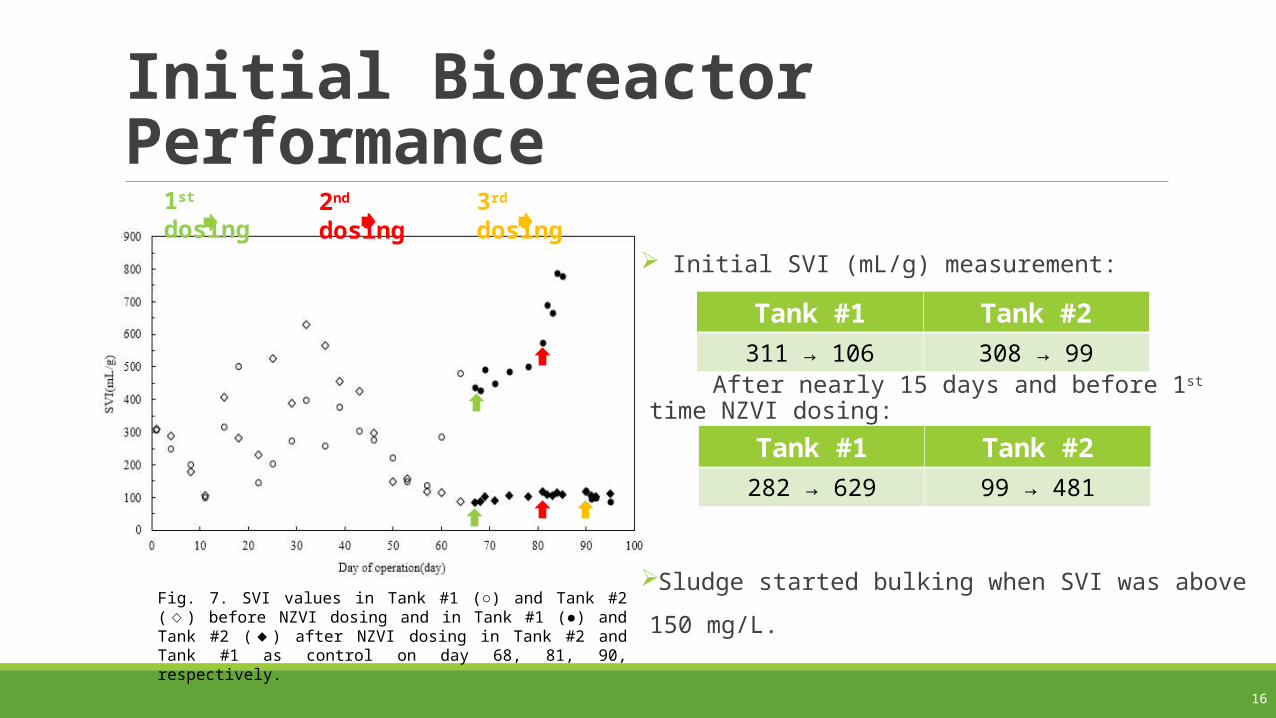
Initial Bioreactor Performance
Initial SVI (mL/g) measurement:
After nearly 15 days and before 1st time NZVI dosing:
Sludge started bulking when SVI was above 150 mg/L.
16
Fig. 7. SVI values in Tank #1 (○) and Tank #2 (◇ ) before NZVI dosing and in Tank #1 (●) and Tank #2 (◆ ) after NZVI dosing in Tank #2 and Tank #1 as control on day 68, 81, 90, respectively.
Tank #1 Tank #2311 → 106 308 → 99
Tank #1 Tank #2282 → 629 99 → 481
1st dosing 2nd dosing 3rd dosing

Biomass COD (Cont’d) The degree of loss sludge differed between the two bioreactors during sludge bulking.
Initial Biomass COD (mg/L)
At early stage of sludge bulking:
The biomass concentration gradually reduced due to a significant sludge loss in the effluent.
17
Fig. 8. Biomass COD in Tank #1 (○) and Tank #2 (◇ ) before NZVI dosing and in Tank #1 (●) and Tank #2 (◆ ) after NZVI dosing in Tank #2 and Tank #1 as control on day 68, 81, 90, respectively.
Tank #1 Tank #22,430 ± 425 2,475 ± 497
Tank #1 Tank #21,582 ± 171 1,744 ± 218

Effluent Water Quality (Cont’d)
Sludge bulking affected effluent water quality.
From Day 1—Day 67:
Effluent COD concentration (mg/L):
COD Removal efficiency: 92 %
18
Fig. 9. Effluent COD in Tank #1 (○) and Tank #2 (◇ ) before NZVI dosing and in Tank #1 (●) and Tank #2 (◆ ) after NZVI dosing in Tank #2 and Tank #1 as control on day 68, 81, 90, respectively.
Tank #1 Tank #236 ± 20 33 ± 21

Effluent Water Quality (Cont’d)
19
Effluent (mg/L)
NO3--N NO2
--N NH4+-N
Tank #1 35 ± 3 0.22 ± 0.23 0.39 ± 0.03 (99% removal)
Tank #2 36 ± 3 0.13 ± 0.02 0.28 ± 0.02 (99% removal)
Fig. 10. Effluent NO3--N (a), NO2
--N (b) and NH4+-N (c) in Tank #1 (○) and Tank #2 (◇ )
before NZVI dosing and in Tank #1 (●) and Tank #2 (◆ ) after NZVI dosing in Tank #2 and Tank #1 as control on day 68, 81, 90, respectively.
(a)
(b)
(c)

1ST TIME DOSING 2ND TIME DOSING
Fig. 10. SVI values from Tank #2 for the first time one-time dosing with NZVI dosing concentration of 37.5 mg/L. Fig. 11. SVI vales from Tank #2 for the second-time dosing with NZVI
dosing concentration of 75 mg/L.
Bioreactor performance and benefits associated with NZVI dosing
20
0h 2h 6h 10h 20h 24h 0h 4h 16h 22h 4h 16h 24h 48h
Before AfterBefore dosing After dosing

Reason Analysis The concentration of NZVI was too low to make difference.
The form existed in the system transferred from nano zero-valent iron to oxidized iron, which had
less reducing capacity.
The contact time was not long enough before washing out.
21
Improvement: Increase the concentration of NZVI dosing in the Tank
Reduce the dissolved oxygen concentration just before dosing

3rd Time NZVI Dosing (Cont’d)
22
Fig. 12. SVI vales from Tank #2 for the third time one-time dosing with NZVI dosing concentration of 112.5 mg/L.
The use of NZVI for the 3rd dosing caused a significant increase in effluent COD, NH4+-N and NO2
--N concentrations, a slight decrease in NO3
--N.
Fig. 13. NH4+-N concentration from Tank #2 for the
third time one-time dosing with NZVI dosing concentration of 112.5 mg/L.
Fig. 14. NO2--N concentration from Tank #2 for the
third time one-time dosing with NZVI dosing concentration of 112.5 mg/L.
0h 4h 8h 18h 24h 42h 48h 0h 4h 8h 18h 24h 42h 48h 0h 4h 8h 18h 24h 42h 48h
After dosingBefore dosing

Impact of NZVI Dosing on Nitrifying Bacterial Activity
The autotrophic SOUR values in Tanks#2 were decreased by 40 4 % due to sludge bulking.
After 1st time dosing, the nitrifying bacteria activity was not affected.
After 3rd time dosing, the nitrifying bacteria activity decreased.
With enough dosage, the nitrification would be influenced by the dosing of NZVI.
23
Fig. 15. Autotrophic SOUR values in Tank #2 before (○) and after dosing (●).Error bars represent standard deviation of the duplicate experiments from the mean of duplicate samples.

24
Conclusions
Conclusions NZVI was successfully used to kill the filamentous bacteria.
Positive effect on sludge bulking control with NZVI dosing concentration of 112.5 mg/L
The slight side effect of the NZVI dosing on nitrification and effluent water quality
25

Acknowledgements My deepest gratitude goes first to Dr. Zhiqiang Hu, my supervisor in University of Missouri, for his constant encouragement and guidance.
Besides, I am grateful to all the faculty of School of Resources and Environmental Engineering at East China University of Science and Technology, for their patience, motivation, enthusiasm and immense knowledge. Their guidance helped me in all of my campus life.
Last my thanks would go to my beloved family for their loving considerations and great confidence in me all through these years.
I also owe my sincere gratitude to my friends and my fellow classmates who gave me their help and time helping me work out my difficulties.
26

Thank you!
27
![Revista 16-9 [AR] (2014-04) 0009 - Sam Liu (1).pdf](https://static.fdocuments.ec/doc/165x107/56d6bd7b1a28ab30168e26c1/revista-16-9-ar-2014-04-0009-sam-liu-1pdf.jpg)