


Idiomas
Páginas
Jurídico

elifesciences.org
RESEARCH ARTICLE
The global distribution of the arbovirusvectors Aedes aegypti and Ae. albopictusMoritz UG Kraemer1*, Marianne E Sinka1, Kirsten A Duda1, Adrian QN Mylne2,Freya M Shearer2, Christopher M Barker3, Chester G Moore4,Roberta G Carvalho5, Giovanini E Coelho5, Wim Van Bortel6, Guy Hendrickx7,Francis Schaffner7, Iqbal RF Elyazar8, Hwa-Jen Teng9, Oliver J Brady2,Jane P Messina1, David M Pigott1,2, Thomas W Scott10,11, David L Smith1,10,12,GR William Wint13, Nick Golding2, Simon I Hay2,10,14*
1Spatial Ecology and Epidemiology Group, Department of Zoology, University ofOxford, Oxford, United Kingdom; 2Wellcome Trust Centre for Human Genetics,University of Oxford, Oxford, United Kingdom; 3Department of Pathology,Microbiology, and Immunology, School of Veterinary Medicine, University ofCalifornia, Davis, Davis, United States; 4Department of Microbiology, Immunologyand Pathology, Colorado State University, Fort Collins, United States; 5NationalDengue Control Program, Ministry of Health, Brasilia, Brazil; 6European Centre forDisease Prevention and Control, Stockholm, Sweden; 7Avia-GIS, Zoersel, Belgium;8Eijkman-Oxford Clinical Research Unit, Jakarta, Indonesia; 9Center for Research,Diagnostics and Vaccine Development, Centers for Disease Control, Taipei, Taiwan;10Fogarty International Center, National Institutes of Health, Bethesda, United States;11Department of Entomology and Nematology, University of California, Davis, Davis,United States; 12Sanaria Institute for Global Health and Tropical Medicine, Rockville,United States; 13Environmental Research Group Oxford, Department of Zoology,University of Oxford, Oxford, United Kingdom; 14Institute for Health Metrics andEvaluation, University of Washington, Seattle, United States
Abstract Dengue and chikungunya are increasing global public health concerns due to their rapid
geographical spread and increasing disease burden. Knowledge of the contemporary distribution of
their shared vectors, Aedes aegypti and Aedes albopictus remains incomplete and is complicated by
an ongoing range expansion fuelled by increased global trade and travel. Mapping the global
distribution of these vectors and the geographical determinants of their ranges is essential for public
health planning. Here we compile the largest contemporary database for both species and pair it
with relevant environmental variables predicting their global distribution. We show Aedes
distributions to be the widest ever recorded; now extensive in all continents, including North
America and Europe. These maps will help define the spatial limits of current autochthonous
transmission of dengue and chikungunya viruses. It is only with this kind of rigorous entomological
baseline that we can hope to project future health impacts of these viruses.
DOI: 10.7554/eLife.08347.001
IntroductionThe mosquitoes Aedes aegypti [= Stegomyia aegypti] and Aedes albopictus [= Stegomyia albopicta]
(Reinert et al., 2009) are vectors of several globally important arboviruses, including dengue virus
(DENV) (Simmons et al., 2012), yellow fever virus (Jentes et al., 2011), and chikungunya virus (CHIKV)
(Leparc-Goffart et al., 2014). The public health impact of DENV and CHIKV has increased
*For correspondence: moritz.
[email protected] (MUGK);
[email protected] (SIH)
Competing interests:
See page 12
Funding: See page 12
Received: 26 April 2015
Accepted: 18 June 2015
Published: 30 June 2015
Reviewing editor: Mark Jit,
London School of Hygiene &
Tropical Medicine, and Public
Health England, United Kingdom
This is an open-access article,
free of all copyright, and may be
freely reproduced, distributed,
transmitted, modified, built
upon, or otherwise used by
anyone for any lawful purpose.
The work is made available under
the Creative Commons CC0
public domain dedication.
Kraemer et al. eLife 2015;4:e08347. DOI: 10.7554/eLife.08347 1 of 18
dramatically over the last 50 years, with both diseases spreading to new geographic locations and
increasing in incidence within their range (Weaver, 2014). The remaining burden of vaccine-
preventable yellow fever is similarly likely to be dramatically underestimated (Garske et al., 2014).
DENV, with a nearly ubiquitous distribution in the tropics and more recently introduced to Europe
(ECDC, 2014; Schaffner and Mathis, 2014), is the most prevalent human arboviral infection causing
100 million apparent annual infections world-wide with almost half of the world’s population at risk of
infection (Brady et al., 2012; Bhatt et al., 2013). CHIKV recently received considerable public health
attention due to the outbreaks in Reunion in 2005–2006 (225,000 infections) (Borgherini et al., 2007),
Italy in 2007 (205 infections) (Rezza et al., 2007), and France in 2010 and 2014 (2 and 11 locally
transmitted cases, respectively) (La Ruche et al., 2010; Grandadam et al., 2011; Paty et al., 2014) as
well as its recent invasion into the Americas with over 1 million cases recorded to date (Cauchemez
et al., 2014; Johansson et al., 2014; Morens and Fauci, 2014). Increases in distribution and intensity
of transmission are compounded by the lack of commercially available antivirals or vaccines for either
disease (Simmons et al., 2012; Roy et al., 2014), although new therapeutics and vaccines are in
development (McArthur et al., 2013; Powers, 2014; Villar et al., 2015). Similarly, while yellow fever
infections have been on the decline due to extensive vector control and an effective vaccine
developed more than 70 years ago, it still causes a significant disease burden in Africa and South
America (Poland et al., 1981; World Health Organization, 1990; Garske et al., 2014). Given the
public health impact of these diseases and their rapid global spread, understanding the current and
future distribution, and determining the geographic limits of transmission and transmission intensity,
will enable more efficient planning for disease control (Carrington and Simmons, 2014; Semenza
et al., 2014; Messina et al., 2015). Because these diseases can only persist where their mosquito
vectors, Ae. aegypti and Ae. albopictus are present, understanding the distributions of these two
species underpins this strategy.
The global expansion of these arboviruses was preceded by the global spread of their vectors
(Charrel et al., 2014). Ae. aegypti originated in Africa where its ancestral form was a zoophilic
treehole mosquito named Ae. aegypti formosus (Brown et al., 2014). The domestic form Ae. aegypti
eLife digest Mosquitoes spread many disease-causing viruses and parasites between people
and other animals, including viral infections such as dengue and chikungunya. Both infections cause
high fevers often accompanied with excruciating joint pain or other flu-like symptoms. Dengue and
chikungunya have become growing public health problems over the last fifty years. Today about half
of the world’s population is at risk of dengue infection, while chikungunya outbreaks, which were
previously limited to Africa and Asia, have recently been reported in the Caribbean, South America
and Europe.
The dengue and chikungunya viruses are transmitted between people by two species of
mosquitoes called Aedes aegypti and Ae. albopictus. Therefore it is important to work out where
these mosquito species are found around the globe to identify the areas at risk. It is also important to
predict where these species could become established if they were introduced, in order to identify
areas that could become at risk in the future.
Kraemer et al. now provide updated predictions about the distribution of these two mosquito
species around the globe. These predictions are based upon the most up-to-date data on the known
locations of the species combined with information on environmental conditions across the globe.
The updated maps show that these Aedes mosquitoes are now found across all continents, including
North America and Europe.
Aedes albopictus mosquitoes in particular are rapidly expanding their territory around the globe.
Kraemer et al. used their new maps to show that, unlike in the United States, many of the areas in
Europe and China that could support this mosquito species do not yet appear to have been
colonized.
These findings provide a map of the distribution of both species as it stands at the moment.
Further work is now needed to better understand which factors are contributing to the rapid
expansion of these mosquitoes’ range and what might be done to control this spread.
DOI: 10.7554/eLife.08347.002
Kraemer et al. eLife 2015;4:e08347. DOI: 10.7554/eLife.08347 2 of 18
Research article Ecology | Epidemiology and global health
is genetically distinct with discrete geographic niches (Brown et al., 2011). It was hypothesised that
due to harsh conditions coupled with the onset of the slave trade, Ae. aegypti were introduced into
the New World from Africa, from where it subsequently spread globally to tropical and sub-tropical
regions of the world (Brown et al., 2014). Ae. albopictus, originally a zoophilic forest species from
Asia, spread to islands in the Indian and Pacific Oceans (Delatte et al., 2009). During the 1980s it
rapidly expanded its range to Europe, the United States and Brazil (Medlock et al., 2012; Carvalho
et al., 2014). Today both Ae. aegypti and Ae. albopictus are present in most Asian cities and large
parts of the Americas (Lambrechts et al., 2011). Ae. aegypti feed almost exclusively on humans in
daylight hours and typically rest indoors (Scott and Takken, 2012). In contrast Ae. albopictus is
usually exophagic and bites humans and animals opportunistically (Paupy et al., 2009) but has also
been shown to exhibit strongly anthropophilic behavior similar to Ae. aegypti in specific contexts
(Ponlawat and Harrington, 2005; Delatte et al., 2010).
A number of previous studies have mapped the global or regional distributions of Ae. aegypti and
Ae. albopictus by focusing on different aspects of their ecology. The majority examined the impacts of
climatic conditions, often with an exclusive focus on temperature. Kobayashi et al. (2002) and
Nawrocki and Hawley (1987) used results from laboratory studies to identify potential limits
of establishment in Japan and Asia suggesting a minimum mean temperature in the coldest months of
−2˚C and −5˚C respectively limits their distribution. Brady et al. (2013) extended that work by
modeling the adult survival of both species under laboratory and field conditions, indicating that
Ae. albopictus has higher survival rates than Ae. aegypti, though adults of the latter can tolerate
a wider range of temperatures. Applying these results to global temperature data, Brady et al. (2014)
produced maps indicating areas where the temperature is suitable for these vectors to persist. Whilst
temperature is clearly a crucial factor constraining the distribution of the two species, these results
alone are not sufficient to discriminate between areas where the species can and cannot persist. Other
studies went further using statistical models, predicting the distributions of both species (though
particularly Ae. albopictus) using a broader range of climatic variables including precipitation
(Benedict et al., 2007; Medley, 2010; Fischer et al., 2011; Caminade et al., 2012; Khormi and
Kumar 2014; Campbell et al., 2015).
Whilst these studies incorporated several generic climatic factors to predict the current and future
distribution of the species, we were able to integrate a bespoke species-specific temperature
suitability covariate and account for anthropogenic factors that are known to influence Ae. aegypti
and Ae. albopictus distributions (Reiter et al., 2003). Both species are container-inhabiting but differ
in their behaviour and biology so that they occupy different niches (Eisen and Moore, 2013). A few
local studies showed, however, that local spread of Ae. albopictus and declining Ae. aegypti
populations might be linked to inter-species competition (O’Meara et al., 1995; Daugherty et al.,
2000; Juliano et al., 2007) and/or non-reciprocal cross-species inseminations (Bargielowski et al.,
2013). Socio-economic factors affecting the distribution of the Aedes mosquitoes other than the use
of containers to store water, include the use of air-conditioning, housing quality, and the rate of
urbanisation (Ramos et al., 2008; Astrom et al., 2012). In addition to exclusively focusing on
meteorological factors in determining the spatial extent of the Aedes mosquitoes, many models used
small sets of input occurrence data, which were biased towards particular countries with well-
developed surveillance systems, such as, Brazil and Taiwan (Benedict et al., 2007; Medley, 2010;
Fischer et al., 2011; Campbell et al., 2015).
In this context, we set out to model the global distribution of these two important vector species,
compiling the most comprehensive occurrence dataset to date from published literature and national
entomological surveys. To overcome previous modelling limitations, a probabilistic species
distribution model using Boosted Regression Trees (BRT) was produced for each vector. Our models
combine environmental and, for the first time, land-cover variables to predict the global distribution
of both species at high spatial resolution. Importantly, the models quantify prediction uncertainty and
aim at identifying key contributing factors and inter-species differences in their environmental niches.
ResultsIn total, data collection yielded 19,930 and 22,137 spatially unique occurrence records for Ae. aegypti
and Ae. albopictus respectively, which were used to train the distribution models. This includes up-to
date records from national entomological surveys from Brazil and Taiwan for both species (Carvalho
et al., 2014; Yang et al., 2014). For Ae. aegypti, >60% of all occurrence records are from Asia and
Kraemer et al. eLife 2015;4:e08347. DOI: 10.7554/eLife.08347 3 of 18
Research article Ecology | Epidemiology and global health
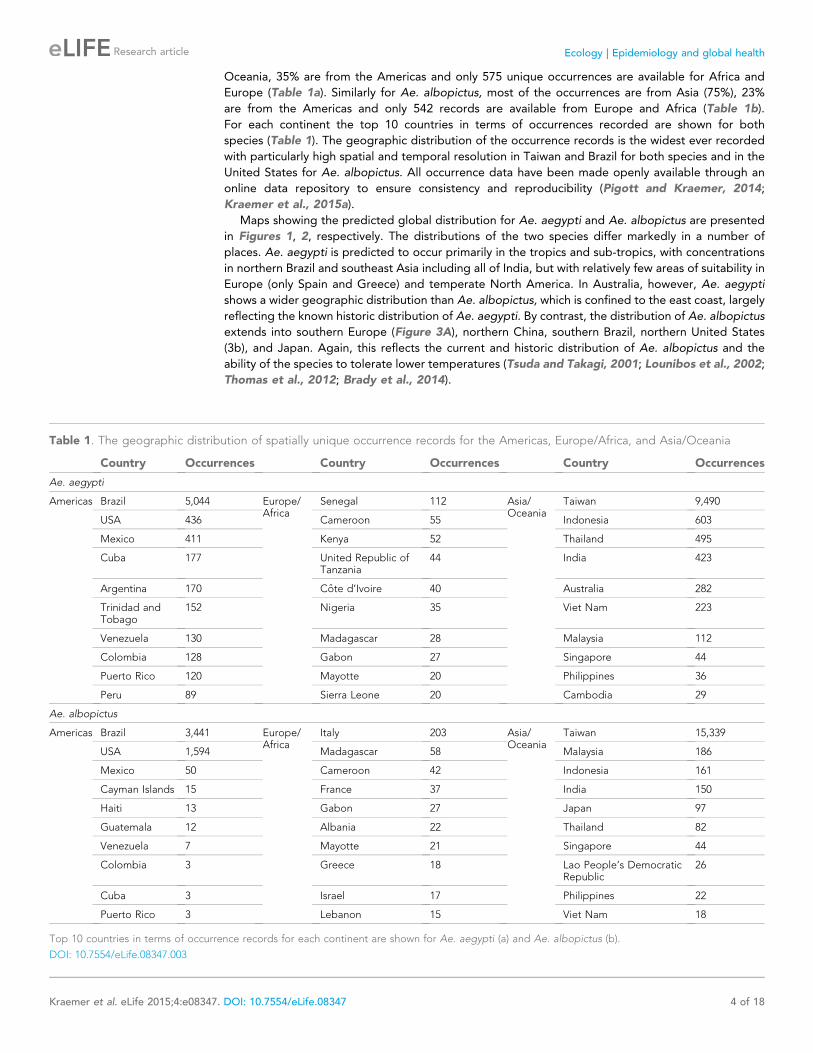
Oceania, 35% are from the Americas and only 575 unique occurrences are available for Africa and
Europe (Table 1a). Similarly for Ae. albopictus, most of the occurrences are from Asia (75%), 23%
are from the Americas and only 542 records are available from Europe and Africa (Table 1b).
For each continent the top 10 countries in terms of occurrences recorded are shown for both
species (Table 1). The geographic distribution of the occurrence records is the widest ever recorded
with particularly high spatial and temporal resolution in Taiwan and Brazil for both species and in the
United States for Ae. albopictus. All occurrence data have been made openly available through an
online data repository to ensure consistency and reproducibility (Pigott and Kraemer, 2014;
Kraemer et al., 2015a).
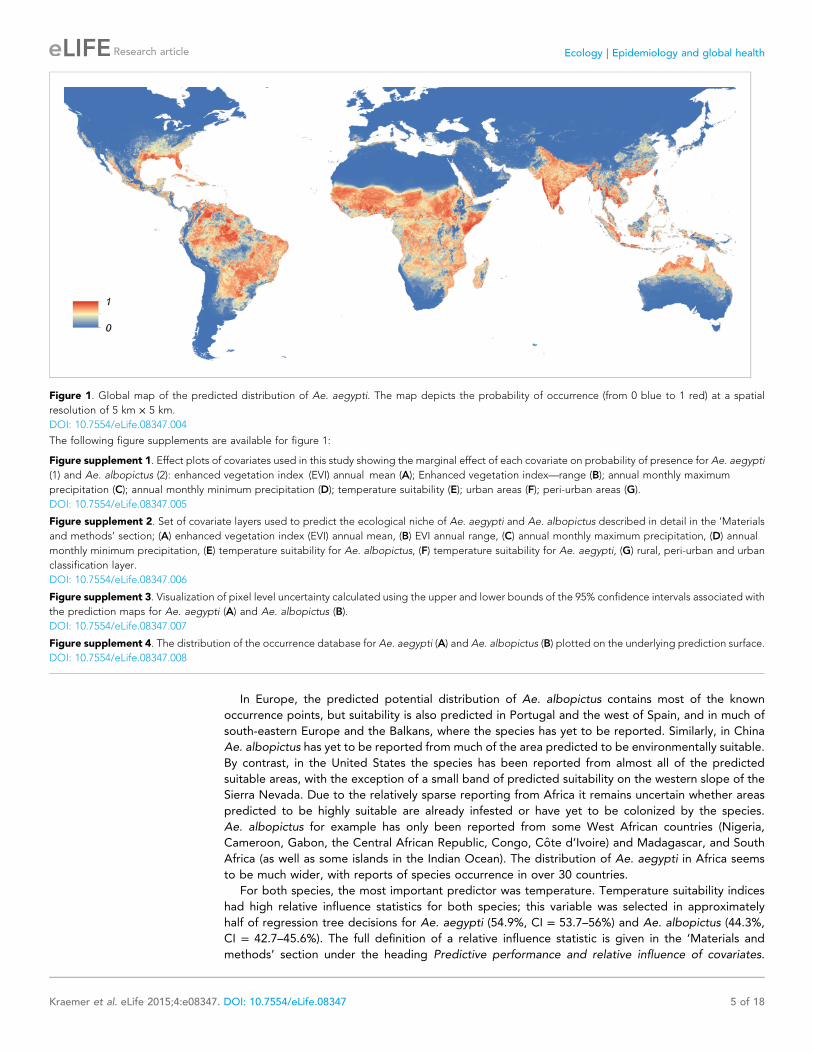
Maps showing the predicted global distribution for Ae. aegypti and Ae. albopictus are presented
in Figures 1, 2, respectively. The distributions of the two species differ markedly in a number of
places. Ae. aegypti is predicted to occur primarily in the tropics and sub-tropics, with concentrations
in northern Brazil and southeast Asia including all of India, but with relatively few areas of suitability in
Europe (only Spain and Greece) and temperate North America. In Australia, however, Ae. aegypti
shows a wider geographic distribution than Ae. albopictus, which is confined to the east coast, largely
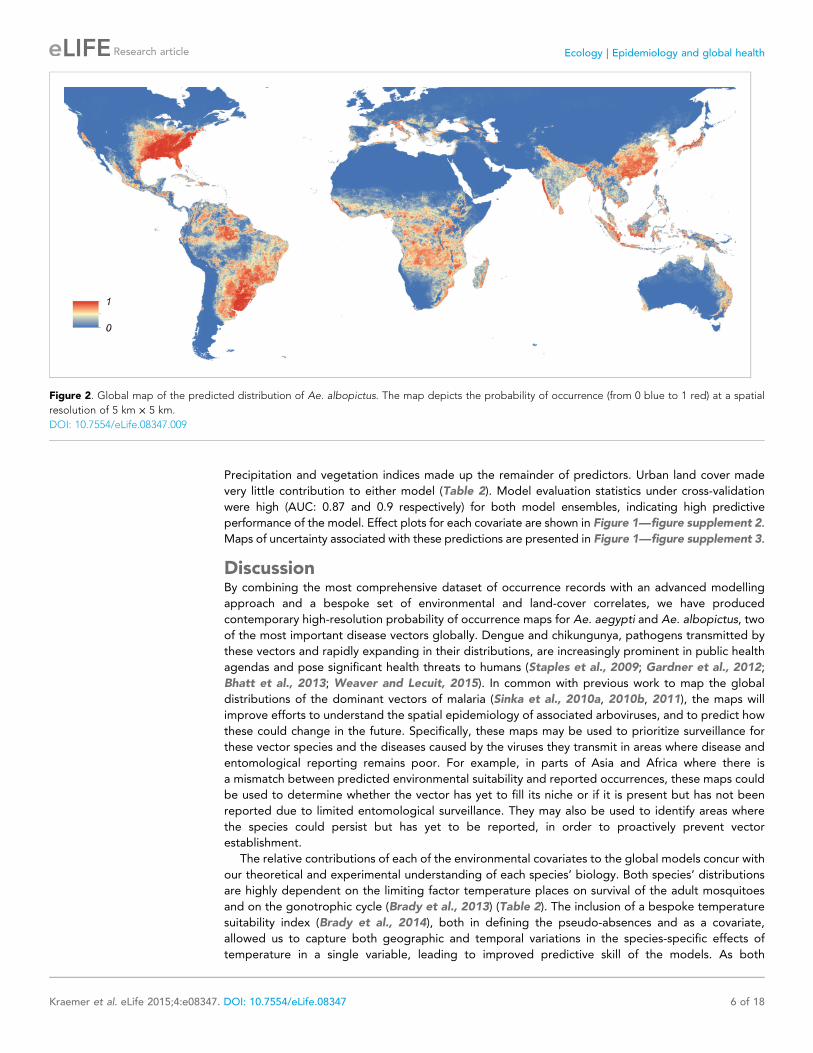
reflecting the known historic distribution of Ae. aegypti. By contrast, the distribution of Ae. albopictus
extends into southern Europe (Figure 3A), northern China, southern Brazil, northern United States
(3b), and Japan. Again, this reflects the current and historic distribution of Ae. albopictus and the
ability of the species to tolerate lower temperatures (Tsuda and Takagi, 2001; Lounibos et al., 2002;
Thomas et al., 2012; Brady et al., 2014).
Table 1. The geographic distribution of spatially unique occurrence records for the Americas, Europe/Africa, and Asia/Oceania
Country Occurrences Country Occurrences Country Occurrences
Ae. aegypti
Americas Brazil 5,044 Europe/Africa
Senegal 112 Asia/Oceania
Taiwan 9,490
USA 436 Cameroon 55 Indonesia 603
Mexico 411 Kenya 52 Thailand 495
Cuba 177 United Republic ofTanzania
44 India 423
Argentina 170 Cote d’Ivoire 40 Australia 282
Trinidad andTobago
152 Nigeria 35 Viet Nam 223
Venezuela 130 Madagascar 28 Malaysia 112
Colombia 128 Gabon 27 Singapore 44
Puerto Rico 120 Mayotte 20 Philippines 36
Peru 89 Sierra Leone 20 Cambodia 29
Ae. albopictus
Americas Brazil 3,441 Europe/Africa
Italy 203 Asia/Oceania
Taiwan 15,339
USA 1,594 Madagascar 58 Malaysia 186
Mexico 50 Cameroon 42 Indonesia 161
Cayman Islands 15 France 37 India 150
Haiti 13 Gabon 27 Japan 97
Guatemala 12 Albania 22 Thailand 82
Venezuela 7 Mayotte 21 Singapore 44
Colombia 3 Greece 18 Lao People’s DemocraticRepublic
26
Cuba 3 Israel 17 Philippines 22
Puerto Rico 3 Lebanon 15 Viet Nam 18
Top 10 countries in terms of occurrence records for each continent are shown for Ae. aegypti (a) and Ae. albopictus (b).
DOI: 10.7554/eLife.08347.003
Kraemer et al. eLife 2015;4:e08347. DOI: 10.7554/eLife.08347 4 of 18
Research article Ecology | Epidemiology and global health
In Europe, the predicted potential distribution of Ae. albopictus contains most of the known
occurrence points, but suitability is also predicted in Portugal and the west of Spain, and in much of
south-eastern Europe and the Balkans, where the species has yet to be reported. Similarly, in China
Ae. albopictus has yet to be reported from much of the area predicted to be environmentally suitable.
By contrast, in the United States the species has been reported from almost all of the predicted
suitable areas, with the exception of a small band of predicted suitability on the western slope of the
Sierra Nevada. Due to the relatively sparse reporting from Africa it remains uncertain whether areas
predicted to be highly suitable are already infested or have yet to be colonized by the species.
Ae. albopictus for example has only been reported from some West African countries (Nigeria,
Cameroon, Gabon, the Central African Republic, Congo, Cote d’Ivoire) and Madagascar, and South
Africa (as well as some islands in the Indian Ocean). The distribution of Ae. aegypti in Africa seems
to be much wider, with reports of species occurrence in over 30 countries.
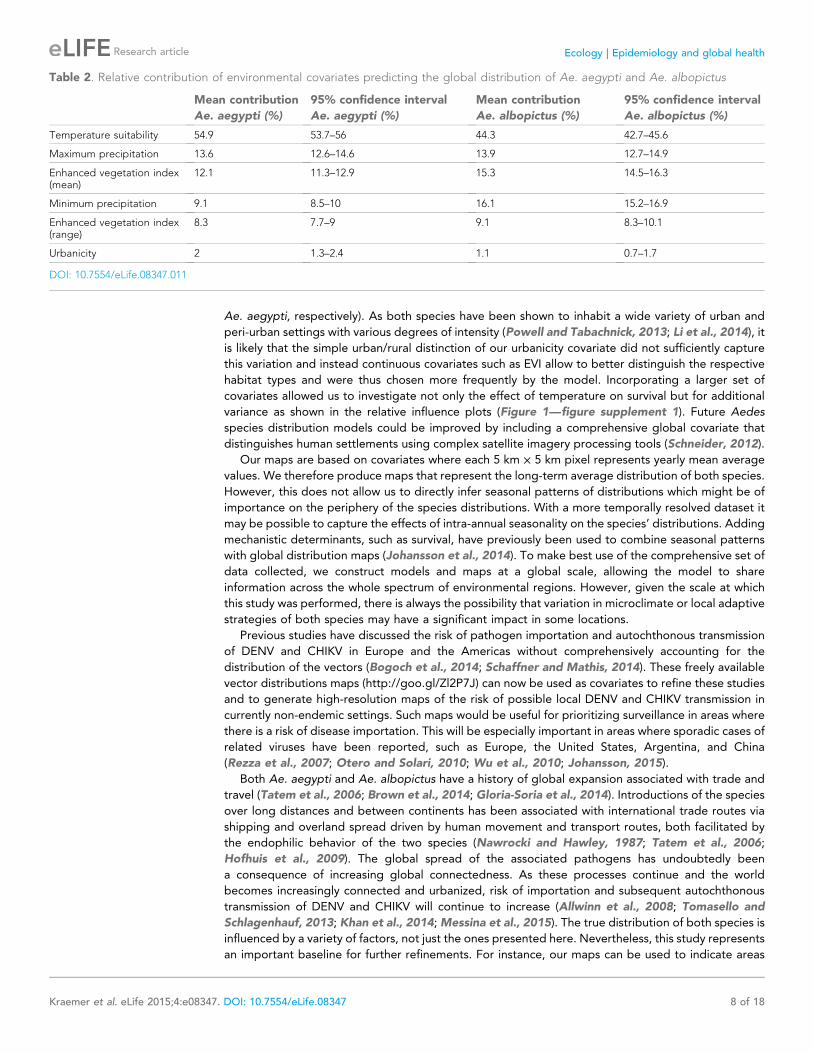
For both species, the most important predictor was temperature. Temperature suitability indices
had high relative influence statistics for both species; this variable was selected in approximately
half of regression tree decisions for Ae. aegypti (54.9%, CI = 53.7–56%) and Ae. albopictus (44.3%,
CI = 42.7–45.6%). The full definition of a relative influence statistic is given in the ‘Materials and
methods’ section under the heading Predictive performance and relative influence of covariates.
Figure 1. Global map of the predicted distribution of Ae. aegypti. The map depicts the probability of occurrence (from 0 blue to 1 red) at a spatial
resolution of 5 km × 5 km.
DOI: 10.7554/eLife.08347.004
The following figure supplements are available for figure 1:
Figure supplement 1. Effect plots of covariates used in this study showing the marginal effect of each covariate on probability of presence for Ae. aegypti
(1) and Ae. albopictus (2): enhanced vegetation index (EVI) annual mean (A); Enhanced vegetation index—range (B); annual monthly maximum
precipitation (C); annual monthly minimum precipitation (D); temperature suitability (E); urban areas (F); peri-urban areas (G).
DOI: 10.7554/eLife.08347.005
Figure supplement 2. Set of covariate layers used to predict the ecological niche of Ae. aegypti and Ae. albopictus described in detail in the ‘Materials
and methods’ section; (A) enhanced vegetation index (EVI) annual mean, (B) EVI annual range, (C) annual monthly maximum precipitation, (D) annual
monthly minimum precipitation, (E) temperature suitability for Ae. albopictus, (F) temperature suitability for Ae. aegypti, (G) rural, peri-urban and urban
classification layer.
DOI: 10.7554/eLife.08347.006
Figure supplement 3. Visualization of pixel level uncertainty calculated using the upper and lower bounds of the 95% confidence intervals associated with
the prediction maps for Ae. aegypti (A) and Ae. albopictus (B).
DOI: 10.7554/eLife.08347.007
Figure supplement 4. The distribution of the occurrence database for Ae. aegypti (A) and Ae. albopictus (B) plotted on the underlying prediction surface.
DOI: 10.7554/eLife.08347.008
Kraemer et al. eLife 2015;4:e08347. DOI: 10.7554/eLife.08347 5 of 18
Research article Ecology | Epidemiology and global health
Precipitation and vegetation indices made up the remainder of predictors. Urban land cover made
very little contribution to either model (Table 2). Model evaluation statistics under cross-validation
were high (AUC: 0.87 and 0.9 respectively) for both model ensembles, indicating high predictive
performance of the model. Effect plots for each covariate are shown in Figure 1—figure supplement 2.
Maps of uncertainty associated with these predictions are presented in Figure 1—figure supplement 3.
DiscussionBy combining the most comprehensive dataset of occurrence records with an advanced modelling
approach and a bespoke set of environmental and land-cover correlates, we have produced
contemporary high-resolution probability of occurrence maps for Ae. aegypti and Ae. albopictus, two
of the most important disease vectors globally. Dengue and chikungunya, pathogens transmitted by
these vectors and rapidly expanding in their distributions, are increasingly prominent in public health
agendas and pose significant health threats to humans (Staples et al., 2009; Gardner et al., 2012;
Bhatt et al., 2013; Weaver and Lecuit, 2015). In common with previous work to map the global
distributions of the dominant vectors of malaria (Sinka et al., 2010a, 2010b, 2011), the maps will
improve efforts to understand the spatial epidemiology of associated arboviruses, and to predict how
these could change in the future. Specifically, these maps may be used to prioritize surveillance for
these vector species and the diseases caused by the viruses they transmit in areas where disease and
entomological reporting remains poor. For example, in parts of Asia and Africa where there is
a mismatch between predicted environmental suitability and reported occurrences, these maps could
be used to determine whether the vector has yet to fill its niche or if it is present but has not been
reported due to limited entomological surveillance. They may also be used to identify areas where
the species could persist but has yet to be reported, in order to proactively prevent vector
establishment.
The relative contributions of each of the environmental covariates to the global models concur with
our theoretical and experimental understanding of each species’ biology. Both species’ distributions
are highly dependent on the limiting factor temperature places on survival of the adult mosquitoes
and on the gonotrophic cycle (Brady et al., 2013) (Table 2). The inclusion of a bespoke temperature
suitability index (Brady et al., 2014), both in defining the pseudo-absences and as a covariate,
allowed us to capture both geographic and temporal variations in the species-specific effects of
temperature in a single variable, leading to improved predictive skill of the models. As both
Figure 2. Global map of the predicted distribution of Ae. albopictus. The map depicts the probability of occurrence (from 0 blue to 1 red) at a spatial
resolution of 5 km × 5 km.
DOI: 10.7554/eLife.08347.009
Kraemer et al. eLife 2015;4:e08347. DOI: 10.7554/eLife.08347 6 of 18
Research article Ecology | Epidemiology and global health

Ae. aegypti and Ae. albopictus lay their eggs in small water-filled containers (Morrison et al., 2004), it
is encouraging that precipitation also has a strong influence on the model’s predictions. The stronger
influence of minimum precipitation for Ae. albopictus than for Ae. aegypti (16.1% vs 9.1%, Table 2)
may reflect the former species’ preference for non-domestic juvenile habitats, which are solely reliant
on filling via precipitation. By contrast, Ae. aegypti primarily inhabits domestic water-holding
containers (Scott et al., 2000) that are maintained in low-precipitation environments by water storage
activities. The greater importance of enhanced vegetation index (EVI) for Ae. albopictus than for
Ae. aegypti (15.3% vs 12.1%, Table 2) also supports the hypothesis that Ae. albopictus tends to prefer
non-domestic juvenile sites (Morrison et al., 2004). This does not, however, rule out the possibility
that the two species can overlap. Additional finer scale studies need to be conducted to investigate if
competitive exclusion for hosts and/or habitat occurs between Ae. aegypti and Ae. albopictus. The
effect of urbanicity was surprisingly low for both species (2% and 1.1% for Ae. albopictus and
Figure 3. Predicted probability of occurrence of Ae. albopictus in Europe (A) and the United States (B), regions in
which Ae. albopictus is rapidly expanding its range. Points represent known occurrences (transient [triangles] or
established [circles]) until the end of 2013.
DOI: 10.7554/eLife.08347.010
Kraemer et al. eLife 2015;4:e08347. DOI: 10.7554/eLife.08347 7 of 18
Research article Ecology | Epidemiology and global health
Ae. aegypti, respectively). As both species have been shown to inhabit a wide variety of urban and
peri-urban settings with various degrees of intensity (Powell and Tabachnick, 2013; Li et al., 2014), it
is likely that the simple urban/rural distinction of our urbanicity covariate did not sufficiently capture
this variation and instead continuous covariates such as EVI allow to better distinguish the respective
habitat types and were thus chosen more frequently by the model. Incorporating a larger set of
covariates allowed us to investigate not only the effect of temperature on survival but for additional
variance as shown in the relative influence plots (Figure 1—figure supplement 1). Future Aedes
species distribution models could be improved by including a comprehensive global covariate that
distinguishes human settlements using complex satellite imagery processing tools (Schneider, 2012).
Our maps are based on covariates where each 5 km × 5 km pixel represents yearly mean average
values. We therefore produce maps that represent the long-term average distribution of both species.
However, this does not allow us to directly infer seasonal patterns of distributions which might be of
importance on the periphery of the species distributions. With a more temporally resolved dataset it
may be possible to capture the effects of intra-annual seasonality on the species’ distributions. Adding
mechanistic determinants, such as survival, have previously been used to combine seasonal patterns
with global distribution maps (Johansson et al., 2014). To make best use of the comprehensive set of
data collected, we construct models and maps at a global scale, allowing the model to share
information across the whole spectrum of environmental regions. However, given the scale at which
this study was performed, there is always the possibility that variation in microclimate or local adaptive
strategies of both species may have a significant impact in some locations.
Previous studies have discussed the risk of pathogen importation and autochthonous transmission
of DENV and CHIKV in Europe and the Americas without comprehensively accounting for the
distribution of the vectors (Bogoch et al., 2014; Schaffner and Mathis, 2014). These freely available
vector distributions maps (http://goo.gl/Zl2P7J) can now be used as covariates to refine these studies
and to generate high-resolution maps of the risk of possible local DENV and CHIKV transmission in
currently non-endemic settings. Such maps would be useful for prioritizing surveillance in areas where
there is a risk of disease importation. This will be especially important in areas where sporadic cases of
related viruses have been reported, such as Europe, the United States, Argentina, and China
(Rezza et al., 2007; Otero and Solari, 2010; Wu et al., 2010; Johansson, 2015).
Both Ae. aegypti and Ae. albopictus have a history of global expansion associated with trade and
travel (Tatem et al., 2006; Brown et al., 2014; Gloria-Soria et al., 2014). Introductions of the species
over long distances and between continents has been associated with international trade routes via
shipping and overland spread driven by human movement and transport routes, both facilitated by
the endophilic behavior of the two species (Nawrocki and Hawley, 1987; Tatem et al., 2006;
Hofhuis et al., 2009). The global spread of the associated pathogens has undoubtedly been
a consequence of increasing global connectedness. As these processes continue and the world
becomes increasingly connected and urbanized, risk of importation and subsequent autochthonous
transmission of DENV and CHIKV will continue to increase (Allwinn et al., 2008; Tomasello and
Schlagenhauf, 2013; Khan et al., 2014; Messina et al., 2015). The true distribution of both species is
influenced by a variety of factors, not just the ones presented here. Nevertheless, this study represents
an important baseline for further refinements. For instance, our maps can be used to indicate areas
Table 2. Relative contribution of environmental covariates predicting the global distribution of Ae. aegypti and Ae. albopictus
Mean contribution
Ae. aegypti (%)
95% confidence interval
Ae. aegypti (%)
Mean contribution
Ae. albopictus (%)
95% confidence interval
Ae. albopictus (%)
Temperature suitability 54.9 53.7–56 44.3 42.7–45.6
Maximum precipitation 13.6 12.6–14.6 13.9 12.7–14.9
Enhanced vegetation index(mean)
12.1 11.3–12.9 15.3 14.5–16.3
Minimum precipitation 9.1 8.5–10 16.1 15.2–16.9
Enhanced vegetation index(range)
8.3 7.7–9 9.1 8.3–10.1
Urbanicity 2 1.3–2.4 1.1 0.7–1.7
DOI: 10.7554/eLife.08347.011
Kraemer et al. eLife 2015;4:e08347. DOI: 10.7554/eLife.08347 8 of 18
Research article Ecology | Epidemiology and global health

where the species are likely to become established if introduced. Accurately predicting the future
distributions of these species will also require model-based estimates of the rate at which these
species colonize new areas. Such predictions can be informed by human and trade mobility patterns
between endemic and non-endemic regions as well as data on the past spread of the vectors.
Improving our ability to predict rates of vector importation will therefore be crucial to inferring future
risk (Seebens et al., 2013).
Previous studies have provided crucial information on genetic variation both within and between
populations of these two vector species (Brown et al., 2011). As the volume of georeferenced
information on the population genetics of Ae. aegypti and Ae. albopictus increases, the potential to
incorporate this information into mapping analyses to understand the current and future distribution
of disease risk also increases. Phylogeographic analyses offer a unique way to infer the recent patterns
of vector spread and to identify the major routes of importation (Allicock et al., 2012). This
information is crucial to inform models that predict the risk of vector introductions.
Phylogenetic information could also be used to inform future iterations of the species distribution
models used here by enabling the model to characterize and map environmental suitability for
different vector subspecies. This could be particularly useful in the case of Ae. albopictus where
genetic variation is known to underlie the ability to undergo diapause and therefore to overwinter in
colder locations (Takumi et al., 2009). Mapping the distributions of distinct genetic subgroups could
also improve our understanding of the complex interactions between mosquito vector populations
and virus strains and how this relates to spatial variation in transmission intensity (Tsetsarkin et al.,
2007; Vazeille et al., 2007; Tsetsarkin and Weaver, 2011; Zouache et al., 2014).
The maps presented comprise a contemporary estimate of the current and potential future
distribution of Ae. aegypti and Ae. albopictus. As more occurrence data become available, these
maps can be refined to incorporate recent importation and establishment events and corresponding
improvements in predictions. By disseminating both the occurrence data and the predictive maps on
an open-access basis we hope to facilitate both the future development of these maps and their
uptake by the global public health community.
Materials and methodsA BRT modelling approach was applied to derive probabilistic global environmental risk maps for
Ae. aegypti and Ae. albopictus. BRT models are machine-learning model ensembles commonly used
in species distribution modelling (SDM) and show strong predictive performance due to their ability to
handle complex non-linear relationships between probability of species occurrence and multiple
environmental correlates (Elith et al., 2006, 2008). Our model required the following sets of input
data in order to make accurate predictions of the distribution of these two species: (i) a temperature
suitability mask defining the fundamental limits of both species; (ii) a globally comprehensive dataset
of geo-positioned occurrence points for both species; (iii) appropriate land-cover and environmental
covariate datasets that help explain the current distribution of the species; and (iv) a set of species
absence records that further refine the species range and reduce sampling bias. Details regarding the
specific attributes of the model and data generation are outlined below and maps of each of the
covariates are shown in Figure 1—figure supplement 2.
Temperature suitability maskWhile the niche of a species is determined by a host of environmental, ecological and socio-economic
factors of unknown influence and interaction strength, it is possible to exclude parts of the niche if the
direct effects of one factor on a step rate-limiting to population persistence are well known. One such
example for mosquito population persistence is whether temperature permits adult females to survive
long enough to complete their first gonotrophic cycle and thus oviposit. Both adult female longevity
and length of first gonotrophic cycle are temperature dependent. Combining these two relationships
with a dynamic population-level simulation, Brady et al. (2013, 2014) evaluated the thermal limits to
persistence of Ae. aegypti and Ae. albopictus populations on a global scale. The binary outputs of this
model are used as a mask to sample pseudo-absence points in locations known to be unsuitable–
thereby informing the statistical model using mechanistic model outputs. The temperature suitability
index developed by Brady et al. is also used in a continuous variable form (i.e., the relative number of
ovipositions of parous females permitted by temperature) as a covariate in the BRT model.
Kraemer et al. eLife 2015;4:e08347. DOI: 10.7554/eLife.08347 9 of 18
Research article Ecology | Epidemiology and global health
Occurrence recordsThe database used for this study contains information on the known global occurrences of the adults,
pupae, larvae or eggs of Ae. aegypti and Ae. albopictus globally from 1960–2014. We included data
from a variety of sources, including (1) published literature and (2) primary and unpublished occurrence
data from national and international entomological surveys. To our knowledge this is the largest, most
comprehensive global dataset for both Ae. aegypti and Ae. albopictus. Confirmed Aedes occurrences
were entered in the database after a comprehensive literature search using methods described
elsewhere (Kraemer et al., 2015a; Kraemer et al., 2015b; http://dx.doi.org/10.5061/dryad.47v3c).
In short, this included extracting all available location (latitude and longitude) information from the
relevant articles, primarily using Google Maps (http://www.google.com/maps) so that it matched the
spatial resolution of our covariate datasets of approximately 5 km × 5 km. Primary and unpublished data
sources were obtained from Brazil, Europe, Indonesia, Taiwan, and the United States. After consolidating
all data into two large databases for each species, independently they underwent spatial and temporal
standardization. An occurrence record was defined as a single occurrence at a given unique location
within one calendar year. This was important to avoid over-representation in regions where multiple
surveys per year were performed, such as Taiwan or Brazil. To ensure the accuracy of the data we
overlaid the geolocated occurrence points with a raster that distinguished land from water. Any records
that were positioned outside the land area were subsequently removed. In total we assembled 19,930
and 22,137 occurrence records for Ae. aegypti and Ae. albopictus respectively. The distribution of
occurrence points are plotted in Figure 1—figure supplement 4.
Land-cover and environmental variablesThe distribution of both species considered in this study are known to be influenced by environmental
factors such as temperature and demographic factors such as urbanisation (Lounibos, 2002; Brown
et al., 2014). Global gridded maps of such variables are becoming ever more available and have been
commonly applied in SDM and disease mapping (Hijmans et al., 2005; Hay et al., 2006; Gething
et al., 2011; Bhatt et al., 2013; Pigott et al., 2014a, 2014b). The rationale for the inclusion of each
variable we used is described below.
EVISurvival of Ae. aegypti and Ae. albopictus is highly dependent on temperature and water availability
(Luz et al., 2008). EVI measures vegetation canopy greenness and can be used as a proxy for soil
surface-level moisture that are associated with the availability of mosquito larval development sites
(Estallo et al., 2008;Nihei et al., 2014). Eggs and adults require moisture to survive, with low dry season
moisture levels affecting adult mortality (Sota and Mogi, 1992; Russell et al., 2001). Vegetation canopy
cover reduces evaporation and wind speed in the sub-canopy, which protects mosquito development
sites (Linthicum, 1999; Fuller et al., 2009; Hahn et al., 2014). We used range and mean values of
MODIS EVI after processing through a gap-filling algorithm described elsewhere (Weiss et al., 2014).
PrecipitationThe principal larval habitats of both species are man-made containers that are used for water storage or
accumulate rain (Morrison et al., 2004). Some local studies have shown that there is a relationship
between precipitation and vector abundance (Scott et al., 2000; Romero-Vivas and Falconar, 2005). To
account for the availability of water-filled containers a maximum and minimum annual precipitation layer
was extracted from the WorldClim database and projected for the year 2015 (http://www.worldclim.org).
UrbanisationAe. aegypti adults are highly domesticated mosquitoes feeding almost exclusively on humans
(Bargielowski et al., 2013), larvae develop preferentially in artificial containers in close association with
human habitation, often in urban settings (Lounibos, 2002; Honorio et al., 2003; Brown et al., 2011,
2014; Powell and Tabachnick, 2013). Ae. albopictus are more commonly found in rural and peri-urban
settings, feeding readily on a variety of mammalian and avian species, although Ae. albopictus shows
similar larval development behavior in artificial containers (Reiter, 2001; Gratz, 2004; Juliano and
Philip Lounibos, 2005; Li et al., 2014). To account for differences in urban, peri-urban and rural
environments we built a categorical variable by supplementing the projected 2010 Global Rural Urban
Mapping Project (GRUMP) urban and rural categories with land-cover classes using night-time light
satellite imagery and population density, using the most up-to-date national censuses available to the
Kraemer et al. eLife 2015;4:e08347. DOI: 10.7554/eLife.08347 10 of 18
Research article Ecology | Epidemiology and global health
smallest available administrative unit available (Balk et al., 2006). A gridded surface of 5 km × 5 km cells
was generated with each pixel representing either urban, peri-urban, or rural areas.
Modelling approachBRT models consistently outperform other species distribution models such as maximum entropy
(Maxent), GARP, and BIOCLIM in their predictive performance (Elith et al., 2006; Leathwick et al.,
2006). BRT combines the strengths of regression trees (i.e., the omission of irrelevant variables and
the ability to model complex interactions) with machine learning techniques (i.e., the building of an
ensemble of models that approximate the true response surface [Elith and Leathwick, 2009]).
To prevent overfitting, the model used a penalized forward stepwise search and cross-validation
method to identify the optimal number of decision trees (Elith et al., 2008). Modelling was performed
using the gbm, dismo, raster and seegSDM R packages using the R v 3.1.1 environment (Ridgeway,
2013; Golding, 2014; Hijmans, 2014; R Core Team, 2014).
Removing sample selection biasPseudo-absence (also referred to as background) records provide a sample of the set of conditions
available to the species in the region rather than actual absences (Phillips et al., 2009). These records
are needed because true absences are generally unavailable in large composite datasets such as the
one used in this study. To account for reporting bias in presence data, a common problem with
presence-only SDM, which if not accounted for can lead to biases in the resulting predictions, we follow
Phillips et al. (2009) in sampling pseudo-absence points according to the same reporting bias likely to
be present in occurrence records (namely spatial variation in reporting of mosquito occurrence). Firstly,
we selected 10,000 occurrence records of Aedes species from the Global Biodiversity Information
Facility (http://www.gbif.org), omitting all records of Ae. aegypti and Ae. albopictus. This dataset is
intended to reflect biases in mosquito reporting in areas which are suitable for Aedes mosquitoes.
Secondly, to reflect areas where habitats are biologically not suitable for Aedes occurrence we sampled
an additional 10,000 pseudo-absence points at random locations, with sampling probability greatest in
areas that the biologically-based temperature suitability index predicted to be unsuitable. Thirdly,
sampling of occurrence points was also biased towards oversampled regions such as Brazil and Taiwan
in which there were a large number of reported occurrence records due to the inclusion of results of
large national entomological surveys (Table 1). Therefore, we weighted occurrence records from these
locations so that the density of occurrence records per country matched the density of all other records
globally by dividing the number of occurrence points by the size of the respective countries.
ModellingAn ensemble BRT was constructed using 120 sub-models to derive uncertainty distributions of the
prediction map. Each of the 120 sub-models was fitted to a separate bootstrap resampling of the
dataset and used to generate a probability map for each individual species on a 5 km × 5 km resolution.
The mean of these 120 sub-models was used as the final Aedes risk maps. Pixel based uncertainty was
estimated by calculating the 95% confidence interval from the 120 sub-models.
Predictive performance and relative influence of covariatesThe variables used as land-cover and environmental correlates used in this study are quantified based
on their relative influence (0–100) on explaining the variance in the models calculated as the sum of the
number of times a particular variable is selected for splitting the decision tree, weighted by the squared
improvement to the overall model averaged over all trees (Friedman, 2001; Friedman and Meulman,
2003). Note that in a BRT, non-informative predictors are largely ignored (Elith et al., 2008). Predictive
performance of each sub-model was evaluated using the area under curve (AUC) statistic calculated as
the mean AUC for each of the ten cross-validation folds evaluated against the other 90% of the data
under the pairwise distance sampling procedure of Hijmans (2012). The overall predictive accuracy of
the model was measured as the mean and standard deviation of these AUCs across all 120 sub-models
(Merckx et al., 2010; Hijmans, 2012).
AcknowledgementsMUGK is funded by the German Academic Exchange Service (DAAD) through a graduate scholarship.
MES is funded by a project grant from the Bill & Melinda Gates Foundation as part of the VecNet
consortium (http://vecnet.org). FMS is funded by the Rhodes Trust. CMB acknowledges funding from
Kraemer et al. eLife 2015;4:e08347. DOI: 10.7554/eLife.08347 11 of 18
Research article Ecology | Epidemiology and global health
the U.S. National Aeronautics and Space Administration (#NNX15AF36G). CGM was funded in part by
contract N01-A1-25489 from the NIH/National Institute of Allergy and Infectious Diseases. IRFE is
funded by the Wellcome Trust (#099872). WVB, GH, and FS acknowledge funding from VBORNET, an
ECDC funded project (contract number ECDC/09/018). OJB is funded by a BBSRC studentship. JPM
is funded by, and SIH, GRWW, TWS and OJB acknowledge the support of the International Research
Consortium on Dengue Risk Assessment Management and Surveillance (IDAMS, European
Commission seventh Framework Programme (#21803) http://www.idams.eu). The contents of this
publication are the sole responsibility of the authors and do not necessarily reflect the views of the
European Commission. DMP is funded by a Sir Richard Southwood Graduate Scholarship from the
Department of Zoology at the University of Oxford. TWS acknowledges funding from the Bill &
Melinda Gates Foundation (#OPP52250), the Innovative Vector Control Consortium, and the NIH
(R01-AI069341, R01-AI091980, R01-GM08322, and 1P01AI098670). TWS, CMB, DLS and SIH also
acknowledge funding support from the Research and Policy in Infectious Diseases Dynamics (RAPIDD)
program of the Science and Technology Directorate, Department of Homeland Security, and the
Fogarty International Center, National Institutes of Health. NG is funded by a grant from the Bill &
Melinda Gates Foundation (#OPP1053338). SIH is funded by a Senior Research Fellowship from the
Wellcome Trust (#095066), which also supports KAD and AQNM.
We want to thank Ralph E Harbach for his comments on the final manuscript. We thank Dr Roseli La
Corte dos Santos, Departamento de Morfologia, Universidade Federal de Sergipe for providing useful
guidance, the Ministry of Health of Brazil municipality secretaries and Centers for Disease Control of
Taiwan for providing mosquito occurrence data and Bimandra Djaafara and Karin Dian Lestari of EOCRU
for their work on geo-referencing the Indonesia Aedes datasets. We also want to thank the VBORNET &
TigerMaps network funded by ECDC, Stockholm, and all their contributors (a detailed list is given in
Supplementary file 1) for releasing their vector distribution data. The funders had no role in study design,
data collection and analysis, decision to publish, or preparation of the manuscript.
Additional informationCompeting interests
SIH: Reviewing editor, eLife. The other authors declare that no competing interests exist.
Funding
Funder Grant reference Author
Studienstiftung des DeutschenVolkes
Moritz UG Kraemer
Bill and Melinda GatesFoundation
#OPP1053338 Nick Golding
Wellcome Trust #095066 Kirsten A Duda, Adrian QNMylne, Simon I Hay
European Centre for DiseasePrevention and Control
ECDC/09/018 Wim Van Bortel, GuyHendrickx, Francis Schaffner
European CommissionDirectorate-General forResearch and Innovation
#21803 Oliver J Brady, Jane P Messina
Biotechnology and BiologicalSciences Research Council(BBSRC)
Oliver J Brady
National Aeronautics andSpace Administration (NASA)
#NNX15AF36G Christopher M Barker
National Institutes ofHealth (NIH)
RAPIDD program Christopher M Barker, ThomasW Scott, David L Smith, SimonI Hay
National Institutes ofHealth (NIH)
R01-AI069341 Thomas W Scott
National Institutes ofHealth (NIH)
R01-AI091980 Thomas W Scott
Kraemer et al. eLife 2015;4:e08347. DOI: 10.7554/eLife.08347 12 of 18
Research article Ecology | Epidemiology and global health
Funder Grant reference Author
National Institutes ofHealth (NIH)
R01-GM08322 Thomas W Scott
National Institutes ofHealth (NIH)
N01-A1-25489 Chester G Moore
Bill and Melinda GatesFoundation
#OPP52250 Thomas W Scott
Sir Richard SouthwoodGraduate Scholarship
David M Pigott
Wellcome Trust Vecnet Marianne E Sinka
Wellcome Trust #099872 Iqbal RF Elyazar
The Rhodes Trust Freya M Shearer
The funders had no role in study design, data collection and interpretation, or thedecision to submit the work for publication.
Author contributions
MUGK, Conception and design, Acquisition of data, Analysis and interpretation of data, Drafting or
revising the article; MES, FMS, Acquisition of data, Drafting or revising the article; KAD, AQNM,
Acquisition of data; CMB, CGM, RGC, GEC, WVB, FS, IRFE, H-JT, Drafting or revising the article,
Contributed unpublished essential data or reagents; GH, Contributed unpublished essential data or
reagents; OJB, NG, SIH, Conception and design, Analysis and interpretation of data, Drafting or
revising the article; JPM, DMP, DLS, Analysis and interpretation of data, Drafting or revising the
article; TWS, Conception and design, Drafting or revising the article; GRWW, Analysis and
interpretation of data, Drafting or revising the article, Contributed unpublished essential data or
reagents
Author ORCIDsChristopher M Barker, http://orcid.org/0000-0002-7941-346XFrancis Schaffner, http://orcid.org/0000-0001-9166-7617David M Pigott, http://orcid.org/0000-0002-6731-4034David L Smith, http://orcid.org/0000-0003-4367-3849Nick Golding, http://orcid.org/0000-0001-8916-5570Simon I Hay, http://orcid.org/0000-0002-0611-7272
Additional filesSupplementary file
·Supplementary file 1. List of contributors and their affiliation from TigerMaps & VBORNET for
Ae. albopictus presence records in Europe.DOI: 10.7554/eLife.08347.012
Major datasetThe following dataset was generated:
Author(s) Year Dataset titleDataset IDand/or URL
Database, license, andaccessibility information
Kraemer MUG, Sinka ME,Duda KA, Mylne A, ShearerFM, Brady OJ, Messina JP,Barker CM, Moore CG,Carvalho RG, Coelho GE,Van Bortel W, Hendrickx G,Schaffner F, Wint GRW,Elyazar IRF, Teng H, Hay SI
2015 Data from: The globalcompendium of Aedesaegypti and Ae.albopictus occurrence
http://dx.doi.org/10.5061/dryad.47v3c
Available at Dryad DigitalRepository under a CC0Public DomainDedication.
ReferencesAllicock OM, Lemey P, Tatem AJ, Pybus OG, Bennett SN, Mueller BA, Suchard MA, Foster JE, Rambaut A,Carrington CV. 2012. Phylogeography and population dynamics of dengue viruses in the Americas. MolecularBiology and Evolution 29:1533–1543. doi: 10.1093/molbev/msr320.
Kraemer et al. eLife 2015;4:e08347. DOI: 10.7554/eLife.08347 13 of 18
Research article Ecology | Epidemiology and global health
Allwinn R, Hofknecht N, Doerr HW. 2008. Dengue in travellers is still underestimated. Intervirology 51:96–100.doi: 10.1159/000131667.
Astrom C, Rocklov J, Hales S, Beguin A, Louis V, Sauerborn R. 2012. Potential distribution of dengue feverunder scenarios of climate change and economic development. Ecohealth 9:448–454. doi: 10.1007/s10393-012-0808-0.
Balk DL, Deichmann U, Yetman G, Pozzi F, Hay SI, Nelson A. 2006. Determining global population distribution:methods, applications and data. Advances in Parasitology 62:119–156. doi: 10.1016/S0065-308X(05)62004-0.
Bargielowski IE, Lounibos LP, Carrasquilla MC. 2013. Evolution of resistance to satyrization through reproductivecharacter displacement in populations of invasive dengue vectors. Proceedings of the National Academy ofSciences of USA 110:2888–2892. doi: 10.1073/pnas.1219599110.
Benedict MQ, Levine RS, Hawley WA, Lounibos LP. 2007. Spread of the tiger: global risk of invasion by themosquito Aedes albopictus. Vector Borne and Zoonotic Diseases 7:76–85. doi: 10.1089/vbz.2006.0562.
Bhatt S, Gething PW, Brady OJ, Messina JP, Farlow AW, Moyes CL, Drake JM, Brownstein JS, Hoen AG, Sankoh O,Myers MF, George DB, Jaenisch T, Wint GR, Simmons CP, Scott TW, Farrar JJ, Hay SI. 2013. The globaldistribution and burden of dengue. Nature 496:504–507. doi: 10.1038/nature12060.
Bogoch II, Creatore MI, Cetron MS, Brownstein JS, Pesik N, Miniota J, Tam T, Hu W, Nicolucci A, Ahmed S, YoonJW, Berry I, Hay SI, Anema A, Tatem AJ, MacFadden D, German M, Khan K. 2014. Assessment of the potentialfor international dissemination of Ebola virus via commercial air travel during the 2014 west African outbreak.Lancet 6736:1–7. doi: 10.1016/S0140-6736(14)61828-6.
Borgherini G, Poubeau P, Staikowsky F, Lory M, Le Moullec N, Becquart JP, Wengling C, Michault A, Paganin F.2007. Outbreak of chikungunya on Reunion Island: early clinical and laboratory features in 157 adult patients.Clinical Infectious Diseases 44:1401–1407. doi: 10.1086/517537.
Brady OJ, Gething PW, Bhatt S, Messina JP, Brownstein JS, Hoen AG, Moyes CL, Farlow AW, Scott TW, Hay SI.2012. Refining the global spatial limits of dengue virus transmission by evidence-based consensus. PLOSNeglected Tropical Diseases 6:e1760. doi: 10.1371/journal.pntd.0001760.
Brady OJ, Golding N, Pigott DM, Kraemer MU, Messina JP, Reiner RC Jr, Scott TW, Smith DL, Gething PW, Hay SI.2014. Global temperature constraints on Aedes aegypti and Ae. albopictus persistence and competence fordengue virus transmission. Parasites & Vectors 7:338. doi: 10.1186/1756-3305-7-338.
Brady OJ, Johansson MA, Guerra CA, Bhatt S, Golding N, Pigott DM, Delatte H, Grech MG, Leisnham PT, Maciel-de-Freitas R, Styer LM, Smith DL, Scott TW, Gething PW, Hay SI. 2013. Modelling adult Aedes aegypti and Aedesalbopictus survival at different temperatures in laboratory and field settings. Parasites & Vectors 6:351. doi: 10.1186/1756-3305-6-351.
Brown JE, Evans BR, Zheng W, Obas V, Barrera-Martinez L, Egizi A, Zhao H, Caccone A, Powell JR. 2014. Humanimpacts have shaped historical and recent evolution in Aedes aegypti, the dengue and yellow fever mosquito.Evolution 68:514–525. doi: 10.1111/evo.12281.
Brown JE, McBride CS, Johnson P, Ritchie S, Paupy C, Bossin H, Lutomiah J, Fernandez-Salas I, Ponlawat A, CornelAJ, Black WC IV, Gorrochotegui-Escalante N, Urdaneta-Marquez L, Sylla M, Slotman M, Murray KO, Walker C,Powell JR. 2011. Worldwide patterns of genetic differentiation imply multiple ‘domestications’ of Aedes aegypti,a major vector of human diseases. Proceedings. Biological Sciences/The Royal Society 278:2446–2454. doi: 10.1098/rspb.2010.2469.
Caminade C, Medlock JM, Ducheyne E, McIntyre KM, Leach S, Baylis M, Morse AP. 2012. Suitability of Europeanclimate for the Asian tiger mosquito Aedes albopictus: recent trends and future scenarios. Journal of the RoyalSociety, Interface/The Royal Society 9:2708–2717. doi: 10.1098/rsif.2012.0138.
Campbell LP, Luther C, Moo-Llanes D, Ramsey JM, Danis-Lozano R, Peterson AT. 2015. Climate change influenceson global vector distributions for dengue and chikungunya viruses. Philosophical Transactions of the Royal Society B370. doi: 10.1098/rstb.2014.0135.
Carrington LB, Simmons CP. 2014. Human to mosquito transmission of dengue viruses. Frontiers in Immunology 5:1–8. doi: 10.3389/fimmu.2014.00290.
Carvalho RG, Lourenco-de-Oliveira R, Braga IA. 2014. Updating the geographical distribution and frequency ofAedes albopictus in Brazil with remarks regarding its range in the Americas. Memorias do Instituto Oswaldo Cruz109:787–796. doi: 10.1590/0074-0276140304.
Cauchemez S, Ledrans M, Poletto C, Quenel P, de Valk H, Colizza V, Boelle PY. 2014. Local and regional spread ofchikungunya fever in the Americas. Euro Surveillance 19:20854. doi: 10.2807/1560-7917.ES2014.19.28.20854.
Charrel R, Leparc-Goffart I, Gallian P, de Lamballerie X. 2014. Globalization of chikungunya: 10 years to invade theworld. Clinical Microbiology and Infection 20:662–663. doi: 10.1111/1469-0691.12694.
Daugherty MP, Alto BW, Juliano SA. 2000. Invertebrate carcasses as a resource for competing Aedes albopictus andAedes aegypti (Diptera: Culicidae). Journal of Medical Entomology 37:364–372. doi: 10.1093/jmedent/37.3.364.
Delatte AH, Gimonneau G, Triboire A, Fontenille D, Delatte H. 2009. Influence of temperature on immaturedevelopment, survival, longevity, fecundity, and gonotrophic cycles of Aedes albopictus, vector of chikungunyaand dengue in the Indian Ocean. Journal of Medical Entomology 46:33–41. doi: 10.1603/033.046.0105.
Delatte H, Desvars A, Bouetard A, Bord S, Gimonneau G, Vourc’h G, Fontenille D. 2010. Blood-feeding behavior ofAedes albopictus, a vector of chikungunya on La Reunion. Vector-Borne and Zoonotic Diseases 10:249–258.doi: 10.1089/vbz.2009.0026.
ECDC. 2014. Dengue outbreak in Madeira, Portugal, March 2013. Stockholm: European Centre for DiseasePrevention and Control.
Eisen L, Moore CG. 2013. Aedes (Stegomyia) aegypti in the continental United States: a vector at the cool marginof its geographic range. Journal of Medical Entomology 50:467–478. doi: 10.1603/ME12245.
Kraemer et al. eLife 2015;4:e08347. DOI: 10.7554/eLife.08347 14 of 18
Research article Ecology | Epidemiology and global health

Elith J, Graham CH, Anderson RP, Dudik M, Ferrier S, Guisan A, Hijmans RJ, Huettmann F, Leathwick JR, LehmannA, Li J, Lohmann LG, Loiselle BA, Manion G, Moritz C, Nakamura M, Nakazawa Y, Overton JM, Peterson AT,Phillips SJ, Ric K. 2006. Novel methods improve prediction of species’ distributions from occurrence data.Ecogeography 29:129–151. doi: 10.1111/j.2006.0906-7590.04596.x.
Elith J, Leathwick JR. 2009. Species distribution models: ecological explanation and prediction acrossspace and time. Annual Review of Ecology, Evolution, and Systematics 40:677–697. doi: 10.1146/annurev.ecolsys.110308.120159.
Elith J, Leathwick JR, Hastie T. 2008. A working guide to boosted regression trees. The Journal of Animal Ecology77:802–813. doi: 10.1111/j.1365-2656.2008.01390.x.
Estallo EL, Lamfri MA, Scavuzzo CM, Almeida FL, Introini MV, Zaidenberg M, Almiron WR. 2008. Models forpredicting Aedes aegypti larval indices based on satellite images and climatic variables. Journal of AmericanMosquito Control Association 24:368–376. doi: 10.2987/5705.1.
Fischer D, Thomas SM, Niemitz F, Reineking B, Beierkuhnlein C. 2011. Projection of climatic suitability for Aedesalbopictus Skuse (Culicidae) in Europe under climate change conditions. Global and Planetary Change 78:54–64.doi: 10.1016/j.gloplacha.2011.05.008.
Friedman JH. 2001. Greedy function approximation: a gradient boosting machine. The Annals of Statistics 29:1189–1232. doi: 10.1214/aos/1013203451.
Friedman JH, Meulman JJ. 2003. Multiple additive regression trees with application in epidemiology. Statistics inMedicine 22:1365–1381. doi: 10.1002/sim.1501.
Fuller DO, Troyo A, Beier JC. 2009. El Nino Southern Oscillation and vegetation dynamics as predictors of denguefecer cases in Costa Rica. Environmental Research Letters 4:140111–140118. doi: 10.1088/1748-9326/4/1/014011.
Gardner LM, Fajardo D, Waller ST, Wang O, Sarkar S. 2012. A predictive spatial model to quantify the risk of air-travel-associated dengue importation into the United States and Europe. Journal of Tropical Medicine 2012:103679. doi: 10.1155/2012/103679.
Garske T, Van Kerkhove MD, Yactayo S, Ronveaux O, Lewis RF, Staples JE, Perea W, Ferguson NM, Yellow FeverExpert Committee. 2014. Yellow Fever in Africa: estimating the burden of disease and impact of mass vaccinationfrom outbreak and serological data. PLOS Medicine 11:e1001638. doi: 10.1371/journal.pmed.1001638.
Gething PW, Van Boeckel TP, Smith DL, Guerra CA, Patil AP, Snow RW, Hay SI. 2011. Modelling the globalconstraints of temperature on transmission of Plasmodium falciparum and P. vivax. Parasites & Vectors 4:92.doi: 10.1186/1756-3305-4-92.
Gloria-Soria A, Brown JE, Kramer V, Hardstone Yoshimizu M, Powell JR. 2014. Origin of the dengue fevermosquito, Aedes aegypti, in California. PLOS Neglected Tropical Diseases 8:e3029. doi: 10.1371/journal.pntd.0003029.
Golding N. 2014. Streamlined functions for species distribution modelling in the seeg research group. R Packag.Version 0.1-3.
Grandadam M, Caro V, Plumet S, Thiberge JM, Souares Y, Failloux AB, Tolou HJ, Budelot M, Cosserat D, Leparc-Goffart I, Despres P. 2011. Chikungunya virus, southeastern France. Emerging Infectious Diseases 17:910–913.doi: 10.3201/eid1705.101873.
Gratz NG. 2004. Critical review of the vector status of Aedes albopictus. Medical and Veterinary Entomology 18:215–227. doi: 10.1111/j.0269-283X.2004.00513.x.
Hahn MB, Gangnon RE, Barcellos C, Asner GP, Patz JA. 2014. Influence of deforestation, logging, and fire onmalaria in the Brazilian Amazon. PLOS ONE 9:e85725. doi: 10.1371/journal.pone.0085725.
Hay SI, Tatem AJ, Graham AJ, Goetz SJ, Rogers DJ. 2006. Global environmental data for mapping infectiousdisease distribution. Advances in Parasitology 62:37–77. doi: 10.1016/S0065-308X(05)62002-7.
Hijmans RJ. 2012. Cross-validation of species distribution models: removing spatial sorting bias and calibrationwith a null model. Ecology 93:679–688. doi: 10.1890/11-0826.1.
Hijmans RJ. 2014. Geographic data analysis and modeling. R Packag. Version 2.3-12.Hijmans RJ, Cameron SE, Parra JL, Jones PG, Jarvis A. 2005. Very high resolution interpolated climate surfaces forglobal land areas. International Journal of Climatology 25:1965–1978. doi: 10.1002/joc.1276.
Hofhuis A, Reimerink J, Reusken C, Scholte EJ, Boer AD, Takken W, Koopmans M. 2009. The hidden passenger oflucky bamboo: do imported Aedes albopictus mosquitoes cause dengue virus transmission in the Netherlands?Vector Borne and Zoonotic Diseases 9:217–220. doi: 10.1089/vbz.2008.0071.
Honorio NA, Silva WDC, Leite PJ, Goncalves JM, Lounibos LP, Lourenco-de-Oliveira R. 2003. Dispersal of Aedesaegypti and Aedes albopictus (Diptera: Culicidae) in an urban endemic dengue area in the State of Rio deJaneiro, Brazil. Memorias do Instituto Oswaldo Cruz 98:191–198. doi: 10.1590/S0074-02762003000200005.
Jentes ES, Poumerol G, Gershman MD, Hill DR, Lemarchand J, Lewis RF, Staples JE, Tomori O, Wilder-Smith A,Monath TP, Informal WHO Working Group on Geographic Risk for Yellow Fever. 2011. The revised global yellowfever risk map and recommendations for vaccination, 2010: consensus of the informal WHO Working Group onGeographic Risk for Yellow Fever. The Lancet. Infectious Diseases 11:622–632. doi: 10.1016/S1473-3099(11)70147-5.
Johansson MA. 2015. Chikungunya on the move. Trends in Parasitology 31:43–45. doi: 10.1016/j.pt.2014.12.008.Johansson MA, Powers AM, Pesik N, Cohen NJ, Staples JE. 2014. Nowcasting the spread of chikungunya virus inthe Americas. PLOS ONE 9:e104915. doi: 10.1371/journal.pone.0104915.
Juliano SA, Lounibos LP, Meara GFO. 2007. A field test for competitive effects of Aedes albopictus on A. aegyptiin South Florida: differences between sites of coexistence and exclusion? Oecologia 139:583–593. doi: 10.1007/s00442-004-1532-4.
Kraemer et al. eLife 2015;4:e08347. DOI: 10.7554/eLife.08347 15 of 18
Research article Ecology | Epidemiology and global health
Juliano SA, Philip Lounibos L. 2005. Ecology of invasive mosquitoes: effects on resident species and on humanhealth. Ecology Letters 8:558–574. doi: 10.1111/j.1461-0248.2005.00755.
Khan K, Bogoch I, Brownstein JS, Miniota J, Nicolucci A, Hu W, Nsoesie EO, Cetron M, Creatore MI, German M,Wilder-Smith A. 2014. Assessing the origin of and potential for international spread of Chikungunya virus fromthe Caribbean. PLOS Currents 6. doi: 10.1371/currents.outbreaks.2134a0a7bf37fd8d388181539fea2da5.
Khormi HM, Kumar L. 2014. Climate change and the potential global distribution of Aedes aegypti: spatial modellingusing geographical information system and CLIMEX. Geospatial Health 8:405–415. doi: 10.4081/gh.2014.29.
Kobayashi AM, Nihei N, Kurihara T. 2002. Analysis of northern distribution of Aedes albopictus (Diptera: Culicidae)in Japan by geographical information system. Journal of Medical Entomology 39:4–11. doi: 10.1603/0022-2585-39.1.4.
Kraemer MUG, Sinka ME, Duda KA, Mylne AQN, Shearer FM, Brady OJ, Messina JP, Barker CM, Moore CG,Carvalho RG, Coelho GE, Van Bortel W, Hendrickx G, Schaffner F, Wint GRW, Elyazar IRF, Teng H-J, Hay SI.2015a. The global compendium of Aedes aegypti and Ae. albopictus occurrence. Scientific Data 2:150035.doi: 10.1038/sdata.2015.35.
Kraemer MUG, Sinka ME, Duda KA, Mylne A, Shearer FM, Brady OJ, Messina JP, Barker CM, Moore CG, CarvalhoRG, Coelho GE, Van Bortel W, Hendrickx G, Schaffner F, Wint GRW, Elyazar IRF, Teng H, Hay SI. 2015b.Data from: The global compendium of Aedes aegypti and Ae. albopictus occurrence. Dryad Digital Repository.doi: 10.5061/dryad.47v3c.
La Ruche G, Souares Y, Armengaud A, Peloux-Petiot F, Delaunay P, Despres P, Lenglet A, Jourdain F, Leparc-Goffart I, Charlet F, Ollier L, Mantey K, Mollet T, Fournier JP, Torrents R, Leitmeyer K, Hilairet P, Zeller H, VanBortel W, Dejour-Salamanca D, Grandadam M, Gastellu-Etchegorry M. 2010. First two autochthonous denguevirus infections in metropolitan France, September 2010. Euro Surveillance 15:19676.
Lambrechts L, Paaijmans KP, Fansiri T, Carrington LB, Kramer LD. 2011. Impact of daily temperature fluctuationson dengue virus transmission by Aedes aegypti. Proceedings of the National Academy of Sciences of USA 108:7460–7465. doi: 10.1073/pnas.1101377108.
Leathwick J, Elith J, Francis M, Hastie T, Taylor P. 2006. Variation in demersal fish species richness in the oceanssurrounding New Zealand: an analysis using boosted regression trees. Marine Ecology Progress Series 321:267–281. doi: 10.3354/meps321267.
Leparc-Goffart I, Nougairede A, Cassadou S, Prat C, de Lamballerie X. 2014. Chikungunya in the Americas. Lancet383:514. doi: 10.1016/S0140-6736(14)60185-9.
Li Y, Kamara F, Zhou G, Puthiyakunnon S, Li C, Liu Y, Zhou Y, Yao L, Yan G, Chen XG. 2014. Urbanization increasesAedes albopictus larval habitats and accelerates mosquito development and survivorship. PLOS NeglectedTropical Diseases 8:e3301. doi: 10.1371/journal.pntd.0003301.
Linthicum KJ. 1999. Climate and satellite indicators to forecast Rift Valley fever epidemics in Kenya. Science 285:397–400. doi: 10.1126/science.285.5426.397.
Lounibos LP. 2002. Invasion by insect vectors of human disease. Annual Review of Entomology 47:233–266.doi: 10.1146/annurev.ento.47.091201.145206.
Lounibos LP, Suarez S, Menendez Z, Nishimura N, Escher RL, O’Connell SM, Rey JR. 2002. Does temperatureaffect the outcome of larval competition between Aedes aegypti and Aedes albopictus? Journal of VectorEcology 27:86–95.
Luz C, Tai MHH, Santos AH, Silva HHG. 2008. Impact of moisture on survival of Aedes aegypti eggs and ovicidalactivity of Metarhizium anisopliae under laboratory conditions. Memorias do Instituto Oswaldo Cruz 103:214–215. doi: 10.1590/S0074-02762008000200016.
McArthur MA, Sztein MB, Edelman R. 2013. Dengue vaccines: recent developments, ongoing challenges andcurrent candidates. Expert Review of Vaccines 12:933–953. doi: 10.1586/14760584.2013.815412.
Medley KA. 2010. Niche shifts during the global invasion of the Asian tiger mosquito, Aedes albopictus Skuse(Culicidae), revealed by reciprocal distribution models. Global Ecology and Biogeography 19:122–133. doi: 10.1111/j.1466-8238.2009.00497.x.
Medlock JM, Hansford KM, Schaffner F, Versteirt V, Hendrickx G, Zeller H, Van Bortel W. 2012. A review of theinvasive mosquitoes in Europe: ecology, public health risks, and control options. Vector Borne and ZoonoticDiseases 12:435–447. doi: 10.1089/vbz.2011.0814.
Merckx B, Steyaert M, Vanreusel A, Vincx M, Vanaverbeke J. 2010. Null models reveal preferential sampling,spatial autocorrelation and overfitting in habitat suitability modelling. Ecological Modelling 222:588–597.doi: 10.1016/j.ecolmodel.2010.11.016.
Messina JP, Brady OJ, Golding N, Pigott DM, Kraemer MUG, Scott TW, Wint GR, Smith DL, Hay SI. 2015.The many projected futures of dengue. Nature Reviews. Microbiology 13:230–239. doi: 10.1038/nrmicro3430.
Morens DM, Fauci AS. 2014. Chikungunya at the door—deja vu all over again? The New England Journal ofMedicine 371:885–887. doi: 10.1056/NEJMp1408509.
Morrison AC, Gray K, Getis A, Astete H, Sihuincha M, Focks D, Watts D, Stancil JD, Olson JG, Blair P, Scott TW.2004. Temporal and geographic patterns of Aedes aegypti (Diptera: Culicidae) production in Iquitos, Peru.Journal of Medical Entomology 41:1123–1142. doi: 10.1603/0022-2585-41.6.1123.
Nawrocki SJ, Hawley WA. 1987. Estimation of the northern limits of distribution of Aedes albopictus in NorthAmerica. Journal of the American Mosquito Control Association 3:314–317.
Nihei N, Komagata O, Mochizuki K, Kobayashi M. 2014. Geospatial analysis of invasion of the Asian tiger mosquitoAedes albopictus: competition with Aedes japonicus japonicus in its northern limit area in Japan. GeospatialHealth 8:417–427. doi: 10.4081/gh.2014.30.
Kraemer et al. eLife 2015;4:e08347. DOI: 10.7554/eLife.08347 16 of 18
Research article Ecology | Epidemiology and global health
O’Meara GF, Evans LF, Gettman AD, Cuda JP. 1995. Spread of Aedes albopictus and decline of Ae.aegypti (Diptera: Culicidae) in Florida. Journal of Medical Entomology 32:554–562. doi: 10.1093/jmedent/32.4.554.
Otero M, Solari HG. 2010. Stochastic eco-epidemiological model of dengue disease transmission by Aedesaegypti mosquito. Mathematical Biosciences 223:32–46. doi: 10.1016/j.mbs.2009.10.005.
Paty MC, Six C, Charlet F, Cochet A, Wiegandt A, Chappert JL, Dejour-Salamanca D, Guinard A, Soler P, Servas V,Vivier-Darrigol M, Ledrans M, Debruyne M, Schaal O, Jeannin C, Helynck B, Leparc-Goffart I, Coignard B. 2014.Large number of imported chikungunya cases in mainland France, 2014: a challenge for surveillance andresponse. Euro Surveillance 19:20856. doi: 10.2807/1560-7917.ES2014.19.28.20856.
Paupy C, Delatte H, Bagny L, Corbel V, Fontenille D. 2009. Aedes albopictus, an arbovirus vector: from thedarkness to the light. Microbes and Infection 11:1177–1185. doi: 10.1016/j.micinf.2009.05.005.
Phillips SJ, Dudık M, Elith J, Graham CH, Lehmann A, Leathwick J, Ferrier S. 2009. Sample selection bias andpresence-only distribution model: implications for background and pseudo-absence data. EcologicalApplications 19:181–197. doi: 10.1890/07-2153.1.
Pigott DM, Bhatt S, Golding N, Duda KA, Battle KE, Brady OJ, Messina JP, Balard Y, Bastien P, Pratlong F,Brownstein JS, Freifeld CC, Mekaru SR, Gething PW, George DB, Myers MF, Reithinger R, Hay SI. 2014a. Globaldistribution maps of the leishmaniases. eLife 3:e02851. doi: 10.7554/eLife.02851.
Pigott DM, Golding N, Mylne A, Huang Z, Henry AJ, Weiss DJ, Brady OJ, Kraemer MU, Smith DL, Moyes CL, BhattS, Gething PW, Horby PW, Bogoch II, Brownstein JS, Mekaru SR, Tatem AJ, Khan K, Hay SI. 2014b. Mapping thezoonotic niche of Ebola virus disease in Africa. eLife 3:e04395. doi: 10.7554/eLife.04395.
Pigott DM, Kraemer MU. 2014. Enhancing infectious disease mapping with open access resources. EuroSurveillance 19.
Poland JD, Calisher CH, Monath TP, Downs WG, Murphy K. 1981. Persistence of neutralizing antibody 30-35 yearsafter immunization with 17D yellow fever vaccine. Bulletin of the World Health Organization 59:895–900.
Ponlawat A, Harrington LC. 2005. Blood feeding patterns of Aedes aegypti and Aedes albopictus in Thailand.Journal of Medical Entomology 42:844–849. doi: 10.1093/jmedent/42.5.844.
Powell JR, Tabachnick WJ. 2013. History of domestication and spread of Aedes aegypti—a review. Memorias doInstituto Oswaldo Cruz 108(Suppl 1):11–17. doi: 10.1590/0074-0276130395.
Powers AM. 2014. Chikungunya virus control: is a vaccine on the horizon? Lancet 384:2008–2009. doi: 10.1016/S0140-6736(14)61290-3.
R Core Team. 2014. R: a language and environment for computing. Vienna, Austria: R Foundation for StatisticalComputing.
Ramos MM, Mohammed H, Zielinski-Gutierrez E, Hayden MH, Lopez JLR, Fournier M, Trujillo AR, Burton R,Brunkard JM, Anaya-Lopez L, Banicki AA, Morales PK, Smith B, Munoz JL, Waterman SH, Dengue SerosurveyWorking Group. 2008. Epidemic dengue and dengue hemorrhagic fever at the Texas-Mexico border: results ofa household-based seroepidemiologic survey, December 2005. The American Journal of Tropical Medicine andHygiene 78:364–369.
Reinert JF, Harbach RE, Kitching IJ. 2009. Phylogeny and classification of tribe Aedini (Diptera: Culicidae).Zoological Journal of the Linnean Society 157:700–794. doi: 10.1111/j.1096-3642.2009.00570.x.
Reiter P. 2001. Climate change and mosquito-borne disease. Environmental Health Perspectives 109:141–161.doi: 10.1289/ehp.01109s1141.
Reiter P, Lathrop S, Bunning M, Biggerstaff B, Singer D, Tiwari T, Baber L, Amador M, Thirion J, Hayes J, Seca C,Mendez J, Ramirez B, Robinson J, Rawlings J, Vorndam V, Waterman S, Gubler D, Clark G, Hayes E. 2003. Texaslifestyle limits transmission of dengue virus. Emerging Infectious Diseases 9:86–89. doi: 10.3201/eid0901.020220.
Rezza G, Nicoletti L, Angelini R, Romi R, Finarelli AC, Panning M, Cordioli P, Fortuna C, Boros S, Magurano F, Silvi G,Angelini P, Dottori M, Ciufolini MG, Majori GC, Cassone A, CHIKV Study Group. 2007. Infection with chikungunyavirus in Italy: an outbreak in a temperate region. Lancet 370:1840–1846. doi: 10.1016/S0140-6736(07)61779-6.
Ridgeway G. 2013. Generalized boosted regression models. R Packag. Version 2.1.Romero-Vivas CME, Falconar AKI. 2005. Investigation of relationships between Aedes aegypti egg, larvae, pupae,and adult density indices where their main breeding sites were located indoors. Journal of the AmericanMosquito Control Association 21:15–21. doi: 10.2987/8756-971X(2005)21[15:IORBAA]2.0.CO;2.
Roy CJ, Adams AP, Wang E, Plante K, Gorchakov R, Seymour RL, Vinet-Oliphant H, Weaver SC. 2014. Chikungunyavaccine candidate is highly attenuated and protects nonhuman primates against telemetrically-monitoreddisease following a single dose. Journal of Infectious Diseases 209:1891–1899. doi: 10.1093/infdis/jiu014.
Russell ABM, Kay BH, Shipton W. 2001. Survival of Aedes aegypti (Diptera: Culicidae) eggs in surface andsubterranean breeding sites during the northern Queensland dry season. Journal of Medical Entomology 38:441–445. doi: 10.1603/0022-2585-38.3.441.
Schaffner F, Mathis A. 2014. Dengue and dengue vectors in the WHO European region: past, present, andscenarios for the future. The Lancet Infectious Diseases 14:1271–1280. doi: 10.1016/S1473-3099(14)70834-5.
Schneider A. 2012. Monitoring land cover change in urban and peri-urban areas using dense time stacks of Landsatsatellite data and a data mining approach. Remote Sensing of Environment 124:689–704. doi: 10.1016/j.rse.2012.06.006.
Scott TW, Amerasinghe PH, Morrison AC, Lorenz LH, Gary G, Strickman D, Kittayapong P, Edman JD. 2000.Longitudinal studies of Aedes aegypti ( Diptera: Culicidae) in Thailand and Puerto Rico: Blood feeding frequency.Journal of Medical Entomology 37:89–101. doi: 10.1603/0022-2585-37.1.89.
Scott TW, Takken W. 2012. Feeding strategies of anthropophilic mosquitoes result in increased risk of pathogentransmission. Trends in Parasitology 28:114–121. doi: 10.1016/j.pt.2012.01.001.
Kraemer et al. eLife 2015;4:e08347. DOI: 10.7554/eLife.08347 17 of 18
Research article Ecology | Epidemiology and global health
Seebens H, Gastner MT, Blasius B. 2013. The risk of marine bioinvasion caused by global shipping. Ecology Letters16:782–790. doi: 10.1111/ele.12111.
Semenza JC, Sudre B, Miniota J, Rossi M, Hu W, Kossowsky D, Suk JE, Van Bortel W, Khan K. 2014. Internationaldispersal of dengue through air travel: importation risk for Europe. PLOS Neglected Tropical Diseases 8:e3278.doi: 10.1371/journal.pntd.0003278.
Simmons CP, Farrar JJ, Chau NVV, Wills B. 2012. Dengue. The New England Journal of Medicine 366:1423–1432.doi: 10.1056/NEJMra1110265.
Sinka ME, Bangs MJ, Manguin S, Chareonviriyaphap T, Patil AP, Temperley WH, Gething PW, Elyazar IR, KabariaCW, Harbach RE, Hay SI. 2011. The dominant Anopheles vectors of human malaria in the Asia-Pacific region:occurrence data, distribution maps and bionomic precis. Parasites & Vectors 4:89. doi: 10.1186/1756-3305-4-89.
Sinka ME, Bangs MJ, Manguin S, Coetzee M, Mbogo CM, Hemingway J, Patil AP, Temperley WH, Gething PW,Kabaria CW, Okara RM, Van Boeckel T, Godfray HC, Harbach RE, Hay SI. 2010a. The dominant Anophelesvectors of human malaria in Africa, Europe and the Middle East: occurrence data, distribution maps and bionomicprecis. Parasites & Vectors 3:117. doi: 10.1186/1756-3305-3-117.
Sinka ME, Rubio-Palis Y, Manguin S, Patil AP, Temperley WH, Gething PW, Van Boeckel T, Kabaria CW, HarbachRE, Hay SI. 2010b. The dominant Anopheles vectors of human malaria in the Americas: occurrence data,distribution maps and bionomic precis. Parasites & Vectors 3:72. doi: 10.1186/1756-3305-3-72.
Sota T, Mogi M. 1992. Interspecific variation in desiccation survival time of Aedes (Stegomyia) mosquito eggs iscorrelated with habitat and egg size. Oecologia 90:353–358. doi: 10.1007/BF00317691.
Staples JE, Breiman RF, Powers AM. 2009. Chikungunya fever: an epidemiological review of a re-emerginginfectious disease. Clinical Infectious Diseases 49:942–948. doi: 10.1086/605496.
Takumi K, Scholte EJ, Braks M, Reusken C, Avenell D, Medlock JM. 2009. Introduction, scenarios for establishmentand seasonal activity of Aedes albopictus in The Netherlands. Vector Borne and Zoonotic Diseases 9:191–196.doi: 10.1089/vbz.2008.0038.
Tatem AJ, Hay SI, Rogers DJ. 2006. Global traffic and disease vector dispersal. Proceedings of the NationalAcademy of Sciences of USA 103:6242–6247. doi: 10.1073/pnas.0508391103.
Thomas S, Obermayr U, Fischer D, Kreyling J, Beierkuhnlein C. 2012. Low-temperature threshold for egg survivalof a post-diapause and non-diapause European aedine strain, Aedes albopictus (Diptera: Culicidae). Parasites &Vectors 5:100. doi: 10.1186/1756-3305-5-100.
Tomasello D, Schlagenhauf P. 2013. Chikungunya and dengue autochthonous cases in Europe, 2007–2012. TravelMedicine and Infectious Disease 11:274–284. doi: 10.1016/j.tmaid.2013.07.006.
Tsetsarkin KA, Vanlandingham DL, McGee CE, Higgs S. 2007. A single mutation in chikungunya virus affects vectorspecificity and epidemic potential. PLOS Pathogens 3:e201. doi: 10.1371/journal.ppat.0030201.
Tsetsarkin KA, Weaver SC. 2011. Sequential adaptive mutations enhance efficient vector switching bychikungunya virus and its epidemic emergence. PLOS Pathogens 7:e1002412. doi: 10.1371/journal.ppat.1002412.
Tsuda Y, Takagi M. 2001. Survivial and development of Aedes aegypti and Aedes albopictus (Diptera: Culicidae)Larvae under a seasonally changing environment in Nagasaki, Japan. Environmental Entomology 30:855–860.doi: 10.1603/0046-225X-30.5.855.
Vazeille M, Moutailler S, Coudrier D, Rousseaux C, Khun H, Huerre M, Thiria J, Dehecq JS, Fontenille D,Schuffenecker I, Despres P, Failloux AB. 2007. Two chikungunya isolates from the outbreak of La Reunion (IndianOcean) exhibit different patterns of infection in the mosquito, Aedes albopictus. PLOS ONE 2:e1168. doi: 10.1371/journal.pone.0001168.
Villar L, Dayan GH, Arredondo-Garcıa JL, Rivera DM, Cunha R, Deseda C, Reynales H, Costa MS, Morales-RamırezJO, Carrasquilla G, Rey LC, Dietze R, Luz K, Rivas E, Miranda Montoya MC, Cortes Supelano M, Zambrano B,Langevin E, Boaz M, Tornieporth N, Saville M, Noriega F, CYD15 Study Group. 2015. Efficacy of a Tetravalentdengue vaccine in Children in Latin america. The New England Journal of Medicine 372:113–123. doi: 10.1056/NEJMoa1411037.
Weaver SC. 2014. Arrival of chikungunya virus in the new world: prospects for spread and impact on public health.PLOS Neglected Tropical Diseases 8:e2921. doi: 10.1371/journal.pntd.0002921.
Weaver SC, Lecuit M. 2015. Chikungunya virus and the global spread of a mosquito-borne disease. The NewEngland Journal of Medicine 372:1231–1239. doi: 10.1056/NEJMra1406035.
Weiss DJ, Atkinson PM, Bhatt S, Mappin B, Hay SI, Gething PW. 2014. An effective approach for gap-fillingcontinental scale remotely sensed time-series. ISPRS Journal of Photogrammetry and Remote Sensing 98:106–118. doi: 10.1016/j.isprsjprs.2014.10.001.
World Health Organization. 1990. Yellow fever in 1988. Weekly Epidemiological Record 65:213–219.Wu JY, Lun ZR, James AA, Chen XG. 2010. Dengue fever in Mainland China. The American Journal of TropicalMedicine and Hygiene 83:664–671. doi: 10.4269/ajtmh.2010.09-0755.
Yang CF, Hou JN, Chen TH, Chen WJ. 2014. Discriminable roles of Aedes aegypti and Aedes albopictus inestablishment of dengue outbreaks in Taiwan. Acta Tropica 130:17–23. doi: 10.1016/j.actatropica.2013.10.013.
Zouache K, Fontaine A, Vega-rua A, Mousson L, Thiberge J, Lourenco-de-oliveira R, Caro V, Lambrechts L, FaillouxAB. 2014. Three-way interactions between mosquito population, viral strain and temperature underlyingchikungunya virus transmission potential. Proceedings. Biological Sciences/The Royal Society 281. doi: 10.1098/rspb.2014.1078.
Kraemer et al. eLife 2015;4:e08347. DOI: 10.7554/eLife.08347 18 of 18
Research article Ecology | Epidemiology and global health
Top Related