


Idiomas
Páginas
Jurídico


Sistemes de Supervisió i Control de Plantes d’Energies Renovables
Jordi Cusidó Roura

Arquitectura Turbina

Arquitectura Turbina

Arquitectura Turbina- Control -

Arquitectura Turbina
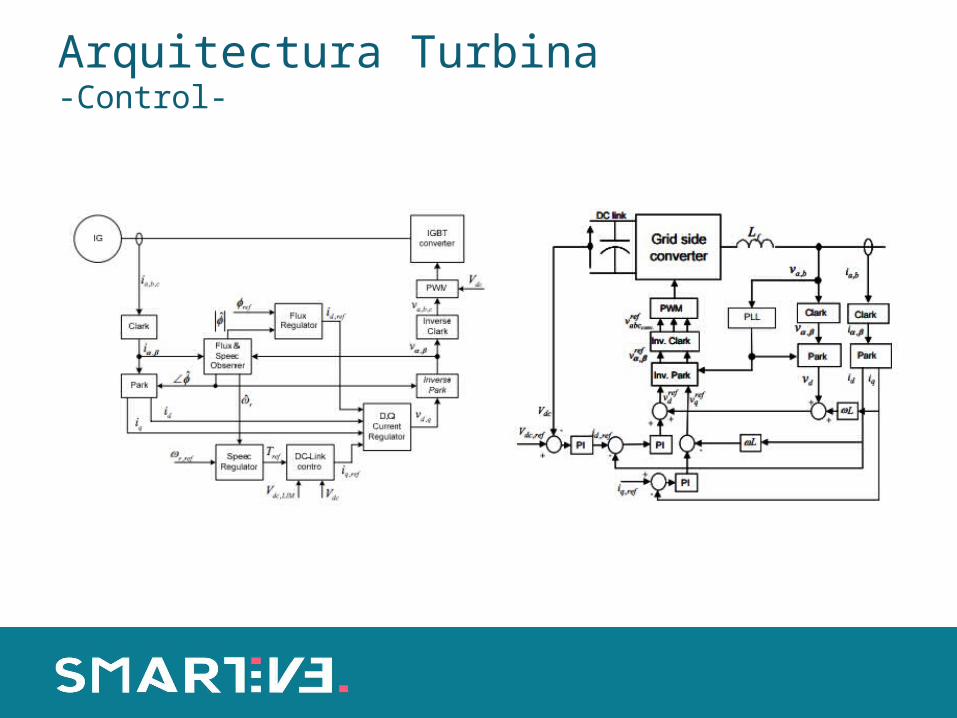
Arquitectura Turbina-Control-

Arquitectura Turbina

Arquitectura Camp Solar
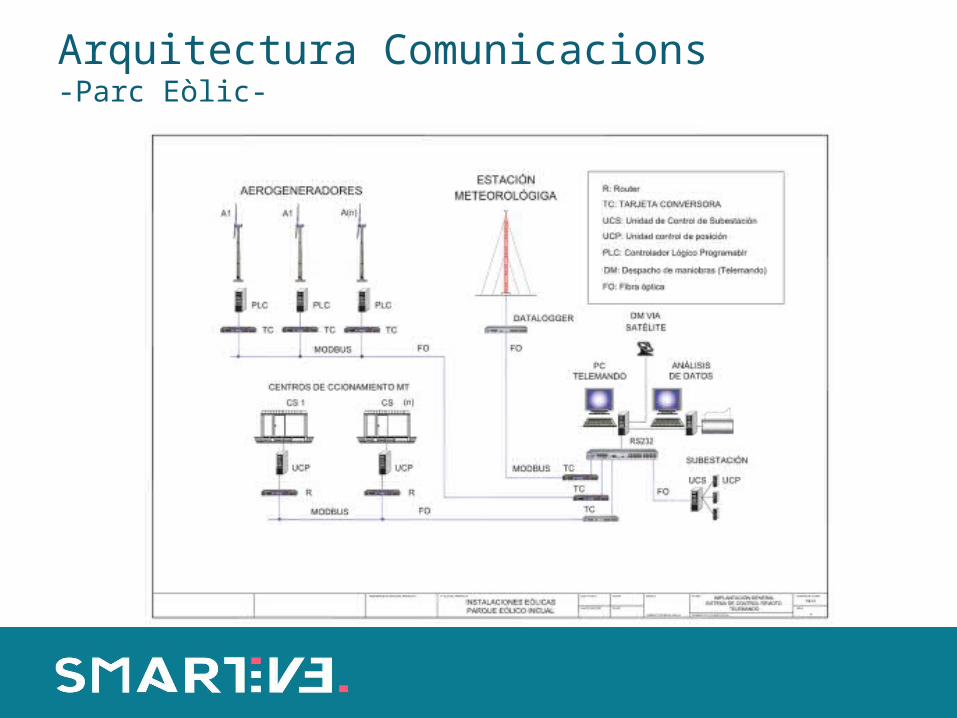
Arquitectura Comunicacions-Parc Eòlic-

Arquitectura Comunicacions-Camp Solar-

IEC-61400-25Model de dades eòliques

Àmbit d’aplicació de la Norma

Introducció

- LD: “Logical Device” Correspón a un dispositiu (Aerogenerador, Torre
meteorológica,…)
- LN: “Logical Node”Correspón a una parte del dispositivo (Torre, Góndola,
Convertidor,…)
Conceptes

61400-25-2 Model de informació

61400-25-2 Model de informació

61400-25-2 Model de informació

61400-25-2 Exemple variables node (LN)

Nodes Furhländer (LN)
WGDC Grid
WTRM Transmission
WNAC Nacelle
WGEN Generator
WTOW Tower
WROT Rotor
WCNV Converter
WMET Meteorological

Construcció nom variables
LN.[NomVar].[TipoVar]
LN: Nombre del nodo lógico.
[NomVar]: Nombre de variable. Puede contener uno o varios niveles, cada uno de ellos separados por puntos (.), dependiendo de la variable.
[TipoVar]: Tipo de la variable. Puede contener uno o varios niveles, cada uno de ellos separados por puntos (.), dependiendo del tipo de la variable.
Ex: WGDC.TrfGri.PhV.phsA.cVal.avgVal.f
WGDC: Nodo GridTrfGri.PhV.phsA: Grid Trifásico.Voltaje de fase. Fase AcVal.avgVal.f: Valor de variable. Valor medio. Float

Algunas variables Furhländer
WNAC.Wdir1.avgVal.fWNAC: Nodo NacelleWdir1: Wind direction 1avgVal.f: Valor medio. Float
WNAC.Wdir1.minVal.fWNAC: Nodo NacelleWdir1: Wind direction 1minVal.f: Valor mínimo. Float
WTUR.ExtPwrReactSp.maxVal.fWTUR: Nodo Wind TurbineExtPwrReactSp: External Power Reactive SpeedmaxVal.f: Valor máximo. Float
WTUR.ExtPwrReactSp.maxVal.fWTUR: Nodo Wind TurbineExtPwrReactSp: External Power Reactive SpeedmaxVal.f: Valor máximo. Float
Cloud, El futur dels Sistemes SCADA
SMARTSCADA

Les Futures Plantes d’Energia

Arquitectura del sistema
SmartCastData Server
(Web)
SmartCastLocal Server
(OPC)
Client
Local Network

Interficies d’Usuari- Inteligent Platforms-

Serveis Cloud, Cloud-Diganosis
SMARTCAST

Arquitectura del sistema: El Motor Predictiu

Technologia
Physical Variables:Vibration AnalysisMotor Current Signature AnalysisVoltage MeasurementsAcoustic Emission MeasurementsTemperature Monitoring
Signal Processing Techniques:Frequency AnalysisTime analysisTime-Frequency Analysis
Decision Support Systems:Neural NetworksFuzzySVMRandom Forest Algorithms
Current Condition Monitoring Techniques

Technologia
• Instrumentation
• Time based Signal Processing
• Frequency based Signal Processing
• Time-Frequency (Wavelets, Hilbert Huang)
• Fault Factor Feature Extractions (220)
• Advanced Neuro Fuzzy –ANFIS-
• Genetic Algorithms –GA-
• Selection & Extraction
• Collaborative Systems

Sistemes Experts de Classificació
SVM
f x
a
yest
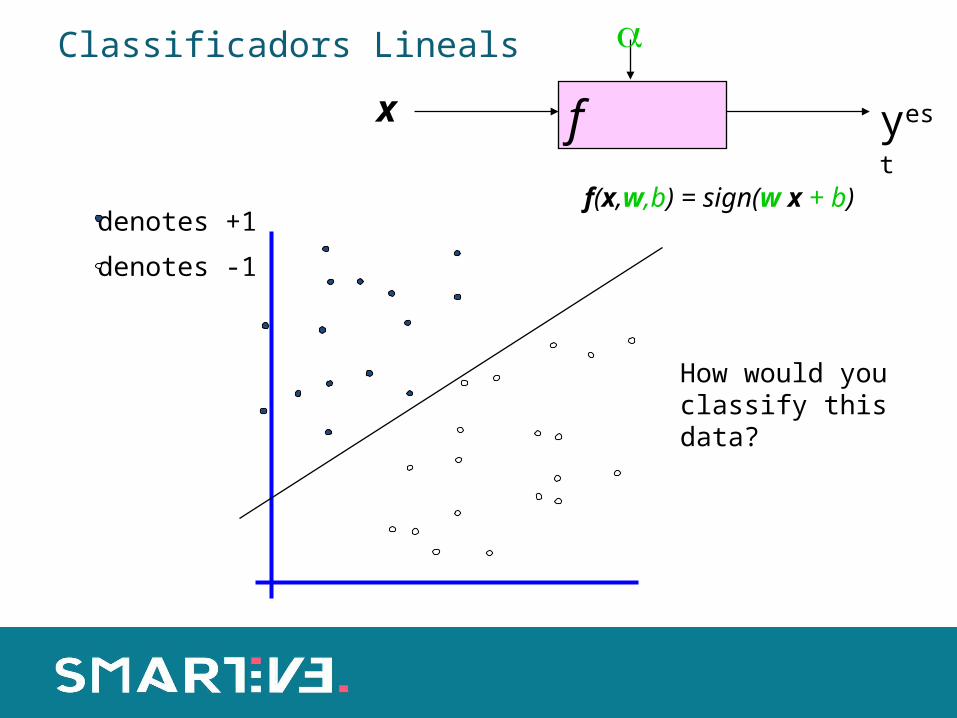
denotes +1
denotes -1
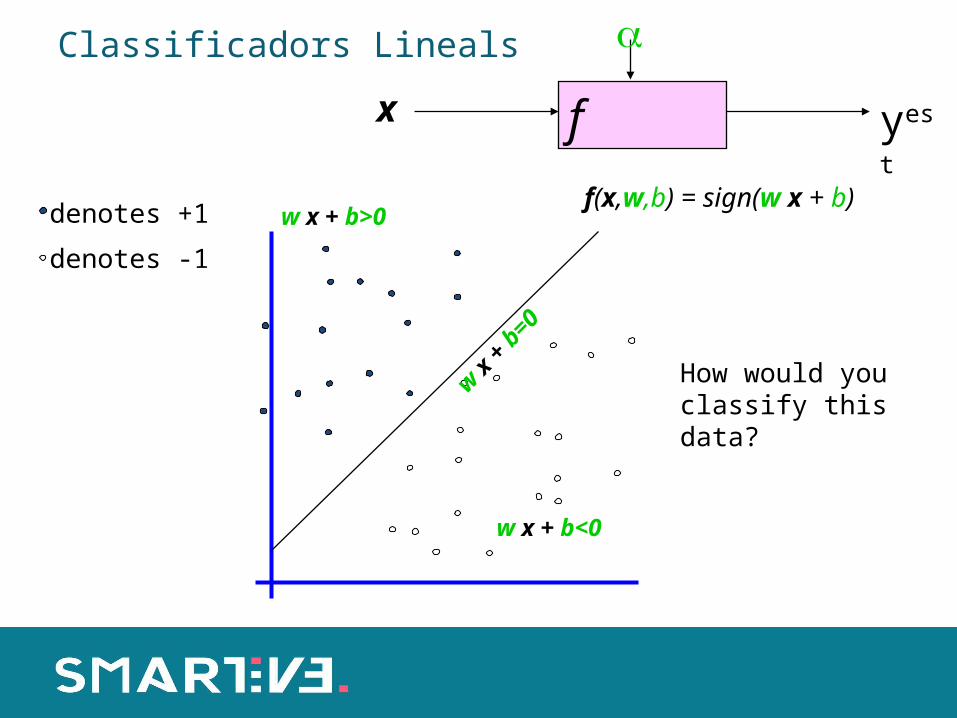
f(x,w,b) = sign(w x + b)
How would you classify this data?
w x + b=0
w x + b<0
w x + b>0
Classificadors Lineals
f x
a
yest
denotes +1
denotes -1
f(x,w,b) = sign(w x + b)
How would you classify this data?
Classificadors Lineals

f x
a
yest
denotes +1
denotes -1
f(x,w,b) = sign(w x + b)
How would you classify this data?
Classificadors Lineals

f x
a
yest
denotes +1
denotes -1
f(x,w,b) = sign(w x + b)
Any of these would be fine..
..but which is best?
Classificadors Lineals

Datasets that are linearly separable with some noise work out great:
But what are we going to do if the dataset is just too hard?
How about… mapping data to a higher-dimensional space:
0 x
0 x
0 x
x2
Classificadors No-Lineals, SVM

General idea: the original input space can always be mapped to some higher-dimensional feature space where the training set is separable:
Φ: x → φ(x)
Classificadors No-Lineals, SVM
Processat de Senyal, Anàlisis de Variables

Relevant Frequencies Gear

• Broken Bearings. (R.R Schoen
and Others 1994)
where nb number of balls, fi,0 fault vibration frequencies, fr rotating frequency Hz, bd ball diameter, pd Race diameter, & β ball angle.
Relevant Frequencies Bearing
o,isbng mfff
cospd
bdf
nf rbo,i 1
2

Relevant Frequencies Generator
Fault frequencies analyzed on the Gearbox can be complemented by measurements on the generator.
Generator fault frequencies shall be analyzed using vibration or current (Motor Current Signature Analysis) measurements.
Fault condition on the gearbox usually appears as an eccentricity fault on the generator, this fault is usually one of the most relevant indicators to address fault condition analysis.
Further results are related to MCSA condition monitoring results.

Relevant Frequencies Generator • Eccentricity fault (Thomson 1988)
where m=1,2,3,… harmonic number, p is the pair of poles, s the slip, y fs electric frequency.
p
smff secc
11

Relevant Frequencies Generator • Broken rotor bars, just for induction (Kliman 1988, Benbouzid 1995)
where l/p= 1,5,7,11,13,… are harmonic motor characteristics
s
p
slff sbrb
1
0 25 50 75 100 125 150 175 200 225 250 0
0.05
0.1
0.15
0.2 2 . 8 A
Mag
nitu
de (
A)
Frequency (Hz)

Relevant Frequencies Generator
• Shortcircuits (Thomson 1988, 1995)
– Low frequencies
k=0,1,3,5,...
ks
p
mff sstl 1
0 50 100 150 200 250 300 350 0
0.01
0.02
0.03
0.04
0.05
0.06
0.07
Frequency (Hz)
Mag
nitu
de (
A)
Ia Ib Ic
2.76 A 2.38 A 2.62 A
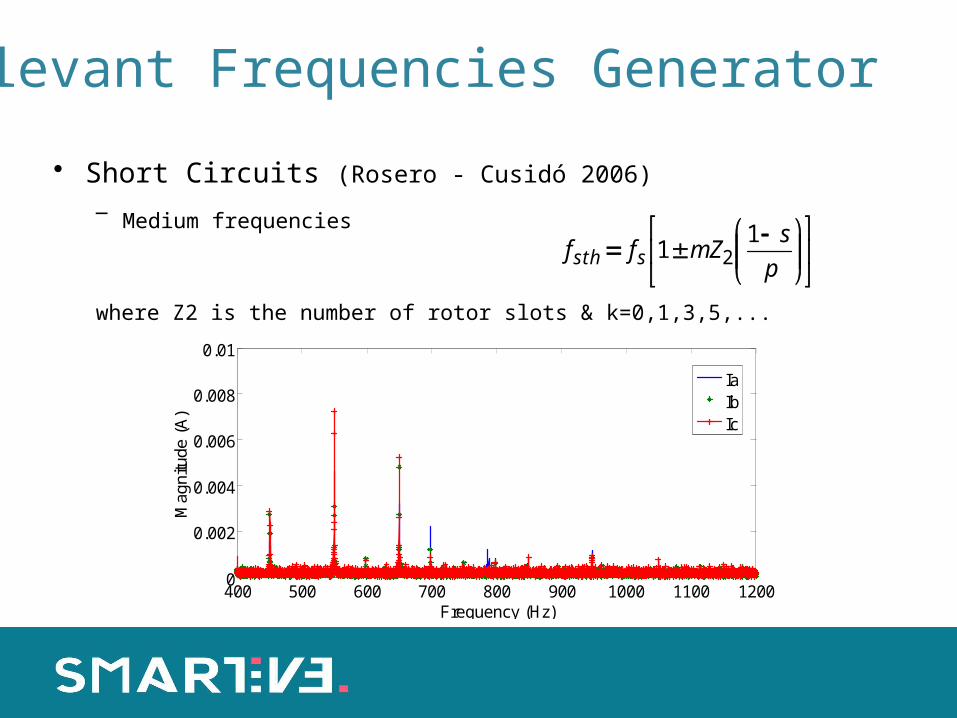
Relevant Frequencies Generator
400 500 600 700 800 900 1000 1100 12000
0.002
0.004
0.006
0.008
0.01
Frequency (Hz)
Mag
nitu
de (
A)
IaIbIc
p
smZff ssth
11 2
• Short Circuits (Rosero - Cusidó 2006)– Medium frequencies
where Z2 is the number of rotor slots & k=0,1,3,5,...

Time- frequency Transformation
Applied to transient analysis improving the resolution and accuracy for the fault detection
• Short Time Fourier Transform: is the time dependant fourier transform
• It applies a temporal window in wich the FT is performed
dtttfbfG bwdwwdw ,:,
tjwdw ebttfbfG
wdw
,,
wdw
2
wdw2
wdw
2
2b
0b
2
wdw2
wdw
2
wdw2
1b t
0
1

Time- frequency Transformation
The output of the STFT is an Spectrogramm

Time- frequency Transformation
• Wavelet Transform: Wavelet transform decomposes the signal as a sum of different wavelet signals shifted and scaled. Those signals are know as “mother” wavelet.
• The Decomosition algorithm decomponds the signal in a diadic way
• The output of the transformation is the time evolution of each decomposition or detail.
ndnanxJ
jjkj
kkj
kkjkj
1
,,,,
0
00
g[n]
h[n]
2
x[n]2
g[n]
h[n]
2
2
g[n]
h[n]
2
2
Level 1 detail coefficientsScale 2J-1
Level 2 detail coefficientsScale 2J-2
Level 3 detail coefficientsScale 2J-3
Level 1 detail coefficientsScale 2J-3
g[n]
h[n]
222
x[n]222
g[n]
h[n]
222
222
g[n]
h[n]
222
222
Level 1 detail coefficientsScale 2J-1
Level 2 detail coefficientsScale 2J-2
Level 3 detail coefficientsScale 2J-3
Level 1 detail coefficientsScale 2J-3
Approx.Level 3
DetailLevel 3
DetailLevel 2
DetailLevel 1
fs/2fs/4 ffs/8fs/160
Approx.Level 3
DetailLevel 3
DetailLevel 2
DetailLevel 1
fs/2fs/4 ffs/8fs/160

Signal Processing Techniques

Collaborative Algorithms

Sistemes Integrats de Gestió
SMARTOPEX

SmartOpexGMAO and Operations Platform
SmartOpex is the low cost implementation for monitoring operations at a wind farm. It is completely customizable to the clients, which has an ERP or not, providing solutions to the needs of management.
It consists in two parts, one with internet access via a computer follows all the activities in the site and allows the assignment of these tasks to the maintenance teams. Using this application and monitoring the operations, Smart Opex gives typical indicators such as MTTR, MTBF, failure rates, delays in preventive, downtime and lost track of the hours of work. Smart Opex also gives the working hours in the site.