


Idiomas
Páginas
Jurídico


Eficàcia
de les mesures per prevenir la resuspensió
de la pols
deguda
a la circulació
Fulvio Amato
i Xavier Querol
Institut
de Diagnosi
Ambiental i Estudis
de l’
Aigua, IDAEA‐CSIC
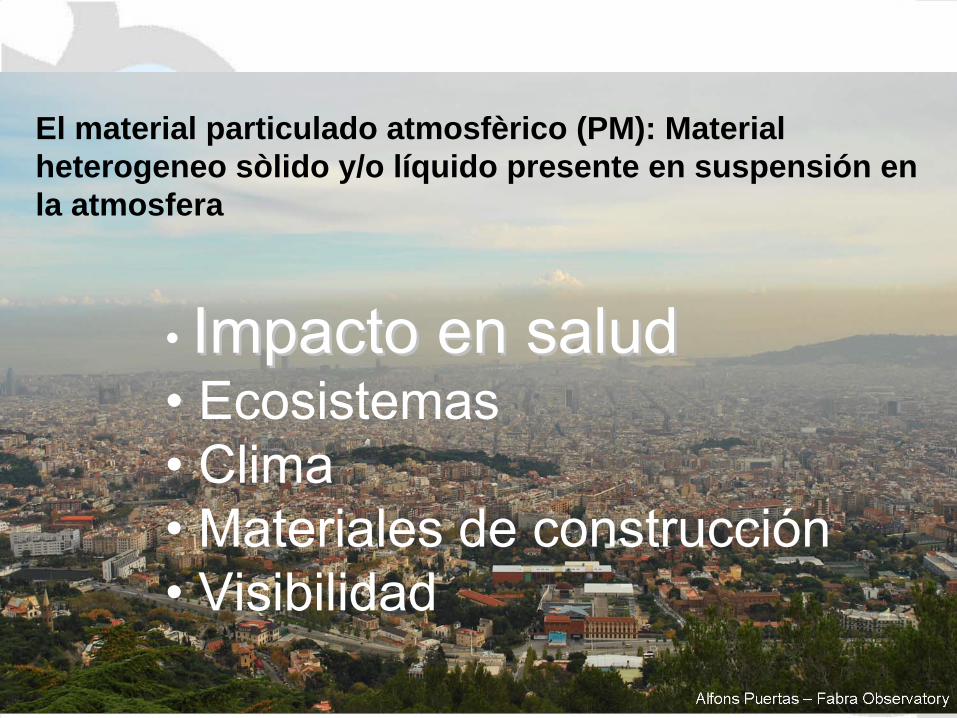
El material particulado atmosfèrico (PM): Material heterogeneo sòlido y/o líquido presente en suspensión en la atmosfera
• ImpactoImpacto en en saludsalud• Ecosistemas• Clima• Materiales
de construcción
• Visibilidad

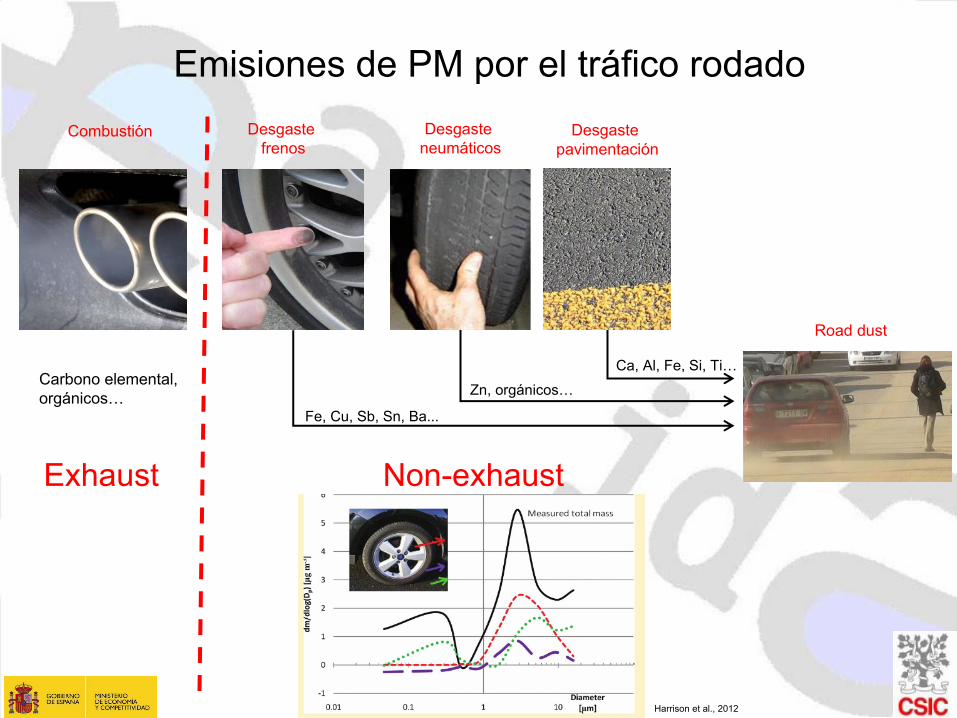
Emisiones de PM por el tráfico rodadoDesgaste
pavimentación
Non-exhaust
Desgaste neumáticos
Desgaste frenos
Combustión
Exhaust
Fe, Cu, Sb, Sn, Ba...
Carbono elemental, orgánicos…
Ca, Al, Fe, Si, Ti…
Zn, orgánicos…
Road
dust
Harrison et al., 2012

Evolución temporal de emisiones exhaust vs non-exhaust


Barcelona (2003‐2010)
µg/m3
, %
Vehicle Exhaust; 6.6; 25%
Nitrate; 4.0; 16%
Road dust; 2.9; 11%Heavy oil; 0.8; 3%
Industrial; 0.9; 3%
Sulfate; 7.0; 28%
Mineral; 1.9; 7%Sea salt; 1.0; 4%
African dust; 0.9; 3%
Vehicle Exhaust; 7.5; 18%
Nitrate; 4.5; 11%
Road dust; 8.8; 22%Heavy oil; 1.0; 2%
Industrial; 1.0; 2%
Sulfate; 6.7; 17%
Mineral; 5.6; 14%
Sea salt; 4.1; 10%
African dust; 1.5; 4%
PM10PM10 PM2.5PM2.5
ContribuciContribucióónn
mediamedia
a los a los nivelesniveles
de PMde PM

Príncipes
Carranque
Lepanto
Mar MediterráneoAtlántico
Alcalá
de Guadaira
Poblado
CampilloGranada Norte
La Línea
Puente Mayorga
Algeciras
PM10
Los Barrios
RuralesUrbano-
industrialUrbanas de
fondo Tráfico
PM10 9-22% 17-22% 29-34% 21-35%
PM2.5 7% 6-16% 11-31% 21-31%

Distribución de metales (ng/m3) en España

Sb depositado en vSb depositado en víía de tra de trááficofico
Sb (µg/g)
Urban works
Harbor
City center
Coastal ring road
Upper ring road
Main roads
150 µg/g
SbSb (µg/g)
Urban works
Harbor
City center
Coastal ring road
Upper ring road
Main roads
150 µg/g
SbSb (µg/g)
Urban works
Harbor
City center
Coastal ring road
Upper ring road
Main roads
150 µg/g
SbHarbour

Medidas para mitigar la resuspensión
•
Barrido
•
Baldeo
•
Aglomerantes (CMA, MgCl2
)
•
Asfalto poroso

Barrido en seco
Study Location Cleaning method Background assessment Detailed effects
No reductions in PM10 nor PM2.5
No measurable reduction in PM10 emission potentials
No discernable differences in airborne geologic PM10
Only a little decrease in PM10 emissionKantamaneni et al., 1996
Chow et al., 1990
Norman and Johansson, 2005
Kuhns et al., 2003
Gertler et al., 2006
Aldrin et al., 2008
Baumbach et al. 2007
Düring et al., 2007
Drammen, Norway
Lake Tahoe, Nevada, USA
Spokane, Washington, USA
Treasure Valley, Idaho, USA
Stockholm, Sweden
Stuttgart, Germany
Berlin, Germany
Mechanical sweeper
Sweeper (not specified)
Vacuum sweeper
Regenerative air vaccum sweeper
Mechanical and vacuum sweppers
Wet and dry broom sweepers
Upwind/downwind technique
Tunnel study, meteo conditions were assessed
Ratio with a reference site
Deicers emit less than abrasives; Sweeping increased the PM10 re-entrainment rate
No significant difference was found in PM10 levelsNOx and meteorology monitoring
NOx and meteorology monitoring
Nevada, USA
Vacuum sweeper
No reductions in PM10 (short term)
Upwind/downwind technique
Upwind/downwind technique
No significant reduction of PM10 levels
Possible measures

•
Experimentos
en EU–
Barcelona (2008 y 2009)
–
Madrid–
Castellón
–
Holanda–
Alemania–
Suecia–
Italia–
Noruega
Baldeo

Carrer
Valencia
1.5
km

Roa
ddu
stlo
adin
g(m
gm
-2)
Rai
nfal
l(L
m-2
)
Barcelona: efecto en la masa de Barcelona: efecto en la masa de partpartíículas culas depositadasdepositadas
Amato et al., Atm. Env. 2009
0
4
8
12
16
Dep
osite
dPM
10(m
g/m
2 )
0
5
10
15
20
25
30
mm
Untreated
areaTreated
areaprecipitation
April 8th April 11 th April 15 th April 22 nd April 25 th May2 nd
1 St
W
1 St
W
3 St
W
3 St
W0
4
8
12
16
Dep
osite
dPM
10(m
g/m
2 )
0
5
10
15
20
25
30
mm
Untreated
areaTreated
areaprecipitation
April 8th April 11 th April 15 th April 22 nd April 25 th May2 nd
1 St
W
1 St
W
3 St
W
3 St
W0
4
8
12
16
mg/
m2
0
5
20
25
30Sitio de referenciaBaldeolluvia
April 8th April 11 th April 15 th April 22 nd April 25 th May2 ndApril 8th April 11 th April 15 th April 22 nd April 25 th May2 nd
Amato et al., 2009 Atm. Env.

0.000
0.001
0.002
0.003
0.004
0.005
0.006
0.007
0.008
0 50 100 150 200 250 300
t (hours after rain)
Dus
t loa
ding
s (g-2)
Dust loadings
DL
(g m
-2)
DL=3.56E-03 - 3.53E-03 e -0.087*t
R2= 0.99
t (hours after rain)
0.008
0.007
0.006
0.005
0.004
0.003
0.002
0.001
0.0000 50 100 150 200 250 300
En 8 horas
se restablece
el 50% potencial
de emisiónEn 24 horas
se restablece
el 90% potencial
de emisión
Duración
del efecto
de baldeo sobre
el potencial
de emisión
Amato et al., 2012.

Reducción media diariaPrueba baldeo:
-
8.8 µg
m-3
Sitios de control: -
3.7-4.9 µg
m-3
Reducción neta: - 4-5 µg m-3 (7-10%)
Efecto en aire ambiente PMEfecto en aire ambiente PM1010 20082008
Cabinas de monitorización Con baldeo(µg m-3)
Sin baldeo(µg m-3)
Tráfico Prueba baldeo 44.4 53.2
Tráfico Control 50.3 54.0
Fondo urbano Control 38.9 43.8
Fondo urbano Control 38.6 42.3
Fondo urbano Control 42.2 44.3
Fondo urbano Control 38.1 38.2
Reference sites - 3-5 µg m-3
0102030405060708090
0 1 2 3 4 5 6 7 8 9 10 11 12 13 14 15 16 17 18 19 20 21 22 23
Local time
PM10
(µg
m-3
)
no-StC
days StC
days
Cleaning site - 8.8 µg m-3
102030405060708090
0 1 2 3 4 5 6 7 8 9 10 11 12 13 14 15 16 17 18 19 20 21 22 23
Local time
PM10
(µg
m-3
)
no-StC days StC days

Barcelona: efecto en la composiciBarcelona: efecto en la composicióón qun quíímica de PMmica de PM1010
0
30
60
90
Ti (n
g/m
3 )
0
4
8
12
16
Prep
.(mm
)
Street cleaning Precipitation Downwind site Upwind site
Mineral dust
0
10
20
30
7.4.08
8.4.08
9.4.08
10.4.
0811
.4.08
12.4.
0813
.4.08
14.4.
0815
.4.08
16.4.
0817
.4.08
18.4.
0819
.4.08
20.4.
0821
.4.08
22.4.
0823
.4.08
24.4.
0825
.4.08
26.4.
0827
.4.08
28.4.
0829
.4.08
30.4.
081.5
.082.5
.083.5
.084.5
.08
Sb (n
g/m
3 )
0
4
8
12
16
Prep
.(mm
)
Brake dust
0102030405060708090
100
8 8 8 8 8 8 8 8 8 8 8 8 8 8 8 8 8 8 8 8 8 8 8 8 8 8 8 8
V (n
g/m
3 )
Fuel oil comb.
0
10
20
EC (µ
g/m
3 )
4
Street cleaning Precipitation Downwind site Upwind site
EC
0
5
10
Cl- (µ
g/m
3 )
4
Sea salt
0
2
4
6
8
10
12
7.4.08
8.4.08
9.4.08
10.4.
0811
.4.08
12.4.
0813
.4.08
14.4.
0815
.4.08
16.4.
0817
.4.08
18.4.
0819
.4.08
20.4.
0821
.4.08
22.4.
0823
.4.08
24.4.
0825
.4.08
26.4.
0827
.4.08
28.4.
0829
.4.08
30.4.
081.5
.082.5
.083.5
.084.5
.08
NO
3- (µg/
m3 )
g p p
Nitrate
Treated
site Untreated
site Treated
site Untreated
site

0 0 0 0 0 0 0 0 0 0 0 0 0 0 0 0 0 0 0 0 0 0 0 0
Con
trib
utio
n to
PM
10
En 2009: resoluciEn 2009: resolucióón horaria n horaria
-0.4 µg m-3
-4.7 µg m-3
0
20
40
60
80
100
120
140
160
180
PM10
µg
m-3
StC no-StC -1.3 µg m-3
StC no-StCStC no-StC
Cleaning site A
0
20
40
60
80
100
120
140
160
180
0:00
2:00
4:00
6:00
8:00
10:00
12:00
14:00
16:00
18:00
20:00
22:00
PM10
µg
m-3
Cleaning site B
0
20
40
60
80
100
120
140
160
180
PM10
µg
m-3
Mean reference sites
0 0 0 0 0 0 0 0 0 0 0 0 0 0 0 0 0 0 0 0 0 0 0 0
Con
trib
utio
n to
PM
10C
ontr
ibut
ion
to P
M10
0:00
1:00
2:00
3:00
4:00
5:00
6:00
7:00
8:00
9:00
10:0
0
11:0
0
12:0
0
13:0
0
14:0
0
15:0
0
16:0
0
17:0
0
18:0
0
19:0
0
20:0
0
21:0
0
22:0
0
23:0
0
Con
trib
utio
n to
PM
10
+83%
+11%
+44%
-19%
StC no-StCStC no-StC
Mean reference
sites
StC
site
A
StC
site
B
Industrial
Veh
exhaust
and
wear
Secondary
aerosols
Mineral

Madrid : Calle VelazquezMadrid : Calle Velazquez

Madrid: efecto en aire ambiente (PM10
)
-2 µg/m3
(5%)
Karanasiou et al., ATM ENV 2011

•
Otros
estudios–
Canada: 2-3 µg/m3
reducción
en estación
de
tráfico
(Dobroff
et al., 1999)
–
Suecia: 6%
reducción
en estación
de tráfico
(Norman and Johansson, 2006)
–
Taiwan: hasta
30%
reducción
en TSP (Chang et al., 2005)
–
Alemania: 2 µg/m3
reducción
(John et al., 2006)
–
No se ha observado
reducción
en Noruega
e Italia (Amato et al., 2010)
23
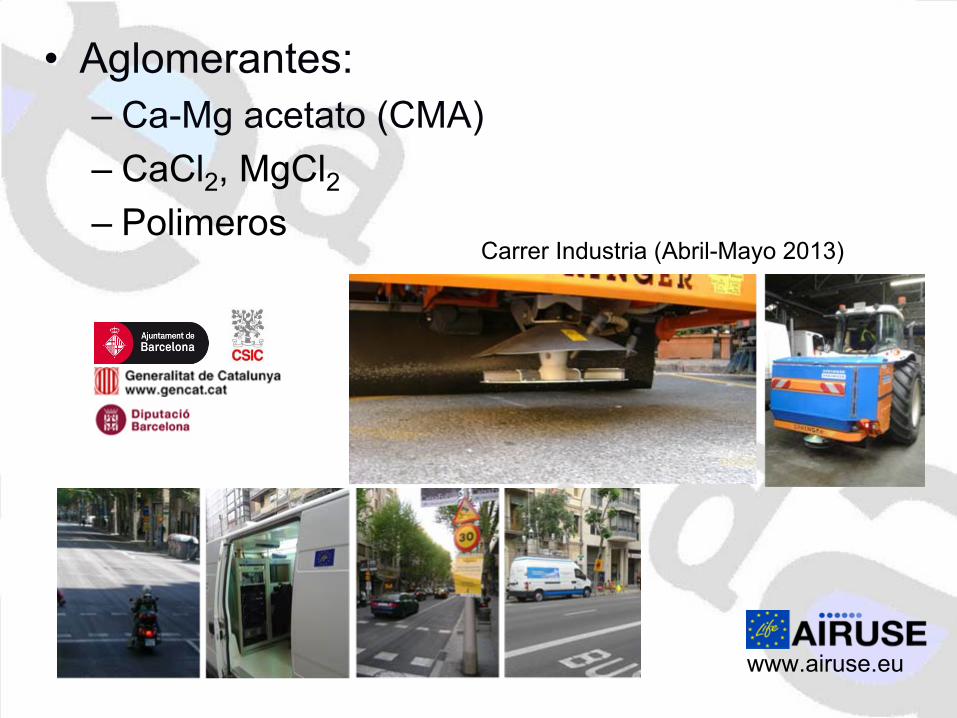
•
Aglomerantes: –
Ca-Mg acetato
(CMA)
–
CaCl2
, MgCl2–
Polimeros
www.airuse.eu
Carrer
Industria (Abril-Mayo 2013)

Estudios previos con CMA•
Suecia: 35% reducción
diaria
(Norman and Johansson, 2006)
.•
Austria: 20-30% reducción
diaria
(10% annual)
www.life-cma.at
•
Stuttgart, no hubo
reducción•
Londres:–
No se registró
reducción
significativas
en vías
urbanas
–
Reducción
hasta
40% en zonas
industriales
25

•
Asfalto
poroso–
Generalmente
utilizado
para
reducir
ruido
y
mejorar
drenaje–
Puede
retener
particulas
respirables
–
Ensayos
prometedores
en Suecia (http://www.slb.nu/elvf/) y Suiza
(Gehrig et al., 2010)
26
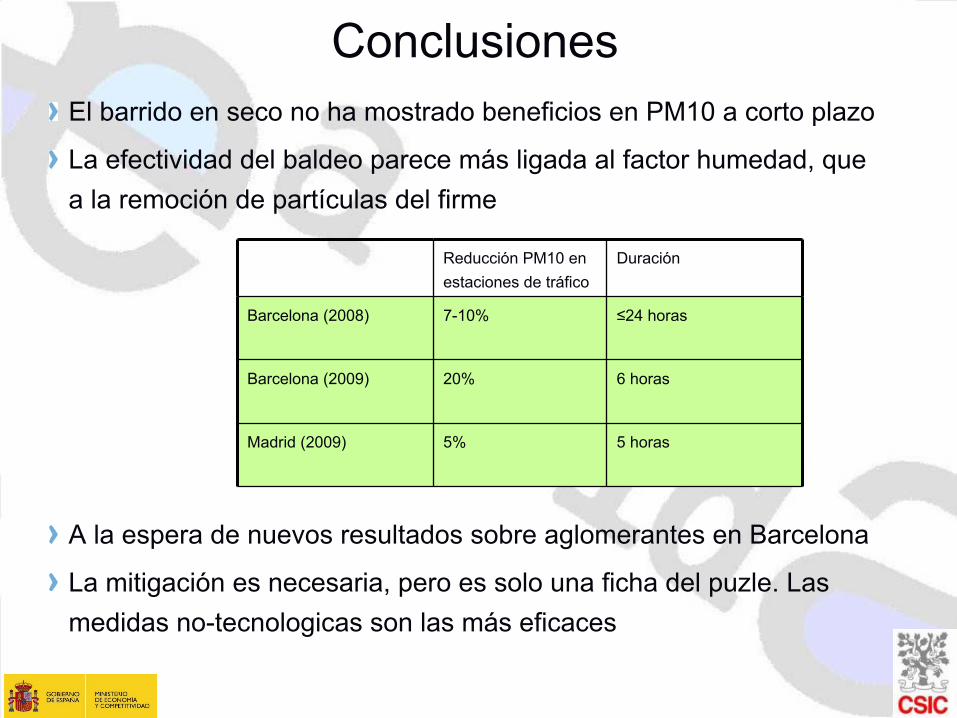
ConclusionesEl barrido en seco no ha mostrado beneficios en PM10 a corto plazo
La efectividad del baldeo parece más ligada al factor humedad, que a la remoción de partículas del firme
A la espera de nuevos resultados sobre aglomerantes en Barcelona
La mitigación es necesaria, pero es solo una ficha del puzle. Las medidas no-tecnologicas
son las más eficaces
Reducción PM10 en estaciones de tráfico
Duración
Barcelona (2008) 7-10% ≤24 horas
Barcelona (2009) 20% 6 horas
Madrid (2009) 5% 5 horas
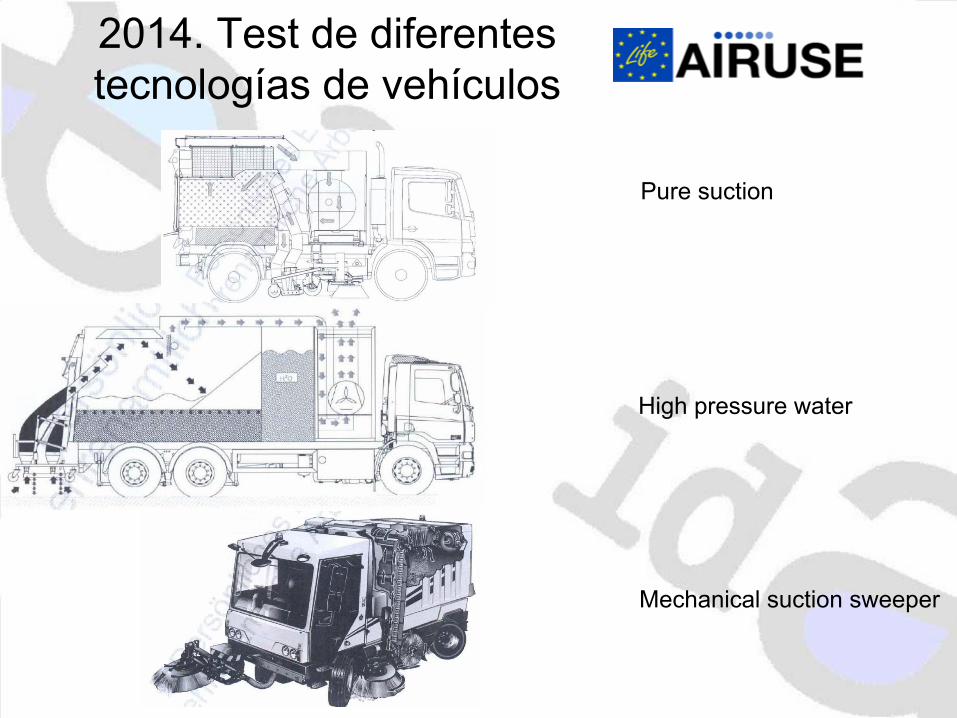
2014. Test
de diferentes tecnologías de vehículos
High
pressure
water
Pure
suction
Mechanical
suction
sweeper


Fuentes de road dust
31
Amato et al., 2011, 2012
ntroduction

Superacions al 2011
VLA: Avilés2 VLD: Sevilla, Granada, Córdoba, Villanueva del Arz., Huelva, Bailén, Alfaro,
Bilbao, Puertollano,
Avilés, Gijón, St. Vicenç
Horts, Sta
Perpètua de la M., Granollers,
Lleida, Vic, Barcelona, A Coruña

33
Annual evolution 90.4 percentile PM10 ZQA1
0
20
40
60
80
100
120
140
160
180
2000 2001 2002 2003 2004 2005 2006 2007 2008 2009 2010 2011
Anys
90.4
per
cent
ile (µ
g/m
³)
Valor límit P90.4 Barcelona (c/ Lluís Solé i Sabarís)Barcelona (Eixample) Barcelona (Gràcia - Sant Gervasi)Barcelona (IES Goya) Barcelona (IES Verdaguer)Barcelona (Vall d'Hebron) Barcelona (pl. Universitat)Barcelona (Zona Universitària) Barcelona (Sants)Barcelona (Port Vell) Esplugues de Llobregat (esportiu La Plana)Gavà L'Hospitalet de LlobregatMolins de Rei (pl. del Mercat Municipal) Molins de Rei (Ajuntament)El Prat de Llobregat (pl. de l'Església) El Prat de Llobregat (Jardins de la Pau)El Prat de Llobregat (CEM Sagnier) Sant Adrià de BesòsSanta Coloma de Gramenet (Ajuntament) Sant Feliu de Llobregat (Eugeni d'Ors)Sant Vicenç dels Horts (Col·legi Sant Josep) Sant Vicenç dels Horts (CEIP Verge del Rocío)
Annual evolution 90.4 percentile PM10 ZQA2
0
20
40
60
80
100
120
140
160
2000 2001 2002 2003 2004 2005 2006 2007 2008 2009 2010 2011
Anys
90.4
per
cent
ile (µ
g/m
³)
Valor límit P90.4 Barberà del Vallès (Ajuntament)Caldes de Montbui (Ajuntament) Castellar del Vallès (Ajuntament)Castellbisbal (CEIP Mare de Déu de Montserrat) Castellbisbal (Mirador del Llobregat)Granollers (Vinyoli-Foix) Granollers (c/ Francesc Macià)Martorell (c/ Canyameres - c/ Sant A. M. Claret) Mollet del Vallès (Pista Municipal d'Atletisme) Montcada i Reixac (pl. de Lluís Companys) Montcada i Reixac (Ajuntament)Montcada i Reixac (Can Sant Joan) Montornès del Vallès (CEIP Marinada)Montornès del Vallès (pl. del Poble) Pallejà (Mercat Municipal)el Papiol (centre dia Josep Tarradellas) Rubí (Ajuntament)Rubí (Ca n'Oriol) Rubí (Escardívol)Sabadell (IES Escola Industrial) Sabadell (Gran Via - cra. de Prats)Sant Andreu de la Barca (Escola Josep Pla) Sant Cugat del VallèsSanta Perpètua de Mogoda Sentmenat (Ajuntament)Terrassa (Mina Pública d'Aigües) Terrassa (rambla del Pare Alegre)
EVOLUCIÓ DE NIVELLS MITJANS DE QUALITAT DE L’AIRE Últims 11 anys ZONA METROPOLITANA 1 & 2
Departament de Territori i Sostenibilitat
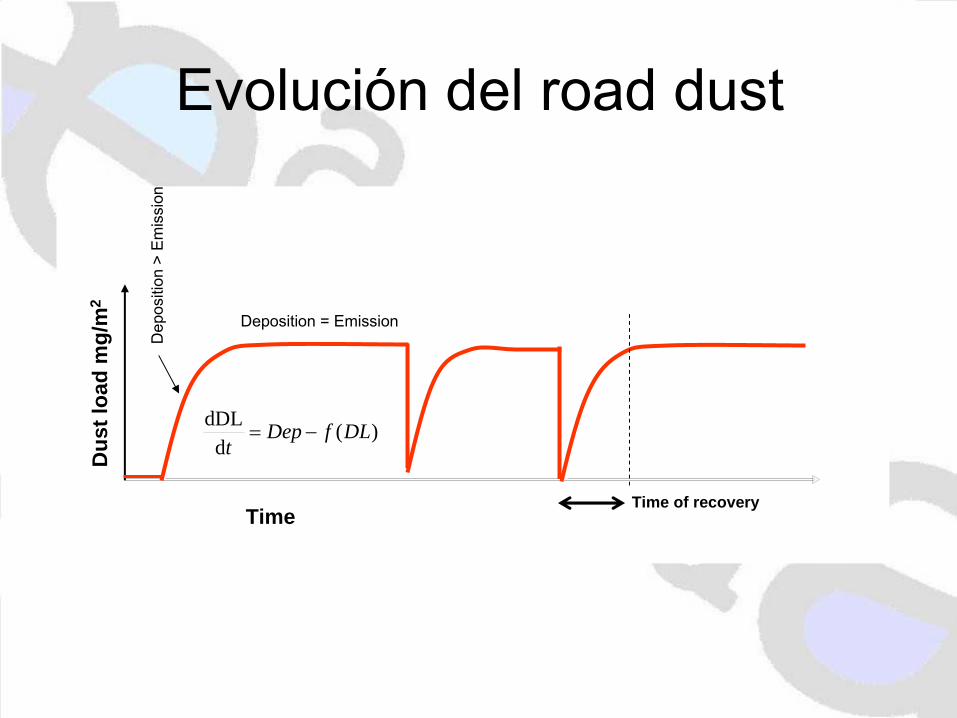
Evolución del road dust
Time
Dus
t loa
d m
g/m
2
Time of recovery
Dep
ositi
on >
Em
issi
on
Deposition = Emission
)(d
dDL DLfDept
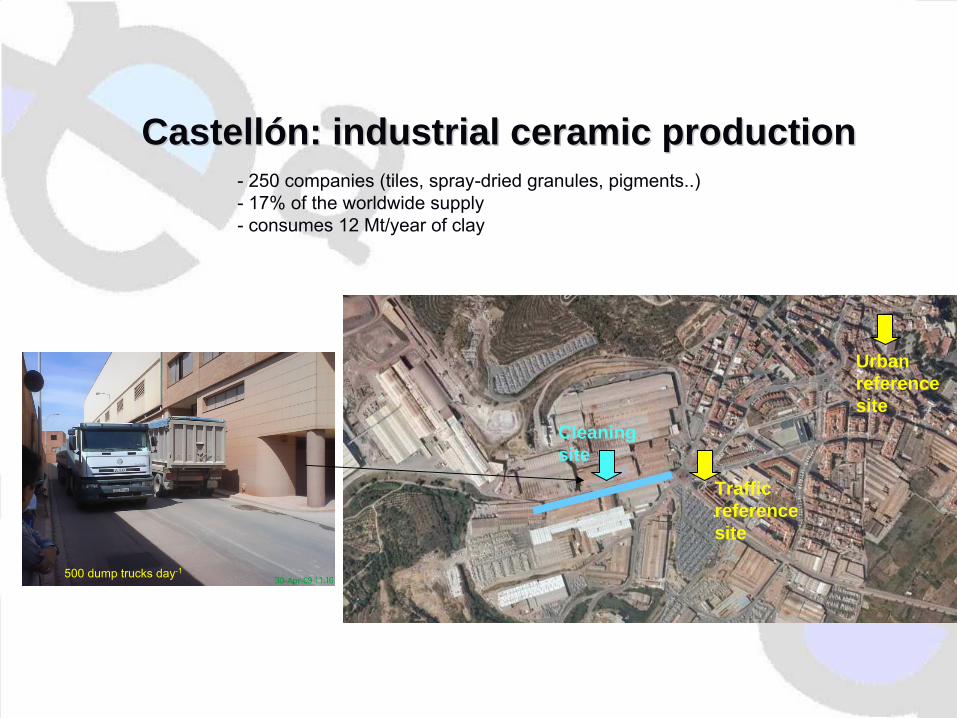
500 dump
trucks
day-1
CastellCastellóón: industrial n: industrial ceramicceramic productionproduction-
250 companies
(tiles, spray-dried
granules, pigments..)-
17% of the worldwide supply-
consumes 12 Mt/year of clay
Traffic referencesite
Urban referencesite
Cleaningsite

4. Road
Cleaning
method
1. Manual sweeping
2. Water-jet flushing

Castellón: effect
on
PM10
Cleaning days No cleaning ReductionCleaned Canyon 43 50 -7Reference 1 45 53 -8Reference 2 31 34 -3
Why no reduction?
•
simply
not
observed
(measurements
30 m from
the
road) ?• too high
deposition
rate
(46-85 mg
m-2
h-1) ?
0
500
1000
1500
2000
2500
1 2 3 4 5 6 7 8 9 10 11 12 13 14 15 16 17 18 19 20 21 22 23 24
ng/m
3
0
10
20
30
40
50
60Lorries No cleaning Cleaning
Mineral dust (Aluminum)
# of
trucks

Amsterdam
No significant difference No significant difference Keuken et al., 2010.

Type of pavement
•Granite pavement was found to be more prone (70% higher) to PM10 production compared to the quartzite pavements (Gustafsson
et al., 2009).
•Total wear of a pavement normally decreases with increasing aggregate size.
•Mafic, volcanic rock is the most resistant while granite is least resistant to wear. (Räisänen
et al., 2003)
•Conditions of pavement are also important: fresh abrasion particle emissions from pavements in good condition are quite low. (Gehrig
et al., 2010).
Top Related