


![ADVERTIMENT. Lʼaccés als continguts dʼaquesta tesi queda ... · to study the electronic structure of atoms, molecules and solids [7]. DFT is capable of determining the properties](https://static.fdocuments.ec/doc/165x107/5fa303400607396c875d6079/advertiment-laccs-als-continguts-daquesta-tesi-queda-to-study-the-electronic.jpg)

Idiomas
Páginas
Jurídico


Determining the source of Cadmium in
Cacao Plantation Soils of San Vicente de
Chucurí, Santander.
Valentina Joya Barrero
Advisor: Carme Huguet
Co-Advisor: Johana Husserl
Geoscience Department. Universidad de los Andes.
November 2019.
Bogotá, Colombia

2
Resumen
Una nueva regulación sobre el contenido de Cadmio (Cd) en productos alimenticios derivados
del cacao será aplicada por la Unión Europea a partir de enero de 2020. El alto contenido de Cd
en estos productos está relacionado con el alto contenido del metal en los granos de cacao, que
está relacionado a su vez con altas concentraciones de Cd en los suelos de cultivo. El objetivo
de este trabajo es determinar el origen del Cd en los suelos para identificar qué estrategias se
deben tomar con el fin de reducir el contenido de Cd en el producto final. Para esto, se tomaron
muestras de suelo, rocas y fertilizante de tres granjas en San Vicente de Chucurí (Santander,
Colombia) para determinar si la roca madre y/o los fertilizantes están relacionados con el
contenido y/o la acumulación de Cd. Se realizaron medidas con XRF a todas las muestras. A
partir de estos resultados se establecieron correlaciones entre los parámetros de interés y se
realizaron análisis de componentes principales (PCA por sus siglas en inglés) para evidenciar
los comportamientos de las muestras y de las fincas en relación con las variables cuantificadas.
Los resultados relacionan la concentración del Cd en el suelo principalmente con el contenido
de materia orgánica, el Cd en rocas y la adición de fertilizantes orgánicos. Este trabajo es un
primer paso para futuros estudios que deberían realizarse para establecer el origen del Cd en los
suelos de plantaciones de cacao en Colombia.
Abstract
From January 2020, the European Union will enforce a new regulation on the content of
Cadmium (Cd) in cacao-derived food products. The high content of Cd in these products is
related to the high content of the metal in the grains of cacao, which is simultaneously linked
to high concentrations of Cd in soils. The objective of this work is to determine the origin of
Cd in soils in order to identify strategies that are useful to reduce the content of Cd in the final
product. Therefore, soil, rocks and fertilizer samples were taken from three farms in San Vicente
de Chucurí (Santander, Colombia) to determine if the bedrock and/or fertilizers are related to
the content and/or the Cd accumulation. XRF measurements were performed on all samples.
Correlations between the relevant parameters were established and principal component
analysis (PCAs) were performed to demonstrate the behavior of the samples and farms in
relation to the quantified variables. The results relate the concentration of Cd in the soil mainly
with the content of organic matter, the cadmium in rocks and the addition of organic fertilizers.
This work is a first step for future studies that should be conducted to determine the origin of
Cd in cacao plantation soils in Colombia.

3
Content
Resumen .......................................................................................................................................... 2
Abstract ........................................................................................................................................... 2
I. Introduction ............................................................................................................................. 4
i. Geology of the area .............................................................................................................. 8
II. Methods .............................................................................................................................. 11
i. Soil and Rock Sampling ..................................................................................................... 11
ii. Sample preparation and analysis ...................................................................................... 12
2.2.1 HUMIDITY ................................................................................................................... 12
2.2.2 ORGANIC MATTER ................................................................................................... 13
2.2.3 CARBONATE CONTENT ........................................................................................... 13
2.2.4 SOIL PH ANALYSIS .................................................................................................... 13
iii. Soil characterization ...................................................................................................... 13
2.3.1. ELEMENTAL ANALYSIS OF SOILS ....................................................................... 13
iv. Correlation and analysis methods ................................................................................. 14
III. Results ................................................................................................................................ 15
i. Humidity, organic matter and carbonates content ........................................................... 15
ii. pH ....................................................................................................................................... 15
iii. Soil analysis .................................................................................................................... 16
iv. Elemental analysis of soils and rocks ............................................................................. 17
3.4.1 METALS OF INTEREST ............................................................................................. 17
3.4.2 CADMIUM.................................................................................................................... 20
v. Correlation between parameters ....................................................................................... 24
IV. Discussion ........................................................................................................................... 29
V. Conclusions ............................................................................................................................ 32
References ...................................................................................................................................... 33
ANNEXES ..................................................................................................................................... 37

4
I. Introduction
Colombian cacao is well known for its quality taste and smell with about 95% of the cacao
produced in the country being certified as fine in quality and aroma, awarding it with
international recognitions (Jiménez Tobón, 2015; Procolombia, 2019). Cacao is one of the main
agricultural products for export in Colombia and exports increased a 736% from 2010 to 2017;
Furthermore, cacao represented 0.8 percentage of the GNP as an industry in 2018, which makes
it a 2.47-billion-dollar worth sector (MINTIC, 2018; Republica, 2018). Cacao plantations are
the second largest in the country with a size of just a little over 175,000 ha from which around
85,000 tons of cacao beans are harvested every year (e.g. Bravo et al., 2018; Pabón, 2016).
Currently 52.000 families are directly employed by the industry and about 153.000 jobs are
expected to have been created within the cacao industry before 2021 (MADR, 2005).
Nutresa and Casa Luker are the two main stakeholders in the cacao supply chain since they
acquire about 80-90% of the national production to be kept in the national market or exported
(Abbott et. al., 2018). Therefore, a considerable amount of the income small and medium size
farmers in the cacao cultivating regions have comes from their ability to sell their product to
potential buyers who will then transform it, for example into products like chocolate or cacao
butter, or who will export it (MADR, 2005). From 2012 until 2015, the cacao exports where
distributed primarily to Spain (24.7%), Mexico (23.9%), Malaysia (10.6%), Estonia (9%),
Netherlands (7%), and the United States (5.5%) (Abbott et. al., 2018). These big existing
markets and the increasing market for fine cacao is a reason to support the producers, buyers
and transformers, since potential new and growing sells to said markets would be a source of
new income for the actors within the sector and the country itself (Jiménez Tobón, 2015;
MADR, 2005; Oliveros & Pérez, 2013) .
Additionally, cacao is being considered, in the context of post-conflict currently happening in
Colombia, as the main substitution crop for coca plantations with 25,000 Ha already
transformed from illegal crops into cacao plantations (Procolombia, 2019). Under programs
funded by USAID such as “Cacao for Peace” and governmental efforts such as The National
Plan for Cacao Development 2012-2021, big efforts are being directed into making cacao a
sufficiently reliable crop (Abbott et al., 2018; MADR, 2005). These programs hope to motivate
the change from the illegal farming activities into a legal agricultural product, like cacao,

5
through which the rural communities can be guaranteed with high enough income and better
living conditions (Meter et al., 2019).
However, according to studies conducted in recent years, the cacao beans that are being
currently cropped in San Vicente de Chucurí, and other municipalities in the departments of
Santander and Boyacá, have shown to hold an elevated cadmium content (Bravo et al., 2018).
This is specially concerning since new regulations on the levels of Cd allowed in chocolate are
being implemented by the European Union, and these levels depend directly on the Cd content
of the beans used to produce the chocolate and other derived products (European Comission,
2016; European Food Safety Authority, 2016). High exposure to Cd or high consumption of
this heavy metal is related to chronic kidney disease and to an increased risk in cardiovascular
diseases according to several studies (Edwards & Prozialeck, 2009;Bellinger, 2015).
Nevertheless, no toxic or strictly lethal dose has been determined since Cd tends to accumulate
in the body over the years in small concentrations and causes health complications in more
advanced age groups (Edwards & Prozialeck, 2009). The key metal risk pathways to human
exposure of cadmium begin with the soils. From there the uptake of Cd by plants directly from
the soil or from water, that was in contact with the soil, continues the pathway, that ends with
the consumption of the plant products or the water itself by a human (Tromba, 2019).
Cadmium found in cacao beans comes from the bioaccumulation of this heavy metal by the
cacao plant. The Theobroma cacao plant is a bioaccumulator of Cd as illustrated in Fig. 1; this
heavy metal is easily absorbed by its roots from the soil and the water, along with other
nutrients the plant needs, and then is accumulated within the structures of the plant, including
the beans (Bravo et al., 2018; Chavez et al., 2016; Smolders, 2001). The accumulation occurs
preferentially in cacao beans, then in shells and the least quantity accumulates in leaves (Bravo
et al., 2018; Chavez et al., 2016). Prior literature shows that this gradual concentration in plant
structures can vary depending on the farm location and the soil characteristics. Other studies
show the preferential accumulations persist in beans, while also being relevant in stems and
roots (Engbersen et al., 2019; Khan et al. , 2017).
It has been found in some cases an approximate 1:4 proportion between Cd content in soil and
beans, which even though tends to vary among plantations, maintains a similar proportion of
higher accumulation on beans (Chavez et al., 2015; Khan et al., 2017). Cadmium is naturally
found in all soils predominantly as a divalent cation (Cd2+) with concentrations ranging from
0.1 to 1 mg/ kg (Smolders & Mertens, 2013). However, values are much higher in soils from

6
the departments of Santander and Boyacá in Colombia with values as high as 3.74 mg/kg
(Bravo et al., 2018). Since it is known that the source for the Cd in the beans is the soils, two
alternatives can be used to address the problem: diminishing the amount of cadmium available
for the plant to absorb or making the plant less prone to uptake cadmium (Smolders, 2001).
Here we focus on the first approach.
Figure 1. Schematic representation of the Cd uptake by a cacao tree. Shows the concentration gradient being higher on leaves,
then on pod husks and then on unshelled beans. These three structures of the plant being relevant in the Cd accumulation.
Taken and adapted from (Tromba, 2019).
Both the European Food Safety Authority (EFSA) and the Joint FAO/WHO Expert Committee
on Food Additives (JECFA), established a maximum weekly ingest of 2.5 mg Cd per kg of
corporal weight in order to prevent illnesses related to ingestion of the metal (Jiménez Tobón,
2015). Studies conducted on Cd consumption and the European Commission itself, supported
the fact that chocolate and cacao powder sold to the final consumer may contain elevated
cadmium levels and are therefore an important source of human exposure to the metal
(European Comission, 2016; European Food Safety Authority, 2016). Furthermore, a big
concern is that cacao products are foods that are usually consumed by children which increases
their potential intake of Cd and taking into account their lower body weight and capability to
assimilate it a higher risk factor is evident ( European Food Safety Authority, 2016). Therefore,
starting on the first month of 2020 the limits set by the Regulation 1881 of 2006 that restricts
the levels of cadmium in cacao food products will be enforced (Jiménez Tobón, 2015). This
regulation will set a maximum of 0.80 μg Cd
kg⁄ in chocolate and 0.60 μg Cd
kg⁄ in cocoa powder
or as an ingredient in sweetened cocoa powder sold to the final consumer (European Food
Safety Authority, 2016).
7
These regulations have caused concern within the cacao producers in Colombia, and other
countries(Chavez et al., 2016; Gramlich et al., 2018; Zug et al., 2019), since the elevated
cadmium levels in the final food products are directly linked to high levels in the fresh
harvested cacao beans used for its production (Chavez et al., 2016; European Comission, 2016).
Therefore, if the cacao beans have an elevated content of cadmium selling them to potential
national or international buyers who are interested in exporting to the European market will
not be possible (Gramlich et al., 2018; Jiménez Tobón, 2015; Procolombia, 2019). The main
interest of the cacao farmers and the agricultural entities of Colombia is to apply and develop
strategies, technologies and any other type of strategies that will somehow diminish the amount
of cadmium in the cacao beans and will enable them to comply with international health
standards (Procolombia, 2019). This study pretends to give an insight on the origin of cadmium
in cacao plantation soils, which ends up absorbed in the beans, to help complement further
studies and actions that can aid stablish adequate strategies within the initiatives mentioned
before.
In order to evaluate the previously mentioned Cd in beans issue, we must first understand the
origin of the metal; it can originate from bedrock and/or from erosional/depositional processes
and/or from an anthropogenic source (He et al., 2015; Zug et al., 2019). Anthropogenic sources
are highly likely causes of the origin since nowadays it is possible to find Cd in batteries,
pigments and metal-coatings, but most relevantly to the agricultural sector, in fertilizers and
pesticides (Hurdebise et al., 2015). The determination of the origin of cadmium in soil will help
establish if it is possible to prevent and diminish high Cd levels in the ground, or if it is simply
a characteristic from the soil and region where the crops are farmed. Understanding the origin
of cadmium can give insight into the best management strategies for the soil and then translate
into a solution for the cacao farmers as has happened with other crops like corn that had similar
heavy metal issues (Carrillo-González et al., 2003).
Santander is a well-known region for the cultivation of cacao and has been historically
recognized for having cacao crops of great extension and quality (Jiménez Tobón, 2015;
MADR, 2005). It is the biggest producer of cacao in Colombia since about 39% of the national
production comes from this department (Agronet, 2017) and the one of the oldest ones with a
cacao cultivating tradition (Procolombia, 2019). This makes the department one of the six most
relevant ones in cacao production. The present study collected samples in San Vicente de
Chucurí a municipality located on the Northeastern region of the department of Santander,
Colombia. About 2,367 of the cocoa farmers from Santander, which is 28.3% of the total

8
producers in the department, are in the municipality of San Vicente de Chucurí (Pabón, 2016)
and this is why the study was conducted there. Cacao producers in this region are very
receptive and allow investigations in their crops and land, they acknowledge the potential of
the crop, and have been working along with agricultural entities in previous years (data not
published) which made the region an ideal zone for the study to occur.
This work aims to determine the general characteristics of the soils in three farms in the area
of interest, to establish the Cd levels on soils, rocks and fertilizers and to investigate the
potential sources and/or sinks of the metal. Also, determine if there is any correlation between
Cd presence and other variables like differentiation in soil components within the cacao
plantation. Previous studies in the region have shown that Cd enrichment is mainly associated
with the bedrock (Bravo et al., 2018). We will test this hypothesis again and analyze other
possible sources such as erosional/depositional and/or local anthropogenic input as other
reports conducted in other places of the world, like China, have considered this last origin is
relevant in various scenarios (Hurdebise et al., 2015; Zug et al., 2019)
The farmers of the region are very interested in improving the cacao crop and guaranteeing that
they will be able to sell the product in the future (MADR, 2005). The final analysis and
conclusions of this work aim to give an initial input on the source of Cd in the soils, in order
to motivate further studies and more development of treatments and approaches for diminishing
Cd content in contaminated soils.
i. Geology of the area
Rocks and Cd
Minerals like Greenockite (CdS) and Otavite (CdCO3) present Cd in their structures, but in
most cases they do not represent a considerable source of the metal for soils (Hurdebise et al.,
2015; Smolders & Mertens, 2013). Other Cd minerals include Cadmoselite (CdSe) and
Hawleyite (CdS) (Bravo et al., 2018). However, the cacao plant uptakes the metal as Cd2+, so
demineralization and weathering processes should occur to the minerals mentioned before for
this ion to appear and so that the mineral components can be assimilated by the plant (Page et.
al., 1987). Weathering of rocks that contain Cd minerals releases the metal into the soils (Page
et. al., 1987). Cd also has been linked to several carbonate minerals to which it adheres
(Patterson et al., 2012). It is possible to find cadmium as an accessory element in minerals that

9
contain Zn since they have similar sizes and charge characteristics that make them prone to
compete for mineral sites (Carrillo-González et al., 2003; Khan et al., 2017). In addition, Zn
has a strong inhibitory effect on Cd adsorption in soils and cadmium competition with other
ions such as Cu2+, Ni2+ and Ca2+ has been determined too (Carrillo-González, 2003). Cd also
shares chemical properties with other potentially toxic metals such as Pb, Ni and Cr since they
all are halogens. Literature reports these lastly mentioned metals together to have a better
overview of the heavy metal content of the soil (Carrillo-González et al., 2003; Page et. al.,
1987).
Concentrations of cadmium are higher in sedimentary rocks since this metal can be easily
adsorbed into fine particles and porosity sites, which are common to several rocks of this kind
(Carrillo-González et al., 2003). The relative accumulation of Cd in sedimentary environments
is also caused by the degassing of the earth and mantle processes, in which the excess of volatile
elements like Cd is liberated from deeper rocks and accumulated within empty spaces in
sedimentary rocks above (Marowsky & Wedepohl, 1971). The Cd content tends to be higher
in fine grained acidic sedimentary rocks (He & al., 2015; Smolders & Mertens, 2013). Rocks
like mudstone, siltstone and black shale can have significant amounts of Cd (Page et. al., 1987).
High levels of Cd are usually found in claystone and shale deposits too (Smolders & Mertens,
2013). The abundance of Cd in shales and claystones can be as high as 11 mg/kg. While in
other rocks like limestone, sandstone, basaltic igneous and granitic igneous rocks the Cd
concentrations are around 0.01 or 0.1 mg/kg (He et al., 2015). However, some black shales can
contain concentrations higher than 200-mg/kg making them a relevant source of Cd during soil
formation by weathering (Smolders & Mertens, 2013; Page et. al., 1987).
Geological Setting of the Study Site
Sedimentary rocks like limestones, claystones and black shales, in which Cd can be found as
mentioned before, are predominant in the San Vicente de Chucurí region. One of the most
relevant geological formations in the region is the formation “El Tablazo” located by the bridge
that crosses the Sogamoso River on the road from Bucaramanga to San Vicente de Chucurí
(Royero Gutierrez & Clavijo, 2001). This formation contains fossiliferous grey to black
limestones and black claystones with intercalated levels of gray to blueish-grey claystones, in
medium to thick layers with intercalations of grey sandstones, with fine to medium grain
clayish type and calcareous zones in very thin layers (Moreno & Sarmiento, 2002). This

10
formation is a few kilometers away from the one in which the sampled farms are located in
which means there can be intrusions of it or similarities within these terrains.
The other two formations in contact with “El Tablazo” formation are the “Paja” Formation and
the “Simití” Formation (Royero Gutierrez & Clavijo, 2001). The three sampled farms are over
the geological unit b2b6-Sm within the “Simití” formation. This unit consists primarily of chalk
shales, cherts, limestones and sandstones. The Simití formation consists mainly of laminated
black claystones, carbonaceous and locally calcareous fine-grained rocks, and the presence of
calcareous concretions is relevant (Moreno & Sarmiento, 2002; Royero Gutierrez & Clavijo,
2001). All these formations are sedimentary and with a major presence of fine-grained rocks,
that as mentioned before are relevant rock types for Cd appearance, while no other rock types
are present in the region. Concretions and carbonaceous rocks found within the b2b6-Sm unit
are also potentially important sites of Cd concentration (Marowsky & Wedepohl, 1971).
Figure 2. Location of the three sample farms on the geological map. Geological Map for San Vicente de Chucurí with
formations, faults and folds in the study area displayed. Blue dot corresponds to Farm 3, yellow dot to Farm 2 and red dot to
Farm 1.
There is a carboniferous belt named San Vicente de Chucurí-Lebrija belt that crosses the
municipality. It is located at an average depth of 600 meters below the surface of the
municipality and is known as one of the three main structures destined for mining in the
Farm 1
Farm 3
Farm 2

11
department of Santander, the carbon and construction material mining districts are located
south of the municipality of San Vicente de Chucurí and are industrially exploited (Monroy,
2014). This belt is related to the Paja Formation (Monroy, 2014). As this belt is rich in organic
matter it can also be expected that it has considerable Cd levels since other similar rock types
have shown this high content of the metal (He et al., 2015).
II. Methods
i. Soil and Rock Sampling
The soil and rock samples were collected in three cacao farms located within the municipality
of San Vicente de Chucurí. Two of them were small plantation farms, situated on the
southwestern part of San Vicente de Chucurí, and the third one was a medium to large
plantation farm in the northeastern area (Fig. 2). There was already a previous contact made
with the farms and owners, so the sampling process was easier and organized, and the farms
had a large enough healthy cacao plantation to be studied.
A total of 35 samples were taken, of which 23 were soils and 12 rock samples. In the first two
farms, Farm 1 and Farm 2 which are small plantations (less than 1 Ha), the sampling was
conducted in transects. Three transects were defined within the cacao plantation in each farm
with the first transect along the highest altitude part of the plantation, the second transect along
the medium height or middle of the slope of the plantation and the third one in the lowest and
less steep part of the plantation. Three evenly spaced samples were taken in each transect (Fig.
3).
Figure 3. Diagram representation of the sampling plan followed for each farm during recollection in the field trip. The samples
numbered as shown, corresponding to farms where they are located, in the figures adding up to 23 samples in total.
3 2 1

12
In plantation 1 we collected a rock sample at each soil sampling point; in the second plantation
only one rock sample was collected for each transect. For Farm 3, only five soil samples were
collected, and no rock samples were taken as no rocks were present on the surface or in the
superficial soil holes. This farm was chosen since it had no slope, which contrasted with the
other farms that were considerably steep as this could be a factor that influences on the
weathering of the Cd. The five soils were sampled randomly within the Farm 3 terrain (Fig. 3).
The soil samples were taken at the depth of 25 to 30 cm; they were sub superficial. The bedrock
and considerable sized rocks were observable on the surface. This depth is adequate, since
metals like Cd tend to persist in surface and sub-superficial soils reaching up to 1-meter deep
where the tree roots can still reach (Bai et al., 2011; Brus et al., 2002; Carrillo-González et al.,
2003). The hole from which the soil was extracted was made with a borer until the desired
depth was achieved and a lever was used to extract the soil sample. The borer and lever were
cleaned with alcohol at 70% concentration between the diggings of different holes. The rocks
were taken from the bottom of the hole made with the borer or as soon as they appeared into
the surface.
Soil samples were collected, stored in Ziploc bags and put inside portable refrigerators with ice
bags that kept their temperature between 4°C to 6°C to ensure microbiological processes
stopped occurring at high rates and the soil elements remained as unmodified as possible. All
the soil and rock samples were then air shipped to Bogotá and kept in the freezer at Universidad
de Los Andes before analyses were conducted. The temperature of the samples at arrival was
checked to guarantee the samples reliability and it remained within the same range. A sample
of the organic fertilizer used by the owners was taken in Farm 1 to measure the Cd content.
The management of the fertilizer was the same as for the soils. An industrial fertilizer
commonly used by cacao farmers, as they told the author, was purchased and analyzed as well.
The fertilizer that was bought was used earlier in Farm 2 but had stopped been used recently.
ii. Sample preparation and analysis
2.2.1 HUMIDITY
In order to quantify the humidity content 100 g of each soil sample were placed in the oven at
45 °C for three days. The soil was weighted again and the difference in mass that was found
was assumed as the water content that evaporated from the soil.
13
2.2.2 ORGANIC MATTER
Soil organic carbon is measured by burning off soil carbon in a controlled temperature oven (e.
g. Nelson & Sommers, 1982). For the organic matter content, the dry soil samples were placed
in the oven at a temperature of 250 °C for 24 hours. Samples were then weighted and the
difference in mass found was assumed as the amount of organic matter
2.2.3 CARBONATE CONTENT
Carbonate content can also be measured by burning off the low evaporation temperature
carbonaceous minerals with a controlled temperature (Nelson & Sommers, 1982). For the
carbonates content, the dry-inorganic soil samples were placed in a muffle at a temperature of
450 °C for 24 hours. Samples were then weighted, and the mass value of carbonates was
calculated from the mass difference.
2.2.4 SOIL PH ANALYSIS
To measure the pH of the soil samples a gram of the humid soil was placed in 9 ml of distilled
water and the solution was mixed for 2 minutes in a vortex (available in the Environmental
Engineering laboratory at Los Andes University) and then set aside in a rack. After a few
minutes when the particles settled the pHmeter was placed in the supernatant water in order to
record the pH measurement.
iii. Soil characterization
No soil boundaries were identified in the field trip as rocks from the bedrock flourished on the
surface of the three farms. Therefore, the soils could be classified as only Horizon A. For color
determination and classification, a soil color scale was used (Nelson & Sommers, 1982).
2.3.1. ELEMENTAL ANALYSIS OF SOILS
The 23 soils samples were taken to the laboratory and 250 g were dried in an oven at 40°C for
three days (Fig. 4a). In order to homogenize the samples, each one was spread and divided in
four, then two opposite quadrants were mixed and rearranged again as a circle (Fig. 4b). This
process was repeated as many times as needed until a smaller amount of soil of about 2g was
reached. This subsample was grounded using a mortar until the soil was a fine powder with no
large grains. The final sample was then set into the capsules to be inserted in the XRF gun
(XMET-7000) for the measuring procedure (Fig. 4c).

14
Figure 4. Drying and quartering of the 23 soil samples to guarantee no humidity within the soil and a random selection of the
amount of soil to be analyzed with the XRF. a) Soils in trays before oven b) Quartering of the soil samples c) Capsules with
fine soil to be placed in the XRF
For each soil sample three measures were taken with the XRF under the method Soil fp. and
each measurement was set for a duration of three minutes in order to ensure a better reading of
the Rare Earth Elements and of the cadmium content which was the main interest (Oxford
Instruments, 2013). An average value was calculated with the three measurements per soil
sample and this was set as the concentration value for the element. The error related to the
measurements was graphed with the points in the results.
In the case of the rock samples, three XRF measurements were done per sample each lasting
four minutes. The values obtained from the three measurements were then averaged to obtain
one general value for the element content. The error related to the measurements was graphed
with the points in the results.
iv. Correlation and analysis methods
To determine the correlation between Cd and the three soil parameters: humidity, organic
matter and carbonates content, along with pH, a univariate and a multivariate analysis of the
data was conducted with PAST 3.191. The data was inserted into the program, normalized using
the corresponding mean and standard deviation (we used the formula abs((x-mean)/stdev) so
the data could be analyzed even though they had different units of measurement) and then
plotted. First, graphs with univariate correlation analysis of linear type were conducted and for
1 PAST 3.19 user manual describes the methodology behind each type of correlation available. A linear correlation
and/or a PCA run in the program follows the mathematical set-up that corresponds to them according to their
definition.
a) b) c)

15
the cases that were appropriate a principal component analysis was conducted to give further
insight into the data and farms behavior.
III. Results
i. Humidity, organic matter and carbonates content
Soil humidity ranged from 20.27% to 33.5% of the total initial weight. Only one sample from
Farm 1 and three samples from Farm 3 display a slightly higher humidity content. For both the
organic matter content and the carbonates content, the percentages from the total soil sample
were below a value of 7% (Fig. 5). As observed in Figure 5 the percentages lost for each sample
both in organic matter (O.M) and in carbonates are very similar for some soils from Farm 2
and 3. However, in the majority of samples the carbonate content tends to be greater than the
organic matter. There is a tendency for more O.M and carbonate content in the samples from
Farm 1 (see Annex 1 for better detail). Two samples from Farm 2 and one from Farm 1 also
have bigger O.M and carbonates content, all corresponding to the latest samples within the
farm group. The error bars displayed were calculated as the squared sum of the systematic error
with the standard deviation of the data.
Farm 1 shows the highest averages in the samples for organic matter and carbonates
components, while the humidity level is also the highest for this farm. Farm 2 and 3 have almost
identical averages for the soil components and the same pH value. In general, there is no
significant difference between the farms in any of the parameters (Fig. 5).
ii. pH
The pH ranges from 6 to 7.82. As observable in Figure 6, there was no clear tendency, no
difference on variance nor precision of the data. This data is expected for cacao farm soils in
equatorial regions and is consistent with observations made in farms located in Ecuador and
Peru (Chavez et al., 2016; Zug et al., 2019).

16
Figure 5. Data of soil composition. a) Summary table of data for soil components and humidity averages by farms and the total
of samples. b) Percentage composition of the soil samples, three components were measured: matrix (yellow), organic matter
(red) and carbonates (orange) adding up to 100% on the axis of the left. The humidity content is graphed as a black line and is
reported to the axis on the right. The three farms are indicated along with their corresponding samples with matching colors,
farm 1 in red, farm 2 in yellow and farm 3 in blue.
Figure 6. pH values measured for all soil samples: blue dots correspond to Farm 3, yellow dots to Farm 2 and red dots to
Farm 1.
iii. Soil analysis
It was possible to observe the bedrock on the surface in the first two plantations that were
visited: Farm 1 and Farm 2. The rock was primarily a well-sorted sandstone with fine to
Samples Humidity Organic Matter Carbonates Other pH
Farm 1 27% 5% 5% 62% 7.0
Farm 2 25% 3% 4% 68% 6.8
Farm 3 26% 3% 4% 67% 6.8
All samples 26% 4% 4% 65% 6.9
a)
b)

17
medium-grained composition as was expected according to the geological sedimentary
formations of the zone. Regarding the soil matrix only Horizon A was observed. All of which
had presence of cacao tree´s roots.
The boundary A consisted mainly of dark to brown-black (3/2, 4/2 to 4/4 in the Munsell soil
color chart) and moist soil primarily (Pendleton et al., 1951); the soils were mainly silty clay
loam to clay loam entisols according to the observations on this field trip (Shirazi & Boersma,
1984). Small orange colored patches were found in different soil extraction locations, these
patches were approximately 0.5 to 1.5 cm big. This orange color comes from clay minerals,
aluminum and iron oxides such as hematite that could possibly come from the bedrock,
reinforcing the classification as clay composition and the sedimentary nature of the bedrock
bellow (Vimal et al., 2016). However, these patches could also come from fertilizer
enrichments and accumulations of the nutrients due to this anthropogenic input (PPRC, 2010).
Figure 7. Soil and Bedrock observable on surface in Cacao Farms: a) orange patches in soil, b) bedrock outcrop and observable
on soil top, c) depth of soil hole made for sampling and presence of roots.
iv. Elemental analysis of soils and rocks
3.4.1 METALS OF INTEREST
For the rock samples the values for Ca stay within a range of 520 to 4500 ppm, Zn from 15 to
91 ppm, Cu from 0 to 17 ppm and Ni from 4 until 27 ppm. Now for Cd the concentration goes
from 21 to 90 ppm. Comparatively in the rocks data, Cd and Zn have similar values, while Ca
is the element with the biggest presence which can be expected for sedimentary rocks
(Marowsky & Wedepohl, 1971). A positive correlation can be observed for Cd against Ca and
Zn. Related to Cu and Ni the data are more dispersed and no appreciable tendency can be
50cm

18
observed (Fig. 8). For samples from Farm 1 the Cu and Ni values tend to be smaller than for
Farm 2.
Figure 8. Metals related to Cd vs. Cd for rock samples. The red dots correspond to the rocks form Farm 1 and the yellow dots
from rocks of Farm 2. All axis are in ppm a) Ca vs. Cd (the values of Ca were divided by 10 to get a better graphing
observation), b) Zn vs. Cd, c) Cu vs. Cd and d) Ni vs. Cd.
For the soil samples the values for Ca stay within a range of 154 to 4000 ppm, Zn from 20 to
160 ppm, Cu from 0 to 67 ppm and Ni from 0 until 34 ppm, Cr from 0 to 134 and Pb from 0 to
56. Now for Cd the concentration goes from 8 to 47 ppm. Comparatively in the soils data, Cd,
Pb and Ni have similar values, while Ca is the element with the biggest presence which can be
expected for equatorial soils (Marowsky & Wedepohl, 1971). No positive correlation can be
observed for Cd against any of the metals. Related to Cu the data show a slight negative
tendency (Fig. 9d). However, it is observable that samples from Farm 3 tend to have a bigger
content of Cr, Ni, Cu and Zn than the other two farms. While Farm 2 has the lowest values of
Cr, Ni and Zn. For Pb there is no clear difference among farms, in Fig. 9f it is observable that
a) b)
c) d)

19
only some samples from Farm 1 display very low to no values of Pb standing out of the general
behavior of soil samples.
Figure 9. Metals related to Cd vs. Cadmium in soils samples. The red dots correspond to the soils form Farm 1, the yellow
dots from soils of Farm 2 and blue dots to soils from Farm 3. All axis are in ppm a) Ca vs. Cd (one very high value of Ca was
removed from the data set to get a better graphing observation), b) Cr vs. Cd, c) Ni vs. Cd, d) Cu vs. Cd, e) Zn vs. Cd and f)
Pb vs. Cd.
a) b)
c) d)
e) f)

20
3.4.2 CADMIUM
Most of the Cd concentration values in soils are within a range of 20 to 30 ppm for all farms
and no clear tendencies are observable within the concentrations (Fig. 10, Table 1). The highest
value is 47 ppm of Cd found in sample 15 from Farm 1 and the lowest is 8 ppm found in sample
9 from Farm 2 (Fig. 12 and Fig. 13).
Table 1. General data collected about sampled cacao farms. An average Cd content reported for each transect of each farm.
Different variables were marked as either present or not present with an X for transects corresponding to each farm.
In Figure 10. the expected cadmium content in soils according to literature (Smolders &
Mertens, 2013), the critical thresholds for cadmium (Brus et al., 2002) and the cadmium
content in cacao beans that has been recently found (Chavez et al., 2015) were plotted as
reference values. The asterisks found in Farm 2 within Table 1 refers to the fact that chemical
fertilizer was used within the cacao plantation a year before (data not published) but during the
current year no fertilizer was applied recently. This table gives insight on the farm´s
fertilization practices, the presence of boundaries and the average Cd soil content per transect.

21
Figure 10. Cd concentrations in Soils and Rocks for all the Samples. Triangles represent the rock samples and circles the soils.
Blue is for samples from Farm 3, yellow Farm 2 and red Farm 1. Cd thresholds/limits/measurements graphed as lines. From
top to bottom: the first line (full line) corresponds to the Cd superior critical threshold, the second line (big hyphens) is the Cd
highest value in cacao beans found in literature, the third line (medium hyphens) is the Cd critical threshold and the fourth line
corresponds to the Cd that is naturally or usually found in soils.
All soils and rock samples are above the usual value of Cd in soils and the Cd critical threshold.
Only one sample from Farm 2 is below the Cd highest value for cacao beans found by Chavez
in 2015. While two samples from Farm 1 and one from Farm 3 are below the Cd superior
critical threshold. All other samples are above every reference value indicating a high Cd level
and an accumulation of the metal or possible contamination (Fig. 10). The values acceptable
by environmental regulations are: Eco-SSL values from 0.36 mg/kg dry weight (dw) for
mammalian wildlife to 140 mg/kg dw for soil invertebrates (EPA, 2019; U.S. EPA, 2007).
Therefore, no sample here complies with international regulation for soil environmentally safe
values.
The highest values of Cd in rocks do not correspond to the highest Cd values in soil samples
(Fig. 10). Only for samples 6 and 15, this high Cd content of the rocks corresponds to high Cd
in soils (Fig. 11 and 12). Both samples were collected in the highest part of the plantation in
Farm 2 and Farm 1 respectively. All rock samples show a higher Cd content that the soils,
except from samples 16 and 19 from Farm 1.

22
Individual farm graphs were made to evidence if there was any particular behavior in Cd within
each of the cacao plantations. For the first two farms, the first three samples are the highest
ones in the slope, the next three in the middle of the slope and the last three at the lowest part
of the plantation. For the last farm, the collection of samples was all at the same plain height.
These more in detail graphs also display the exact Cd content values measured and enable a
comparison with the Cd values that were obtained in the fertilizers.
Farm 1
Figure 11. Cd Data for Cacao Plantation in Farm 1, soils samples represented by circles and rock samples by triangles, each
sample has the exact value of Cd measured for them. Line showing the Cd level of organic fertilizer.
The soils samples from the first transect tend to have a higher Cd content and only one of the
last samples has the second highest content of the metal being far from the other samples of
that transect zone. The Cd content of the organic fertilizer that was currently used in this farm
is higher that the content in rocks (Fig. 11). It is also higher that Cd levels accepted in fertilizers
in European countries were values of 22 ppm to 40 ppm cannot be exceeded (PPRC, 2010).
Only the biggest Cd content, which corresponds to rock sample 17, is above the fertilizer and
goes out of the tendency of the rocks in general (Fig. 11). The Cd contents in soils are elevated
but stay within a similar range and the mean is of 29 ppm for the farm.
Farm 2
Again, the first soil samples, the higher ones in the slope, tend to have a higher Cd content than
the last samples, lower ones. The Cd content of the chemical fertilizer that was previously used
in this farm is lower than the content in rocks and two thirds of the soil's samples. Only the
biggest Cd content of rock sample 6, corresponds to the highest Cd content in all of the soils;

23
the other soils have smaller concentrations of the metal with one being particularly low in the
middle samples (Fig. 12). The Cd contents in soils are elevated but stay within a similar range
and the mean is of 26 ppm for the farm.
Figure 12. Cd Data for Cacao Plantation in Farm 2. soils samples represented by circles and rock samples by triangles, each
sample has the exact value of Cd measured for them. Line showing the Cd level of industrial fertilizer.
Farm 3
In this farm all samples were collected at similar heights and random points, however, the first
samples tend to have more Cd content. Since no rocks were collected in this farm, no
information on this matter is available. The Cd content was plotted against the critical values
since this farm has three samples close to the superior critical threshold for Cd. The Cd contents
in soils are varied in this case and the mean is of 25 ppm for the farm.
Figure 13. Cd Data for Cacao Plantation in Farm 3. Soils samples represented by circles; each sample has the exact value of
Cd measured for them. Line showing the Cd threshold and Cd in cacao beans.

24
v. Correlation between parameters
Cadmium and relevant elements
The level of correlation of the cadmium with the metals of interest, listed before in the
geological setting, can be observed in Figure 14. In the rock samples the Cd is mainly correlated
to Ca and Zn and no correlation was found with Cr or Pb. For the soil samples the correlation
are less strong but the Cd is mainly linked to Ca and Cu, followed by Pb and Zn in a smaller
proportion.
Figure 14. Correlation of Cd to all other relevant heavy metals. a) Correlation for rock samples first displayed graphically and
below c) as a table with the correspondent values. b) Correlation for soil samples first displayed graphically and bellow d) as
a table with the correspondent values.
Cadmium, soil components, humidity and pH.
It was possible to identify that the pH had no strong influence on the Cd in the soils, while
organic matter and carbonate content had the strongest relation to the metal. The pH and
humidity were the only two variables strongly related among themselves.
a) b)
c) d)

25
Figure 15. Correlation of Cd to soil components, humidity and
pH. Correlation for soil samples a) first displayed graphically
and b) as a table with the correspondent values.
The PCA displays no evident clusters of data meaning that among the farms there is no strong
differentiation. In the second quadrant it is possible to observe 6 samples that are mainly
determined by pH and humidity, 2 from each plantation showing a similarity within the farms.
In the third quadrant, where cadmium is a main determinant, fewer samples are present and
most of them belong to Farm 1, indicating that this plantation is the one with samples more
related to Cd, organic matter and carbonates in their composition.
Figure 16. PCA for Cd and components in soil samples, humidity and pH. Blue dots correspond to Farm 3, yellow dots to
Farm 2 and red dots to Farm 1.
a)
b)

26
Cadmium, soils, rocks and fertilizers
Based on the previous correlations the components that showed to be the most relevant ones
against the Cd content were correlated again but now adding the rocks metal’s content and the
Cd fertilizer content. The Cd in soils is observed as primarily linked to the organic matter and
the Cd in rocks as the biggest representation circles show in Figure 17a. Then the correlations
go in sequence of importance into the Ca available in soils, and the Zn and Cu available in soil
and of those metals but in rocks respectively. However, this link to Cu is not considered truly
relevant and in further correlations was removed because the Cu measurement were very
dispersed and the ppm values small. On the other hand, the correlation of Cd in soils to Zn in
soils is kept and considered relevant since literature supports it and the measurements were
bigger and similar (Carrillo-González, 2003). The fertilizers were not strongly correlated but
they cannot be discarded since the Cd measurements in them was elevated. In a correlation
with only the relevant soil components and the fertilizers the later show a stronger correlation
than the carbonates proving that they have relevance in the Cd content in soils. The exact values
of the correlations from Figure 17 can be consulted in the annexes.
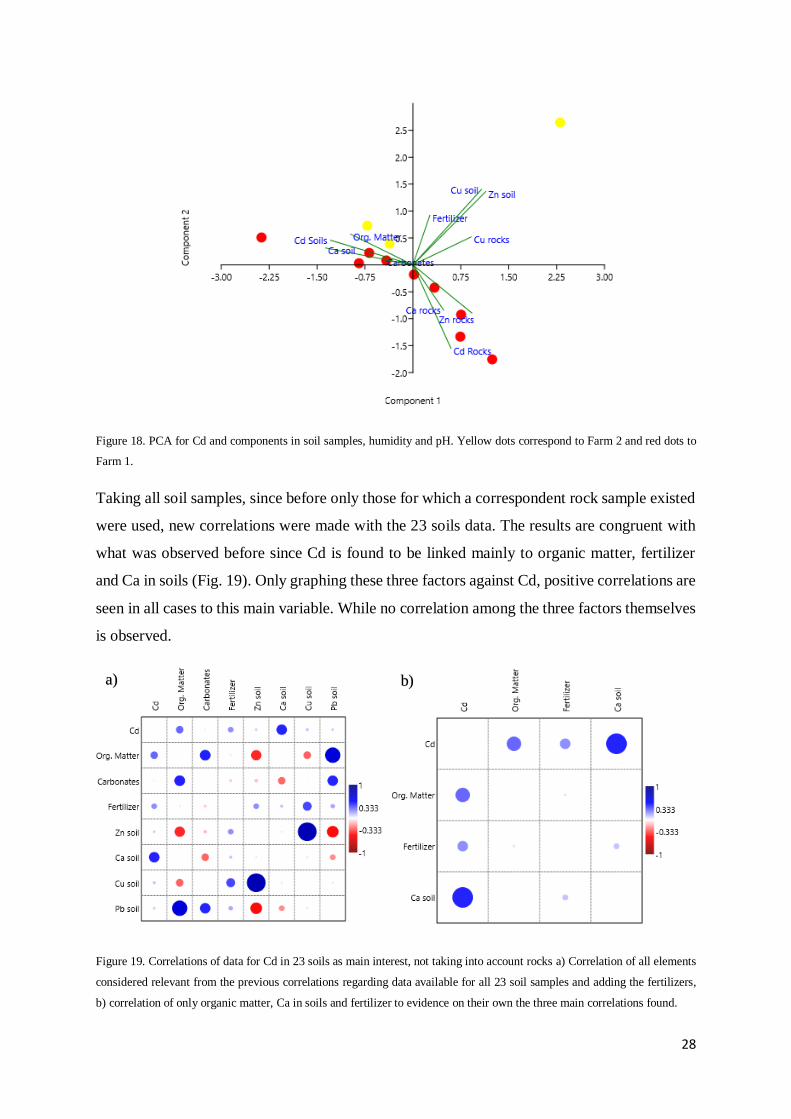
The PCA in Figure 18 displays one cluster of samples from Farm 1 that extends in quadrant
two and quadrant four, since samples from this farm are grouped in a kind of thin oval among
these regions of the plot. The samples on quadrant two are mainly dictated by the rock
components while the ones in quadrant 2 are better described by the soil components and Ca
content of both rocks and soils. Among the samples from Farm 2 one of them is completely
apart from the others because it is defined mainly by the Cu and Zn content, along with the
fertilizer. The other samples of Farm 2 remain like those in quadrant 4 from Farm 1. Apart
from the isolated sample from Farm 2 the others behave similarly determining that there is no
strong difference in samples within the plantation and neither among the different farms
regarding the measured variables.

27
Figure 17.General correlations of data for Cd in soils as main interest a) Correlation of all elements considered relevant from
the previous correlations, adding the fertilizers and rock components as variables as well, b) Correlation of elements considered
relevant removing those than in Figure 17a showed little to no correlation, c) Correlation of only organic matter, carbonates
and fertilizer to evidence if fertilizers could be relevant.
a)
b) c)
28
Figure 18. PCA for Cd and components in soil samples, humidity and pH. Yellow dots correspond to Farm 2 and red dots to
Farm 1.
Taking all soil samples, since before only those for which a correspondent rock sample existed
were used, new correlations were made with the 23 soils data. The results are congruent with
what was observed before since Cd is found to be linked mainly to organic matter, fertilizer
and Ca in soils (Fig. 19). Only graphing these three factors against Cd, positive correlations are
seen in all cases to this main variable. While no correlation among the three factors themselves
is observed.
Figure 19. Correlations of data for Cd in 23 soils as main interest, not taking into account rocks a) Correlation of all elements
considered relevant from the previous correlations regarding data available for all 23 soil samples and adding the fertilizers,
b) correlation of only organic matter, Ca in soils and fertilizer to evidence on their own the three main correlations found.
a) b)

29
No clusters are observed in the last PCA since samples are dispersed and no differentiation
among the farms can be observed. The grouping of the data is mainly around the zero values
of the components with only a few samples from Farm 1 on the left and some samples from
Farm 2 in the downward right. This reinforces the fact that no strong difference exists among
the farm´s soil since they share similar behavior. Only a part of the samples is in quadrant three
of the plot were Cd is determinant belonging mainly to Farms 2 and 3.
Figure 20. PCA for Cd and components in soil samples, metal contents and fertilizer. Blue dots correspond to Farm 3, Yellow
dots correspond to Farm 2 and red dots to Farm 1.
IV. Discussion
Soil characteristics
The soils among the farms share similar characteristics regarding the main components, they
share the same tendency in humidity and pH. They all are similar in characterization to data
reported for cacao plantation soils in the equatorial region. The organic matter content in these
soils is higher than the carbonates content probably because the rocks have no great presence
of these minerals and the organic matter is enriched because of the vegetation falling from the
cultivated plants and consequently decomposing. The soils are currently viable in terms of
nutrients and pH for cultivating but this viability could be affected by decreases of the pH,
which could liberate metals from the soil and the bedrock causing enrichment of heavy
elements that could end up damaging the crops. This should be considered when choosing how
to irrigate the cacao crops and should focus attention on the phenomena related to the acid rains

30
that have become more frequent and could severely harm the crops. This irrigation could be
however not very much needed since the humidity content of the soils is appropriate.
Cadmium
The great majority of measured concentrations are above the reference Cd values and it is
important to notice the elevated Cd content of the organic fertilizer from Farm 1 (PPRC, 2010).
This is also the plantation with the highest mean for the Cd content in soils and at the same
time the highest rock Cd concentrations are found in it. However, the Cd values for all farms
are within a same elevated range reaching a highest value of 47 ppm. The chemical fertilizer
has a lower Cd content that the organic one but could still be a relevant Cd source. As
mentioned, it has a higher value of Cd that the levels accepted in fertilizers in European
countries were values of 22 ppm to 40 ppm cannot be exceeded (PPRC, 2010). This addition
of Cd from fertilizers, both organic and inorganic, could augment the Cd in soils if combined
with high Cd content rocks. The Cd in rocks had a relevant presence but showed no particular
tendency, staying within a similar range, which can be expected from heterogeneities in the
bedrock even if the farms are all above the same geological formation.
Attention should be paid to Pb and Cu content in fertilizers since they have no presence in the
sampled rocks but were found in the soils along with the Cd. This all are heavy metals with
several and complicated health consequences (EPA, 2019), so finding if this presence could
come then from the fertilizers or from water irrigation is relevant for peoples and crop health.
Since the analysis was only for boundary A of the soils, it is possible to observe a persistence
in this soil layer of Cd, but further depths should be analyzed to determine the Cd distribution
downwards (Bravo et al., 2018; Chavez et al., 2016). Samples from the surface could also give
an insight of how the Cd behaves in a small gradient of soil which should be taken into account
for the future.
Correlation between parameters
The components that showed the biggest correlation to the Cd content in the soil samples were
the organic matter, the rock Cd content, the Ca content in soils and finally the fertilizers. On
the other hand, the correlation of Cd in soils to Zn in soils is also considered relevant since
literature supports it and the values for this relation were relevant (Carrillo-González, 2003).
The fertilizers were not as strongly correlated but they cannot be discarded since the Cd
measurements in them was elevated. As the organic matter relates to the Cd content in the soils
it is expected that the organic fertilizers also promote that content, especially since they are

31
fertilizers mainly composed of organic matter like animal feces and food waste, as was
explained by the owner of Farm 1. The organic fertilizer issue should be treated by considering
that the animals from the region are eating insects that live in the Cd enriched soil, this
accumulates the Cd in their depositions and then returns the metal into the soil within the
fertilizer. This is promoting a cycle of Cd that is maintaining the heavy metal in the region,
considering this is not an easily mobile element in the surface.
The high cadmium levels in the three farms from San Vicente de Chucurí can be explained by
the main correlated factors, since the soils showed all these characteristics together. These
characteristics have been linked elsewhere, individually or all together, to the Cd enrichment
of soils. The samples amongst the farms showed no particular tendencies per farm since in the
PCAs they were mainly dispersed, and no clusters were identified. It can be said all three farms
have similar soils characteristics and have the same Cd accumulation and promoting factors of
this accumulation.
As it was also observed the factors do not depend one on the other, the use of fertilizer does
not depend on the rocks form which the soil formed, and both of them do not depend on the
organic matter content the soil possesses. Therefore, they are factors that can be targeted
individually. The use of organic fertilizers by the farm owners can be managed as to not
promote the further cycling of the Cd. Using chemical or industrial fertilizers could be an
option, but as it was observed they can also contain several ppm of Cd. Therefore, regulation
of this metal in fertilizing products and guaranteeing to the farmer quality and low metal
content could reduce an input that is being made into the soil by the affected individuals
themselves. Also, practices of producing organic fertilizers mainly with food waste, that is
known to not be an accumulation point of Cd, could be an option.
Rock Cd content cannot be targeted by human action by any more means that locating the cacao
plantations in regions where rock is known for not having Cd content or characteristics that
enhance or make more probable the presence of this metal. Regions in Colombia where
bedrocks are basic and/or of igneous or metamorphic nature and that have low organic matter
content, should be preferred for cultivating cacao plants that are known for accumulating Cd.
The final factor corresponding to organic matter in the soil can be targeted less clearly and
efficiently, since removing the leaves and fallings from the trees that are in the surface of the
entire plantations can be arduous work. Also, considering that the later management of where
to put or discard all this material can be a problem for the owner. Finally, trying to remove the

32
already integrated organic matter from the soil is not realistically possible so this factor is less
treatable in order to reduce Cd availability.
V. Conclusions
Determining the origin of the Cd in soils is a useful baseline to identify which strategies should
be taken to reduce said content and determine if they will be useful. The soil, rocks and fertilizer
samples from all three farms showed high levels of Cd. The great majority of them surpassed
all Cd thresholds and exceeded by far the limits stated by the international regulation.
The correlation between parameters was determined with a univariate analysis in which the
data was normalized to guarantee an equal amount of weight set for each parameter. The results
stablish mainly a relation of Cd to the organic matter content, the addition of organic fertilizers,
the rocks containing Cd and the Ca content of soils. The characteristics of the bedrock below
the plantation and the organic fertilizer are two main points to address in working for the
reduction of Cd presence and factors that could enhance its accumulation.
The organic matter in the organic fertilizers can be promoting the Cd levels. Since this kind of
fertilizer is made by the farmers, mainly with animal feces and food waste, no regulation or
monitoring processes are followed which must be considered since it implies no control of the
metals content and other parameters like pH that affects Cd availability. Also, other industrial
fertilizers should be monitored and controlled more for Cd and other metals since the one
analyzed here contained a considerable amount of them as well.
Enriched sedimentary rocks, with high carbonaceous content and fine particle sizes, can
provide Cd to the soil. If this type of rocks is combined with other sources of the metal, they
cause as a set, elevated Cd levels above acceptable threshold values. The mineralogy
description of the rock to determine the location of the Cd within it and how it is passed into
the soil due to the pedogenic processes would be of great use and should be considered for
further studies. This last step exceeded the reach of this project.
More detailed sampling (with, for example, bigger depths and at every soil horizon) across
bigger regions or number of farms, coupled with sampling of contrasting farms located over
other type of geological units, could bring better insight into the input the bedrock has to Cd
content in soils. This is a baseline for further studies that should be held in the origin of the Cd
in cacao plantation soils in Colombia and other countries of the region.

33
References
Abbott, P. C., Benjamin, T., Burniske, G., Croft, M., & Fenton, M. C. (2018). An Analysis Of The
Supply Chain Of Cacao In Colombia: Cacao supply chain in Colombia View project CLIMATE-
SMART AGRICULTURE View project. (November), 209.
https://doi.org/10.13140/RG.2.2.19395.04645
Agronet. (2017). CACAO 2017, Evaluaciones Agropecuarias Municipales. PDF government document
available online: https://www.agronet.gov.co/Documents/6-CACAO_2017.pdf.
Bai, J., Xiao, R., Gong, A., Gao, H., & Huang, L. (2011). Assessment of heavy metal contamination of
surface soils from typical paddy terrace wetlands on the Yunnan Plateau of China. Physics and
Chemistry of the Earth, 36(9–11), 447–450. https://doi.org/10.1016/j.pce.2010.03.025
Bellinger, D. C. (2015). 13th International Symposium of The Institute for Functional Medicine S 140
Managing Biotransformation: The Metabolic, Genomic, and Detoxification Balance Points
Bellinger. Harvard Medical School.
Bravo, D., Pardo-Díaz, S., Benavides-Erazo, J., Rengifo-Estrada, G., Braissant, O., & Leon-Moreno,
C. (2018). Cadmium and cadmium-tolerant soil bacteria in cacao crops from northeastern
Colombia. Journal of Applied Microbiology, 124(5), 1175–1194.
https://doi.org/10.1111/jam.13698
Brus, D. J., De Gruijter, J. J., Walvoort, D. J. J., De Vries, F., Bronswijk, J. J. B., Römkens, P. F. A.
M., & De Vries, W. (2002). Heavy metals in the environment: Mapping the probability of
exceeding critical thresholds for cadmium concentrations in soils in the Netherlands. Journal of
Environmental Quality, 31(6), 1875–1884. https://doi.org/10.2134/jeq2002.1875
Carrillo-González, R., Cruz-Díaz, J., & Cajuste, L. J. (2003). INTERACCIÓN Zn-Cd EN EL SUELO
Y MAÍZ Cd-Zn Interaction in Soil and Corn Plants. Tierra Latinoamericana.
Chavez, E., He, Z. L., Stoffella, P. J., Mylavarapu, R. S., Li, Y. C., & Baligar, V. C. (2016). Chemical
speciation of cadmium: An approach to evaluate plant-available cadmium in Ecuadorian soils
under cacao production. Chemosphere, 150(May 2018), 57–62.
https://doi.org/10.1016/j.chemosphere.2016.02.013
Chavez, E., He, Z. L., Stoffella, P. J., Mylavarapu, R. S., Li, Y. C., Moyano, B., & Baligar, V. C. (2015).
Concentration of cadmium in cacao beans and its relationship with soil cadmium in southern
Ecuador. Science of the Total Environment, 533, 205–214.
https://doi.org/10.1016/j.scitotenv.2015.06.106

34
Edwards, J. R., & Prozialeck, W. C. (2009). Cadmium, diabetes and chronic kidney disease. Toxicology
and Applied Pharmacology, 238(3), 289–293. https://doi.org/10.1016/j.taap.2009.03.007
Engbersen, N., Gramlich, A., Lopez, M., Schwarz, G., Hattendorf, B., Gutierrez, O., & Schulin, R.
(2019). Cadmium accumulation and allocation in different cacao cultivars. Science of the Total
Environment, 678, 660–670. https://doi.org/10.1016/j.scitotenv.2019.05.001
EPA. (2019). Regional Screening Levels (RSLs) - User’s Guide.
European Comission. (2016). Amending Regulation (EC) No 1881/2006 as regards maximum levels of
cadmium in foodstuffs. EFSA Journal, 9(2). https://doi.org/10.2903/j.efsa.2011.1975
European Food Safety Authority. (2016). Statement on tolerable weekly intake for cadmium. EFSA
Journal, 9(2). https://doi.org/10.2903/j.efsa.2011.1975
Gramlich, A., Tandy, S., Gauggel, C., López, M., Perla, D., Gonzalez, V., & Schulin, R. (2018). Soil
cadmium uptake by cocoa in Honduras. Science of the Total Environment, 612, 370–378.
https://doi.org/10.1016/j.scitotenv.2017.08.145
He, S., He, Z., Yang, X., Stoffella, P. J., & Baligar, V. C. (2015). Soil Biogeochemistry, Plant
Physiology, and Phytoremediation of Cadmium-Contaminated Soils. In Advances in Agronomy
(Vol. 134). https://doi.org/10.1016/bs.agron.2015.06.005
Hurdebise, Q., Tarayre, C., Fischer, C., Colinet, G., Hiligsmann, S., & Delvigne, F. (2015).
Determination of zinc, cadmium and lead bioavailability in contaminated soils at the single-cell
level by a combination of whole-cell biosensors and flow cytometry. Sensors (Switzerland), 15(4),
8981–8999. https://doi.org/10.3390/s150408981
Jiménez Tobón, C. S. (2015). Global legal status of cadmium in cacao (Theobroma cacao): a fantasy or
a reality. Producción + Limpia, 10(1), 89–104.
Khan, M. A., Khan, S., Khan, A., & Alam, M. (2017). Soil contamination with cadmium, consequences
and remediation using organic amendments. Science of the Total Environment, 601–602, 1591–
1605. https://doi.org/10.1016/j.scitotenv.2017.06.030
MADR. (2005). Plan Nacional De Desarrollo Cacaotero 2012–2021. Director, 1828(1), 334–334.
Marowsky, G., & Wedepohl, K. H. (1971). General trends in the behavior of Cd, Hg, Tl and Bi in some
major rock forming processes. Geochimica et Cosmochimica Acta, 35(12), 1255–1267.
https://doi.org/10.1016/0016-7037(71)90114-1
Meter, A., Atkinson, R. J., & Laliberte, B. (2019). Cadmium in Cacao from Latin America and the
Caribbean. A Review of Research and Potential Mitigation Solutions. Caracas: CAF. Retrieved
from http://scioteca.caf.com/handle/123456789/1506
35
MINTIC. (2018). Informe de gestión 2018.
Monroy, W. O. (2014). Exploración y evaluación de carbones en el área Cimitarra sur y sur del área
río Opón-Landázuri del departamento de Santander. Universidad Pedagógica y Tecnológica de
Colombia, Sogamoso. http://repositorio.uptc.edu.co/handle/001/2543
Moreno, G., & Sarmiento, G. (2002). Estratigrafía Cuantitativa de las Formaciones Tablazo y Simití en
las localidades de Sáchica (Boyacá) y Barichara - San Gil (Santander), Colombia. Geología
Colombiana - An International Journal on Geosciences, 27(0), 51–74.
Nelson, D. W., & Sommers, E. L. (1982). Total Carbon, Organic Carbon, and Organic Matter.
Methods of soil analysis. Part 2. Chemical and microbiological properties, (methodsofsoilan2),
539-579.
Oliveros, D., & Pérez, S. (2013). cacao en una región de Santander – Colombia * Measurement the
Competitiveness of Cocoa Farmers in Introducción. Revista Lebret, 5, 243–267.
Oxford Instruments. (2013). X-MET 7000 Series. 6.
Pabón, M. (2016). Caracterizacion Socio-Económica Y Productiva Del Cultivo De Cacao En El
Departamento De Santander (Colombia). Revista Mexicana de Agronegocios, 38(38), 283–294.
Page, a. L., Chang, a. C., & El-Amamy, M. (1987). Cadmium Levels in Soils and Crops in the United
States. Lead, Mercury Cadmium and Arsenic in the Enviroment, 119–146.
Patterson, J. W., Allen, H. E., Scala, J. J., Patterson, J. W., Allen, E., & Scala, J. (2012). Carbonate for
heavy precipitation metals pollutants. 49(12), 2397–2410.
Pendleton, R. L., & Nickerson, D. (1951). Soil colors and special Munsell soil color charts. Soil Science,
71(1), 35-44.
PPRC. (2010). FAQs About Cadmium in Fertilizer : Fertilizer Laws and Limits. 1–10.
Procolombia. (2019). Cacao en Colombia. Brochure handed in conference held within the Chocoshow
2019 in Bogotá, Colombia.
Republica, L. (2018). PIB agropecuario de Colombia tuvo un crecimiento de 25% entre 2010 y 2017.
Royero Gutierrez, J. M., & Clavijo, J. (2001). Mapa Geológico Generalizado Departamento De
Santander Escala 1:400.000.
Shirazi, M. A., & Boersma, L. (1984). A unifying quantitative analysis of soil texture. Soil Science
Society of America Journal, 48(1), 142–147.
https://doi.org/10.2136/sssaj1984.03615995004800010026x

36
Smolders, E. (2001). Cadmium uptake by plants. International Journal of Occupational Medicine and
Environmental Health, 14(2), 177–183.
Smolders, E., & Mertens, J. (2013). Chapter 10: Cadmium. Heavy Metals in Soils, 22(Cd), 313–333.
https://doi.org/10.1007/978-94-007-4470-7
Tromba, A. (2019). Maximum Levels Of Cadmium In Chocolate: What To Knowle. Retrieved
November 25, 2019, from https://foodensity.com/maximum-levels-of-cadmium-in-chocolate/
U.S. EPA. (2007). Ecological soil screening levels for Zinc, Interim Final. United States Environmental
Protection Agency, (April), OSWER Directive 9285.7-68.
Vimal, B. K., Kumar, R., Choudhary, C. D., Kumar, S., Kumar, R., Singh, Y. K., & Kumari, R. (2016).
Signature capture of red soil patches and their acidity-A case study of Banka district, Bihar, India.
Journal of Applied and Natural Science, 8(2), 874–878. https://doi.org/10.31018/jans.v8i2.889
Zug, K. L. M., Huamaní Yupanqui, H. A., Meyberg, F., Cierjacks, J. S., & Cierjacks, A. (2019).
Cadmium Accumulation in Peruvian Cacao (Theobroma cacao L.) and Opportunities for
Mitigation. Water, Air, and Soil Pollution, 230(3), 1–18. https://doi.org/10.1007/s11270-019-
4109-x

37
ANNEXES
Figure 21. Grams of each component lost during burning of each soil sample from the initial 100 grams taken.
Figure 22. Main components loading for the PCA from Figure 16 a) component 1 b) component 2

38
Figure 23. Correlation values corresponding to the graphical correlations from Figure 17.
Figure 24. Main components loading for the PCA from Figure 16 a) component 1 b) component 2
Top Related