1507 syste 3 ccount gardless of the experience levels of the
What determines the FDI mode of entry?�
Sha�k HebousGoethe University [email protected]
Martin RufUniversity of Mannheim
March 29, 2010
Abstract
We examine the determinants of the mode of entry of multinational�rms into the foreign economy using a novel �rm-level dataset on Germanoutbound FDI. Further, we allow the �rm to select its investment mode(M&A vs. Green�eld investment) and its ownership mode (wholly-ownedvs. partially-owned) simultaneously. We avoid the assumption of theindependence of irrelevant alternatives by employing a simulated maxi-mum likelihood estimator of a probit model. We �nd that as e¢ ciencyincreases the �rm is less likely to choose any mode of entry relative to awholly-owned Green�eld a¢ liate. Firms with a high experience with hosteconomy tend to select Green�eld entries to M&A entries regardless ofthe ownership structure. A high level of Corruption and a long distancefrom Germany both reduce the probability of M&A as a mode of entry.
Keywords : mode of entry, multinational �rms, mergers and acquisi-tions, simulated likelihood, ownership structure, corruption
JEL Code : F 200, F 230
�The authors are grateful to Beatrix Stejskal-Passler, Alexander Lipponer and the researchcentre of Deutsche Bundesbank for the kind support and hospitality. The authors thank HeinzHerrmann and Alfons Weichenrieder for helpful comments. The usual disclaimer applies.
1
1 Introduction
Multinational �rms have to decide how to enter a foreign economy. This modeof entry decision is a combination of two decisions: the investment mode andthe ownership mode. The decision on the investment mode is the decision be-tween establishing a new venture (Green�eld investment) and merging with oracquiring an existing �rm (M&A), while the decision on the ownership modeis the decision between establishing a wholly-owned a¢ liate and a joint ven-ture (partially-owned a¢ liate). Hence, the set of entry alternatives available fora multinational �rm consists of four options: wholly-owned Green�eld invest-ment, wholly-owned M&A investment, partially-owned Green�eld investmentand partially-owned M&A investment.What determines the Foreign Direct Investment (FDI) mode of entry? We
carry out an empirical analysis to provide the answer for this question andreconcile the evidence with the available theoretical predications. Variables ofparticular interest can be categorised as �rm-speci�c characteristics (e¢ ciencyand experience of the parent �rm) and country-speci�c characteristics (corrup-tion and distance). Empirical evidence on the joint determinants of the modeof entry is rather scarce. Most available empirical studies consider a subset ofpossible entry options, i.e. either the investment mode or the ownership mode,omitting the rest. Typically, the estimation is carried out by employing a bi-nary discrete choice model or in few cases a nested model in which a sequenceof decisions is arbitrarily assigned. We argue that studying the mode of entrydecision requires a joint and simultaneous consideration of all entry options.This task to be accomplished requires an adequate multinomial discrete choicemodel, and certainly a rich dataset that contains all needed information.We organise our ideas as follows: In section two, we support our argument,
and position our contribution to the literature by providing a brief survey ofrecent studies on the mode of entry of multinational �rms. We point out howthis topic is approached from di¤erent theoretical and empirical angels of inter-national economics and industrial organisation. The main message is that moststudies examine either the investment mode or the ownership mode. However,�nal conclusions end up stressing the importance of similar characteristics ina¤ecting both decisions. For example, the strand in the literature on the invest-ment mode concludes that more e¢ cient �rms prefer a Green�eld to a M&Ainvestment; Nocke and Yeaple (2008). At the same time, the ownership strandconcludes that more e¢ cient �rms prefer a whole ownership of the a¢ liate toa joint venture; Ra¤ et al. (2009a). Then, will an increase in e¢ ciency a¤ectthe mode of ownership or the mode of investment? What factors a¤ects thedecision to undertake a partially-owned Green�eld project or a wholly-ownedcross-border acquisition? A similar pattern of questions arises in the contextof the impacts of country-speci�c characteristics on the mode of entry decision.Will a decrease in corruption in the host economy a¤ect the ownership prefer-ences of the �rm or will it a¤ect the �rm�s decision to establish a Green�eldproject or acquire another company? Probably both decisions will be a¤ected.However, this would mean that both decisions will be a¤ceted at the same time
2
and not necessarily in an independent manner. The �rm considers all entryalternatives in its optimisation problem and picks the one that is associatedwith the maximum expected pro�t. It is this consideration that motivates usto allow for all four options at the same time in order to provide comprehensiveevidence on the determinants of the FDI mode of entry.In section three, we describe our econometrical approach in dealing with
our question. The multiple entry alternatives available for a multinational �rmrequire a multinomial discrete choice model. However, a standard multinomiallogit model relies on the restrictive assumption of Independence of IrrelevantAlternatives (IIA). The IIA implies that, ceteris paribus, the relative odds ofchoosing between two alternatives are the same independently from the otheravailable alternatives. We show that the assumption of the IIA is rejected inour sample. We circumvent the IIA assumption by employing a MaximumSimulated Likelihood Estimator (MSLE) of a probit model. The MSLE allowsfor a �exible pattern of error correlation. In this context, a proposal to modelthe entry mode as a sequence of decisions, i.e. a nested logit estimation, has thedrawback of arbitrarily assigning a decision tree. The sequence of the moves isan assumption that can be debated. Do �rms �rst decide the ownership shareand then the mode of investment or the other way around? Our model allowsthe �rm to simultaneously select among the four alternatives and avoids suchassumptions about the decision tree.In section four, we describe our data and present summaries from our non-
parametric analysis. We use the Deutsche Bundesbank �rm-level dataset onGerman outbound FDI covering about 2500 new a¢ liates in the period 2005-2007. This dataset enables us to directly identify the mode of entry since theGerman investor has to report the mode of investment (M&A or Greend�eld)and the degree of participation in the a¢ liate aboard (ownership mode). Ad-ditionally, an important feature of this dataset is that we can identify new FDIentrants, i.e. we focus on �rms�decisions at the entry. Furthermore, the dataenable us to explicitly distinguish between horizontal and vertical FDI projects.The results of Kolmogorov-Smirnov tests suggest that there are statistically sig-ni�cant di¤erences in the distributions of e¢ ciency, international experience,host-economy-experience, corruption and distance depending on the ownershipmode or the investment mode.In section �ve, we present the results of our parametric analysis. We start by
employing two binary logit models; one for the investment mode decision andone for the ownership mode decision. Our �ndings on German FDI con�rm re-cent results on multinational U.S. �rms by Nocke and Yeaple (2008) on the modeof investment and by Asiedu and Esfahani (2001) on the mode of ownership. Forexample, highly e¢ cient �rms tend to favour Green�eld to M&A investmentsand wholly-owned a¢ liates to partially-owned a¢ liates. Distance and corrup-tion both have negative e¤ects on the M&A probability and on the probabilityof a wholly-owned a¢ liate. However, there is a di¢ culty in interpreting theseresults because they are estimated independently for the probability of M&Aand for the probability of wholly-owned a¢ liates. Hence, we proceed by present-ing the results obtained from the MSLE. Our main �ndings can be summarised
3
as follows. (1) As e¢ ciency increases the �rm is less likely to choose any modeof entry relative to a wholly-owned Green�eld investment. (2) As internationalexperience of the parent �rm increases the likelihood of a wholly-owned M&Aproject increases relative to a wholly-owned Green�eld entry. (3) Firms thatare highly experienced with host economy tend to select Green�eld entries toM&A entries regardless of the ownership structure. (4) A long distance fromGermany to the host economy decreases the likelihood of choosing a M&A in-vestment; especially a wholly-owned M&A investment. (5) A high corruptionlevel in the host economy shift preferences of the parent �rm away from M&Aentries. (6) A high level of development in the host economy, as measured byGDP per capita, increases only the likelihood of a wholly-owned M&A projectrelative to a wholly-owned Green�eld investment.We conclude this paper in section six. Our �ndings are relevant for theo-
retical modelling and for economic policy. Theoretically, our results obtainedfrom the binary models support existing theoretical predictions. However, theresults obtained from the multinomial MSLE probit model indicate in additionto the importance of incorporating in economic modeling all possible modesof entry. From a policy standpoint, di¤erent forms of market entry can havedi¤erent implications on the host economy. Intuitively, M&A activities entaila reallocation of ownership rights while Green�eld investments involve interna-tional reallocation of capital, new labour demand and an increase in productioncapacity altering competition in the host economy. The pattern of technologicalspillover may also di¤er depending on the mode of entry. Understanding thedeterminants of the mode of entry decision of multinational �rms is an impor-tant step for understanding the di¤erent economic implications of the di¤erentmodes of entry.
2 Literature: Where do we stand?
2.1 Green�eld vs. M&A investments
While early studies on the theory of international trade and investment treatFDI �rms as homogenous, recent contributions recognise the importance of dif-ferentiating between M&A and Green�eld investments.1 Available models pre-dict that �rm-speci�c and country-speci�c characteristics play the major rolein determining the mode of investment. Nocke and Yeaple (2008) show thatmore productive �rms tend to enter the foreign market as a Green�eld ratherthan M&A investment. Additionally, more developed economies tend to attractM&A investments. They provide also empirical evidence on U.S. FDI �rmsfrom a binary model supporting this theoretical prediction. Neary (2007) in-troduces an oligopolistic market structure in a general equilibrium frameworkand shows that �rms acquire their high cost revivals. In this model there areno Green�eld investments. In Nocke and Yeaple (2007), �rms involve in M&A
1See Markusen (2002) and Faeth (2009) for overviews of earlier FDI theories. Helpman(2006) stresses the importance of considering the various forms of FDI projects.
4
activities to complement their abilities. In essence, the incentive of cross-bordermergers is to exploit comparative advantages opportunities. While these mod-els are essentially not necessarily models for horizontal FDI, similar conclusionsarise in the context of horizontal FDI models. Ra¤ et al. (2009a) show thathighly productive �rms tend to prefer Green�eld to M&A investments. Görg(2000) studies the decision between Green�eld vs. M&A in a duopolistic setupfor horizontal �rms. Bjorvatn (2004) shows that increased economic integrationenhances cross-border M&A by reducing the reservation price and reducing thebusiness stealing e¤ect.Empirically, Andersson and Svensson (1994) �nd that high technological
skills and research and development intensity of the project favour Green�eldoperations. Several recent empirical studies examine the determinants of cross-border bilateral M&A �ows. For example, Coeurdacier et al. (2009) �nd thatincreased European integration and the Euro have fostered M&A activates inmanufacturing sectors within Europe. Di Giovanni (2005) �nds that �nancialdeepening, as captured by the ratio of stock market capitalisation to GDP, playsa signi�cant role in explaining M&A �ows. Head and Rice (2008) estimate amodel for evaluating multilateral inward and outward M&A �ows. A numberof studies consider di¤erential implications of M&A FDI and Green�eld FDI onthe host economy. Balsvik and Haller (2007) provide empirical evidence thatthe productivity spillover e¤ect from multinational a¢ liates to domestic �rmsis negative in the case of Green�eld projects and positive in the case of M&A.A potential reason is a possible increase of domestic competition generated byGreen�eld FDI. Egger and Egger (2008) examine the trade pattern and welfaree¤ects of cross-border M&A. Haller (2009) shows that cross-border M&A caninduce domestic M&A activities. Balsvik and Haller (forthcoming) examinedi¤erences in performance of Norwegian plans after acquisition distinguishingbetween domestic and foreign investors. Gugler et al. (2003) examine di¤erencesin performance after the occurrence of the M&A investment. Hebous et al.(2010) focus on the determinants of the location decision of multinational �rmsdistinguishing between both modes of investment. Tekin-Koru (2010) studieshow trade costs can have asymmetric e¤ects on the mode of investment.
2.2 Wholly-owned vs. partially-owned subsidiaries
The e¢ ciency of the �rm is frequently stressed as an important factor de-termining the ownership mode. Less e¢ cient �rms prefer joint ventures towholly-owned a¢ liates for e¢ ciency gains considerations; Ra¤ et al. (2009b)and Mugele and Schnitzer (2008). Hence, e¢ ciency is deemed to be not onlyan important determinant of the investment mode as reviewed in the previoussubsection but also of the ownership mode. In addition to �rm-characteristics,several country-characteristics can a¤ect the ownership mode. Distance in themodel of Mugele and Schnitzer (2008) captures cultural di¤erences, and servesas an information proxy. Therefore, long distance increases the value of a lo-cal partner to keep up with the host market conditions. Asiedu and Esfahani(2001) empirically examine the ownership decision and �nd that productivity,
5
infrastructure and country institutional setting impact the ownership structureof FDI �rms. For instance, they �nd that high quality of law reduces theprobability of choosing a wholly-owned a¢ liate. Javorcik and Wei (2009) �ndthat a high level of corruption in the host economy shifts ownership preferencestowards joint ventures. Openness to international investment is also an impor-tant factor. For example, some developing economies impose rules restrictingthe foreign ownership share in the a¢ liate. Kesternich and Schnitzer (2009)model how political risks in the host economy shift ownership preferences to-wards joint ventures. In their model, high risks induce whole ownership of thea¢ liate.Another strand in the literature underlines that sharing the ownership of the
a¢ liate is costly due to various reasons such as coordination and transactioncosts, technology and control rights concerns, potential free riding by co-ownersand di¢ culties in making decisions; Grossman and Hart (1986). A number ofempirical studies emphasises in a panel framework di¤erences between perfor-mances of wholly-owned and partially-owned a¢ liates; Desai et al. (2004) andHebous and Weichenrieder (2010). Recent studies address the closely linkedissue of whether or not the implication of FDI on the host economy di¤ers de-pending on the mode of ownership. For example, the ownership structure maymatter for productivity spillovers. Dimelis and Louri (2002) provide empiricalevidence on positive productivity spillover from minority-owned foreign a¢ li-ates operating in Greece to Greek �rms. Further, this e¤ect is stronger thanthat in the case of wholly-owned a¢ liates. Javorcik and Spatareanu (2008) �nda similar pattern for �rms operating in Romania.Overall, the overview presented in this section indicates the importance of
similar factors in a¤ecting both components of the mode of entry decision, themode of investment and the mode of ownership, supporting a simultaneous con-sideration. A recent study by Ra¤ et al. (2007) jointly estimates the ownershipand investment mode probabilities using a nested model logit model. The se-quence of the decisions in the theoretical framework and corresponding empiricalanalysis is based on the following assumptions: Given the decision to go abroad,the �rm �rst decides between M&A and Green�eld investments. Afterwards,given that Green�eld is chosen the �rm decides the ownership share. However,in case of a M&A the �rm does not at all decide its ownership share. Using asample on Japanese �rms, they �nd inter alia that more productive �rms preferGreen�eld to M&A, and wholly-owned to partially-owned a¢ liates given thechoice of a Green�eld project.
3 Empirical methodology
Independently estimating the mode of investment and the mode of ownershipcan be accomplished by means of a binary discrete choice model; typically a logitmodel. For example, de�ne the binary variable ma = 1 if the mode of entry isM&A and ma = 0 if the mode of entry is Green�eld. Then, the binary logitmodel estimates the log of the odds ratio Pr(ma = 1)=1� Pr(ma = 1). In the
6
same manner, one can de�ne a binary variable capturing the ownership mode;partial = 1 if the a¢ liate is partially-owned and partial = 0 if the a¢ liate iswholly-owned.However, as we argued, there are reasons to jointly consider all four entry
options, that is to estimate a multinomial discrete choice model. Empirically, theuse of a multinomial logit model is subject to the IIA assumption, which as wewill show, can be rejected in our sample.2 Instead, our approach for investigatingthe determinants of the choice of mode of entry is to rely on the MaximumSimulated Likelihood Estimator (MSLE) of a multinomial probit model. Thisis a highly �exible model that does not exhibit the IIA assumption and allowsfor correlation in the error terms.Let �i;m stands for the expected utility (pro�t) of �rm i associated with
mode of entry m:
�i;m = x0i�m + "i;m (1)
where x is a vector of regressors with the associated coe¢ cient vector �m.The choice of the regressors in x is based on the theoretical overview in theprevious section. The errors are normally distributed " � N [0;�], where " =["i;1:::"i;4] and � is the variance-covariance matrix.Let the variable yi be de�ned to take the value m if the mth alternative is
chosen by �rm i. Let m = 1 denotes a wholly-owned Green�eld investment, m= 2 denotes a partially-owned Greend�eld investment, m = 3 denotes a wholly-owned M&A investment and m = 4 denotes a partially-owned M&A investment.Further, introduce 4 binary variables (yi;m) for each observation yi such thatyi;m equals 1 if the mode of entry m is the observed outcome:
yi;m =
�1 if yi = m,0 if yi 6= m.
(2)
Among the four possible entry alternatives, a �rm i selects the mode of entrym that is associated with the highest expected pro�t. The probability that themode of entry m is chosen equals:
pi;m = Pr[yi = m] = Pr[�i;m � �i;k] (3)
= Pr["i;k � "i;m � x0i�m � x0i�k] 8k 6= m
This is a trivariate normal integral. Speci�cally, let m = 1 be the referencealternative, "i;k � "i;m = "i;km and x0i�m � x0i�k = Zi;km then:
pi;1 = Pr[yi = 1] =
Zi;41Z�1
Zi;31Z�1
Zi;21Z�1
f("i;21; "i;31; "i;41)d"i;21d"i;31d"i;41 (4)
2Recall, in the multinomial logit model Pi;m = e��i;mP4
k=1e��i;k, m =1, . . . , 4.
7
The log likelihood is approximated by a simulator ~pi;m that is based on anumber of draws.3 The MSLE maximises:
ln ~L(�;�) =NXi=1
4Xm=1
yi;m ln ~pi;m (5)
4 Data and descriptive statistics
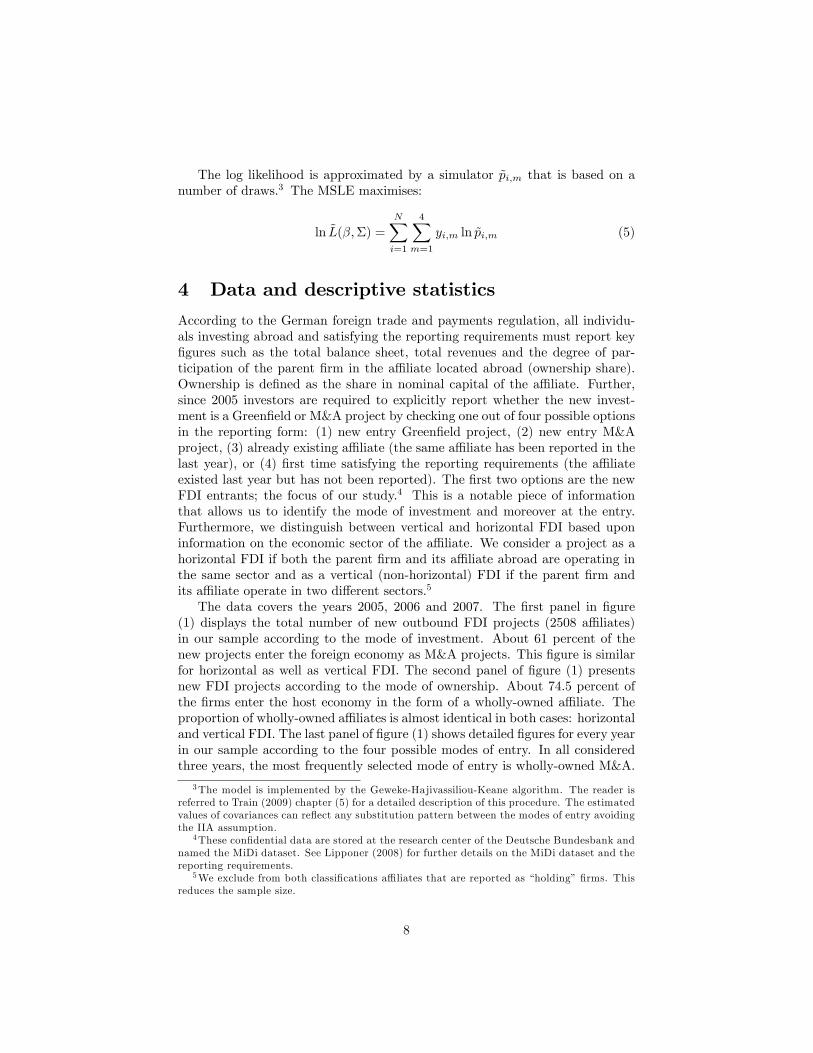
According to the German foreign trade and payments regulation, all individu-als investing abroad and satisfying the reporting requirements must report key�gures such as the total balance sheet, total revenues and the degree of par-ticipation of the parent �rm in the a¢ liate located abroad (ownership share).Ownership is de�ned as the share in nominal capital of the a¢ liate. Further,since 2005 investors are required to explicitly report whether the new invest-ment is a Green�eld or M&A project by checking one out of four possible optionsin the reporting form: (1) new entry Green�eld project, (2) new entry M&Aproject, (3) already existing a¢ liate (the same a¢ liate has been reported in thelast year), or (4) �rst time satisfying the reporting requirements (the a¢ liateexisted last year but has not been reported). The �rst two options are the newFDI entrants; the focus of our study.4 This is a notable piece of informationthat allows us to identify the mode of investment and moreover at the entry.Furthermore, we distinguish between vertical and horizontal FDI based uponinformation on the economic sector of the a¢ liate. We consider a project as ahorizontal FDI if both the parent �rm and its a¢ liate abroad are operating inthe same sector and as a vertical (non-horizontal) FDI if the parent �rm andits a¢ liate operate in two di¤erent sectors.5
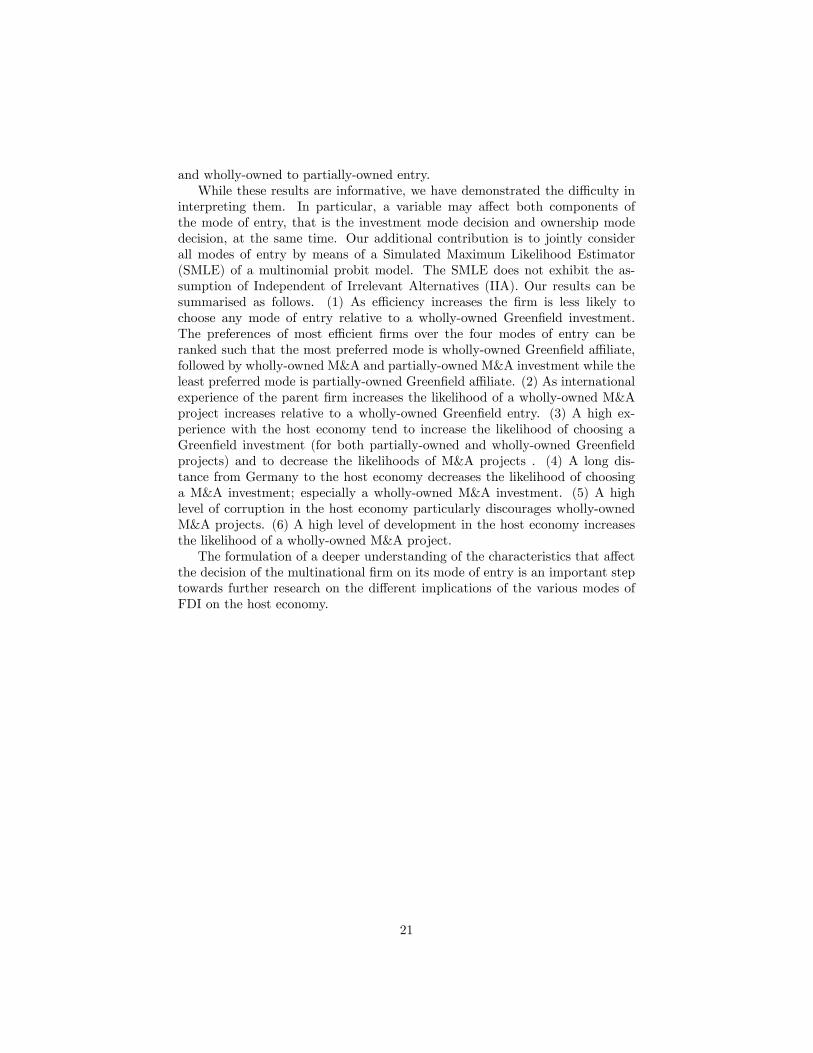
The data covers the years 2005, 2006 and 2007. The �rst panel in �gure(1) displays the total number of new outbound FDI projects (2508 a¢ liates)in our sample according to the mode of investment. About 61 percent of thenew projects enter the foreign economy as M&A projects. This �gure is similarfor horizontal as well as vertical FDI. The second panel of �gure (1) presentsnew FDI projects according to the mode of ownership. About 74.5 percent ofthe �rms enter the host economy in the form of a wholly-owned a¢ liate. Theproportion of wholly-owned a¢ liates is almost identical in both cases: horizontaland vertical FDI. The last panel of �gure (1) shows detailed �gures for every yearin our sample according to the four possible modes of entry. In all consideredthree years, the most frequently selected mode of entry is wholly-owned M&A.
3The model is implemented by the Geweke-Hajivassiliou-Keane algorithm. The reader isreferred to Train (2009) chapter (5) for a detailed description of this procedure. The estimatedvalues of covariances can re�ect any substitution pattern between the modes of entry avoidingthe IIA assumption.
4These con�dential data are stored at the research center of the Deutsche Bundesbank andnamed the MiDi dataset. See Lipponer (2008) for further details on the MiDi dataset and thereporting requirements.
5We exclude from both classi�cations a¢ liates that are reported as �holding��rms. Thisreduces the sample size.
8
Figure 1: Outbound FDI according to the mode of entry
9
Table 1: De�nitions and sources of varibalesVariable De�nition Source
ma dummy that takes the value 1 if Deutsche
the investment takes the form of M&A Bundesbank
and zero if the investment is a Green�eld project
partial dummy that takes the value 1 if the a¢ liate is Deutsche
partially-owned and zero if the is wholly-owned Bundesbank
y count varibales that takes the value 1 or 2 or 3 or 4 Deutsche
denoting the mode of entry; y = 1 for W-Gr, y = 2 for Bundesbank
W-MA, y = 3 for P-Gr, and y = 4 for P-MA.ym dummy that is equal to 1 for the chosen mode Deutsche
and zero for the other three not selected modes; see relation (2) Bundesbank
efficiency ratio of total revenue to total balance sheet Deutsche
Bundesbank
international logarithm of the number of countries Deutsche
experience in which the parent �rm operates Bundesbank
host economy experience logarithm of the number of a¢ liates already Deutsche
operating in the host economy Bundesbank
GDP per capita logarithm of gross domestic product per capita WDI of the WB
based on PPP of the host economy
distance logarithm of the distance between Germany CEPII
and the host economy
corruption minus the logarithm of the Corruption Transparency
Perception Index. A high value indicates International
a high level of corruption
population logarithm of the total number of inhabitants WDI of the WB
in the host economy
rule of law rule of law index of the World Bank the WB
governance indicators. A high value indicates
a high quality of law
openness ratio of total trade (total imports plus total IFS of the IMF
exports) of the host economy to gross domestic
product of the host economy in current prices
economic freedom logarithm of the labour freedom component of the Heritage
Heritage index of economic freedom Foundation
market capitalisation ratio of market capitalisation of listed companies WDI of the WB
to gdp
export share ratio of exports to the host IMF Directions of
economy to total German exports Trade statistics
R&D=gdp ratio of government expenditure on research and UNESCO
development to gdp Statistics
10
The main message of �gure (1) is that there is no dominating mode of entryfor a speci�c year in our sample or for horizontal or vertical FDI. Table (1)summarises the de�nitions and the sources of the variables employed in ourstudy. As mentioned in section (3), the �rst two variables: ma and partial areto be explained by binary logit models. The third and the fourth variables, yand ym, are to be explained within the setup of the multinomial logit model(Hausman test) and the SML multinomial probit model, respectively. The restof the variables listed in table (1) are explanatory variables chosen based onthe survey in section 2. E¢ ciency is de�ned as the ratio of total revenue tototal balance sheet, and serves as our proxy for the e¢ ciency of the parent �rm.It is expected to have a negative e¤ect on ma and negative e¤ect on partial.Further, we distinguish between international experience of the parent �rm andexperience that is speci�c to the host economy. International experience ismeasured by the logarithm of the number of countries in which the parent �rmoperates. Experience with the host economy is de�ned as the logarithm of thenumber of a¢ liates belonging to the parent �rm that are already operating inthe host economy. While high experience in general reduces the value of a localpartner, high international experience may enable the �rm to be more informedabout international potential targets to be acquired and to be more e¤ective inmanaging M&A challenges in conjunction with incorporating the new target inthe group.GDP per capita measures the level of development in the host economy. It is
expected to have a positive e¤ect onma (Nocke and Yeaple; 2008) and a negativee¤ect on partial. The variable Distance is the logarithm of the distance betweenGermany and the host economy. A long distance between the host economy andthe country of parent �rm is expected to have a negative e¤ect on ma and apositive e¤ect on partial; Ra¤ et al. (2009) and Mugele and Schnitzer (2008).Distance can be interpreted as a proxy for cultural di¤erences and informationabout the host economy. Corruption is captured by the Corruption PerceptionIndex of Transparency International to capture the corruption level in the hosteconomy. The index is rede�ned such that an increase in the index implies anincrease in the level of corruption. Population measures the size of the hosteconomy. Rule of law is the rule of law index published by the World Bank.A high value of this index indicates a high quality of law. Openness is theratio of total trade (imports + exports) to GDP. It captures the openness ofthe economy to international trade. Economic freedom is the Heritage index ofeconomic freedom. It re�ects the openness of the host economy to internationalinvestment; Miller and Holmes (2009). Market capitalisation is the ratio ofmarket capitalisation of listed companies to GDP, and is regarded as a proxyfor �nancial deepening and the development of the market for equity in the hosteconomy; Di Giovanni (2005). Export share is de�ned as the share of exports tothe host economy in total German exports. It captures bilateral trade relationsbetween Germany and the host economy and potential comparative advantageopportunities. All level variables are expressed in natural logarithm.Additionally, we include the variable R&D=gdp, that is the ratio of govern-
ment expenditure on research and development (R&D) to the GDP of the host
11
economy. In the robustness analysis, to account for a potential role of di¤erencesin the nature of R&D across industries, we construct industry dummies basedon the R&D intensity index of German FDI economic sectors.6 This index iscomputed based on information on the ratio of R&D expenditure to the grossvalue added by industry, and published by the "Stifterverband für die DeutscheWissenschaft" (the Association for the Promotion of Science) in Germany. Theindex has a minimum of 0.03% and a maximum of 18.32%, but exhibits a clearpattern of cluttering enabling us to categorise three groups of economic sectors:1) low R&D sectors (a value of the index < 1.6; about 45% of the classi�ed sec-tors), 2) high R&D sectors (value above 10; about 30% of classi�ed sectors), and3) moderate R&D sectors (values clustered around 5). Since the data containa¢ liates in the wholesale trade sector (not classi�ed), we add also a wholesale-trade dummy capturing this sector. Also, we add a dummy for holding �rmssince their "real" economic sectors are not observable.Table (2) presents summary statistics including means and standard devia-
tions of the included explanatory variables according to the four modes of entry.For example, average e¢ ciency is the highest for the wholly-owned Green�eldmode of entry. International experience is reported to have the highest aver-age for the group of wholly-owned M&A investments. Table (3) presents thecoe¢ cients of correlation between the explanatory variables. The coe¢ cientof correlation between international experience and host economy experience is0.35. The correlation between the corruption index and the rule of law indexis positive and rather high (0.87). Also, the corruption index is negatively cor-related with the share of R&D expenditure in GDP. Notably, the coe¢ cient ofcorrelation between openness and the export share is rather small.For a further insight, we employ the two-sample Kolmogorov-Smirnov non-
parametric test to check whether the distribution functions of our main variablesof interest are statistically di¤erent depending on the mode of investment or themode of ownership. The results of the tests are reported in table (4). Forinstance, the �rst entry in table (4) is the result of the combined tests that:1) E¢ ciency for the group of M&A investments contains smaller values thane¢ ciency of Green�eld investments. 2) E¢ ciency for the group of M&A in-vestments contains larger values than e¢ ciency of Green�eld investments. Thecombined signi�cant statistic of 0.056 suggests that most e¢ cient �rms preferGreen�eld to M&A entries.7 The results of the tests regarding the corrup-tion level for example indicate that a high level of corruption discourages M&Aprojects (as compared to Green�eld investments) and shifts ownership prefer-ences towards partially-owned a¢ liates. Overall, the results reported in table (4)suggest signi�cant di¤erences in the distribution functions of e¢ ciency, interna-tional experience, host economy experience, distance and corruption dependingon the mode of investment or the mode of ownership. To examine how thesecharacteristics a¤ect the FDI mode of entry decision, we present in the next
6 Ideally, �rm-speci�c R&D information can be used in the analysis. Alas, the data do notcontain information on R&D expenditure at the �rm level.
7See for example Conover (1999) for a detailed description of the Kolmogorov-Smirnovtest.
12
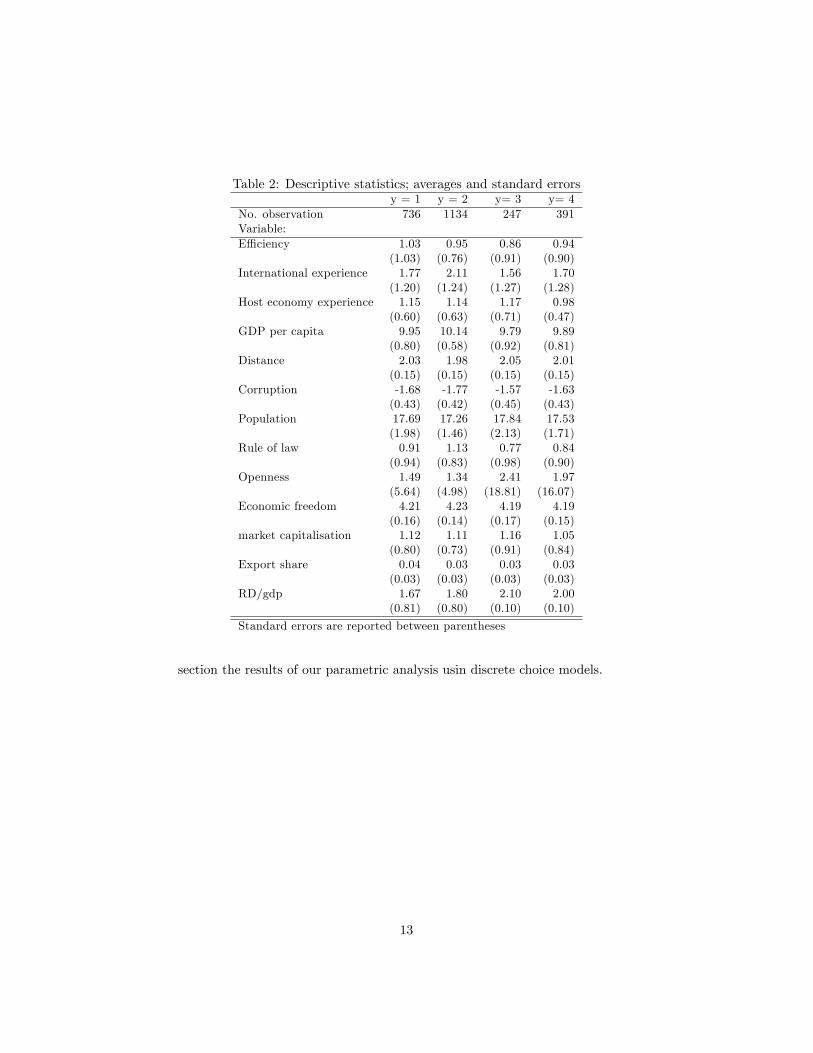
Table 2: Descriptive statistics; averages and standard errorsy = 1 y = 2 y= 3 y= 4
No. observation 736 1134 247 391Variable:E¢ ciency 1.03 0.95 0.86 0.94
(1.03) (0.76) (0.91) (0.90)International experience 1.77 2.11 1.56 1.70
(1.20) (1.24) (1.27) (1.28)Host economy experience 1.15 1.14 1.17 0.98
(0.60) (0.63) (0.71) (0.47)GDP per capita 9.95 10.14 9.79 9.89
(0.80) (0.58) (0.92) (0.81)Distance 2.03 1.98 2.05 2.01
(0.15) (0.15) (0.15) (0.15)Corruption -1.68 -1.77 -1.57 -1.63
(0.43) (0.42) (0.45) (0.43)Population 17.69 17.26 17.84 17.53
(1.98) (1.46) (2.13) (1.71)Rule of law 0.91 1.13 0.77 0.84
(0.94) (0.83) (0.98) (0.90)Openness 1.49 1.34 2.41 1.97
(5.64) (4.98) (18.81) (16.07)Economic freedom 4.21 4.23 4.19 4.19
(0.16) (0.14) (0.17) (0.15)market capitalisation 1.12 1.11 1.16 1.05
(0.80) (0.73) (0.91) (0.84)Export share 0.04 0.03 0.03 0.03
(0.03) (0.03) (0.03) (0.03)RD/gdp 1.67 1.80 2.10 2.00
(0.81) (0.80) (0.10) (0.10)
Standard errors are reported between parentheses
section the results of our parametric analysis usin discrete choice models.
13
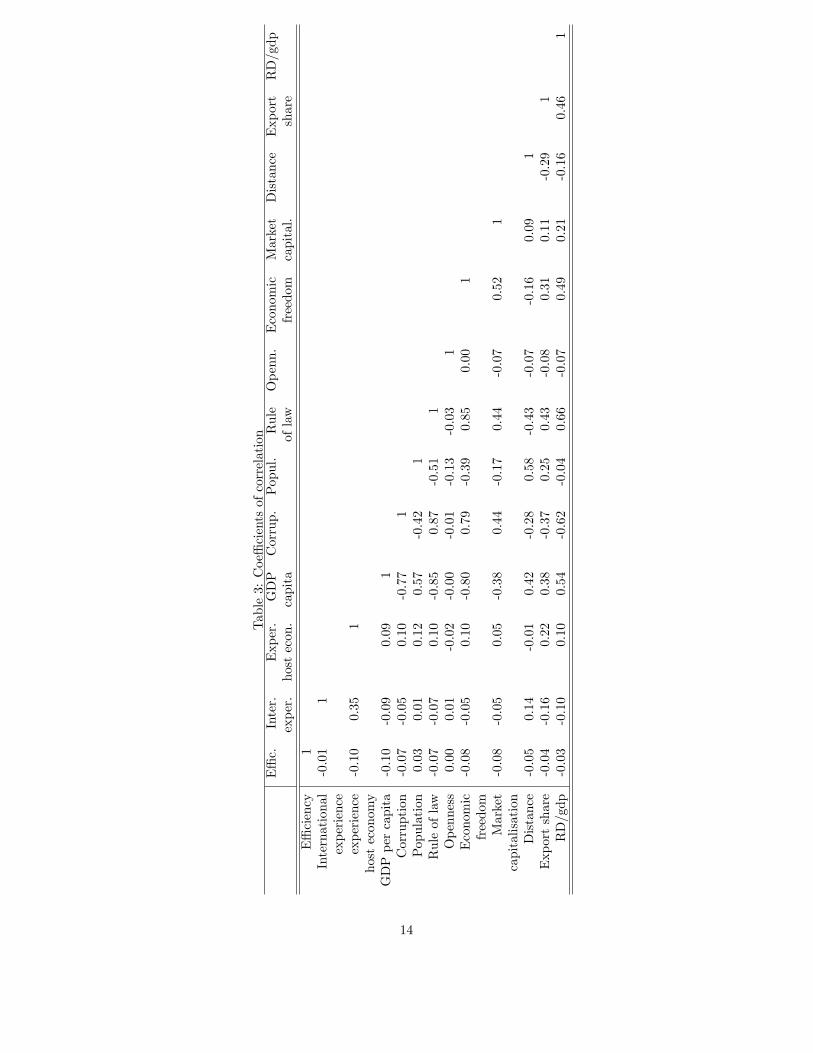
Table3:Coe¢cientsofcorrelation
E¢c.
Inter.
Exper.
GDP
Corrup.
Popul.
Rule
Openn.
Economic
Market
Distance
Export
RD/gdp
exper.hostecon.capita
oflaw
freedom
capital.
share
E¢ciency
1International
-0.01
1experience
experience
-0.10
0.35
1hosteconomy
GDPpercapita
-0.10
-0.09
0.09
1Corruption
-0.07
-0.05
0.10
-0.77
1Population
0.03
0.01
0.12
0.57
-0.42
1Ruleoflaw
-0.07
-0.07
0.10
-0.85
0.87
-0.51
1Openness
0.00
0.01
-0.02
-0.00
-0.01
-0.13
-0.03
1Economic
-0.08
-0.05
0.10
-0.80
0.79
-0.39
0.85
0.00
1freedom
Market
-0.08
-0.05
0.05
-0.38
0.44
-0.17
0.44
-0.07
0.52
1capitalisation
Distance
-0.05
0.14
-0.01
0.42
-0.28
0.58
-0.43
-0.07
-0.16
0.09
1Exportshare
-0.04
-0.16
0.22
0.38
-0.37
0.25
0.43
-0.08
0.31
0.11
-0.29
1RD/gdp
-0.03
-0.10
0.10
0.54
-0.62
-0.04
0.66
-0.07
0.49
0.21
-0.16
0.46
1
14
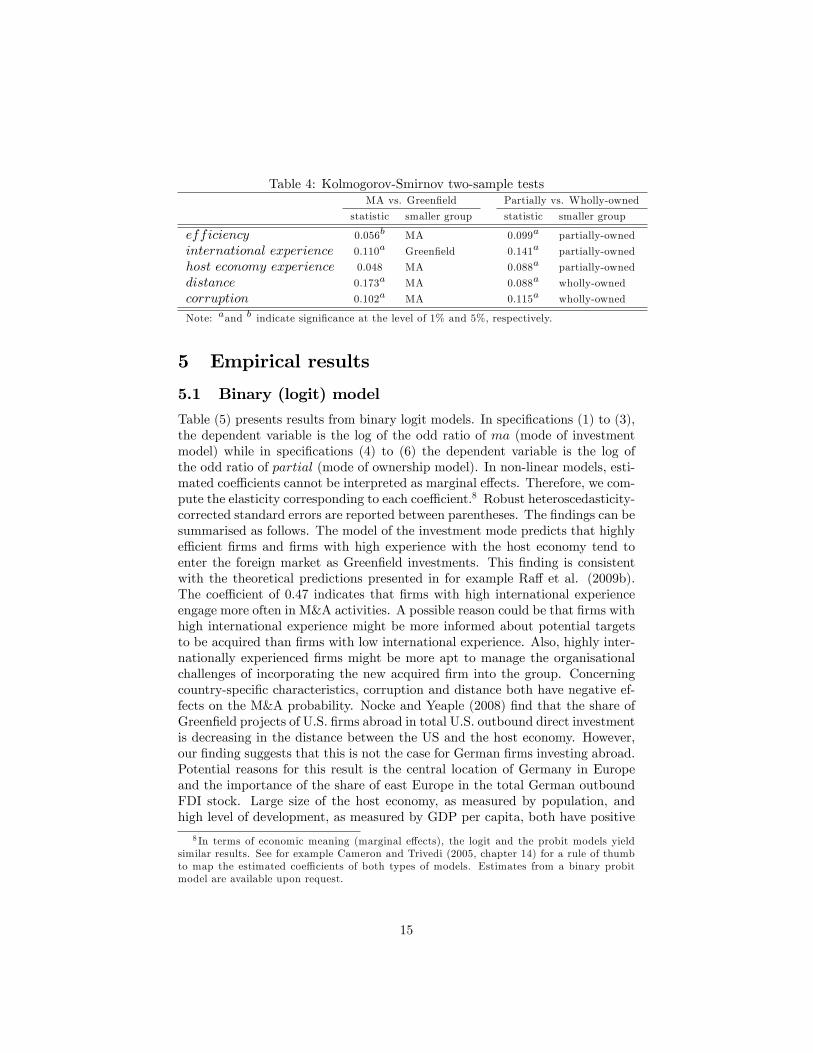
Table 4: Kolmogorov-Smirnov two-sample testsMA vs. Green�eld Partially vs. Wholly-owned
statistic smaller group statistic smaller group
efficiency 0.056b MA 0.099a partially-owned
international experience 0.110a Green�eld 0.141a partially-owned
host economy experience 0.048 MA 0.088a partially-owned
distance 0.173a MA 0.088a wholly-owned
corruption 0.102a MA 0.115a wholly-owned
Note: aand b indicate signi�cance at the level of 1% and 5%, respectively.
5 Empirical results
5.1 Binary (logit) model
Table (5) presents results from binary logit models. In speci�cations (1) to (3),the dependent variable is the log of the odd ratio of ma (mode of investmentmodel) while in speci�cations (4) to (6) the dependent variable is the log ofthe odd ratio of partial (mode of ownership model). In non-linear models, esti-mated coe¢ cients cannot be interpreted as marginal e¤ects. Therefore, we com-pute the elasticity corresponding to each coe¢ cient.8 Robust heteroscedasticity-corrected standard errors are reported between parentheses. The �ndings can besummarised as follows. The model of the investment mode predicts that highlye¢ cient �rms and �rms with high experience with the host economy tend toenter the foreign market as Green�eld investments. This �nding is consistentwith the theoretical predictions presented in for example Ra¤ et al. (2009b).The coe¢ cient of 0.47 indicates that �rms with high international experienceengage more often in M&A activities. A possible reason could be that �rms withhigh international experience might be more informed about potential targetsto be acquired than �rms with low international experience. Also, highly inter-nationally experienced �rms might be more apt to manage the organisationalchallenges of incorporating the new acquired �rm into the group. Concerningcountry-speci�c characteristics, corruption and distance both have negative ef-fects on the M&A probability. Nocke and Yeaple (2008) �nd that the share ofGreen�eld projects of U.S. �rms abroad in total U.S. outbound direct investmentis decreasing in the distance between the US and the host economy. However,our �nding suggests that this is not the case for German �rms investing abroad.Potential reasons for this result is the central location of Germany in Europeand the importance of the share of east Europe in the total German outboundFDI stock. Large size of the host economy, as measured by population, andhigh level of development, as measured by GDP per capita, both have positive
8 In terms of economic meaning (marginal e¤ects), the logit and the probit models yieldsimilar results. See for example Cameron and Trivedi (2005, chapter 14) for a rule of thumbto map the estimated coe¢ cients of both types of models. Estimates from a binary probitmodel are available upon request.
15
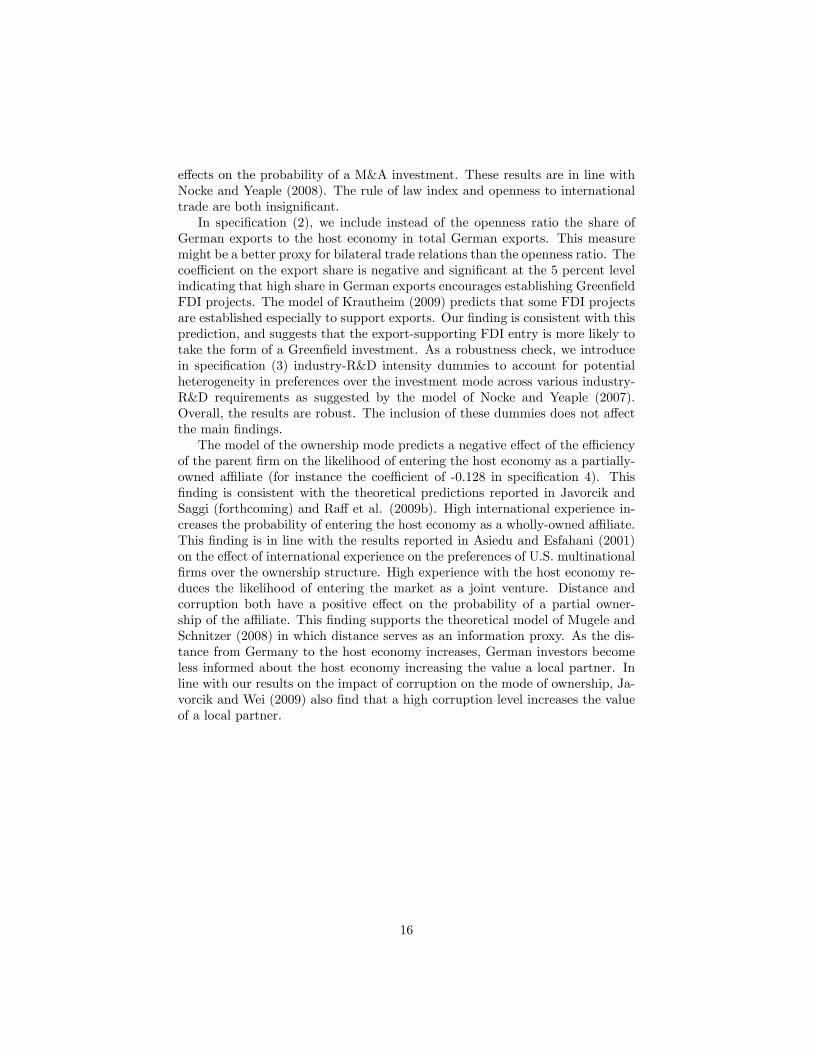
e¤ects on the probability of a M&A investment. These results are in line withNocke and Yeaple (2008). The rule of law index and openness to internationaltrade are both insigni�cant.In speci�cation (2), we include instead of the openness ratio the share of
German exports to the host economy in total German exports. This measuremight be a better proxy for bilateral trade relations than the openness ratio. Thecoe¢ cient on the export share is negative and signi�cant at the 5 percent levelindicating that high share in German exports encourages establishing Green�eldFDI projects. The model of Krautheim (2009) predicts that some FDI projectsare established especially to support exports. Our �nding is consistent with thisprediction, and suggests that the export-supporting FDI entry is more likely totake the form of a Green�eld investment. As a robustness check, we introducein speci�cation (3) industry-R&D intensity dummies to account for potentialheterogeneity in preferences over the investment mode across various industry-R&D requirements as suggested by the model of Nocke and Yeaple (2007).Overall, the results are robust. The inclusion of these dummies does not a¤ectthe main �ndings.The model of the ownership mode predicts a negative e¤ect of the e¢ ciency
of the parent �rm on the likelihood of entering the host economy as a partially-owned a¢ liate (for instance the coe¢ cient of -0.128 in speci�cation 4). This�nding is consistent with the theoretical predictions reported in Javorcik andSaggi (forthcoming) and Ra¤ et al. (2009b). High international experience in-creases the probability of entering the host economy as a wholly-owned a¢ liate.This �nding is in line with the results reported in Asiedu and Esfahani (2001)on the e¤ect of international experience on the preferences of U.S. multinational�rms over the ownership structure. High experience with the host economy re-duces the likelihood of entering the market as a joint venture. Distance andcorruption both have a positive e¤ect on the probability of a partial owner-ship of the a¢ liate. This �nding supports the theoretical model of Mugele andSchnitzer (2008) in which distance serves as an information proxy. As the dis-tance from Germany to the host economy increases, German investors becomeless informed about the host economy increasing the value a local partner. Inline with our results on the impact of corruption on the mode of ownership, Ja-vorcik and Wei (2009) also �nd that a high corruption level increases the valueof a local partner.
16
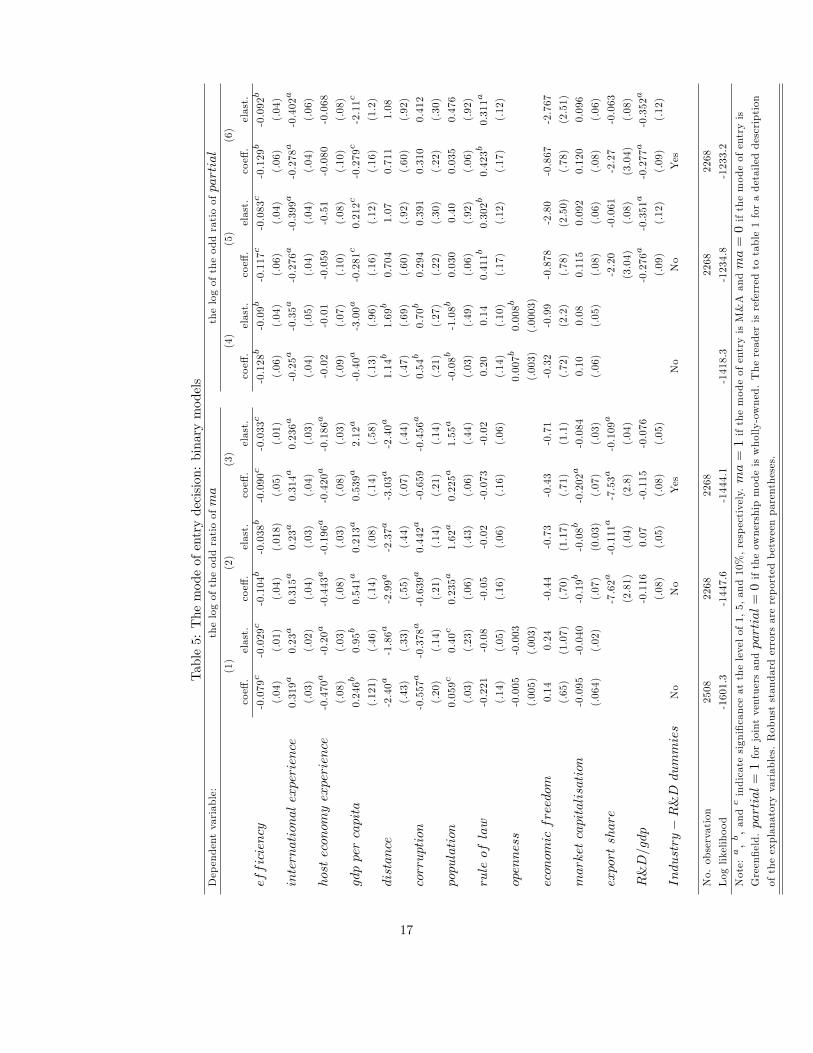
Table5:Themodeofentrydecision:binarymodels
Dependentvariable:
thelogoftheoddratioofma
thelogoftheoddratioofpartial
(1)
(2)
(3)
(4)
(5)
(6)
coe¤.
elast.
coe¤.
elast.
coe¤.
elast.
coe¤.
elast.
coe¤.
elast.
coe¤.
elast.
efficiency
-0.079c
-0.029c
-0.104b
-0.038b
-0.090c
-0.033c
-0.128b
-0.09b
-0.117c
-0.083c
-0.129b
-0.092b
(.04)
(.01)
(.04)
(.018)
(.05)
(.01)
(.06)
(.04)
(.06)
(.04)
(.06)
(.04)
internationalexperience
0.319a
0.23a
0.315a
0.23a
0.314a
0.236a
-0.25a
-0.35a
-0.276a
-0.399a
-0.278a
-0.402a
(.03)
(.02)
(.04)
(.03)
(.04)
(.03)
(.04)
(.05)
(.04)
(.04)
(.04)
(.06)
hosteconomyexperience
-0.470a
-0.20a
-0.443a
-0.196a
-0.420a
-0.186a
-0.02
-0.01
-0.059
-0.51
-0.080
-0.068
(.08)
(.03)
(.08)
(.03)
(.08)
(.03)
(.09)
(.07)
(.10)
(.08)
(.10)
(.08)
gdppercapita
0.246b
0.95b
0.541a
0.213a
0.539a
2.12a
-0.40a
-3.00a
-0.281c
0.212c
-0.279c
-2.11c
(.121)
(.46)
(.14)
(.08)
(.14)
(.58)
(.13)
(.96)
(.16)
(.12)
(.16)
(1.2)
distance
-2.40a
-1.86a
-2.99a
-2.37a
-3.03a
-2.40a
1.14b
1.69b
0.704
1.07
0.711
1.08
(.43)
(.33)
(.55)
(.44)
(.07)
(.44)
(.47)
(.69)
(.60)
(.92)
(.60)
(.92)
corruption
-0.557a
-0.378a
-0.639a
0.442a
-0.659
-0.456a
0.54b
0.70b
0.294
0.391
0.310
0.412
(.20)
(.14)
(.21)
(.14)
(.21)
(.14)
(.21)
(.27)
(.22)
(.30)
(.22)
(.30)
population
0.059c
0.40c
0.235a
1.62a
0.225a
1.55a
-0.08b
-1.08b
0.030
0.40
0.035
0.476
(.03)
(.23)
(.06)
(.43)
(.06)
(.44)
(.03)
(.49)
(.06)
(.92)
(.06)
(.92)
ruleoflaw
-0.221
-0.08
-0.05
-0.02
-0.073
-0.02
0.20
0.14
0.411b
0.302b
0.423b
0.311a
(.14)
(.05)
(.16)
(.06)
(.16)
(.06)
(.14)
(.10)
(.17)
(.12)
(.17)
(.12)
openness
-0.005
-0.003
0.007b
0.008b
(.005)
(.003)
(.003)
(.0003)
economicfreedom
0.14
0.24
-0.44
-0.73
-0.43
-0.71
-0.32
-0.99
-0.878
-2.80
-0.867
-2.767
(.65)
(1.07)
(.70)
(1.17)
(.71)
(1.1)
(.72)
(2.2)
(.78)
(2.50)
(.78)
(2.51)
marketcapitalisation
-0.095
-0.040
-0.19b
-0.08b
-0.202a
-0.084
0.10
0.08
0.115
0.092
0.120
0.096
(.064)
(.02)
(.07)
(0.03)
(.07)
(.03)
(.06)
(.05)
(.08)
(.06)
(.08)
(.06)
exportshare
-7.62a
-0.111a
-7.53a
-0.109a
-2.20
-0.061
-2.27
-0.063
(2.81)
(.04)
(2.8)
(.04)
(3.04)
(.08)
(3.04)
(.08)
R&D=gdp
-0.116
0.07
-0.115
-0.076
-0.276a
-0.351a
-0.277a
-0.352a
(.08)
(.05)
(.08)
(.05)
(.09)
(.12)
(.09)
(.12)
Industry�R&Ddummies
No
No
Yes
No
No
Yes
No.observation
2508
2268
2268
2268
2268
Loglikelihood
-1601.3
-1447.6
-1444.1
-1418.3
-1234.8
-1233.2
Note:a,b,andcindicatesigni�canceatthelevelof1,5,and10%,respectively.ma=1ifthemodeofentryisM&Aandma=0ifthemodeofentryis
Green�eld.partial=1forjointventuersandpartial=0iftheownershipmodeiswholly-owned.Thereaderisreferredtotable1foradetaileddescription
oftheexplanatoryvariables.Robuststandarderrorsarereportedbetweenparentheses.
17
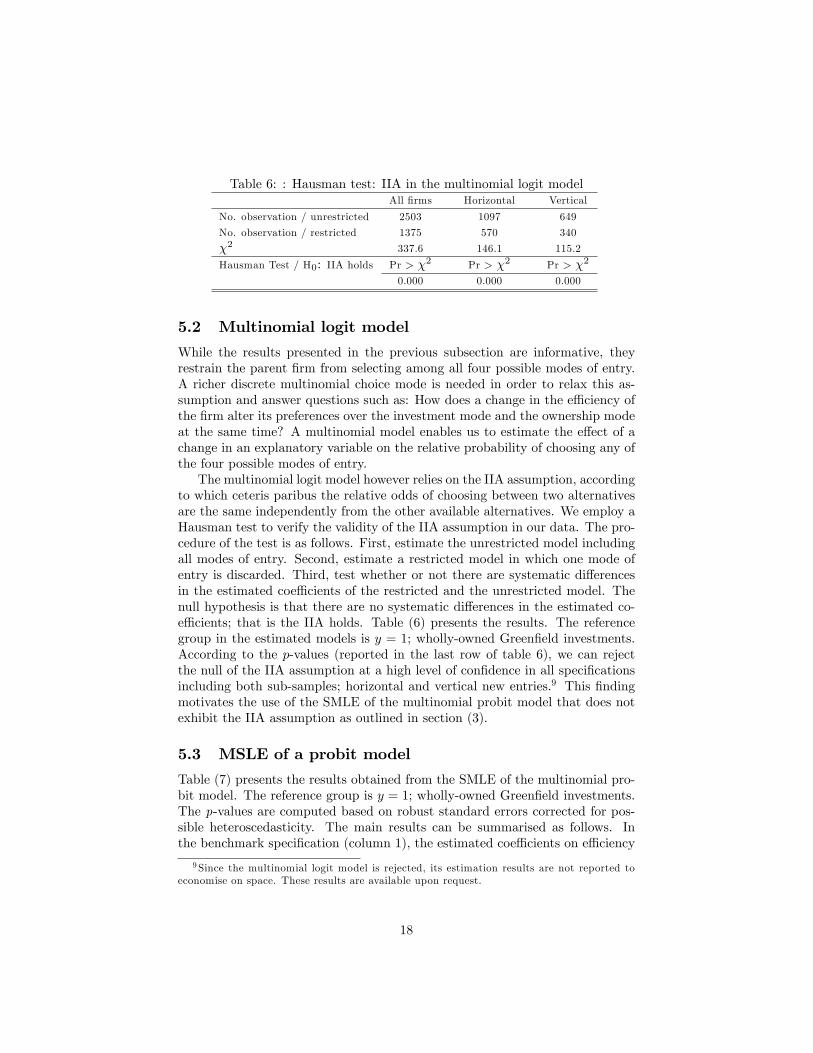
Table 6: : Hausman test: IIA in the multinomial logit modelAll �rms Horizontal Vertical
No. observation / unrestricted 2503 1097 649
No. observation / restricted 1375 570 340
�2 337.6 146.1 115.2
Hausman Test / H0: IIA holds Pr > �2 Pr > �2 Pr > �2
0.000 0.000 0.000
5.2 Multinomial logit model
While the results presented in the previous subsection are informative, theyrestrain the parent �rm from selecting among all four possible modes of entry.A richer discrete multinomial choice mode is needed in order to relax this as-sumption and answer questions such as: How does a change in the e¢ ciency ofthe �rm alter its preferences over the investment mode and the ownership modeat the same time? A multinomial model enables us to estimate the e¤ect of achange in an explanatory variable on the relative probability of choosing any ofthe four possible modes of entry.The multinomial logit model however relies on the IIA assumption, according
to which ceteris paribus the relative odds of choosing between two alternativesare the same independently from the other available alternatives. We employ aHausman test to verify the validity of the IIA assumption in our data. The pro-cedure of the test is as follows. First, estimate the unrestricted model includingall modes of entry. Second, estimate a restricted model in which one mode ofentry is discarded. Third, test whether or not there are systematic di¤erencesin the estimated coe¢ cients of the restricted and the unrestricted model. Thenull hypothesis is that there are no systematic di¤erences in the estimated co-e¢ cients; that is the IIA holds. Table (6) presents the results. The referencegroup in the estimated models is y = 1; wholly-owned Green�eld investments.According to the p-values (reported in the last row of table 6), we can rejectthe null of the IIA assumption at a high level of con�dence in all speci�cationsincluding both sub-samples; horizontal and vertical new entries.9 This �ndingmotivates the use of the SMLE of the multinomial probit model that does notexhibit the IIA assumption as outlined in section (3).
5.3 MSLE of a probit model
Table (7) presents the results obtained from the SMLE of the multinomial pro-bit model. The reference group is y = 1; wholly-owned Green�eld investments.The p-values are computed based on robust standard errors corrected for pos-sible heteroscedasticity. The main results can be summarised as follows. Inthe benchmark speci�cation (column 1), the estimated coe¢ cients on e¢ ciency
9Since the multinomial logit model is rejected, its estimation results are not reported toeconomise on space. These results are available upon request.
18
are negative for all three modes of entry relative to the reference group. Thissuggests that as e¢ ciency increases the �rm is less likely to choose any modeof entry relative to a wholly-owned Green�eld investment. We could not drawsuch a conclusion from the binary model. The estimates of the binary modelpresented in the subsection (5.1) suggest that as e¢ ciency increases the like-lihood of choosing a wholly-owned a¢ liate increases regardless of the mode ofinvestment; whether it is a Green�eld or M&A. The results obtained from theSMLE show that only the likelihood of a wholly-owned Green�eld investmentincreases but not that for a wholly-owned M&A investment.The estimated e¤ect of the level of international experience of the parent
�rm obtained from the SMLE is broadly consistent with the results obtainedfrom the binary model. The coe¢ cient of 0.287 in column (1) indicates thatas international experience increases the likelihood of a wholly-owned M&Aproject increases relative to the reference group. However, the likelihood of apartially-owned Green�eld investment decreases relative to the reference groupas indicted by the coe¢ cient of -0.148. Succinctly, �rms with high internationalexperience tend to engage more in M&A activities than in Green�eld projects.Still, �rms with high international experience prefer wholly-owned a¢ liates topartially-owned a¢ liates. A high level of international experience seems toreduce the value of a local partner. Speci�c experience with the host economyis estimated to have a negative sign for y = 2 relative to y = 1 (-0.291) and fory = 4 relative to y = 1 (-0.416). This �nding suggests that familiarity with thehost economy increases the likelihood of choosing a Green�eld project regardlessof the ownership structure.Concerning the e¤ects of country-characteristics on the FDI mode of en-
try, we �nd that particularly three characteristics have signi�cant explanatorypower, namely, distance from Germany, the corruption index, and the level ofdevelopment in the host economy as measured by GDP per capita. The resultsindicate that as the distance from Germany increases the preferences of theparent �rm shift towards Green�eld investments while a wholly-owned M&Aproject becomes the least preferred mode. As the corruption level increases thelikelihood of a wholly-owned M&A investment decreases relative to a wholly-owned Green�eld investment. The coe¢ cient on the e¤ect of corruption on theprobability of a partially-owned Green�eld project (0.36) is signi�cant only atthe 15 percent level. However, by signi�cantly a¤ecting at least one mode of en-try, a variable can indirectly a¤ect the probabilities corresponding to the othermodes. The level of development in the host economy has a positive e¤ect onthe likelihood of entering the foreign economy as a wholly-owned M&A a¢ liate.The SMLE add to the results of the binary models by indicating that espe-cially partially-owned Green�eld entries are less likely to be selected in highlydeveloped economies.The estimation results reported in column (2) indicate that a high share
in German exports reduces the likelihood of selecting a wholly-owned M&Aas well as a partially-owned M&A investment as a mode of entry relative toa wholly-owned Green�eld investment. Additionally, the results are broadlyrobust for the inclusion of the R&D industry dummies (column 3). As a further
19
robustness analysis, we present separate results for Horizontal and vertical FDIa¢ liates in columns (4) to (7). However, since the SMLE is rather demandingin terms of degrees of freedom and power issues, the substantial shrink in thesub-sample size complicates convergence and signi�cance. One notable resultsis that corruption seems to have asymmetric e¤ects of on FDI mode of entrydecision. In particular, vertical entries in the form of partially-owned Green�eldinvestments seem to be less sensitive to a high level of corruption in the hosteconomy as compared to the results in the case of horizontal entries or thewhole sample. Apart from the e¤ects of corruption, overall, the main �ndings,particularly those for the �rm-speci�c characteristics, seem to remain valid.Hence, based on the estimated coe¢ cients in tables (7), we can interpret
the e¤ects of the considered characteristics on a mode of entry relative to thereference group. However, although the likelihood of a certain mode of entrymay increase relative to the reference group it may at the same time decreasein absolute terms. Further, based upon these estimates, we cannot infer thequalitative e¤ects of a certain variable on selecting the mode of entry of thereference group. Therefore, to obtain more insights into the impacts on thelikelihood of a wholly-owned Green�eld investment and the other three modes,we compute elasticities corresponding to each variable and for all modes of en-try. These elasticities can be recovered as follows. First, based on our estimatesand the observed values of the explanatory variables, we predict the probabilityof choosing a mode of entry. Second, we re-predict the probability of choosinga mode of entry after increasing the value of a single explanatory variable by10 percent keeping all other variables �xed. Third, we compare both predictedprobabilities before and after the change in the control. Thus, the reported elas-ticity of a certain variable is the percentage change in the probability due to a 10percent increase in that variable while keeping all other variables unchanged.10
We are particularly interested in the sign of the e¤ect. Table (8) presents theseelasticities. For instance, a 10% increase in the e¢ ciency measure of the parent�rm (for example from 35% to 38.5%) increases the probability of selecting awholly-owned Green�eld entry by 1.13 percent (from 30% to 30.4%).
6 Conclusion
We have conducted an empirical investigation on the determinants of the modeof entry decision of multinational �rms using a novel �rm-level dataset on Ger-man outbound FDI and focusing on the decision of the �rm at the entry in theforeign market. This study is the �rst to analyse the German FDI dataset forthis purpose. Our empirical work is guided by recent theoretical contributionson the decision on the mode of entry of multinational �rms. Broadly, our resultsobtained from the binary choice models have con�rmed various existing theo-retical predictions on the determinants of the mode of investment (M&A vs.Green�eld investment) and the mode of ownership (wholly-owned vs. partially-owned). For instance, the most e¢ cient �rms tend to prefer Green�eld to M&A
10See Cameron and Trivedi (2005).
20
and wholly-owned to partially-owned entry.While these results are informative, we have demonstrated the di¢ culty in
interpreting them. In particular, a variable may a¤ect both components ofthe mode of entry, that is the investment mode decision and ownership modedecision, at the same time. Our additional contribution is to jointly considerall modes of entry by means of a Simulated Maximum Likelihood Estimator(SMLE) of a multinomial probit model. The SMLE does not exhibit the as-sumption of Independent of Irrelevant Alternatives (IIA). Our results can besummarised as follows. (1) As e¢ ciency increases the �rm is less likely tochoose any mode of entry relative to a wholly-owned Green�eld investment.The preferences of most e¢ cient �rms over the four modes of entry can beranked such that the most preferred mode is wholly-owned Green�eld a¢ liate,followed by wholly-owned M&A and partially-owned M&A investment while theleast preferred mode is partially-owned Green�eld a¢ liate. (2) As internationalexperience of the parent �rm increases the likelihood of a wholly-owned M&Aproject increases relative to a wholly-owned Green�eld entry. (3) A high ex-perience with the host economy tend to increase the likelihood of choosing aGreen�eld investment (for both partially-owned and wholly-owned Green�eldprojects) and to decrease the likelihoods of M&A projects . (4) A long dis-tance from Germany to the host economy decreases the likelihood of choosinga M&A investment; especially a wholly-owned M&A investment. (5) A highlevel of corruption in the host economy particularly discourages wholly-ownedM&A projects. (6) A high level of development in the host economy increasesthe likelihood of a wholly-owned M&A project.The formulation of a deeper understanding of the characteristics that a¤ect
the decision of the multinational �rm on its mode of entry is an important steptowards further research on the di¤erent implications of the various modes ofFDI on the host economy.
21
References
[1] Andersson, T. and Svensson, R. (1994). �Entry modes for foreign directinvestment determined by the composition of �rm-speci�c skills�, Scandi-navian Journal of Economics, vol. 96, pp. 551-60.
[2] Asiedu, E., and Esfahani H. S. (2001). �Ownership structure in foreigndirect investment projects�, Review of Economics and Statistics, vol. 83(4), pp. 647-662.
[3] Balsvik, R. and Haller, S. (forthcoming). �Picking "lemons or cherries"?Domestic and foreign acquisitions in Norwegian manufacturing, Scandina-vian Journal of Economics.
[4] Balsvik, R. and Haller, S. (2007). �Foreign �rms and host-country produc-tivity: does the mode of entry matter?�, NHH, mimeo.
[5] Bjorvatn, H. (2004). �Economic integration and the pro�tability of cross-border mergers and acquisitions�, Journal of International Economics, vol.48, pp. 1211-1226.
[6] Cameron, C. and Trivedi, P. (2005). Microeconometrics: Methods and Ap-plications, Cambridge University Press.
[7] Coeurdacier, N., Roberto, D,. and Aviat, A. (2009). �Cross-border mergersand acquisitions and European integration�, Economic Policy, vol. 24 (57),pp. 55-106.
[8] Conover, W. J. (1999). Practical Nonparametric Statistics. 3ed Edition.Wiley, New York.
[9] Desai, Foley, F C. and Hines, J Jr. (2004). �The costs of shared own-ership: Evidence from international joint ventures. Journal of FinancialEconomics, 73(2), 323-374.
[10] Di Giovanni, J. (2005). �What drives capital �ows? the case of cross-border M&A activity and �nancial deepening�, Journal of InternationalEconomics, vol. 65, pp. 127-149.
[11] Dimelis, S and Louri, H. (2002). �Foreign ownership and production e¢ -ciency: a quartile regression analysis�, Oxford Economic Papers, vol. 54,pp. 449-469.
[12] Egger, H., and Egger, P. (2008). �The trade and welfare e¤ects of Mergersin space�, mimeo.
[13] Faeth, I. (2009). �Determinants of foreign direct investment �a tale of ninetheoretical models�, Journal of Economic Surveys, vol. 23 (1), pp. 165-196.
22
[14] Görg, H. (2000). �Analysing foreign market entry: the choice betweenGreen�eld investment and acquisitions�, Journal of Economic Studies, vol.27 (3), pp. 165-181.
[15] Grossman, S. J. and Hart, O. (1986). The costs and bene�ts of ownership:A theory of vertical and lateral integration. Journal of Political Economy,94(4), 279-306.
[16] Gugler, K., Mueller, D., Yurtoglu, B. and Zulehner C. (2003). �The e¤ects ofmergers: an international comparison�, International Journal of IndustrialOrganisation, vol. 21, pp. 625-653.
[17] Haller, S. (2009). �The impact of multinational entry on domestic marketstructure and investment�, International Review of Economics and Finance,vol. 18, pp. 52-62.
[18] Head, K., and Rice, J. (2008). �FDI as an outcome of the market for cor-porate control Theory and evidence�, Journal of International Economics,vol. 74, pp. 2-20.
[19] Hebous, S., and Weichenrieder, A. (forthcoming). �Debt Financing andSharp Currency Depreciations: Wholly vs. Partially Owned MultinationalA¢ liates�, Review of World Economics.
[20] Hebous, S., Ruf, M., and Weichenrieder, A. (2010). �The E¤ect of taxa-tion on the location decision of multinational �rms: M&A vs. Green�eldInvestments�, Goethe University Frankfurt, mimeo.
[21] Helpman E. (2006). �Trade, FDI, and the organization of �rms�, Journal ofEconomic Literature, vol. 44, pp. 589-630.
[22] Hijzen, A., Görg, H., and Manchin, M. (2008). �Cross-border mergers andacquisitions and the role of trade costs�, European Economic Review, vol.52, pp. 849�866.
[23] Javorcik, B and Saggi, K. (forthcoming). �Technological asymmetry amongforeign investors and mode of entry�, Economic Inquiry,
[24] Javorcik, B and Spatareanu, M. (2008). �To share or not to share: Doeslocal participation matter for spillovers from foreign direct investment�,Journal of Development Economics, vol. 85, pp. 194-217.
[25] Javorcik, B. and Wei, S. (2009). �Corruption and cross-border investmentin emerging markets: �rm-level evidence�, Journal of International Moneyand Finance, vol. 28, pp. 605-624.
[26] Kesternich, I. and Schnitzer, M. (2009). �Who is afraid of political risk?Multinational �rms and their choice of capital structure�. Deutsche Bun-desbank Discussion Papers, No. 02/2009.
23
[27] Krautheim, S. (2009). �Export-supporting FDI�, Deutsche Bundesbank Dis-cussion Papers, No. 20/2009.
[28] Lipponer, A. (2008). Micro database direct Investment �MiDi. DeutscheBundesbank, Frankfurt am Main.
[29] Markusen, J. (2002). Multinational Firms and the Theory of InternationalTrade, Cambridge: MIT Press.
[30] Miller, T., and Holmes, K. (2009). 2009 Index of Economic Freedom, TheHeritage Foundation and Dow Jones & company, Inc, Washington and NewYork. Available online at: www.heritage.org/index
[31] Mugele, C., and Schnitzer, M. (2008). �Organization of multinational ac-tivities and ownership structure�, International Journal of Industrial Or-ganisation, vol. 26, pp. 1274-1289.
[32] Neary, P, J. (2007). �Cross-border mergers as instruments of comparativeadvantage�, Review of Economic Studies, vol. 74, pp. 1229-1257.
[33] Nocke, V. and Yeaple, S. (2008). �An assignment theory of foreign directinvestment �, Review of Economic Studies, vol. 75, pp. 529-557.
[34] Nocke, V. and Yeaple, S. (2007). �Cross-border mergers and acquisitionsversus Green�eld foreign direct investment: the role of �rm heterogeneity�,Journal of International Economics, vol. 72, (2), pp. 336-365.
[35] Ra¤, H., Ryan, M., and Stähler, A. (2007). �Firm productivity and theforeign-market entry decision�, Kiel University, mimeo.
[36] Ra¤, H., Ryan, M., and Stähler, A. (2009a). �Whole versus shared owner-ship of foreign a¢ liates�. International Journal of Industrial Organization,27(5), 572-581.
[37] Ra¤, H., Ryan, M., and Stähler, A. (2009b). �The choice of market en-try mode: Green�eld investment, M&A and joint venture�, InternationalReview of Economics and Finance, vol. 18, pp 3-10.
[38] Stifterverband für die Deutsche Wissenschaft (2008), FuE Datenreport,2008.
[39] Tekin-Koru, A. (2010). �Asymmetric E¤ects of Trade Costs on EntryModes: Firm Level Evidence�, mimeo.
[40] Train, K. (2009). Discrete Choice Methods with Simulation, 2nd Edition,Cambridge University Press.
24
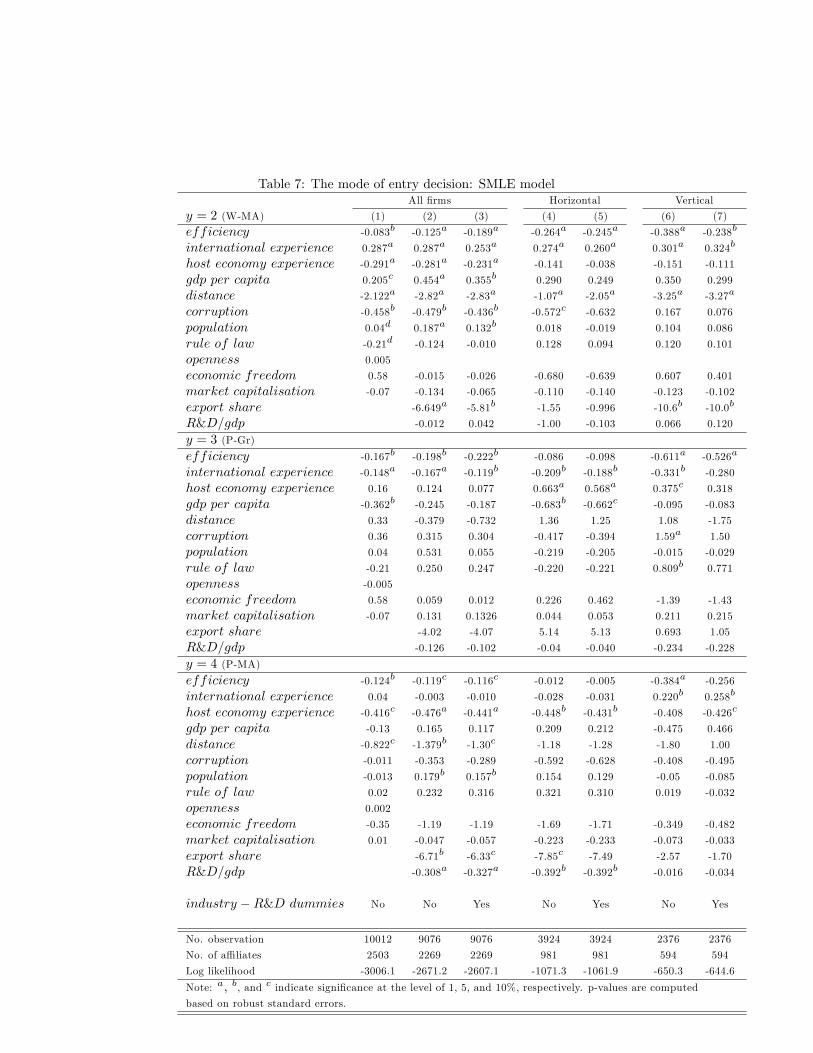
Table 7: The mode of entry decision: SMLE modelAll �rms Horizontal Vertical
y = 2 (W-MA) (1) (2) (3) (4) (5) (6) (7)
efficiency -0.083b -0.125a -0.189a -0.264a -0.245a -0.388a -0.238b
international experience 0.287a 0.287a 0.253a 0.274a 0.260a 0.301a 0.324b
host economy experience -0.291a -0.281a -0.231a -0.141 -0.038 -0.151 -0.111
gdp per capita 0.205c 0.454a 0.355b 0.290 0.249 0.350 0.299
distance -2.122a -2.82a -2.83a -1.07a -2.05a -3.25a -3.27a
corruption -0.458b -0.479b -0.436b -0.572c -0.632 0.167 0.076
population 0.04d 0.187a 0.132b 0.018 -0.019 0.104 0.086
rule of law -0.21d -0.124 -0.010 0.128 0.094 0.120 0.101
openness 0.005
economic freedom 0.58 -0.015 -0.026 -0.680 -0.639 0.607 0.401
market capitalisation -0.07 -0.134 -0.065 -0.110 -0.140 -0.123 -0.102
export share -6.649a -5.81b -1.55 -0.996 -10.6b -10.0b
R&D=gdp -0.012 0.042 -1.00 -0.103 0.066 0.120
y = 3 (P-Gr)efficiency -0.167b -0.198b -0.222b -0.086 -0.098 -0.611a -0.526a
international experience -0.148a -0.167a -0.119b -0.209b -0.188b -0.331b -0.280
host economy experience 0.16 0.124 0.077 0.663a 0.568a 0.375c 0.318
gdp per capita -0.362b -0.245 -0.187 -0.683b -0.662c -0.095 -0.083
distance 0.33 -0.379 -0.732 1.36 1.25 1.08 -1.75
corruption 0.36 0.315 0.304 -0.417 -0.394 1.59a 1.50
population 0.04 0.531 0.055 -0.219 -0.205 -0.015 -0.029
rule of law -0.21 0.250 0.247 -0.220 -0.221 0.809b 0.771
openness -0.005
economic freedom 0.58 0.059 0.012 0.226 0.462 -1.39 -1.43
market capitalisation -0.07 0.131 0.1326 0.044 0.053 0.211 0.215
export share -4.02 -4.07 5.14 5.13 0.693 1.05
R&D=gdp -0.126 -0.102 -0.04 -0.040 -0.234 -0.228
y = 4 (P-MA)efficiency -0.124b -0.119c -0.116c -0.012 -0.005 -0.384a -0.256
international experience 0.04 -0.003 -0.010 -0.028 -0.031 0.220b 0.258b
host economy experience -0.416c -0.476a -0.441a -0.448b -0.431b -0.408 -0.426c
gdp per capita -0.13 0.165 0.117 0.209 0.212 -0.475 0.466
distance -0.822c -1.379b -1.30c -1.18 -1.28 -1.80 1.00
corruption -0.011 -0.353 -0.289 -0.592 -0.628 -0.408 -0.495
population -0.013 0.179b 0.157b 0.154 0.129 -0.05 -0.085
rule of law 0.02 0.232 0.316 0.321 0.310 0.019 -0.032
openness 0.002
economic freedom -0.35 -1.19 -1.19 -1.69 -1.71 -0.349 -0.482
market capitalisation 0.01 -0.047 -0.057 -0.223 -0.233 -0.073 -0.033
export share -6.71b -6.33c -7.85c -7.49 -2.57 -1.70
R&D=gdp -0.308a -0.327a -0.392b -0.392b -0.016 -0.034
industry �R&D dummies No No Yes No Yes No Yes
No. observation 10012 9076 9076 3924 3924 2376 2376
No. of a¢ liates 2503 2269 2269 981 981 594 594
Log likelihood -3006.1 -2671.2 -2607.1 -1071.3 -1061.9 -650.3 -644.6
Note: a, b, and c indicate signi�cance at the level of 1, 5, and 10%, respectively. p-values are computedbased on robust standard errors.
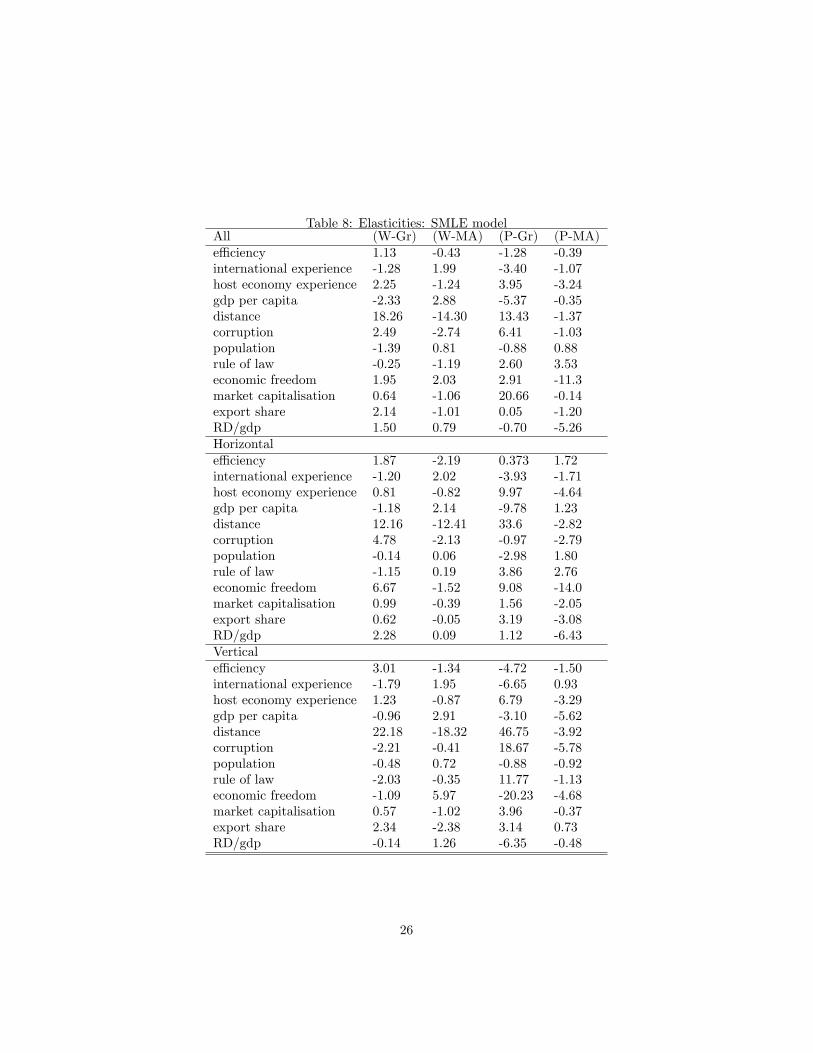
Table 8: Elasticities: SMLE modelAll (W-Gr) (W-MA) (P-Gr) (P-MA)e¢ ciency 1.13 -0.43 -1.28 -0.39international experience -1.28 1.99 -3.40 -1.07host economy experience 2.25 -1.24 3.95 -3.24gdp per capita -2.33 2.88 -5.37 -0.35distance 18.26 -14.30 13.43 -1.37corruption 2.49 -2.74 6.41 -1.03population -1.39 0.81 -0.88 0.88rule of law -0.25 -1.19 2.60 3.53economic freedom 1.95 2.03 2.91 -11.3market capitalisation 0.64 -1.06 20.66 -0.14export share 2.14 -1.01 0.05 -1.20RD/gdp 1.50 0.79 -0.70 -5.26Horizontale¢ ciency 1.87 -2.19 0.373 1.72international experience -1.20 2.02 -3.93 -1.71host economy experience 0.81 -0.82 9.97 -4.64gdp per capita -1.18 2.14 -9.78 1.23distance 12.16 -12.41 33.6 -2.82corruption 4.78 -2.13 -0.97 -2.79population -0.14 0.06 -2.98 1.80rule of law -1.15 0.19 3.86 2.76economic freedom 6.67 -1.52 9.08 -14.0market capitalisation 0.99 -0.39 1.56 -2.05export share 0.62 -0.05 3.19 -3.08RD/gdp 2.28 0.09 1.12 -6.43Verticale¢ ciency 3.01 -1.34 -4.72 -1.50international experience -1.79 1.95 -6.65 0.93host economy experience 1.23 -0.87 6.79 -3.29gdp per capita -0.96 2.91 -3.10 -5.62distance 22.18 -18.32 46.75 -3.92corruption -2.21 -0.41 18.67 -5.78population -0.48 0.72 -0.88 -0.92rule of law -2.03 -0.35 11.77 -1.13economic freedom -1.09 5.97 -20.23 -4.68market capitalisation 0.57 -1.02 3.96 -0.37export share 2.34 -2.38 3.14 0.73RD/gdp -0.14 1.26 -6.35 -0.48
26