Universidad Autónoma de Barcelona - ddd.uab.cat · SEPAR en el pronóstico de la neumonía...
109
Universidad Autónoma de Barcelona Programa de Doctorado de Medicina Interna TESIS DOCTORAL IMPACTO DEL TRATAMIENTO EMPÍRICO Y ADECUACIÓN DE NORMATIVAS SEPAR EN LA NEUMONÍA ADQUIRIDA EN LA COMUNIDAD HOSPITALIZADA. ESTUDIO FARMACOECONÓMICO Y ANÁLISIS DE COSTE-EFECTIVIDAD Tesis presentada por Soledad María Reyes Calzada para optar al grado de Doctor. Programa de Doctorado de Medicina Interna. Universidad Autónoma de Barcelona Directores de la tesis: Dra. Rosario Menéndez Villanueva Hospital Universitari i Politècnic La Fe (Valencia) Juan Ruiz Manzano Hospital Germans Trials i Pujol Universidad Autónoma de Barcelona Barcelona, 09 de Noviembre 2015
Transcript of Universidad Autónoma de Barcelona - ddd.uab.cat · SEPAR en el pronóstico de la neumonía...

Universidad Autónoma de Barcelona
Programa de Doctorado de Medicina Interna
TESIS DOCTORAL
IMPACTO DEL TRATAMIENTO EMPÍRICO Y ADECUACIÓN DE
NORMATIVAS SEPAR EN LA NEUMONÍA ADQUIRIDA EN LA
COMUNIDAD HOSPITALIZADA. ESTUDIO FARMACOECONÓMICO
Y ANÁLISIS DE COSTE-EFECTIVIDAD
Tesis presentada por Soledad María Reyes Calzada para optar al grado de Doctor.Programa de Doctorado de Medicina Interna.
Universidad Autónoma de Barcelona
Directores de la tesis:
Dra. Rosario Menéndez Villanueva
Hospital Universitari i Politècnic La Fe (Valencia)
Juan Ruiz Manzano
Hospital Germans Trials i Pujol
Universidad Autónoma de Barcelona
Barcelona, 09 de Noviembre 2015


AUTORIZACIÓN DEL DIRECTOR DE TESIS
La Dra. Rosario Menéndez Villanueva, Jefe de Servicio de Neumología del
Hospital Universitari i Politècnic La Fe de Valencia.
CERTIFICA:
Que la memoria que lleva el nombre “Impacto de la adherencia a normativas
SEPAR en el pronóstico de la neumonía adquirida en la comunidad. Evaluación
fármaco-económica y análisis coste-efectividad”, presentada por la licenciada en
Medicina y Cirugía, Doña Soledad María Reyes Calzada para optar al grado de
Doctor en Medicina, ha sido realizada bajo mi dirección. Una vez finalizada
autorizo su presentación para ser juzgada por el tribunal correspondiente.
Y para que quede constancia a los efectos oportunos, firmo la presente en
Barcelona, 09 de Noviembre 2015.
Dra. Rosario Menéndez Villanueva

AUTORIZACIÓN DEL DIRECTOR DE TESIS
El Dr. Juan Ruiz Manzano, Jefe de Servicio de Neumología del Hospital
Germans Trials i Pujol de Badalona y Profesor Titular de la Universitat
Autònoma de Barcelona.
CERTIFICA:
Que la memoria que lleva el nombre “Impacto de la adherencia a normativas
SEPAR en el pronóstico de la neumonía adquirida en la comunidad. Evaluación
fármaco-económica y análisis coste-efectividad”, presentada por la licenciada en
Medicina y Cirugía, Doña Soledad María Reyes Calzada para optar al grado de
Doctor en Medicina, ha sido realizada bajo mi dirección. Una vez finalizada
autorizo su presentación para ser juzgada por el tribunal correspondiente.
Y para que quede constancia a los efectos oportunos, firmo la presente en
Barcelona, 09 de noviembre del 2015.
Dr. Juan Ruiz Manzano


A mis queridos padres


AGRADECIMIENTOS
Esta tesis doctoral no hubiera sido posible sin la ayuda de muchas personas, a
las que quiero expresar mi más sincero agradecimiento.
En primer lugar, a los directores de esta tesis, en especial a la Dra. Rosario
Menéndez Villanueva, por su confianza en mí desde el segundo año de médico
residente en Neumología. Por su apoyo, estímulo, dedicación y cercanía. Por su
ayuda tanto a nivel profesional como personal. Por sus enseñanzas en el día a
día, y su constante orientación científica. Gracias porque ha sido un placer
trabajar a su lado en esta ardua tarea de la investigación. Al Dr. Juan Ruiz
Manzano por ser un privilegio que esté presente en la dirección de mi tesis
doctoral. Gracias por dedicarme su tiempo, por su apoyo y colaboración.
En segundo lugar, quiero mostrar mi más sincero agradecimiento a todo el
personal del Servicio de Neumología del Hospital Universitari i Politècnic La
Fe de Valencia, médicos adjuntos, residentes, personal de enfermería, por su
apoyo y facilidades dadas para la realización de este trabajo de investigación.
Gracias también porque me ha permitido compaginarlo con la gratificante tarea
asistencial.
A todas mis compañeras del grupo de investigación de infecciones respiratorias,
Raquel, Ángela, Alejandra, Verónica, Cristina, Luz, Paula por aguantarme con
paciencia todos estos años, por todas las horas y momentos vividos tanto los
fáciles como difíciles y por la gran amistad que me une a ellas. Gracias por la
sonrisa regalada de todos los días.
A mis padres, por la lucha constante. Por dedicarme gran parte de su vida y de
su tiempo. Por creer en mí. Por dejarme hacer y realizar mis ilusiones. Gracias
Papá y Mamá.
A Paco, Álvaro y Pablo por su apoyo incondicional, ayuda y cariño, por su
compresión a pesar de los ratos robados durante estos años.
A todos ellos, muchas gracias


Tesis Doctoral
Soledad María Reyes Calzada Página 5
ÍNDICE
Presentación 6
Justificación y objetivos de los estudios incluidos en la tesis 7
Justificación general 8-9
Justificación y objetivos del estudio 1 10-11
Justificación y objetivos del estudio 2 12-13
Justificación y objetivos del estudio 3 14-15
Publicaciones originales 16
Articulo 1.- Empiric treatment in hospitalized community-acquired
pneumonia. Impact on mortality, length of stay and re-admission”.
Respiratory Medicine,2007;101:1909-1915
18
Artículo 2.- Determinants of hospital costs in community-acquired
pneumonia”. Eur Resp J 2008;31:1061-1067. 26
Artículo 3.- Economic evaluation of adherence to treatment guidelines
in nonintensive care pneumonia” Eur Resp J 2007;29:751-756
34
Resultados 41
Discusión 59
Conclusiones 68
Publicaciones relacionadas 71
Artículo 1.- Menéndez R, Cremades MJ, Martínez Moragón E, Soler JJ,
Reyes S, Perpiñá M. Duration of length of stay in pneumonia: influence
of clinical factors and hospital type. Eur Respir J 2003;22:643-648.
72
Bibliografía 79


Tesis Doctoral
Soledad María Reyes Calzada Página 6
PRESENTACIÓN
La presente tesis está estructurada siguiendo las directrices de la
normativa para la presentación de tesis doctorales como compendio de
publicaciones, aprobada por la comisión de Doctorado de la Universidad
Autónoma de Barcelona (UAB) en noviembre del 2004.
Los estudios que forman parte de esta Tesis Doctoral pertenecen a la
misma línea de investigación. El presente trabajo está dirigido a conocer la
utilidad de la implementación de las normativas de la Sociedad Española de
Neumología (SEPAR) y del tratamiento empírico en la neumonía adquirida en la
comunidad (NAC). Las normativas elaboradas por las sociedades científicas
proporcionan una ayuda al clínico en el manejo de la infección y proporcionan
una mejor calidad asistencial. Su implementación tiene efectos directos sobre la
duración de la estancia, reingreso y mortalidad. De hecho, existen diferencias
entre la elección de un determinado tipo de antibiótico en el pronóstico de la
NAC. En nuestro trabajo se incluye una segunda parte dirigida al análisis
fármaco-económico e implicación de la elección del tratamiento antibiótico
empírico en términos de costes y eficacia durante la hospitalización de la NAC.
Estos estudios coste-eficacia permiten evaluar la práctica clínica para maximizar
el beneficio de salud frente al paciente a partir del cálculo de costes para las
distintas alternativas de tratamiento.
Los resultados de los estudios incluidos han aportado información
relevante y novedosa en este campo. Están recopilados en tres artículos
originales que forman parte de esta tesis, publicados en revistas de amplia
difusión internacional en el campo de la neumología, con un factor de impacto
global de 18.358 puntos. Incluimos como material complementario el primer
trabajo publicado de esta línea de investigación en el 2003 con un factor impacto
de 7.636. Dichos artículos se presentan en su versión original en inglés.
Esta tesis supone una aportación desde el punto de vista clínico a la
búsqueda de medidas eficaces en el tratamiento de pacientes con NAC. Este
estudio ha ayudado a demostrar la eficacia de las normativas SEPAR en
términos de mejora de calidad asistencial y pronóstico. Ha ayudado a demostrar
la eficacia en términos de coste-efectividad de las diferentes alternativas de
tratamiento según la adherencia a las directrices y como consecuencia una
reducción de los costes hospitalarios.

Tesis Doctoral
Soledad María Reyes Calzada Página 7
JUSTIFICACIÓN Y OBJETIVOS DE LA TESIS


Tesis Doctoral
Soledad María Reyes Calzada Página 8
JUSTIFICACIÓN GENERAL
La neumonía adquirida en la comunidad (NAC) es una enfermedad con
elevada incidencia y una de las causas más importantes de morbi-mortalidad en
todo el mundo. La tasa de mortalidad bruta por neumonía se eleva a 19,05 por
100.000 habitantes en España [1] y a un 22,8 en los Estados Unidos [2]. Dichas
cifras no están descendiendo en la última década,[3] por lo que se nos plantean
nuevas vías de investigación para poder mejorar el pronóstico y supervivencia
de la enfermedad.
La mortalidad de la NAC se relaciona con factores que dependen del
paciente, de la infección, de la gravedad inicial y de factores relacionados con la
actuación médica. Sin embargo, la actuación médica es un factor relacionado con
el pronóstico del paciente con capacidad de ser modificado y mejorado con los
beneficios que de ello se deriva.
Para ayudar al clínico en el manejo de la NAC, las sociedades científicas
elaboran normativas dirigidas a mejorar el manejo del enfermo, clarificar el
tratamiento empírico, e intentar eliminar la gran variabilidad en la asistencia
médica entre los profesionales [4, 5]; [6] [7]. Estas normativas incluyen múltiples
apartados para la atención del paciente, desde su valoración inicial hasta el alta
y las medidas preventivas. La utilización de las normativas es una medida de
calidad asistencial en el medio hospitalario.
En la práctica diaria, los clínicos instauramos un tratamiento antibiótico
inicial adaptando las recomendaciones pautadas por las sociedades científicas a
las peculiaridades epidemiológicas y del propio paciente. El impacto de la
elección del tratamiento antibiótico empírico es importante por su implicación
en el pronóstico. Incluso la elección de un antibiótico puede determinar la
evolución de la infección [8, 9].
Por otra parte, la NAC tiene gran importancia en términos económicos.
Produce gran consumo de recursos sanitarios y alto coste. Este coste puede ser
directo (gasto farmacéutico, consultas médicas e ingresos hospitalarios) e
indirecto (bajas laborales).[10] La duración de la estancia constituye el coste
directo más importante en el coste total de la NAC hospitalizada, superior al del
tratamiento antibiótico o las pruebas de laboratorio o diagnósticas. [11, 12] En
los últimos años se ha constatado un interés por cuantificar, evaluar y
comprobar las causas que determinan el número de días de hospitalización que

Tesis Doctoral
Soledad María Reyes Calzada Página 9
precisa una NAC. Un análisis cuidadoso de la bibliografía pone de manifiesto
que la duración de la hospitalización en la NAC varía mucho entre los diferentes
hospitales y depende de múltiples variables. Pero, existe escasa información
dirigida a analizar específicamente la influencia de los distintos factores
(elección del tratamiento, estancia hospitalaria) en los costes y menos aún
conocida en términos de coste-eficacia. Estos estudios permiten evaluar la
práctica clínica para maximizar el beneficio de salud frente al paciente a partir
de un cálculo de costes para las distintas alternativas de tratamiento.

Tesis Doctoral
Soledad María Reyes Calzada Página 10
JUSTIFICACION Y OBJETIVOS DEL ESTUDIO 1
Reyes S, Martínez R, Cremades MJ, Martínez Moragón E, Soler JJ, Menéndez
R. “Empiric treatment in hospitalized community-acquired pneumonia.
Impact on mortality, length of stay and re-admission” (Respiratory
Medicine,2007;101:1909-1915)
Numerosos estudios publicados en la literatura destacan la importancia del
seguimiento de una guía clínica en el manejo y tratamiento de la neumonía
adquirida en la comunidad. El cumplimiento de una guía clínica y la elección del
tratamiento empírico inicial tienen gran repercusión sobre el pronóstico y
mortalidad de los pacientes hospitalizados por esta infección. Este cumplimiento
repercute directamente en la calidad de la atención hospitalaria en la NAC. El
efecto sobre la duración de la hospitalización, la estabilidad clínica precoz,
menor mortalidad y reingresos. Incluso la utilización de determinados
regímenes antibióticos utilizados en monoterapia o combinación tienen
implicaciones pronósticas en la NAC.
La hipótesis de este estudio es investigar los factores que influyen en la
mortalidad a los 30 días, la estancia hospitalaria y el curso de la NAC
hospitalizada. En este estudio, se analiza de forma minuciosa la adherencia y
seguimiento de las recomendaciones SEPAR en nuestro país. Es un estudio
multicéntrico llevado a cabo en 4 hospitales de la Comunidad Valenciana. Esto
nos ha permitido analizar la variabilidad de la práctica hospitalaria por los
profesionales. En cuanto a los regímenes terapéuticos empleados, los hemos
clasificado como adherentes y no adherentes a normativas SEPAR.
En un primer análisis univariado relacionamos la adherencia y los diferentes
regímenes antibióticos administrados, con parámetros tan importantes como la
mortalidad a los 30 días, duración de la estancia hospitalaria y reingreso a los 30
días. Además, hemos analizado las diferencias de estos parámetros clasificando
a los pacientes según la gravedad inicial medida por escala de riesgo de Fine
[13]. Esto se ha realizado entre los diferentes hospitales participantes.
Posteriormente, se realizó un análisis minucioso de la mortalidad actual a los 30
días de los pacientes incluidos en el estudio, para cada pauta antibiótica. Esta
mortalidad se comparó con la mortalidad a los 30 días predicha para cada clase
de riesgo de Fine.

Tesis Doctoral
Soledad María Reyes Calzada Página 11
En una segunda parte del estudio se realizaron 3 estudios multivariados tipo
regresión logística ajustados por gravedad inicial (Fine) para analizar que
variables predecían mortalidad a los 30 días, reingreso hospitalario a los 30 días
y estancia hospitalaria prolongada
-Objetivos concretos
1.- Determinar el impacto y seguimiento de las normativas españolas en la
elección del tratamiento empírico en la NAC hospitalizada.
2.-Analizar el beneficio de determinados regímenes antibióticos en la evolución
de la enfermedad, en cuanto a duración de estancia, mortalidad y reingreso a los
30 días.
3.-Definir que variables predicen de manera independiente tras ajustar por
gravedad inicial, la mortalidad, estancia hospitalaria prolongada y reingreso
hospitalario a los 30 días.
Tesis Doctoral
Soledad María Reyes Calzada Página 12
JUSTIFICACIÓN Y OBJETIVOS DEL ESTUDIO 2
Reyes S, Martínez R, Vallés JM, Cases E, Menéndez R. “Determinants of
hospital costs in community-acquired pneumonia” (European Respiratory
Journal 2008;31:1061-1067)
La neumonía adquirida en la comunidad continúa siendo una infección de
mortalidad relevante y alto consumo de recursos sanitarios. Aunque la mayoría
de los episodios son tratados de forma ambulatoria, aproximadamente un 30%
requieren ingreso hospitalario y es precisamente este grupo el que ocasiona
aproximadamente el 90% de los costes. La gran repercusión económica se debe
tanto a costes directos (medicación, pruebas de laboratorio, diagnósticas,
duración de la hospitalización) como indirectos (bajas laborales). La duración de
la hospitalización constituye la causa principal de los costes directos en la NAC
hospitalizada.
La hipótesis del siguiente trabajo ha sido analizar los costes directos ocasionados
por la NAC hospitalizada. Estos costes están influenciados por determinados
factores como la edad, comorbilidad del paciente, gravedad inicial de la
neumonía y complicaciones durante la hospitalización. De esta forma todos
estos factores prolongan la estancia hospitalaria y consecuentemente aumentan
los costes directos y totales de esta infección. Identificando estos factores que son
determinantes de alto coste podríamos definir estrategias para reducción de
costes o utilización más eficientes de los recursos de los que disponemos.
Es un estudio prospectivo y observacional, realizado durante 13 meses en un
hospital terciario. Se han analizado de forma descriptiva todos los costes
directos durante la hospitalización, clasificados en: coste de la medicación, coste
de las pruebas de laboratorio, coste de las pruebas diagnósticas, coste de la
duración de la estancia y coste total de la NAC. En un primer análisis univariado
hemos analizado todos los costes directos según edad, comorbilidad, gravedad
inicial según escala de riesgo de Fine y complicaciones. Además, hemos
identificado los factores que de forma independiente predicen un alto coste en la
NAC hospitalizada, definiendo alto coste como el que excedía a la mediana de la
cohorte (> 1683€).
En una segunda parte del estudio, hemos realizado un análisis multivariado tipo
regresión logística. Las variables independientes introducidas fueron las
encontradas estadísticamente significativas en el univariado y aquellas

Tesis Doctoral
Soledad María Reyes Calzada Página 13
consideradas clínicamente relevantes. Y como variable dependiente la variable
alto coste. De esta manera analizamos de forma más precisa los factores
asociados a alto coste durante la hospitalización.
-Objetivos concretos
1.- Analizar desde el punto de vista de la perspectiva hospitalaria los costes
directos producidos por la hospitalización de la neumonía.
2.- Evaluar la influencia de la edad avanzada, las comorbilidades, la gravedad
inicial y las complicaciones en los diferentes componentes del coste.
3.-Analizar los factores que de forma independiente determinan un alto coste
durante la hospitalización.

Tesis Doctoral
Soledad María Reyes Calzada Página 14
JUSTIFICACIÓN Y OBJETIVOS DEL ESTUDIO 3
Menéndez R, Reyes S, Martínez R, De la Cuadra P, Vallés JM, Vallterra J.
“Economic evaluation of adherence to treatment guidelines in nonintensive
care pneumonia” (European Respiratory Journal 2007;29:751-756)
Las guías clínicas han sido desarrolladas para mejorar el manejo de los
pacientes. Numerosos estudios, analizan y encuentran resultados positivos
cuando el tratamiento antibiótico se adhiere a las normativas, con mejores
resultados, mejor pronóstico y menor mortalidad. [14-16] Por el contrario, existe
poca información relativa al impacto de las normativas en el coste de la NAC.
En los últimos años, existe una tendencia a reducir el coste hospitalario
utilizando estrategias que fomentan un alta hospitalaria precoz. Algunos
autores, sugieren que esta reducción de la estancia hospitalaria puede
acompañarse de un aumento de la mortalidad y reingreso a los 30 días. [17].
Estos hallazgos suponen una dificultad en la implementación de medidas
directas destinadas a reducir costes sin considerar los efectos negativos en el
pronóstico de los pacientes. Por ello, en la práctica clínica, la evaluación de los
costes debería tener una perspectiva que incluya ambos conceptos, el coste y su
efectividad. Algunos autores, analizan el impacto de las guías clínicas y los
costes. Así Suchyta et al. [18] encuentran menos reingresos y costes tras la
implementación de las normativas Orrick et al. [19], en pacientes hospitalizados
con NAC, encuentran que el tratamiento instaurado según la normativa IDSA
[6] reduce el coste, (la media del grupo tratado con antibióticos según las guías
3009 vs 4992 dólares), aunque en este estudio no se tiene en cuenta la severidad
inicial, la cual es un determinante importante de la estancia hospitalaria. El
análisis del coste efectividad es una herramienta útil al evaluar costes y
resultados con diferentes modalidades de tratamiento. El análisis dirigido
directamente al tratamiento antibiótico y adherencia a las guías clínicas apenas
ha sido estudiado en la NAC.
La hipótesis del siguiente trabajo ha sido determinar si la adherencia a las
directrices SEPAR para el tratamiento de pacientes con NAC hospitalizados es la
alternativa más eficiente, según el análisis coste-efectividad.
El trabajo es un estudio prospectivo y observacional de 13 meses de duración en
un hospital terciario. La medida de efectividad del tratamiento fue el total de
pacientes curados. Los pacientes curados fueron los que no murieron ni
reingresaron a los treinta días. Los costes se han calculado separadamente para
los pacientes con tratamiento adherente a las guías SEPAR (grupo A) y para los

Tesis Doctoral
Soledad María Reyes Calzada Página 15
pacientes con otros regímenes terapéuticos (grupo NA). Se calcularon los
cocientes de coste-efectividad para cada grupo dividiendo el coste (C) por la
efectividad (E), obteniendo los siguientes cocientes CA/EA y CNA /ENA.
Posteriormente se realizó un análisis de minimización de costes: CA-CNA para
calcular las diferencias en el coste por paciente entre las dos opciones. Se calculó
la ratio del coste-efectividad incremental (ICER) para determinar la diferencia en
costes y efectividad entre ambas alternativas (adherencia versus no-adherencia):
ICER= (CA-CNA) /(EA-ENA). Esta medida es la utilizada habitualmente para
comparar dos opciones de tratamiento. Por último, se realizó un análisis de
sensibilidad para evaluar si los resultados eran robustos.
-Objetivos concretos
1.- Realizar una evaluación fármaco-económica para determinar la eficiencia de
la adherencia a las normativas de tratamiento de la Sociedad Española de
Neumología y Cirugía (SEPAR) en la neumonía adquirida en la comunidad.
2.- Determinar si el tratamiento y el manejo de pacientes hospitalizados por
neumonía adquirida en la comunidad es coste-efectivo, tras cuantificar los costes
desde la perspectiva hospitalaria.
.
Tesis Doctoral
Soledad María Reyes Calzada Página 16
PUBLICACIONES ORIGINALES


Tesis Doctoral
Soledad María Reyes Calzada Página 17
Los resultados de los estudios que constituyen la base de la presente Tesis
Doctoral han estado recopilados en las siguientes publicaciones:
- Reyes S, Martínez R, Cremades MJ, Martínez Moragón E, Soler JJ, Menéndez R.
“Empiric treatment in hospitalized community-acquired pneumonia. Impact on
mortality, length of stay and re-admission”. Respiratory Medicine 2007; 101:1909-
1915. (Factor de Impacto=3,086)*
- Reyes S, Martínez R, Vallés JM, Cases E, Menéndez R. “Determinants of
hospital costs in community-acquired pneumonia”. Eur Respir J 2008; 31:1061-
1067. (Factor de Impacto=7,636)*
-Menéndez R, Reyes S, Martínez R, De la Cuadra P, Vallés JM, Vallterra J.
“Economic evaluation of adherence guidelines in nonintensive care
pneumonia”. Eur Respir J 2007;29:751-756. (Factor de Impacto=7,636)*
Factor de Impacto global: 18,358
*Journal Citation Report Science Edition 2014


Tesis Doctoral
Soledad María Reyes Calzada Página 18
ARTICULO 1


ARTICLE IN PRESS
Respiratory Medicine (2007) 101, 1909–1915
0954-6111/$ - see frodoi:10.1016/j.rmed.
$This work has be�Corresponding au
E-mail address: r
Empiric treatment in hospitalized community-acquiredpneumonia. Impact on mortality, length of stayand re-admission$
S. Reyes Calzadaa,e,�, R. Martınez Tomasa,e, M.J. Cremades Romerob,E. Martınez Moragonc, J.J. Soler Catalunad, R. Menendez Villanuevaa
aService of Pneumology, Hospital Universitario La Fe, Valencia, SpainbHospital de Gandia, SpaincHospital de Sagunto, SpaindHospital de Requena, SpainePrograma de doctorado en medicina, Universidad Autonoma de Barcelona, Spain
Received 17 October 2006; accepted 23 April 2007Available online 12 July 2007
KEYWORDSCommunity-acquiredpneumonia;Treatment;Mortality;Length of stay
nt matter & 20072007.04.018
en supported bythor. Tel.: +34 963
SummaryObjective: To evaluate adherence to guidelines when choosing an empirical treatmentand its impact upon the prognosis of community-acquired pneumonia (CAP).Methods: A prospective multicentre study was conducted in 425 CAP patients hospitalizedon ward. Initial empirical treatment was classified as adhering or not to Spanish guidelines.Adherent treatment was defined as an initial antimicrobial regimen consisting of beta-lactams plus macrolides, beta-lactam monotherapy and quinolones. Non-adherenttreatments included macrolide monotherapy and other regimens. Initial severity wasgraded according to pneumonia severity index (PSI). The end point variables weremortality, length of stay (LOS) and re-admission at 30 days.Results: Overall 30-day mortality was 8.2%, the mean LOS was 875 days, and the globalre-admission rate was 7.6%. Adherence to guidelines was 76.5%, and in most cases theempirical treatment consisted of beta-lactam and macrolide in combination (57.4%).Logistic regression analysis showed that other regimens were associated with highermortality OR ¼ 3 (1.2–7.3), after adjusting for PSI and admitting hospital. Beta-lactammonotherapy was an independent risk factor for re-admission. LOS was independentlyassociated with admitting hospital and not with antibiotics.
Elsevier Ltd. All rights reserved.
CIBER-CB06/06/0028.862764; fax: +34 961973089.
Reyes Calzada).

ARTICLE IN PRESS
S. Reyes Calzada et al.1910
Conclusions: A high adherence to CAP treatment guidelines was found, though withconsiderable variability in the empirical antibiotic treatment among hospitals. Non-adherent other regimens were associated with greater mortality. Beta-lactam mono-therapy was associated with an increased re-admission rate.& 2007 Elsevier Ltd. All rights reserved.
Introduction
Community-acquired pneumonia (CAP) is one of the diseaseswith the greatest morbidity–mortality in the world, andleads to important consumption of health care resources.The gross mortality rate due to pneumonia is 17.2 per100,000 inhabitants in Spain,1 versus 20.9 in the UnitedStates.2 These figures have not decreased in recentdecades.2,3 Mortality due to pneumonia can be related tofactors depending on the infection, the causal microorgan-ism, the initial severity of the disease, and parametersassociated with medical care. The initial severity of CAP canbe quantified, but is not amenable to modification. Thecausal microorganism is, in turn, dependent upon thegeographical setting, patient co-morbidity, toxic habits,and age among others. However, medical intervention is afactor related to the patient prognosis that can be modifiedand improved. In this context, inadequate initial antibiotictreatment is known to be associated with importantmortality.4,5
Prescription of antibiotics in CAP is usually an empiricalselection because the causal microorganisms are unknown atdiagnosis. Furthermore, neither symptoms nor analyticaldata or radiological findings allow an accurate etiologicdiagnosis. In fact, a limitation on CAP therapy studies is thatthere are very few well-designed CAP treatment studies andmost of them are retrospective and non-experimental.
Guidelines to aid in the decision for empirical treatmentand patient management have been developed by scientificsocieties.6–9 These guidelines stratify patients by age,co-morbidity, risk factors for microbial resistance and/orspecific parameters for selecting the antibiotic regimen.
The choice of treatment regimen also has prognosticimplications, since different therapeutic protocols exist andnot all of them offer the same beneficial effects for thepatient.10–12 Thus, treatment adherence to the guidelines,and the use of certain antibiotic regimens such as macro-lides plus beta-lactams and fluoroquinolones have beenassociated with improved outcomes.13–17 However, thecontroversy remains about the beneficial impact on prog-nosis of empirical treatments with or without atypicalcoverage.18,19 Two recently published meta-analyses haveshown no beneficial effect when atypical coverage againstmicroorganisms is prescribed.20,21
Our working hypothesis is that mortality, the length ofhospital stay, and the course of CAP in hospitalized patientsdepends on hospital type and the prescription of adequateinitial empirical treatment following guidelines. We there-fore investigated adherence to the established Spanishguidelines when choosing an empirical antibiotic treatment,and its impact upon the prognosis of patients admittedwith CAP.
Patients and methods
A prospective, observational study with a duration of oneyear was carried out in four public hospitals of theAutonomous Community of Valencia (Spain): a tertiaryhospital (Hospital A) attending 400,000 inhabitants, andthree district hospitals (B, C and D), respectively, attending128,000, 125,000 and 54,000 inhabitants. In the tertiaryhospital there is a pneumologist on duty, while in the otherthree hospitals there is an internist physician on duty; aradiologist on duty is found in the four centres.
The study cohort included consecutive patients admittedwith CAP. The inclusion criteria were: age 418 years,symptoms of acute respiratory infection, and the presenceof a new infiltrate on chest X-radiogram, with no alternativediagnosis up until resolution. Immunocompromised patientswere excluded (human immunodeficiency virus infection(HIV), transplantations, and patients receiving immunosup-pressing drug and/or corticosteroids at doses 420mg/day),as were those with lung abscesses, tuberculosis, suspectedaspiration, admission to hospital in the previous 15 days, andpatients with pneumonia admitted to Intensive Care Unit(ICU). Informed consent was not required by our local ethicscommittee because no patient interventions were involved.
A protocol for data collection in the first 24 h was appliedin all cases: age, sex, smoking and alcohol consumption,vaccination status, residence for the elderly, co-morbidity(pulmonary, heart, liver, neurological, renal, neoplasms anddiabetes mellitus). The following clinical data were re-corded: cough, expectoration, chest pain, dyspnea, mentalalterations, temperature, heart rate, respiratory rate, andblood pressure. Recorded analytical data were leucocytecount, sodium, potassium, serum creatinine, glucose,GOT/GTP, and arterial blood gas analysis. Radiologicalparameters were also documented (radiological pattern,number of affected lung lobes, pleural effusion or cavita-tion). All patients were classified according to the pneumo-nia severity index (PSI).22
Empiric antibiotic treatment was that one prescribedwithin the first 24 h. It was classified according to adherenceor not to the Spanish guidelines, Sociedad Espanola deNeumologıa y Cirugıa Toracica (SEPAR)6,7 and to the specificantimicrobial regimen used. Adherence to guidelines forpatients hospitalized on ward include the following regi-mens: beta-lactam (cefotaxime, ceftriaxone or amoxicillin-clavulanate) plus macrolide (clarithromycin, azithromycin,erythromycin), beta-lactam (cefotaxime, ceftriaxone oramoxicillin-clavulanate) in monotherapy, and quinolones(third or fourth generation). Any other antibiotic orcombination of antibiotics was considered non-adherent toguidelines. The attending physician prescribed the initialempiric antibiotic therapy. No interventions on prescribing

ARTICLE IN PRESS
Table 1 Demographic characteristics, co-morbidity andPSI of the study cohort.
Patients n (%) 425 100Age (yr)� 69716Sex (M/F) 274/151 65/35Co-morbidity n (%)Congestive heart failure 119 28COPD 143 34Diabetes mellitus 85 20Cerebrovascular disease 63 15Kidney disease 23 5Liver disease 23 5Neoplasm 35 8Smoking 77 18Residence for the elderly 18 4
PSI n (%)I 31 7II 52 12III 93 22IV 170 40V 79 19
Adherence to SEPAR n (%) 325 76LOS� 875Deaths n (%) 35 8Re-admission n (%) 32 8
�Data are presented as mean7SD; M: male; F: female;COPD: chronic obstructive pulmonary disease; PSI: pneumo-nia severity index; LOS: length of stay; SEPAR: SociedadEspanola de Neumologıa y Cirugıa toracica.
Treatment of pneumonia. Impact on outcome 1911
physicians were carried out prior or during the study aboutSEPAR guidelines awareness.
The length of stay (LOS) in hospital was defined asthe number of days of patient admission since arrival tohospital until discharge. Follow-up was carried out 30 daysafter discharge to assess the course of the patient, withevaluation of the need for re-admission, and global mor-tality at 30 days.
Actual and predicted 30-day mortality were comparedfor each antibiotic treatment regimen. Actual mortalitywas calculated dividing the number of deaths by thenumber of patients given a specific antibiotic treatment.Predicted mortality for the same groups, weighted byseverity, was calculated adding the predicted mortality foreach patient in the group and dividing by the number ofpatients in that group. Predicted mortality for each patientwas the one assigned to the PSI group in which the patientwas classified (I ¼ 0.1%, II ¼ 0.6%, III ¼ 2.8%, IV ¼ 8.2%,V ¼ 29.2%).22
Statistical analysis
A descriptive and comparative analysis was performed:univariate analysis was based on the chi-square test forqualitative variables, while the Student’s t-test was used forquantitative variables. Non-parametric tests were used inthe absence of a normal distribution. Values of po0.05 wereconsidered statistically significant.
Three multivariate stepwise logistic regression analyseswere carried out. Dependent variables were mortality in thefirst analysis, re-admission in the second, and prolonged LOS(48 days) in the third. The LOS was dichotomized by themedian, and prolonged LOS was considered when LOS was48 days (yes/no). Independent variables in the threeanalyses were PSI, admitting hospital (A, B, C, D), adherenceto guidelines (yes/no) and empiric antibiotic. PSI wasdichotomized as high (Fine risk classes IV and V) or lowseverity (classes I–III). Empiric antibiotic regimens wereclassified as beta-lactam monotherapy, beta-lactam plusmacrolides, quinolones, macrolides monotherapy andothers. Odds ratio (OR) and 95% confidence interval (CI)were calculated, and the goodness-of-fit of the models wereassessed with the Hosmer–Lemeshow test.
Results
Cohort description
A total of 425 patients were included: 229 (53.9%) admittedto the tertiary centre, and 196 (46.1%) in the generalhospitals. The demographic and clinical characteristics areshown in Table 1. There were no significant differencesamong the four hospitals in terms of co-morbidity, age andsex. However, smoking habit was more frequent in hospitalsC and D, p ¼ 0.02.
Antibiotic regimens
The therapeutic adherent regimens used were: beta-lactamplus macrolide (n ¼ 244, 57.4%), beta-lactam monotherapy
(n ¼ 72, 16.9%), and quinolones (n ¼ 11, 2.6%). The non-adherent treatments were classified as macrolide mono-therapy (n ¼ 32; 7.5%) and others (n ¼ 66; 15.5%). Thelatter included second generation cephalosporins plusmacrolides (n ¼ 33, 7.7%), ciprofloxacin monotherapy(n ¼ 3, 0.7%), ciprofloxacin plus macrolide (n ¼ 13, 3.2%)or plus amoxicillin-clavulanate (n ¼ 1, 0.2%), third or fourthgeneration cephalosporins plus amikacin (n ¼ 5, 1.1%),imipenem (n ¼ 4, 0.9%), second generation cephalosporinsas monotherapy (n ¼ 3, 0.7%), vancomycin plus macrolide orantipseudomonal cephalosporin (n ¼ 3, 0.7%), piperacillin-tazobactam (n ¼ 1, 0.2%). The distribution by groups ineach hospital is reported in Table 2. The most oftenused treatment regimen in the four hospitals was thecombination of beta-lactams and macrolides. However,this regimen was less frequent in hospital B (38.5%), wherean increase was seen in the use of other regimens (31.5%),due to a higher prescription of second-generation cephalos-porins plus macrolides. Treatment adherence to theSEPAR guidelines for the global patient cohort was 76.5%.Adherence differed among the hospitals, however, andwas seen to be lower in hospitals B (53.4%) and C (67.2%)compared with hospitals A (83.8%) and D (84.6%),p ¼ 0.0001. The distribution of the antibiotic regimensaccording to PSI (Table 3) was similar in the low andhigh-risk groups, except for macrolide monotherapy, whichwas more frequent among the low-risk patients (13.6%versus 3.2%).

ARTICLE IN PRESS
Table 2 Description of empiric treatment according to age, co-morbidity, length of stay, mortality and readmission.
Adherence to guidelines Non-adherence to guidelines p
Beta-lactam+macrolide
Beta-lactammonotherapy
Quinolone Macrolidemonotherapy
Otherregimens
Age (yr) (mean7SD) 70716 73714 72718 55721 70716 0.008Co-morbidity n (%)Congestive heart failure 70 (28.7) 23 (31.9) 3 (27.3) 5 (15.6) 18 (27.3) NSCOPD 80 (32.8) 25 (34.7) 5 (45.5) 10 (31.3) 23 (34.8) NSDiabetes mellitus 50 (20.6) 16 (22.2) 0 1 (3.1) 18 (27.3) NSCerebrovascular disease 37 (15.2) 10 (13.9) 3 (27.3) 3 (9.7) 10 (15.4) NSKidney disease 16 (6.6) 5 (6.9) 0 0 2 (3.0) NSLiver disease 15 (6.1) 3 (4.7) 1 (9.1) 2 (6.3) 2 (3.0) NSNeoplasm 18 (7.4) 8 (11.1) 2 (18.2) 0 7 (10.6) NSSmoking 45 (18.6) 6 (8.5) 2 (18.2) 15 (46.9) 9 (14.1) NSNursing home 10 (4.1) 1 (1.4) 1 (9.1) 0 6 (9.1) NS
LOS days (mean7SD) 975 1177 975 873 974 NSMortality n (%) 21 (8.6) 5 (6.9) 0 0 9 (13.6) NSRe-admission n (%) 15 (6.2) 10 (13.9) 0 3 (9.4) 4 (6.1) NS
Hospital n (%)a
A 138 (60.3)b 48 (21.0)b 8 (3.5) 9 (3.9)b 26 (11.4)b
B 28 (38.4) 11 (15.1) 0 11 (15.1) 23 (31.5)C 30 (51.7) 9 (15.5) 0 8 (13.8) 11 (19.0)D 48 (73.8) 4 (6.2) 3 (4.6) 4 (6.2) 6 (9.2)
Total n (%) 244 (57.4) 72 (16.9) 11 (2.6) 32 (7.5) 66 (15.5)
COPD: chronic obstructive pulmonary disease; LOS: length of stay.aComparison among hospitals of each antibiotic regimen.bpo0.05.
Table 3 Description and comparison of initial empiricaltreatment according to low or high risk class.
Antibiotic regimen PSI I–III PSI IV–V p-Valuen (%) n (%)
Beta-lactam+macrolide 91 (52) 153 (61) 0.04n ¼ 244 (57%)Beta-lactam monotherapy 28 (16) 44 (18) 0.6n ¼ 72 (17%)Quinolone 4 (2) 7 (3) 0.7n ¼ 11 (3%)Macrolide monotherapy 24 (14) 8 (3) 0.0001n ¼ 32 (7%)Other regimens 29 (16) 37 (15) 0.6
n ¼ 66 (16%)Total 176 (100) 249 (100)
PSI I–III: Pneumonia severity index (classes I–III).PSI IV–V: Pneumonia severity index (classes IV–V).
S. Reyes Calzada et al.1912
Mortality
Overall mortality was 8.2%, with no significant differencesamong hospitals. Mortality in adherent group was 26 (8.2%)
and in non-adherent group was 9 (8.5%) p ¼ 0.9, and nodifferences were found after stratifying for PSI either. Theglobal mortality for each antibiotic regimen and accordingto PSI is shown in Table 4. No significant differences in globalmortality were seen among the different treatment regi-mens. In the low-risk group, higher mortality was foundamong the patients treated with beta-lactam monotherapy(7.1%), although it was not statistically significant. In thehigh-risk group (Fine classes IV–V), mortality was higher inthe group administered other regimens (24.3%), p ¼ 0.02.A detailed 30-day mortality analysis was made for eachantibiotic regimen (Fig. 1). This figure compares actual andpredicted mortality rates. Actual mortality for all antibioticregimens was seen to be lower than the predicted value,except for the other regimens group. In this latter group,actual mortality was greater than predicted from PSI, with a30.2% increase in deaths.
Length of stay
The median LOS was 8 days. The median LOS in adherentgroup and in non-adherent group was 8 days, p ¼ 0.6.On analysing LOS by hospitals, shorter stays were recordedin hospital D, with a median of 6 days, p ¼ 0.0001.There were no statistically significant differences in LOSwith respect to the different antibiotic regimens and PSI,p ¼ 0.4 (Table 4).

ARTICLE IN PRESS
0
0
9.5
13.2
11.71
8.8
10.2
13.6
6.9
8.6
0 4 8 10 122 14 16
Other regimens
Macrolide monotherapy
Quinolone
Beta-lactam monotherapy
Beta-lactam+macrolide
Ant
ibio
tic re
gim
en
Mortality(%)
Predicted mortality Actual mortality
6
Figure 1 Actual and predicted 30-day mortality for each antibiotic regimen.
Table 4 Mortality, length of hospital stay and re-admission according to antibiotic treatment and PSI.
Antibiotic regimen Mortality n (%) LOS (median)a Re-admission n (%)b
PSI: I–III PSI: IV–V PSI: I–III PSI: IV–V PSI: I–III PSI: IV–V
Beta-lactam+ macrolide 1 (1.1) 20 (13.1) 8 8 4 (1.7) 11 (4.5)Beta-lactam monotherapy 2 (7.1) 3 (6.8) 8 9 4 (5.6) 6 (8.3)Quinolone 0 0 8 8 0 0Macrolide monotherapy 0 0 8 8 1 (3.1) 2 (6.3)Other regimens 0 9 (24.3)c 8 8 0 4 (6.1)
Total 3 (1.7) 32 (12.9) 8 8 9 (2.1) 23 (5.4)
PSI: Pneumonia severity index; LOS: length of stay.ap ¼ 0.4: comparison median LOS in low-risk patients versus high-risk group.bp ¼ 0.07: comparison re-admission in low-risk patients 2.1% versus 5.4% in the high-risk group.cp ¼ 0.02: in the high-risk group, mortality was greater in the group administered other regimens (24.3%).
Treatment of pneumonia. Impact on outcome 1913
Re-admission
Thirty-two patients were readmitted within 30 days afterhospital discharge (7.6%). The re-admission in adherentgroup was 7 (6.6%) and in non-adherent group was 25 (7.9%),p ¼ 0.6. The distribution by hospitals was: 17 patients inhospital A (7.5%), 6 in hospital B (8.3%), 6 in hospital C(10.3%), and 3 patients in hospital D (4.6%), p ¼ 0.6. Nosignificant differences were found in re-admission withrespect to the initial treatment regimen used. However,re-admission was related to initial severity (2.1% re-admission in low-risk patients versus 5.4% in the high-riskgroup), though not to a statistically significant difference(p ¼ 0.07) (Table 4).
Multivariate analysis
Three logistic regression analyses were made to predictmortality, re-admission and prolonged LOS. The independentrisk factors for mortality were PSI (OR ¼ 11.1, 95% CI2.6–48.1), and treatment with other regimens (OR ¼ 3,1.2–7.3). Beta-lactam monotherapy was found to be anindependent risk factor for re-admission (OR ¼ 2.7, 1.2–6.1),and in the third model, admission to hospital D was found tobe protective for prolonged LOS (OR ¼ 0.2, 0.1–0.5).
Discussion
The most relevant findings of the present study are: (1) themost widely used antibiotic regimen was the combination ofbeta-lactam plus macrolide, though there was considerableheterogeneity in antibiotic regimens. (2) Rates of adherenceto guidelines of the SEPAR were high, but differed among thehospitals. (3) Patients treated with other regimens had anincreased mortality risk (OR ¼ 3, 1.2–7.3). (4) Beta-lactammonotherapy was independently associated with re-admis-sion. (5) LOS was not independently influenced by empirictreatment and it was related to the admitting hospital.
The characteristics of study population were similar in allfour hospitals, and similar to those of other studies of CAP inhospitalized subjects. The choice of empirical treatmentwas based on the guidelines of the SEPAR6,7 in a largepercentage of patients (76.5%), though with differences inadherence among the four hospitals.
The global results show the most common treatmentregimen to be the combination of a beta-lactam plusmacrolide, similar to the findings of other studies.5,13
Nevertheless, it should be pointed out that in 9–31% ofcases, antibiotic regimens different from those recommendedby the Spanish guidelines were used. Thus, in hospital B,more alternative antibiotic regimens were prescribed, due toan increased use of second-generation cephalosporins plus

ARTICLE IN PRESS
S. Reyes Calzada et al.1914
a macrolide. Although this practice does not adhere toSpanish guidelines, it does comply with the previous Amer-ican guidelines.23 Besides inertia to previous practice, Cabanaet al.24 analysed the reasons for non-adherence to guidelines.They found out many potential barriers to physician guidelineadherence, including lack of awareness, familiarity, agree-ment, self-efficacy and outcome expectancy. In a recentpublication, it has been found that other non-pneumologistspecialists had a lower adherence to guidelines compared topneumologists and residents.25 Unfortunately, in the currentstudy we have not specifically investigated these reasons.
The distribution of the antibiotic regimens according toPSI was similar in both the low and high-risk groups, with theexception of an increased use of macrolide monotherapy inlowest risk classes.
The mortality rate in our study (8.2%) was similar to thatreported by other authors,26–29 and was adjusted to the PSI.Noteworthy, mortality was greater (though not statisticallysignificant) in patients administered other regimens. Otherauthors have previously reported lower mortality whentreatment adheres to the guidelines.4,13,30
A detailed analysis of the antibiotic regimens employed inour study shows global mortality to be greater among thepatients administered other regimens (13.6% versus 8.2%).On analysing the high-risk patients, mortality among thosereceiving other regimens was seen to increase significantly(24.3% versus 6.8% and 13.1%). In fact, the difference foreach antibiotic regimen between actual and PSI-predictedmortality (Fig. 1) clearly reflects the increased mortality inthose treated with other non-adherent regimens. Theopposite was observed for the rest of antibiotic regimens,where actual mortality was lower than predicted byPSI. Likewise, other authors4,10,14 also reported increasedmortality in the group of patients administered otherregimens. In the multivariate analysis to predict mortalityfollowing adjustment for PSI, other regimens were indepen-dently associated to increased mortality (OR ¼ 3, 1.2–7.3).
In the low risk patients, mortality among those treatedwith macrolides and quinolones as monotherapy was lowerthan in those administered beta-lactam monotherapy,though statistical significance was not reached. However,these findings should be interpreted with caution, due to thefew patients treated with this regimen, and in view of thelow mortality inherent to low PSI.
The LOS showed no significant differences for thedifferent antibiotic regimens. In fact, the hospital wherethe patient was admitted exerted greater influence. TheLOS was shorter in hospital D (OR ¼ 0.2, 0.1–0.5), and wasunrelated to adherence or non-adherence to the guidelinesor to the use of macrolides. Several investigators12,15,31,32
found shorter LOS in patients treated with macrolides,though not all authors corroborate this finding.18 Probably,the LOS is more dependent upon factors inherent to thepatient and to the hospital involved.33–35 Despite differ-ences in LOS among hospitals, we did not find differences onmortality.35 A clinical pathway was successful in reducingconsumption of resources and LOS without causing adverseeffect on mortality and re-admissions.36
The rate of overall re-admission was 7.6%, and tended tobe greater among patients given beta-lactam monotherapy,especially in severe CAP (classes IV and V). The multivariatestudy showed beta-lactam monotherapy to be an indepen-
dent risk factor for re-admission. Hardly any data are foundin the literature on re-admission in CAP and the differentantibiotic regimens used.37
Among the limitations of the present study, mentionshould be made of the few patients treated with quinolones,coincident with the withdrawal of some of these drugs (e.g.,trovafloxacin) from the market. Therefore, the results ofthis group of antibiotics should not be extrapolated to thecurrent situation. Since our study was not randomized, thedegree of evidence is not the best, though it would not havebeen ethical to apply such a design in which a group ofpatients would be administered antibiotic regimens notrecommended by the guidelines.
In conclusion, important adherence to the hospitalizedCAP treatment guidelines is observed, though with con-siderable variability in the empirical antibiotic treatmentsused in daily clinical practice. Regimens not adhering to theguidelines are associated with greater mortality in CAP andnot related to LOS. The beta-lactams are associated withincreased re-admission, though further studies are neededto confirm this finding. LOS was related to the hospital morethan to the antimicrobial treatment.
References
1. Inebase database. Instituto Nacional de Estadıstica. Defun-ciones segun la causa de muerte 2004. Available from: /http://www.ine.es/inebase/cgi/axiS.
2. Minino A, Heron M, Smith B, Minino AM, Heron MP, Smith BL.Deaths: preliminary data for 2004. Natl Vital Stat Rep2006;54:19 Available from: /http://www.cdc.gov/nhc/data/nvsr/nvsr54/nvsr54_19.pdfS.
3. Ambrosino N, Armaganidis A, Beurskens H, et al. Pneumonia.En: Eur Lung White Book 2003:55–65.
4. Dean NC, Silver MP, Bateman KA, James B, Hadlock CJ, Hale D.Decreased mortality after implementation of a treatmentguideline for community-acquired pneumonia. Am J Med 2001;110:451–7.
5. Rello J, Catalan M, Diaz E, Bodi M, Alvarez B. Associationsbetween empirical antimicrobial therapy at the hospital andmortality in patients with severe community-acquired pneumo-nia. Intensive Care Med 2002;28:1030–5.
6. Dorca J, Bello S, Blanquer J, et al. The diagnosis and treatment ofcommunity-acquired pneumonia. SEPAR. Sociedad Espanola deNeumologia y Cirugia Toracica. Arch Bronconeumol 1997;33:240–6.
7. Frias J, Gomis M, Prieto J, et al. Initial empirical antibiotictreatment of community-acquired pneumonia. Rev Esp Quimio-ter 1998;11:255–61.
8. Mandell LA, Bartlett JG, Dowell SF, File Jr. TM, Musher DM,Whitney C. Update of practice guidelines for the managementof community-acquired pneumonia in immunocompetentadults. Clin Infect Dis 2003;37:1405–33.
9. Niederman MS, Mandell LA, Anzueto A, et al. Guidelines for themanagement of adults with community-acquired pneumonia.Diagnosis, assessment of severity, antimicrobial therapy, andprevention. Am J Respir Crit Care Med 2001;163:1730–54.
10. Gleason PP, Meehan TP, Fine JM, Galusha DH, Fine MJ.Associations between initial antimicrobial therapy and medicaloutcomes for hospitalized elderly patients with pneumonia.Arch Intern Med 1999;159:2562–72.
11. Waterer GW, Somes GW, Wunderink RG. Monotherapy may besuboptimal for severe bacteremic pneumococcal pneumonia.Arch Intern Med 2001;161:1837–42.
12. Brown RB, Iannini P, Gross P, Kunkel M. Impact of initialantibiotic choice on clinical outcomes in community-acquired

ARTICLE IN PRESS
Treatment of pneumonia. Impact on outcome 1915
pneumonia: analysis of a hospital claims-made database. Chest2003;123:1503–11.
13. Menendez R, Ferrando D, Valles JM, Vallterra J. Influence ofdeviation from guidelines on the outcome of community-acquired pneumonia. Chest 2002;122:612–7.
14. Dudas V, Hopefl A, Jacobs R, Guglielmo BJ. Antimicrobialselection for hospitalized patients with presumed community-acquired pneumonia: a survey of nonteaching US communityhospitals. Ann Pharmacother 2000;34:446–52.
15. Stahl JE, Barza M, DesJardin J, Martin R, Eckman MH. Effect ofmacrolides as part of initial empiric therapy on length of stay inpatients hospitalized with community-acquired pneumonia.Arch Intern Med 1999;159:2576–80.
16. Martinez JA, Horcajada JP, Almela M, et al. Addition of amacrolide to a beta-lactam-based empirical antibiotic regimenis associated with lower in-hospital mortality for patients withbacteremic pneumococcal pneumonia. Clin Infect Dis 2003;36:389–95.
17. Menendez R, Torres A, Zalacain R, et al. Risk factors oftreatment failure in community acquired pneumonia: implica-tions for disease outcome. Thorax 2004;59:960–5.
18. Frei CR, Koeller JM, Burgess DS, Talbert RL, Johnsrud MT. Impactof atypical coverage for patients with community-acquiredpneumonia managed on the medical ward: results from theUnited States community-acquired pneumonia project. Phar-macotherapy 2003;23:1167–74.
19. Weiss K, Tillotson GS. The controversy of combination vsmonotherapy in the treatment of hospitalized community-acquired pneumonia. Chest 2005;128:940–6.
20. Shefet D, Robenshtok E, Paul M, Leibovici L. Empirical atypicalcoverage for inpatients with community-acquired pneumonia:systematic review of randomized controlled trials. Arch InternMed 2005;165:1992–2000.
21. Mills GD, Oehley MR, Arrol B. Effectiveness of beta lactamantibiotics compared with antibiotics active against atypicalpathogens in non-severe community acquired pneumonia:meta-analysis. BMJ 2005;330:456.
22. Fine MJ, Auble TE, Yealy DM, et al. A prediction rule to identifylow-risk patients with community-acquired pneumonia. N Engl JMed 1997;336:243–50.
23. Niederman MS, Bass Jr. JB, Campbell GD, et al. Guidelines forthe initial management of adults with community-acquiredpneumonia: diagnosis, assessment of severity, and initialantimicrobial therapy. American Thoracic Society. Medicalsection of the American Lung Association. Am Rev Respir Dis1993;148:1418–26.
24. Cabana MD, Rand CS, Powe NR, et al. Why don’t physiciansfollow clinical practice guidelines? A framework for improve-ment. JAMA 1999;282:1458–65.
25. Menendez R, Torres A, Zalacain R, et al. Guidelines for thetreatment of community-acquired pneumonia: predictors ofadherence and outcome. Am J Respir Crit Care Med 2005;172:757–62.
26. Almirall J, Morato I, Riera F, et al. Incidence of community-acquired pneumonia and Chlamydia pneumoniae infection:a prospective multicentre study. Eur Respir J 1993;6:14–8.
27. Lim WS, van der Eerden MM, Laing R, et al. Defining communityacquired pneumonia severity on presentation to hospital: aninternational derivation and validation study. Thorax 2003;58:377–82.
28. Espana PP, Capelastegui A, Gorordo I, et al. Development andvalidation of a clinical prediction rule for severe community-acquired pneumonia. Am J Respir Crit Care Med 2006;174:1249–56.
29. Zalacain R, Torres A, Celis R, et al. Community-acquiredpneumonia in the elderly: Spanish multicentre study. Eur RespirJ 2003;21:294–302.
30. Mortensen EM, Restrepo M, Anzueto A, Pugh J. Effects ofguideline-concordant antimicrobial therapy on mortality amongpatients with community-acquired pneumonia. Am J Med2004;117:726–31.
31. Lentino JR, Krasnicka B. Association between initial empiricaltherapy and decreased length of stay among veteran patientshospitalized with community acquired pneumonia. Int J Anti-microb Agents 2002;19:61–6.
32. Trowbridge JF, Artymowicz RJ, Lee CE. Antimicrobial selectionand length of hospital stay in patients with community-acquiredpneumonia. J Clin Outcomes Manage 2002;9:613–9.
33. Menendez R, Ferrando D, Valles JM, Martinez E, PerpinaM. Initial risk class and length of hospital stay in community-acquired pneumonia. Eur Respir J 2001;18:151–6.
34. Menendez R, Cremades MJ, Martinez-Moragon E, Soler JJ, ReyesS, Perpina M. Duration of length of stay in pneumonia: influenceof clinical factors and hospital type. Eur Respir J 2003;22:643–8.
35. McCormick D, Fine MJ, Coley CM, et al. Variation in length ofhospital stay in patients with community-acquired pneumonia:are shorter stays associated with worse medical outcomes? Am JMed 1999;107:5–12.
36. Marrie TJ, Lau CY, Wheeler SL, Wong CJ, Vandervoort MK,Feagan BG. A controlled trial of a critical pathway fortreatment of community-acquired pneumonia. CAPITAL studyinvestigators. Community-acquired pneumonia interventiontrial assessing levofloxacin. JAMA 2000;283:749–55.
37. Ruiz A, Falguera M, Sacristan O, et al. Community-acquiredpneumonia: usefulness of clinical presentation in theselection of antibiotic treatment. Med Clin (Barc) 2002;119:641–3.


Tesis Doctoral
Soledad María Reyes Calzada Página 26
ARTICULO 2


Determinants of hospital costs in
community-acquired pneumoniaS. Reyes*,#, R. Martinez*, J.M. Valles", E. Cases* and R. Menendez*,+
ABSTRACT: Community-acquired pneumonia (CAP) has a high incidence and involves an
important consumption of healthcare resources. The present authors analysed the influence of
comorbidity, initial severity and complications upon the direct costs associated with hospitalised
CAP patients.
Direct hospitalisation costs (room cost, treatment, laboratory and diagnostic tests) were assessed
in a prospective, observational study of 271 patients admitted to a hospital ward due to CAP.
The mean¡SD patient age was 70¡15 yrs. The mortality rate was 11.1%. Complications were
found in 72.3% and comorbidities in 74.9%. The median (interquartile range) total cost was J1,683
(J1,291–2,471) and the component costs were: room cost J1,286 (J857–1,714); laboratory tests
J212 (J171–272); treatment J187 (J114–304); and diagnostic procedures J58 (J29–122).
Complications and higher Pneumonia Severity Index increased the costs, but age and
comorbidity did not. A logistic regression analysis to predict high cost (.J1,683) showed that
infectious (odds ratio 6.8, 95% confidence interval 1.3–36), digestive (5.9 (1.5–22.8)), pulmonary
(2.6 (1.4–4.7)) and other complications (3.9 (1.8–8.4)) were independent risk factors, as were
previous hospitalisation (2.3 (1.2–4.3)) and hypoalbuminaemia (2 (1.1–3.6)).
Complications, hypoalbuminaemia and previous hospitalisation were the main determinants of
high direct costs of hospitalisation due to community-acquired pneumonia. Neither age nor
comorbidities were independently associated with cost.
KEYWORDS: Community-acquired pneumonia, cost, length of stay, mortality, Pneumonia Severity
Index, treatment
Community-acquired pneumonia (CAP) isa potentially serious disease with a highincidence and a large economic impact on
both direct and indirect costs [1]. The main directcost of the disease is due to hospitalisation ofCAP patients, which can represent up to 90% ofthe global cost associated with CAP [2].
The global components of the direct costs ofhospitalised CAP patients have been analysedrecently [3, 4]. The most important componentsare hospital stay and antibiotic treatment, both ofwhich are influenced by initial disease severityand the clinical course followed by the patientduring hospitalisation. However, in spite of theinterest in determining the causes underlying thedirect costs of hospitalised CAP patients and theadoption of measures designed to restrain thesecosts, to date few studies have conducted adetailed analysis of the impact of comorbiditiesand complications. Such information is important,since patients with comorbidities and/or compli-cations are those most often hospitalised due toCAP. Furthermore, CAP is more frequent inelderly patients with comorbidities, and worsening
of comorbidities is common. In turn, this prolongsthe length of hospital stay (LOS) and increases thedirect costs [5, 6]. Conversely, an ageing popula-tion and increased survival among patients withchronic diseases lead to more complex CAP.
In recent years, a number of publications haveanalysed the economic aspects of CAP, aiming toevaluate costs in outpatients and in thoseadmitted to the hospital or intensive care unit(ICU) [7, 8]. BAUER et al. [4] also found that directcosts correlated with initial severity as measuredby the Pneumonia Severity Index (PSI) [9]. Thepresent authors hypothesise that, in addition tothese factors, the different components of directcosts are also influenced by comorbid conditionsand complications, which would generate highercosts. Thus, identification of the determinants ofhigh health costs could help define strategies forcost reduction or the more efficient use of existingresources [10–12].
The present study provides an analysis from thehospital perspective of the direct costs producedby the hospitalisation of CAP patients and
AFFILIATIONS
*Pneumology Service,"Emergency Service, University
Hospital La Fe, Valencia, and#Dept of Medicine-Doctoral
Programme, Barcelona Autonomous
University, Barcelona,+Centro de Investigacion Biomedica
en Red (CIBER), Ministry of Health,
Spain.
CORRESPONDENCE
S. Reyes
Servicio de Neumologıa
Hospital Universitario La Fe
Avda. Campanar 21
46009 Valencia
Spain
Fax: 34 961973089
E-mail: [email protected]
Received:
August 09 2007
Accepted after revision:
December 11 2007
SUPPORT STATEMENT
This work received financial support
from CIBER-CB06/06/0028.
STATEMENT OF INTEREST
None declared.
European Respiratory Journal
Print ISSN 0903-1936
Online ISSN 1399-3003
EUROPEAN RESPIRATORY JOURNAL VOLUME 31 NUMBER 5 1061
Eur Respir J 2008; 31: 1061–1067
DOI: 10.1183/09031936.00083107
Copyright�ERS Journals Ltd 2008
c

evaluates the influence of advanced age, comorbidities, PSIand complications on the different cost components. Inaddition, the factors causing high costs of hospitalisation dueto CAP are also analysed.
PATIENTS AND METHODS
Study subjectsA prospective observational study was carried out over13 months in a public, tertiary care university hospital(University Hospital La Fe, Valencia, Spain).
The inclusion criteria were a clinical diagnosis compatible withCAP with two or more clinical symptoms and a new infiltrateon the chest radiograph. Patients were excluded if they: wereaged ,18 yrs; were immunodepressed (transplant patients,HIV-infected patients with a CD4+ count of ,100 cells?mL-1,patients receiving immunosuppressors and/or corticoids atdoses of .20 mg?day-1); had lung abscesses; had beenadmitted to hospital in the previous 15 days; or had CAPrequiring admission to the ICU.
The study was approved by the Local Ethics Committee(University Hospital La Fe). Informed consent was notnecessary, since there were no interventions affecting eitherphysicians’ treatment decisions or the patients.
DefinitionsComorbidities were defined from previous studies [9, 13] asfollows: cardiac (involving treatment for coronary artery disease,congestive heart failure or valvular heart disease); pulmonary(treatment for asthma, chronic obstructive pulmonary disease orinterstitial lung disorders); renal (pre-existing kidney diseasewith documented abnormal serum creatinine levels outside thepneumonia episode); hepatic (pre-existing viral or toxic liverdisease); central nervous system disorders (presence of sympto-matic acute or chronic vascular or nonvascular encephalopathy,with or without dementia); diabetes mellitus (diagnosis ofglucose intolerance and treatment with oral antidiabetic drugs orinsulin); and neoplastic disease (any solid tumour active at thetime of presentation or requiring antineoplastic treatment withinthe preceding year). Alcohol abuse was defined as the ingestionof an estimated amount of .80 g alcohol?day-1 for o1 yr beforepresentation. Smokers were defined as current smokers of.10 cigarettes?day-1 for at least the preceding year.
The classification of complications was also based on previousstudies [12, 14]: pulmonary (respiratory failure, arterial oxygentension (Pa,O2) ,7.98 kPa (,60 mmHg), pleural effusion, pul-monary embolism, pneumothorax); cardiovascular (congestiveheart failure, cardiogenic shock, acute myocardial infarction,pericarditis); digestive (gastrointestinal bleeding, diarrhoea,altered liver function); renal (acute renal failure or exacerb-ation of chronic renal failure); infectious (empyema: evidentpus in pleural space); nosocomial infection (endocarditis,arthritis, meningitis); and other complications (diabetic decom-pensation, leukopaenia, anaemia, water-electrolyte disorder,cerebrovascular stroke, etc.).
Data collectionThe following data were collected: patient age and sex,smoking and alcohol habits, influenza vaccination, nursinghome residency, prior hospitalisation, and comorbidities. The
clinical symptoms recorded included cough, expectoration,pleuritic chest pain, dyspnoea, acute confusion, and signs suchas temperature, rales, respiratory and cardiac frequencies, andsystolic and diastolic blood pressure. Laboratory parameterswere also recorded: leukocyte count, sodium, potassium,serum creatinine, plasma urea, glucose, albumin, aspartateaminotransferase/alanine aminotransferase, and arterial bloodgases (Pa,O2, arterial carbon dioxide tension and pH). Initialseverity was calculated with the PSI [9]. The followingevolutive parameters were recorded: complications, LOS, andmortality after 30 days.
Cost calculationsThe cost study was carried out from the hospital perspective.All the direct costs during hospitalisation were analysed, i.e.those related to the consumption of healthcare resources, suchas diagnostic and laboratory tests, treatment and LOS. Theindirect costs associated with work days missed or transport tohospital were not considered.
The tests performed during hospitalisation were quantified andclassified into five groups as follows. 1) Blood tests: completeblood counts, biochemistry, haemostasis, blood gas tests. 2)Microbiological studies: blood and sputum cultures, viralserology and atypical bacteria, urinary antigens of Legionellapneumophila and Streptococcus pneumoniae. 3) Radiological stu-dies: plain radiographs, computed tomography. 4) Endoscopicand invasive techniques: bronchoscopy, thoracocentesis, chestdrainage. 5) ECGs.
The treatment provided was classified as either antibiotictreatment or other treatment. Other treatments included thetreatment of comorbidities, concomitant treatment and treat-ment of complications. In relation to each drug used, thenumber of doses administered and the route of administration(oral, intravenous, intramuscular, subcutaneous or inhaled)were documented.
The LOS in hospital was calculated as the number of days ofadmission, from arrival at the hospital until the day ofdischarge.
The calculated costs were grouped as follows: 1) cost of medi-cation, subclassified as cost of antibiotic treatment and cost ofother treatments; 2) room cost; 3) cost of laboratory tests (bloodtests and microbiological studies); and 4) cost of diagnostictests (radiological studies, endoscopic and invasive techniques,and ECGs). The total hospital cost was calculated as the sum ofthe categories above. All costs were calculated in Euros (J) forthe year 2002. The medication costs were calculated as themedian cost of the drugs for the hospital during 2002 (dataprovided by the Pharmacy Service of the University HospitalLa Fe). The costs of the radiological, microbiological and otherrelevant tests were obtained from the official fees of theServicio Valenciano de Salud [15] (table 1). The cost per day ofhospital stay was provided by the Servicio Valenciano deSalud for the study hospital [15].
Statistical analysisThe cost results are expressed as median (interquartile range).Qualitative variables were compared using the Chi-squaredtest, and quantitative variables were compared using anunpaired t-test or the Mann–Whitney U-test, where
COSTS IN CAP S. REYES ET AL.
1062 VOLUME 31 NUMBER 5 EUROPEAN RESPIRATORY JOURNAL

appropriate. The correlation between variables was analysedusing Spearman correlation analysis. Differences in quantita-tive variables were assessed by ANOVA or with a Kruskal–Wallis test, as appropriate. A p-value of ,0.05 was consideredsignificant.
Uni- and multivariate statistical analyses were carried out forthe clinical variables, comorbidities and complications regis-tered in the protocol, and for high cost of CAP. High cost wasdefined as cost in excess of the median of the cohort (.J1,683)and was the dependent variable in a stepwise logisticregression analysis. Independent variables were those foundto be significant in the univariate analysis and others consideredclinically relevant, such as comorbid conditions and advancedage. Independent variables were introduced in the model anddichotomised as follows: advanced age (o70 yrs: yes/no);respiratory failure (Pa,O2 ,7.98 kPa (,60 mmHg): yes/no);hypoalbuminaemia (f3 mg?dL-1: yes/no); raised urea (f42 mg?
dL-1: yes/no), and hyperglycaemia (f129 mg?dL-1: yes/no). PSIwas categorised into high-risk classes (IV, V) or low-riskclasses (I–III). The Hosmer and Lemeshow goodness-of-fittest was performed for each model [16].
RESULTSStudy populationThe study included 271 patients hospitalised due to CAP, whosedemographic characteristics, comorbidity, PSI [9], complicationsand mortality are reported in table 2. An aetiological diagnosiswas reached in 35 (12.9%) patients; the most frequently foundmicroorganisms were: S. pneumoniae (n522, 8.1%), Enterococcusfaecalis (n53, 1.1%), Staphylococcus aureus (n52, 0.7%),Pseudomonas aeruginosa (n52, 0.7%), Haemophilus parainfluenzae(n52, 0.7%), L. pneumophila (n51, 0.4%), and other microorgan-isms (n54, 1.5%). Bacteraemia was detected in 16 (5.9%)patients. Comorbidity was found in 203 (74.9%) patients, asingle comorbid condition existed in 122 (45%) patients, and two
or more existed in 81 (29.9%) patients. Complications, shown intable 2, appeared in 196 (72.3%) patients. Among the pulmonarycomplications, 100 (36.9%) patients presented with respiratoryfailure, and 42 (17%) presented with pleural effusion.Cardiovascular complications were congestive heart failure(n541, 15.1%) and cardiogenic shock (n510, 3.7%); digestivecomplications were liver disorders (n57, 2.6%), bleeding (n56,2.2%) and diarrhoea (n59, 3.3%); infectious complicationscomprised nosocomial infection (n56, 2.2%), empyema (n55,1.8%), meningitis (n51, 0.4%) and endocarditis (n51, 0.4%). Intotal, 30 (11.1%) patients died.
Cost resultsThe median (interquartile range; IQR) total cost of the cohortwas J1,683 (J1,291–2,471). The distribution of each componentwas as follows: room cost J1,286 (J857–1,714); laboratory testsJ212 (J171–272); treatment J187 (J114–304; antibiotic treat-ment J138 (J81–229) and other treatments J38 (J17–68)); anddiagnostic procedures J58 (J29–122). The percentage of the
TABLE 1 Cost of diagnostic tests
Cost (J)
Blood tests
Complete blood count 6.74
Biochemistry 21.40
Haemostasis 15.00
Blood gases 30.00
Microbiological tests
Blood culture 15.52
Sputum culture, bronchial aspirate 13.39
Serology, urine antigens 5.85
Imaging techniques
Chest or abdominal radiographs 9.23
CT 71.10
ECG 3.93
Invasive techniques
Bronchoscopy 82.94
Thoracocentesis 54.00
Chest drainage 95.60
CT: computed tomography.
TABLE 2 Demographic characteristics, comorbidity,Pneumonia Severity Index (PSI), length of stay(LOS), complications and mortality duringhospital admission
Characteristics
Subjects n 271
Age yrs 70¡15
Sex M/F 161 (59.4) / 110 (40.6)
Smoker 41 (15.1)
Alcohol abuse 41 (15.1)
Nursing home 8 (3.0)
Comorbidity
Neoplasm 13 (4.8)
Liver disease 9 (3.3)
Cardiovascular disease 89 (32.8)
Cerebrovascular disease 31 (11.4)
Kidney disease 16 (5.9)
Diabetes 57 (21.0)
COPD 69 (25.5)
PSI
I 22 (8.1)
II 36 (13.3)
III 53 (19.6)
IV 113 (41.7)
V 47 (17.3)
LOS median days 9
Hospital complications
Pulmonary 142 (52.4)
Renal 21 (7.7)
Cardiovascular 51 (18.8)
Digestive 22 (8.1)
Infectious 13 (4.8)
Others 55 (20.3)
Mortality 30 (11.1)
Data are presented as mean¡SD or n (%), unless otherwise stated. M: male;
F: female; COPD: chronic obstructive pulmonary disease.
S. REYES ET AL. COSTS IN CAP
cEUROPEAN RESPIRATORY JOURNAL VOLUME 31 NUMBER 5 1063

total cost corresponding to each component was as follows:room cost 69.3%, laboratory tests 11.9%, treatment 13.1%, anddiagnostic procedures 5.7%.
The median (IQR) total cost in patients with an aetiologicaldiagnosis was significantly greater than that of patients withan unknown diagnosis (J2,102 (J1,485–3,485) versus J1,645(J1,261–2,286); p50.01). Of these, the components with signifi-cantly greater costs were: laboratory tests (J265 (J190–317) versusJ205 (J168–262); p50.001); diagnostic procedures (J107 (J42–234) versus J53 (J29–116); p50.009); and room cost (J1,714(J1,000–2,000) versus J1,143 (J857–1,714); p50.01). No signifi-cant differences were found in the costs according to the causalmicroorganism. However, the median (IQR) total cost ofbacteraemia patients was significantly higher compared withnonbacteraemia patients (J2,083 (J1,507–3,775) versus J1,628(J1,231–2,402); p50.04). When these were broken down intocomponents, the costs were greater in laboratory tests (J256(J196–384) versus J213 (J175–271); p50.049) and room cost(J1,714 (J1,143–2,429) versus J1,143 (J857–1,714); p50.03).
The costs according to patient age, sex, influenza vaccination,comorbidity and complications are described and compared intable 3. A tendency towards increased cost was recordedamong patients .70 yrs of age, although statistical significancewas not reached. The influenza vaccination was not signifi-cantly related to initial severity, LOS or costs. The median (IQR)total cost of patients without comorbidity, with a singlecomorbidity and with two or more comorbidities were J1,631(J1,304–2,218), J1,637 (J1,180–2,320) and J1,771 (J1,386–2,695),respectively (p50.03).
The direct health costs according to the PSI are reported intable 4. A positive correlation was found between the total cost(rho50.15, p50.009) as well as the cost of each component,except diagnostic studies, and the PSI, i.e. the higher the riskclass, the greater the cost.
The median (IQR) total cost of uncomplicated pneumonias wasJ1,295 (J1,055–1,637) versus J1,692 (J1,392–2,083) in patientswith a single complication, and J2,111 (J1,485–3,007) in patientswith two or more complications (p50.0001; table 5). Thedifferences were significant for each of the cost components.The total costs according to the type of complication are depictedin table 3; infectious, renal and cardiovascular complications hadthe highest costs.
The median total cost in survivors was J1,690 (J1,294–2,313), andin nonsurvivors J1,574 (J978–3,476; p50.9). There were sig-nificant differences in the following components of the costbetween survivors and nonsurvivors: treatment (J177 (J113–281)versus J353 (J123–584); p50.004); nonantibiotic treatment (J33(J15–66) versus J63 (J23–271); p50.001); and laboratory costs(J205 (J168–265) versus J260 (J204–298); p50.003). However, nodifference in the cost of hospital stay was found (J1,286 (J857–1,714) versus J1,000 (J429–2,286); p50.1), although the LOS wasgreater for the survivors (median 9 days) than for the nonsurvi-vors (median 7 days).
Factors related to high costUnivariate analysis
Advanced patient age, sex, toxic habits, nursing homeresidency and comorbidities were not significantly associated
TABLE 3 Hospital costs according to patient age and sex, and presence of comorbidities and complications
Presence of comorbidities/complications Yes No p-value#
Males 1636 (1177–2392) 1812 (1370–2533) 0.2
Age f70 yrs 1548 (1178–2281) 1804 (1367–2548) 0.06
Influenza vaccination 1796 (1371–2483) 1547 (1333–2786) 0.6
Comorbidities
Neoplasm 1291 (1030–2059) 1691 (1328–2513) 0.1
Liver disease 1426 (1173–2148) 1691 (1292–2504) 0.4
Heart failure 1700 (1343–2695) 1665 (1229–2292) 0.5
Central nervous system 1833 (1291–2730) 1655 (1278–2354) 0.2
Renal disease 1696 (1337–2433) 1674 (1273–2471) 0.7
Diabetes 1700 (1378–2715) 1665 (1271–2367) 0.4
COPD 1771 (1320–2674) 1658 (1271–2274) 0.2
Complications
Pulmonary 1996 (1394–2843) 1485 (1122–1979) 0.001
Pleural effusion 2324 (1487–3321) 1630 (1250–2206) 0.001
Respiratory failure 1846 (1380–2665) 1533 (1175–2140) 0.004
Infectious 2783 (2045–6161) 1645 (1271–2332) 0.005
Empyema 2075 (1531–2892) 1666 (1287–2427) 0.3
Nosocomial infection 3405 (1728–5716) 1659 (1282–2392) 0.06
Cardiovascular 2691 (1375–3485) 1634 (1261–2154) 0.002
Digestive 2591 (1755–3807) 1634 (1263–2275) 0.002
Renal 2744 (1414–3616) 1655 (1271–2292) 0.04
Others 2068 (1516–3607) 1620 (1182–2223) 0.0001
Data are presented as median (interquartile range) cost in Euros, unless otherwise stated. COPD: chronic obstructive pulmonary disease. #: Mann–Whitney U-test.
COSTS IN CAP S. REYES ET AL.
1064 VOLUME 31 NUMBER 5 EUROPEAN RESPIRATORY JOURNAL

with high cost in CAP. In contrast, prior hospitalisation wasassociated with higher cost (median J1,624 versus J1,888;p50.01). A higher PSI was also associated with high cost(p50.01; table 4). The laboratory test disorders found inpatients with high costs were: raised urea (p50.01), hypergly-caemia (p50.007), respiratory failure (p50.002), and hypoal-buminaemia (p50.0001). The median cost of all complications(pulmonary, infectious, cardiovascular, digestive, renal andothers) was significantly associated with high cost (p50.0001).
Multivariate analysisThe following independent variables were included in themodel because they proved significant in the univariateanalysis: prior hospitalisation, respiratory failure, hypoalbumi-naemia, raised urea, hyperglycaemia, PSI and complications.Advanced age and comorbidities (found to be nonsignificant)were also included because they were study objectives. Themathematical model selected the following variables as beingassociated with high cost (table 6): infectious, digestive,pulmonary and other complications, hypoalbuminaemia andprior hospital admission. The Chi-squared goodness-of-fitanalysis demonstrated the adequacy of the model (p.0.05).
DISCUSSIONThe most relevant findings of the present study can besummarised as follows. 1) The median (IQR) total cost ofhospitalised CAP patients was J1,683 (J1,291–2,471), and LOSgenerated the highest direct cost (69.3%). 2) Complications,particularly of an infectious nature, significantly and indepen-dently increased the direct costs of hospitalised CAP patients. 3)Neither patient age nor comorbidities was independentlyassociated with high cost. 4) Hospital admission in the precedingyear and hypoalbuminaemia also raised costs.
The annual financial burden of pneumonia was estimated bythe European Respiratory Society to be J10.1 billion in Europe;in-patient care costs accounted for J5.7 billion of this amount[1]. In Spain, MONGE and co-workers [17, 18] recorded 53,000annual hospital admissions due to CAP, with an annualhealthcare cost of ,J115 million. In the present study, thedocumented costs were slightly higher than those reported inthe national and European literature. In other studies carriedout in Spain, the direct costs of in-patient care were J1,210 [8]and J1,553 [7]. In Europe, the direct costs ranged from J1,333
in Germany [4] to J2,550–7,650 in the UK [19]. Nevertheless,the European costs were significantly lower than thosereported for hospitals in the USA, despite longer averagestays [3, 20, 21]. In a prospective study of four hospitals in theUSA, FINE et al. [3] recorded a median total cost of J4,468 forhospitalised CAP patients.
Hospital admission due to CAP is dependent upon a numberof factors, such as PSI, comorbidities and complications. Inelderly subjects, admission is decided based on the associatedcomorbidities and complications, both of which are morefrequent in this population group [21–23]. However, in youngadults, an increased probability of admission is determined bythe presence of serious complications and, to a lesser extent, bycomorbidities [22, 24].
The contribution of each of these factors, comorbidities, PSIand complications, to the total cost of hospitalised CAPpatients has not been extensively investigated, althoughprevious studies have analysed the effect of patient age.BARTOLOME et al. [7] reported significantly higher costs inpatients .65 yrs of age, although no details were provided onthe impact of severity or comorbidities. Likewise, NIEDERMAN
et al. [23] also found in-patient cost in patients aged .65 yrs toreach US$305 million versus US$192 million in those ,65 yrs ofage. This difference in cost was fundamentally attributable tothe higher percentage of admissions and the longer duration ofstay for more elderly subjects. However, the impact ofcomorbidity on cost was only confirmed in those patientsrequiring respiratory services, possibly in relation to the longerLOS. While the results of the present study show a tendencytowards increased cost among patients aged .70 yrs, thedifference did not reach statistical significance, and age wasnot selected as an independent variable by the multivariateanalysis. Moreover, the presence of two or more comorbiditiesdid not cause a significant increase in hospital costs.
In the present study, an increase in total cost was shown forpatients with increased severity of CAP, and for patients withmore complications. BAUER et al. [4] reported greater costs forpatients with severe pneumonia requiring admission to ICU,compared with patients with less severe pneumonia, mainly dueto longer LOS in hospital (US$2,300 versus US$1,242; p,0.001).KAPLAN et al. [22] also found patients with complicated CAP
TABLE 4 Direct costs and Pneumonia Severity Index (PSI)
PSI
Total I II III IV V p-value#
Medication costs 187 (114–304) 116 (64–244) 121 (64–244) 181 (129–297) 194 (123–282) 262 (136–419) 0.001
Antibiotic treatment 138 (81–229) 109 (55–173) 109 (54–216) 138 (95–237) 143 (76–213) 158 (100–290) 0.02
Other treatments 38 (17–68) 17 (4–37) 16 (7–37) 37 (21–62) 43 (20–75) 55 (23–148) 0.001
Laboratory test costs 212 (172–272) 190 (143–251) 173 (146–229) 196 (164–265) 219 (178–285) 232 (190–310) 0.001
Diagnostic test costs 58 (29–122) 65 (36–199) 60 (33–162) 52 (24–101) 65 (33–122) 73 (22–118) 0.7
Hospital stay costs 1286 (857–1714) 1071 (571–1464) 1143 (750–1429) 1143 (857–1786) 1286 (857–1786) 1429 (857–2286) 0.02
Total CAP costs 1683 (1291–2471) 1531 (1130–2053) 1602 (1078–2048) 1630 (1341–2469) 1804 (1353–2507) 1972 (1231–3297) 0.0009
Data are presented as median (interquartile range) cost in Euros, unless otherwise stated. CAP: community-acquired pneumonia. #: Spearman correlation.
S. REYES ET AL. COSTS IN CAP
cEUROPEAN RESPIRATORY JOURNAL VOLUME 31 NUMBER 5 1065

(admission to ICU or the need for mechanical ventilation) torequire longer hospital stays, resulting in increased costscompared with patients with uncomplicated CAP (US$8,725versus US$3,754). Although the present study did not includepatients admitted to the ICU, an increased cost in patients with ahigh PSI, due to an increased number of tests and a longer LOS,was confirmed. KAPLAN et al. [22] also found that patients .65 yrsof age with comorbidity presented more complications.However, this finding is also explained by the fact that the PSIwas higher in this group.
The percentage of complicated pneumonias in the presentcohort of patients was high (72.3%), similar to the figuresreported in the literature [14]. Infectious complications causedthe highest direct total costs, particularly nosocomial infection(J3,405). It is well known that, while the incidence ofnosocomial infection is low in CAP, it is a cause of treatmentfailure and seriously worsens the prognosis [13]. The presentauthors found this complication to increase the cost up to six-fold, due to the need for more tests and treatments, and,especially, due to a prolongation of LOS [25]. However, theabsolute impact of pulmonary, cardiac and renal complicationson the global cost of CAP was higher, since they producedsignificant cost increases, and mainly because their incidencewas much higher. Furthermore, it was not uncommon to findmore than one complication, a condition which in turngenerated a greater cost increase.
The multivariate analysis confirmed that infectious (odds ratio(OR) 6.8), digestive (OR 5.9), pulmonary (OR 2.6) and othercomplications (OR 3.9) are the strongest independent riskfactors for high cost. In addition, two other variables withindependent effects were identified in the mathematicalmodel: hypoalbuminaemia (OR 2.0) and previous hospitaladmission (OR 2.3). Low plasma albumin is associated withmore severe CAP, and is common in the elderly. It contributesto a slower clinical response to treatment and a poorerprognosis [6, 26]. CABRE et al. [27] found prior hospitalisationto be a predictor of poor patient course and increased mortalityafter 30 days. One of the possible explanations for this is thatprior hospitalisation is more frequent in older patients [28].The advanced age predisposes them to more serious condi-tions, the appearance of more complications and greatermortality [27, 29, 30]. However, the existing literature doesnot show a direct relationship between prior hospitalisationand hospital costs, although all of these factors produce anincrease in the total cost of the CAP. Curiously, neither age norcomorbidity was independently associated with increased in-patient cost. Similar observations apply to PSI, the effect ofwhich also disappeared in the multivariate analysis. Thus, thehospital cost of CAP was not significantly increased in patientswith comorbidities, or even with a high PSI, if they had noassociated complications.
In conclusion, complications, hypoalbuminaemia and previoushospital admission were the most important determinants ofhigh cost associated with hospitalised community-acquiredpneumonia patients. However, neither patient age nor comor-bidities contributed to raising the direct costs. The PneumoniaSeverity Index alone was not an independent risk factor forhigh cost either. Strategies designed to prevent complicationsduring hospital stay, and early management of the complica-tions that appear, may contribute to reducing in-patient costsin hospitalised cases of community-acquired pneumonia.
REFERENCES1 Ambrosino N, Armaganidis A, Beurskens H. Pneumonia.
In: European Respiratory/European Lung Foundation.European Lung White Book. The First ComprehensiveSurvey on Respiratory Health in Europe. Loddenkemper R,
TABLE 5 Direct costs of community-acquired pneumonia (CAP) according to the presence of complications
Complications p-value#
0 1 o2
Medication costs
Antibiotic treatment 115 (64–155) 139 (90–222) 155 (87–290) 0.0001
Other treatments 20 (8–39) 36 (18–56) 57 (23–130) 0.0001
Laboratory test costs 174 (153–212) 219 (178–277) 239 (189–310) 0.0001
Diagnostic test costs 42 (22–69) 53 (19–84) 97 (33–218) 0.0001
Hospital stay costs 1000 (714–1286) 1286 (1000–1571) 1429 (1000–2286) 0.0001
Total CAP costs 1295 (1055–1637) 1692 (1392–2083) 2111 (1485–3007) 0.0001
Data are presented as median (interquartile range) cost in Euros, unless otherwise stated. #: Kruskal–Wallis test.
TABLE 6 Independent factors associated with high cost#
OR (95%CI)
Previous hospital admission 2.3 (1.2–4.3)
Hypoalbuminaemia 2.0 (1.1–3.6)
Infectious complications 6.8 (1.3–36)
Digestive complications 5.9 (1.5–22.8)
Pulmonary complications 2.6 (1.4–4.7)
Other complications 3.9 (1.8–8.4)
OR: odds ratio; CI: confidence interval. #: more than median total cost (J1,683)
of community-acquired pneumonia.
COSTS IN CAP S. REYES ET AL.
1066 VOLUME 31 NUMBER 5 EUROPEAN RESPIRATORY JOURNAL

Gibson GJ, Sibille Y, eds. Sheffield, UK, ERSJ, 2003; pp.55–65.
2 Niederman MS, Mandell LA, Anzueto A, et al. Guidelinesfor the management of adults with community-acquiredpneumonia. Diagnosis, assessment of severity, antimicro-bial therapy, and prevention. Am J Respir Crit Care Med2001; 163: 1730–1754.
3 Fine MJ, Pratt HM, Obrosky DS, et al. Relation between lengthof hospital stay and costs of care for patients with community-acquired pneumonia. Am J Med 2000; 109: 378–385.
4 Bauer TT, Welte T, Ernen C, et al. Cost analyses of community-acquired pneumonia from the hospital perspective. Chest2005; 128: 2238–2246.
5 Masotti L, Ceccarelli E, Cappelli R, Barabesi L, Forconi S.Community-acquired pneumonia in elderly patients andlength of hospitalization. Arch Intern Med 2000; 160: 2678–2679.
6 Menendez R, Cremades MJ, Martinez-Moragon E, Soler JJ,Reyes S, Perpina M. Duration of length of stay in pneumonia:influence of clinical factors and hospital type. Eur Respir J2003; 22: 643–648.
7 Bartolome M, Almirall J, Morera J, et al. A population-based study of the costs of care for community-acquiredpneumonia. Eur Respir J 2004; 23: 610–616.
8 Gonzalez-Moraleja J, Sesma P, Gonzalez C, Lopez ME,Garcia JF, Alvarez-Sala JL. [What is the cost of inappropri-ate admission of pneumonia patients?]. Arch Bronconeumol1999; 35: 312–316.
9 Fine MJ, Auble TE, Yealy DM, et al. A prediction rule toidentify low-risk patients with community-acquired pneu-monia. N Engl J Med 1997; 336: 243–250.
10 Torres A, Menendez R. Mortality in COPD patients withcommunity-acquired pneumonia: who is the third partner?Eur Respir J 2006; 28: 262–263.
11 Rhew DC, Tu GS, Ofman J, Henning JM, Richards MS,Weingarten SR. Early switch and early discharge strategiesin patients with community-acquired pneumonia: a meta-analysis. Arch Intern Med 2001; 161: 722–727.
12 Weingarten SR, Riedinger MS, Hobson P, et al. Evaluationof a pneumonia practice guideline in an interventionaltrial. Am J Respir Crit Care Med 1996; 153: 1110–1115.
13 Arancibia F, Ewig S, Martinez JA, et al. Antimicrobialtreatment failures in patients with community-acquiredpneumonia: causes and prognostic implications. Am JRespir Crit Care Med 2000; 162: 154–160.
14 Fine MJ, Stone RA, Singer DE, et al. Processes andoutcomes of care for patients with community-acquiredpneumonia: results from the Pneumonia Patient OutcomesResearch Team (PORT) cohort study. Arch Intern Med 1999;159: 970–980.
15 Diari Oficial de la Generalitat Valenciana. www.docv.gva.es/portal/portal/2002/12/31/pdf/doc/2002_14538.pdfDate last accessed: May 31, 2003. Date last updated:December 31, 2002.
16 Hosmer D, Lemeshow S, eds. Applied Logistic Regression.New York, John Wiley & Sons, 1989.
17 Monge V, San-Martin VM, Gonzalez A. The burden ofcommunity-acquired pneumonia in Spain. Eur J PublicHealth 2001; 11: 362–364.
18 Monge V, Gonzalez A. Hospital admissions for pneumoniain Spain. Infection 2001; 29: 3–6.
19 Guest JF, Morris A. Community-acquired pneumonia: theannual cost to the National Health Service in the UK. EurRespir J 1997; 10: 1530–1534.
20 Lave JR, Fine MJ, Sankey SS, Hanusa BH, Weissfeld LA,Kapoor WN. Hospitalized pneumonia. Outcomes, treat-ment patterns, and costs in urban and rural areas. J GenIntern Med 1996; 11: 415–421.
21 Colice GL, Morley MA, Asche C, Birnbaum HG. Treatmentcosts of community-acquired pneumonia in an employedpopulation. Chest 2004; 125: 2140–2145.
22 Kaplan V, Angus DC, Griffin MF, Clermont G, ScottWatson R, Linde-Zwirble WT. Hospitalized community-acquired pneumonia in the elderly: age- and sex-relatedpatterns of care and outcome in the United States. Am JRespir Crit Care Med 2002; 165: 766–772.
23 Niederman MS, McCombs JS, Unger AN, Kumar A,Popovian R. The cost of treating community-acquiredpneumonia. Clin Ther 1998; 20: 820–837.
24 Roson B, Carratala J, Dorca J, Casanova A, Manresa F,Gudiol F. Etiology, reasons for hospitalization, risk classes,and outcomes of community-acquired pneumonia inpatients hospitalized on the basis of conventional admis-sion criteria. Clin Infect Dis 2001; 33: 158–165.
25 Menendez R, Torres A, Rodriguez de Castro F, et al.Reaching stability in community-acquired pneumonia: theeffects of the severity of disease, treatment, and thecharacteristics of patients. Clin Infect Dis 2004; 39: 1783–1790.
26 Riquelme R, Torres A, el-Ebiary M, et al. Community-acquired pneumonia in the elderly. Clinical and nutritionalaspects. Am J Respir Crit Care Med 1997; 156: 1908–1914.
27 Cabre M, Serra-Prat M, Bolıbar I, Pallares R. [Prognosticfactors of community acquired pneumonia in very oldpatients.]. Med Clin (Barc) 2006; 127: 201–205.
28 Saldıas Penafiel F, O’Brien Solar A, Gederlini Gollerino A,Farıas Gontupil G, Dıaz Fuenzalida A. [Community-acquired pneumonia requiring hospitalization in immuno-competent elderly patients: clinical features, prognosticfactors and treatment.]. Arch Bronconeumol 2003; 39: 333–340.
29 Mandell LA, Wunderink RG, Anzueto A, et al. InfectiousDiseases Society of America/American Thoracic Societyconsensus guidelines on the management of community-acquired pneumonia in adults. Clin Infect Dis 2007; 44:Suppl. 2, S27–S72.
30 Bont J, Hak E, Hoes AW, Schipper M, Schellevis FG,Verheij TJ. A prediction rule for elderly primary-carepatients with lower respiratory tract infections. Eur Respir J2007; 29: 969–975.
S. REYES ET AL. COSTS IN CAP
EUROPEAN RESPIRATORY JOURNAL VOLUME 31 NUMBER 5 1067


Tesis Doctoral
Soledad María Reyes Calzada Página 34
ARTICULO 3


Economic evaluation of adherence to
treatment guidelines in nonintensive care
pneumoniaR. Menendez*, S. Reyes*,#, R. Martınez*, P. de la Cuadra*, J. ManuelValles* and J. Vallterra*
ABSTRACT: Guidelines have been developed to improve the treatment of community-acquired
pneumonia (CAP) but information regarding their influence on costs is lacking. The aim of the
present study was to conduct a cost-effectiveness analysis of CAP treatment from the hospital
perspective when adhering to Spanish guidelines.
A prospective cohort study was performed in 271 patients with CAP admitted to a tertiary-care
hospital, not needing intensive care. Collected data included patients’ characteristics, comorbid-
ity, initial risk class, resource use (medication, blood and microbiological analyses, and
radiology) and economic data. Antimicrobial treatment was recorded as adherent or nonadherent
to Spanish guidelines. Outcome measures were mortality and readmission at 30 days.
The median cost for adherent treatment was 1,665.5 versus 1,710.5 Euros for nonadherent
treatment. Mortality and readmission were 10% and 2.1% for adherent treatment versus 13.6% and
6.2% for nonadherent treatment. The cost-effectiveness ratio was 2,277 Euros per expected cure
for patients treated according to the guidelines and 2,567 Euros per expected cure for the
nonadherence group. The incremental cost-effectiveness ratio showed that adherence to
treatment guidelines saved 1,121 Euros per patient cured compared with nonadherence. The
sensitivity analysis demonstrated that the findings were robust.
An antimicrobial treatment according to guidelines is the dominant alternative due to its cost-
effectiveness.
KEYWORDS: Cost-effectiveness, mortality, pneumonia, readmission, treatment guidelines
Community-acquired pneumonia (CAP) isa frequent and serious disease withimportant socioeconomic impact. The
incidence in adults is 1606105 cases?yr-1 and isthe main cause of death from infection in theUSA and Europe [1, 2]. Healthcare resourceconsumption is high and involves direct andindirect health costs, the latter due mainly to lostwork days.
The impact of the cost of the disease process on thehealthcare budget is mainly caused by the cost ofhospitalisation, which represents 70–90% of thetotal cost of CAP [3, 4]. In Spain, the cost ofrespiratory infection is ,115 million Euros?yr-1 [5].
Direct health costs caused by CAP were assessedby FINE et al. [6] and were identified as belongingto categories such as emergency treatment,laboratory analyses, diagnostic procedures, hos-pital stay and other incidental procedures.Hospital stay is responsible for the highestpercentage and can reach 70% of the total cost.
The most recent guidelines for the managementof CAP present recommendations regardinghospitalisation and discharge from hospital [7].
In order to decrease costs, there has been atendency in recent years to reduce hospital stayusing strategies that encourage early discharge[8–10]. However, METERSKY et al. [11] found thatthe progressive reduction in the duration ofhospital stay was accompanied by an increasein CAP-associated mortality at 30 days and in re-hospitalisation. These findings highlighted thedifficulty in implementing measures directedtowards restricting costs without considering itspossible negative effect on disease prognosis. Theevaluation of costs in clinical practice shouldhave a perspective that includes both concepts,i.e. cost and effectiveness.
Scientific societies in Europe (e.g. EuropeanRespiratory Society) and the USA (e.g. AmericanThoracic Society) have published practice guide-lines that include recommendations for empirical
AFFILIATIONS
*Pneumology Service, La Fe
University Hospital, Valencia, and#Programa Doctorado, Barcelona
Autonomic University, Barcelona,
Spain.
CORRESPONDENCE
R. Menendez
Servicio de Neumologıa
Hospital Universitario La Fe
Avda. De Campanar 21
46009 Valencia
Spain
Fax: 34 961973089
E-mail: [email protected]
Received:
April 17 2006
Accepted after revision:
September 09 2006
STATEMENT OF INTEREST
None declared.
European Respiratory Journal
Print ISSN 0903-1936
Online ISSN 1399-3003
EUROPEAN RESPIRATORY JOURNAL VOLUME 29 NUMBER 4 751
Eur Respir J 2007; 29: 751–756
DOI: 10.1183/09031936.00052506
Copyright�ERS Journals Ltd 2007
c
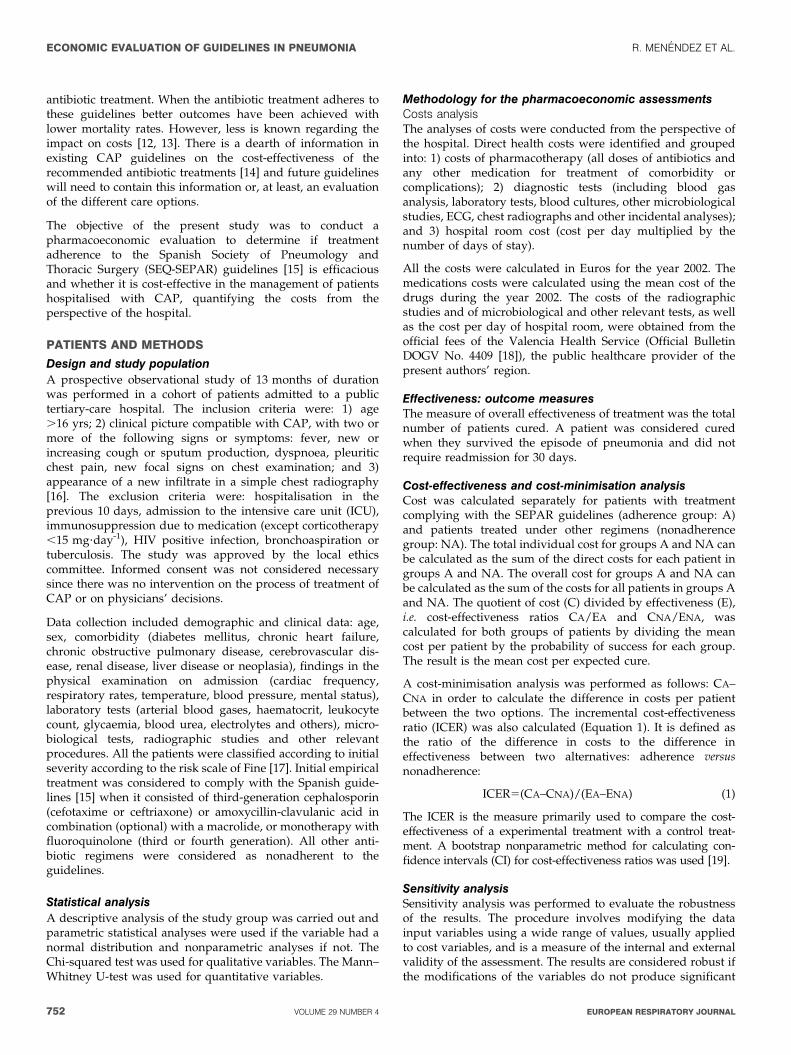
antibiotic treatment. When the antibiotic treatment adheres tothese guidelines better outcomes have been achieved withlower mortality rates. However, less is known regarding theimpact on costs [12, 13]. There is a dearth of information inexisting CAP guidelines on the cost-effectiveness of therecommended antibiotic treatments [14] and future guidelineswill need to contain this information or, at least, an evaluationof the different care options.
The objective of the present study was to conduct apharmacoeconomic evaluation to determine if treatmentadherence to the Spanish Society of Pneumology andThoracic Surgery (SEQ-SEPAR) guidelines [15] is efficaciousand whether it is cost-effective in the management of patientshospitalised with CAP, quantifying the costs from theperspective of the hospital.
PATIENTS AND METHODS
Design and study populationA prospective observational study of 13 months of durationwas performed in a cohort of patients admitted to a publictertiary-care hospital. The inclusion criteria were: 1) age.16 yrs; 2) clinical picture compatible with CAP, with two ormore of the following signs or symptoms: fever, new orincreasing cough or sputum production, dyspnoea, pleuriticchest pain, new focal signs on chest examination; and 3)appearance of a new infiltrate in a simple chest radiography[16]. The exclusion criteria were: hospitalisation in theprevious 10 days, admission to the intensive care unit (ICU),immunosuppression due to medication (except corticotherapy,15 mg?day-1), HIV positive infection, bronchoaspiration ortuberculosis. The study was approved by the local ethicscommittee. Informed consent was not considered necessarysince there was no intervention on the process of treatment ofCAP or on physicians’ decisions.
Data collection included demographic and clinical data: age,sex, comorbidity (diabetes mellitus, chronic heart failure,chronic obstructive pulmonary disease, cerebrovascular dis-ease, renal disease, liver disease or neoplasia), findings in thephysical examination on admission (cardiac frequency,respiratory rates, temperature, blood pressure, mental status),laboratory tests (arterial blood gases, haematocrit, leukocytecount, glycaemia, blood urea, electrolytes and others), micro-biological tests, radiographic studies and other relevantprocedures. All the patients were classified according to initialseverity according to the risk scale of Fine [17]. Initial empiricaltreatment was considered to comply with the Spanish guide-lines [15] when it consisted of third-generation cephalosporin(cefotaxime or ceftriaxone) or amoxycillin-clavulanic acid incombination (optional) with a macrolide, or monotherapy withfluoroquinolone (third or fourth generation). All other anti-biotic regimens were considered as nonadherent to theguidelines.
Statistical analysisA descriptive analysis of the study group was carried out andparametric statistical analyses were used if the variable had anormal distribution and nonparametric analyses if not. TheChi-squared test was used for qualitative variables. The Mann–Whitney U-test was used for quantitative variables.
Methodology for the pharmacoeconomic assessmentsCosts analysisThe analyses of costs were conducted from the perspective ofthe hospital. Direct health costs were identified and groupedinto: 1) costs of pharmacotherapy (all doses of antibiotics andany other medication for treatment of comorbidity orcomplications); 2) diagnostic tests (including blood gasanalysis, laboratory tests, blood cultures, other microbiologicalstudies, ECG, chest radiographs and other incidental analyses);and 3) hospital room cost (cost per day multiplied by thenumber of days of stay).
All the costs were calculated in Euros for the year 2002. Themedications costs were calculated using the mean cost of thedrugs during the year 2002. The costs of the radiographicstudies and of microbiological and other relevant tests, as wellas the cost per day of hospital room, were obtained from theofficial fees of the Valencia Health Service (Official BulletinDOGV No. 4409 [18]), the public healthcare provider of thepresent authors’ region.
Effectiveness: outcome measuresThe measure of overall effectiveness of treatment was the totalnumber of patients cured. A patient was considered curedwhen they survived the episode of pneumonia and did notrequire readmission for 30 days.
Cost-effectiveness and cost-minimisation analysisCost was calculated separately for patients with treatmentcomplying with the SEPAR guidelines (adherence group: A)and patients treated under other regimens (nonadherencegroup: NA). The total individual cost for groups A and NA canbe calculated as the sum of the direct costs for each patient ingroups A and NA. The overall cost for groups A and NA canbe calculated as the sum of the costs for all patients in groups Aand NA. The quotient of cost (C) divided by effectiveness (E),i.e. cost-effectiveness ratios CA/EA and CNA/ENA, wascalculated for both groups of patients by dividing the meancost per patient by the probability of success for each group.The result is the mean cost per expected cure.
A cost-minimisation analysis was performed as follows: CA–CNA in order to calculate the difference in costs per patientbetween the two options. The incremental cost-effectivenessratio (ICER) was also calculated (Equation 1). It is defined asthe ratio of the difference in costs to the difference ineffectiveness between two alternatives: adherence versusnonadherence:
ICER5(CA–CNA)/(EA–ENA) (1)
The ICER is the measure primarily used to compare the cost-effectiveness of a experimental treatment with a control treat-ment. A bootstrap nonparametric method for calculating con-fidence intervals (CI) for cost-effectiveness ratios was used [19].
Sensitivity analysisSensitivity analysis was performed to evaluate the robustnessof the results. The procedure involves modifying the datainput variables using a wide range of values, usually appliedto cost variables, and is a measure of the internal and externalvalidity of the assessment. The results are considered robust ifthe modifications of the variables do not produce significant
ECONOMIC EVALUATION OF GUIDELINES IN PNEUMONIA R. MENENDEZ ET AL.
752 VOLUME 29 NUMBER 4 EUROPEAN RESPIRATORY JOURNAL

changes in the outcome. The present authors elected to modifythe variables that carried the greatest weight in the costestimations. The calculation of cost-effectiveness was thenrepeated, substituting each one of the original values with thevalue derived from the extremes of the 95% CI.
RESULTSThe study included 271 patients. Table 1 summarises thedemographic characteristics, initial severity of disease andclinical progress in the 190 patients of group A and the 81patients of group NA. Nonadherent treatments were: second-generation cefalosporin¡macrolide in 30 patients, macro-lides in monotherapy in 19, ciprofloxacin¡another antibioticin 19, ceftazidime¡another antibiotic in 10 and other regimensin three. There were no significant differences in demo-graphic variables, comorbidity or initial severity. Overallmortality was 11% (30 out of 271), with 10% (19 out of 190)in group A versus 13.6% (11 out of 81) in group NA (p50.3).The overall mean¡SD duration of hospitalisation was9.8¡5.5 days: 9.7¡5.2 in group A and 10.1¡6.2 in groupNA (p50.7). Four patients (2%) in group A and 11 (6%) ingroup NA were readmitted within 30 days (p50.1 and p.0.05,respectively).
Economic calculations: cost-minimisation and cost-effectiveness analysisThe mean cost of in-patient treatment for the whole cohort was2,025¡1.197 Euros. The mean cost for each component was:drug treatment 267¡317 Euros, laboratory and diagnostic tests353.9¡297 Euros and hospital room 1,403¡789 Euros. Theseparate results for groups are shown in table 2. Adherenceresulted in better patient outcome (88% versus 81% curedpatients) and at lower cost, although without reachingstatistical significance (p.0.05). Two economic evaluationmethods were performed: 1) a cost-minimisation analysis,since the difference in outcome between the two options wasnot found statistically significant; and 2) a cost-effectivenessanalysis with a bootstrapping method, since the present studywas not designed to show equivalence of treatments.
Cost-minimisation analysis
The incremental cost between the two options was 78.5 Euros(95% CI -261.7–418.7). Adherence to SEPAR guidelines saved78.5 Euros per patient when compared with nonadherence.
Cost-effectiveness analysis
The cost-effectiveness ratio (C/E) or mean cost per patientcured was 2,277 Euros in group A and 2,567 Euros in groupNA. The ICER was negative, which indicates that the treatmentaccording to the guidelines had a saving of 1,121 Euros percured patient compared with the alternative option ofnonadherence. A bootstrapping nonparametric method wasemployed using 2,000 re-samples in order to perform astochastic analysis. The ICER for this bootstrap re-samplewas -942.7 Euros (95% CI -1,885.8–0.37). The ICER had values,1,256 Euros in 80% and ,3,616 Euros in 90% of re-samples.
Sensitivity analysisThree sensitivity analyses were performed with the differentcompartments of the total costs, including: antibiotics, hospitalstay, laboratory tests and diagnostic evaluations. For eachsensitivity analysis, all the costs were re-calculated using theextreme limits of the 95% CI of each compartment. For upperand lower limit of the 95% CI of the mean (table 3), the meancost per patient in the two groups was re-calculated as well asthe cost-effectiveness ratio and the incremental cost-effective-ness ratio.
The results (table 4) showed that the cost-effectiveness resultsremained stable despite being subjected to wide variations inthe distinct cost components.
DISCUSSIONThe most relevant results of the present study are: 1) adherenceto guidelines is quite high; 2) adherence to guidelines in theempirical treatment of CAP is a dominant option since theoutcomes are more effective compared with nonadherence(88% versus 81% cured patients) and less expensive (2,001versus 2,079 Euros), as demonstrated by the cost-effectivenessanalysis; 3) a cost-minimisation analysis showed that adher-ence to guidelines saved 78.5 Euros per patient; and 4) theincremental cost-effectiveness ratio showed that adherence toguidelines saved 1,121 Euros per patient cured compared withthe nonadherence option.
TABLE 1 Demographic characteristics, comorbidity andinitial risk class in the groups with and withouttreatment guidelines adherence (univariateanalysis)
Adherence to guidelines p-value
Yes No
Subjects n 190 81
Sex male/female 82/108 28/53 0.1
Age yrs 69.4¡15.6 72.3¡14 0.1
Nursing home 5 (2.6) 3 (3.7) 0.6
Smoking habit 31 (16.3) 10 (12.1) 0.3
Hospitalisation during
previous year
58 (30.5) 24 (29.6) 0.8
Prior antibiotic 71/190 (37.3) 25/81 (30.8) 0.3
Diabetes 40 (21.1) 17 (21) 0.9
Neoplasia 10 (5.3) 3 (3.7) 0.5
Liver disease 6 (3.2) 3 (3.7) 0.5
Heart failure 65 (34.2) 24 (29.6) 0.4
Cerebrovascular
disease
21 (11.1) 10 (12.3) 0.7
Renal disease 12 (6.3) 4 (4.9) 0.6
COPD 42 (22.1) 27 (33.3) 0.06
Fine risk class
I 19 (10) 3 (3.7) 0.09
II 23 (12.1) 13 (16)
III 31 (16.3) 22 (27.2)
IV 84 (44.2) 29 (35.8)
V 33 (17.4) 14 (17.3)
Data are presented as mean¡SD or n (%), unless otherwise stated. COPD:
chronic obstructive pulmonary disease.
R. MENENDEZ ET AL. ECONOMIC EVALUATION OF GUIDELINES IN PNEUMONIA
cEUROPEAN RESPIRATORY JOURNAL VOLUME 29 NUMBER 4 753

Guidelines of scientific societies assist the attending physicianin the selection of treatment and their objective is to improvethe outcome. In the present study, adherence to Spanishguidelines was rather high (70%) and was similar to thatdescribed in the literature, although there is a wide variationamong hospitals and physicians [20–22]. Several factors mightexplain noncompliance with guidelines: various specialistsprescribing treatment in emergency rooms, the inertia ofprevious practice (.50% second-generation cefalosporin¡
macrolide or macrolide alone) or different perception of theinfluence of the guidelines’ benefit [23], although in the presentstudy this interesting topic was not specifically investigated.No significant differences were found for the treatment ofpatients based on age, sex, comorbidity and initial severity.
The efficacy of adherence to initial empirical treatment guide-lines has been evaluated for its impact on mortality, clinicalresponse, duration of hospital stay and, less systematically, oncost [12, 14, 20]. There are several studies that found a lowermortality when treatment was compliant with guidelines [13,14, 21, 24] and, furthermore, a more rapid clinical stability wasachieved [25]. However, there remains a lack of studiesperforming a pharmacoeconomic evaluation focusing on costs[15, 26]. A cost-effectiveness analysis (CEA) is a useful toolwhen evaluating costs and outcomes with different treatment
modalities. As such, it is ideal in the present context [27, 28]even when no statistically significant differences have beendemonstrated in the current study. In fact, a CEA is consideredan appropriate analysis when a lack of significance is found
TABLE 2 Cost results in the adherent and nonadherent group
Adherence to guidelines p-value
Yes No
Overall treatment cost 257.9; 190.9 (113.6–303.3) 289.3; 181.1 (114.5–311.3) 0.8
Antibiotics 176.8; 139.3 (82.8–227.4) 170.8; 135.2 (73.6–236.8) 0.6
Other 80.3; 38.0 (14.9–68.3) 118.5; 37.7 (22.4–69.6) 0.3
Diagnostic/laboratory test 355.8; 291.5 (216.7–393.7) 349.2; 283.0 (213.5–391.0) 0.6
Hospital stay 1387.3; 1142.9 (857.2–1750.1) 1441.0; 1285.8 (857.2–1714.4) 0.7
Total costs 2001.1; 1665.5 (1294.8–2513.1) 2079.6; 1710.5 (1181.2–2366.7) 0.8
Data are presented as mean; median (25th–75th percentiles). Costs are provided in Euros.
TABLE 3 Mean values of the variables included in thesensitivity analysis
Variable Mean 95% CI LL 95% CI UL
Antibiotic treatment
Adherence 176.8 154.8 198.8
Nonadherence 170.8 137.8 203.8
Diagnostic/laboratory tests
Adherence 355.8 310.5 401.3
Nonadherence 349.2 295.1 403.4
Hospital stay
Adherence 1387.3 1281.1 1493.6
Nonadherence 1441.1 1243.7 1638.4
CI: confidence interval; LL: lower limit; UL: upper limit. Costs are provided in
Euros.
TABLE 4 Results of cost-effectiveness and sensitivityanalysis comparing adherence andnonadherence treatment groups
C E % C/E ICER Result
Cohort analysis
Adherence 2001 88 2276.7 -1121 Dominant
Nonadherence 2079 81 2566.6
Sensitivity analysis 1
Treatment
95% CI LL
Adherence 2251.7 88 2558.7 -3715 Dominant
Nonadherence 2511.8 81 3100.9
95% CI UL
Adherence 2301.8 88 2615.7 -4155.7 Dominant
Nonadherence 2592.7 81 3200.8
Sensitivity analysis 2
Diagnostics
95% CI LL
Adherence 2225.1 88 2528.5 -3724 Dominant
Nonadherence 2485.8 81 3068.8
95% CI UL
Adherence 2328.4 88 2645.9 -4147 Dominant
Nonadherence 2618.7 81 3232.9
Sensitivity analysis 3
Hospitalisation
95% CI LL
Adherence 2155.8 88 2449.7 -2.202 Dominant
Nonadherence 2310.1 81 2851.9
95% CI UL
Adherence 2397.6 88 2724.5 -5670 Dominant
Nonadherence 2794.5 81 3450.8
Costs are provided in Euros. C: cost; E: effectiveness; C/E: cost-effectiveness
ratio; ICER: incremental cost-effectiveness ratio (mean cost per additional
patient cured); Dominant: lower cost and better outcomes; CI: confidence
interval; LL: lower limit; UL: upper limit.
ECONOMIC EVALUATION OF GUIDELINES IN PNEUMONIA R. MENENDEZ ET AL.
754 VOLUME 29 NUMBER 4 EUROPEAN RESPIRATORY JOURNAL

and the study was not designed to demonstrate equivalence[26]. Some previous studies about costs have been focused onstrategies to decrease admissions to hospital due to CAP [29].However, it has been reported that while a reduction inadmissions was possible, there was an increase in subsequentreadmissions and a lower satisfaction of the patients [30]. Inthat and other studies, the main goal had been to contain costswithout compromising patient outcomes [31, 32]. These studiesprovide valuable information for clinical practice despite thefact that their objectives had focused on avoiding adverseeffects, rather than on efficacy.
Although guidelines stress the importance of implementingand maintaining adherence to the recommendations, there hasbeen a paucity of data published about their impact on thecost-effectiveness of the treatment. In nonhospitalised patientswith CAP, GLEASON et al. [33] found that adherence to theAmerican Thoracic Society guidelines was associated with areduction of costs in patients ,60 yrs of age and, conversely,with an increase in those of .60 yrs of age with comorbidities.
In the present study, it was decided to include all thecomponents of hospital costs since the selection of antibioticsinfluences other prognostic variables, such as treatment failureand clinical stability, which are related to length of hospitalstay. As a measure of effectiveness the recovery of pneumonia(defined as the patient surviving the episode of pneumoniaand not needing readmission within 30 days of discharge) wasused. These outcome indicators are universally applicable andare widely accepted [32, 34, 35].
ORRICK et al. [36] compared the cost of care for patientshospitalised with CAP. They found that the median cost ofhospitalisation was higher when treatment was not compliantwith guideline recommendations (US$ 3,085 versus US$ 2,047).However, the authors did not perform any cost-effectivenessanalyses. Recently, BAUER et al. [37] reported that patientstreated with moxifloxacin benefited from an earlier discharge,although direct costs and clinical efficacy were similar to otherantibiotics.
In the present study it was found that adherence to theguidelines was the cost-effective option since the ratio was2,277 Euros per expected cure versus 2,567 Euros in those withnonadherent treatments. This produced a negative incrementalcost-effectiveness ratio since adherence saved 1,121 Euros perpatient cured compared with nonadherence. A bootstrappinganalysis demonstrated that in 95% of cases adherence toguidelines saves costs [19]. Furthermore, the additional cost ofreadmission was reduced when the treatment was adherent.The sensitivity analysis demonstrated that the results found inthe cost-effectiveness analysis remain stable despite usingwide variations in the different components introduced intothe cost equations.
As a limitation of the present study it should be highlightedthat there was no evaluation of the impact on indirect cost,such as patient-reported lost days of normal activity. Also, thepresent study was observational and nonrandomised.Furthermore, patients with admission to ICU were notincluded in the present study since it is one of the highestdeterminants of cost in CAP [37].
In summary, for patients hospitalised with community-acquired pneumonia, treatment according to the guidelines isthe dominant alternative due to its cost-effectiveness.
REFERENCES1 Armstrong GL, Conn LA, Pinner RW. Trends in infectious
disease mortality in the United States during the 20thcentury. JAMA 1999; 281: 61–66.
2 Kaplan V, Angus DC, Griffin MF, Clermont G, ScottWatson R, Linde-Zwirble WT. Hospitalized community-acquired pneumonia in the elderly: age- and sex-relatedpatterns of care and outcome in the United States. Am JRespir Crit Care Med 2002; 165: 766–772.
3 Lave JR, Fine MJ, Sankey SS, Hanusa BH, Weissfeld LA,Kapoor WN. Hospitalized pneumonia. Outcomes, treat-ment patterns, and costs in urban and rural areas. J GenIntern Med 1996; 11: 415–421.
4 Guest JF, Morris A. Community-acquired pneumonia: theannual cost to the National Health Service in the UK. EurRespir J 1997; 10: 1530–1534.
5 Monge V, San-Martin VM, Gonzalez A. The burden ofcommunity-acquired pneumonia in Spain. Eur J PublicHealth 2001; 11: 362–364.
6 Fine MJ, Pratt HM, Obrosky DS, et al. Relation between lengthof hospital stay and costs of care for patients with commu-nity-acquired pneumonia. Am J Med 2000; 109: 378–385.
7 Niederman MS, Mandell LA, Anzueto A, et al. Guidelinesfor the management of adults with community-acquiredpneumonia. Diagnosis, assessment of severity, antimicro-bial therapy, and prevention. Am J Respir Crit Care Med2001; 163: 1730–1754.
8 Rhew DC, Tu GS, Ofman J, Henning JM, Richards MS,Weingarten SR. Early switch and early discharge strategiesin patients with community-acquired pneumonia: a meta-analysis. Arch Intern Med 2001; 161: 722–727.
9 Siegel RE. Strategies for early discharge of the hospitalizedpatient with community-acquired pneumonia. Clin ChestMed 1999; 20: 599–605.
10 Weingarten S, Riedinger MS, Sandhu M, et al. Can practiceguidelines safely reduce hospital length of stay? Resultsfrom a multicenter interventional study. Am J Med 1998;105: 33–40.
11 Metersky ML, Tate JP, Fine MJ, Petrillo MK, Meehan TP.Temporal trends in outcomes of older patients withpneumonia. Arch Intern Med 2000; 160: 3385–3391.
12 Menendez R, Ferrando D, Valles JM, Vallterra J. Influenceof deviation from guidelines on the outcome ofcommunity-acquired pneumonia. Chest 2002; 122: 612–617.
13 Dean NC, Silver MP, Bateman KA, James B, Hadlock CJ,Hale D. Decreased mortality after implementation of atreatment guideline for community-acquired pneumonia.Am J Med 2001; 110: 451–457.
14 Nathwani D, Rubinstein E, Barlow G, Davey P. Doguidelines for community-acquired pneumonia improvethe cost-effectiveness of hospital care? Clin Infect Dis 2001;32: 728–741.
15 Frias J, Gomis M, Prieto J, et al. [Initial empirical antibiotictreatment of community-acquired pneumonia]. Rev EspQuimioter 1998; 11: 255–261.
R. MENENDEZ ET AL. ECONOMIC EVALUATION OF GUIDELINES IN PNEUMONIA
cEUROPEAN RESPIRATORY JOURNAL VOLUME 29 NUMBER 4 755

16 Dorca J, Bello S, Blanquer J, et al. [The diagnosis andtreatment of community-acquired pneumonia. SEPAR.Sociedad Espanola de Neumologıa y Cirugıa Toracica].Arch Bronconeumol 1997; 33: 240–246.
17 Fine MJ, Auble TE, Yealy DM, et al. A prediction rule toidentify low-risk patients with community-acquired pneu-monia. N Engl J Med 1997; 336: 243–250.
18 Diari Oficial de la Generalitat Valenciana. www.docv.gva.es/portal/portal/2002/12/31/pdf/doc/2002_14538.pdf.Date last updated: December 31 2002. Date last accessed:May 31 2003.
19 Campbell MK, Torgerson DJ. Bootstrapping: estimatingconfidence intervals for cost-effectiveness ratios. QJM 1999;92: 177–182.
20 Mortensen EM, Restrepo M, Anzueto A, Pugh J. Effects ofguideline-concordant antimicrobial therapy on mortalityamong patients with community-acquired pneumonia. AmJ Med 2004; 117: 726–731.
21 Menendez R, Torres A, Zalacain R, et al. Guidelines for thetreatment of community-acquired pneumonia: predictorsof adherence and outcome. Am J Respir Crit Care Med 2005;172: 757–762.
22 Marras TK, Chan CK. Use of guidelines in treatingcommunity-acquired pneumonia. Chest 1998; 113: 1689–1694.
23 Cabana MD, Rand CS, Powe NR, et al. Why don’tphysicians follow clinical practice guidelines? A frame-work for improvement. JAMA 1999; 282: 1458–1465.
24 Gleason PP, Meehan TP, Fine JM, Galusha DH, Fine MJ.Associations between initial antimicrobial therapy andmedical outcomes for hospitalized elderly patients withpneumonia. Arch Intern Med 1999; 159: 2562–2572.
25 Menendez R, Torres A, Rodrıguez de Castro F, et al.Reaching stability in community-acquired pneumonia: theeffects of the severity of disease, treatment, and thecharacteristics of patients. Clin Infect Dis 2004; 39: 1783–1790.
26 Briggs AH, O’Brien BJ. The death of cost-minimizationanalysis? Health Econ 2001; 10: 179–184.
27 Detsky AS, Naglie IG. A clinician’s guide to cost-effective-ness analysis. Ann Intern Med 1990; 113: 147–154.
28 Russell LB, Gold MR, Siegel JE, Daniels N, Weinstein MC.The role of cost-effectiveness analysis in health and
medicine. Panel on Cost-Effectiveness in Health andMedicine. JAMA 1996; 276: 1172–1177.
29 Marrie TJ, Lau CY, Wheeler SL, Wong CJ, Vandervoort MK,Feagan BG. A controlled trial of a critical pathway fortreatment of community-acquired pneumonia. CAPITALStudy Investigators. Community-Acquired PneumoniaIntervention Trial Assessing Levofloxacin. JAMA 2000;283: 749–755.
30 Atlas SJ, Benzer TI, Borowsky LH, et al. Safely increasingthe proportion of patients with community-acquiredpneumonia treated as outpatients: an interventional trial.Arch Intern Med 1998; 158: 1350–1356.
31 Ramırez JA, Vargas S, Ritter GW, et al. Early switch fromintravenous to oral antibiotics and early hospital discharge:a prospective observational study of 200 consecutivepatients with community-acquired pneumonia. ArchIntern Med 1999; 159: 2449–2454.
32 Weingarten SR, Riedinger MS, Hobson P, et al. Evaluationof a pneumonia practice guideline in an interventionaltrial. Am J Respir Crit Care Med 1996; 153: 1110–1115.
33 Gleason PP, Kapoor WN, Stone RA, et al. Medicaloutcomes and antimicrobial costs with the use of theAmerican Thoracic Society guidelines for outpatients withcommunity-acquired pneumonia. JAMA 1997; 278: 32–39.
34 Gilbert K, Gleason PP, Singer DE, et al. Variations inantimicrobial use and cost in more than 2,000 patients withcommunity-acquired pneumonia. Am J Med 1998; 104: 17–27.
35 Meehan TP, Weingarten SR, Holmboe ES, et al. A statewideinitiative to improve the care of hospitalized pneumoniapatients: The Connecticut Pneumonia Pathway Project. AmJ Med 2001; 111: 203–210.
36 Orrick JJ, Segal R, Johns TE, Russell W, Wang F, Yin DD.Resource use and cost of care for patients hospitalised withcommunity acquired pneumonia: impact of adherence toinfectious diseases society of america guidelines.Pharmacoeconomics 2004; 22: 751–757.
37 Bauer TT, Welte T, Ernen C, et al. Cost analyses ofcommunity-acquired pneumonia from the hospital per-spective. Chest 2005; 128: 2238–2246.
ECONOMIC EVALUATION OF GUIDELINES IN PNEUMONIA R. MENENDEZ ET AL.
756 VOLUME 29 NUMBER 4 EUROPEAN RESPIRATORY JOURNAL

Tesis Doctoral
Soledad María Reyes Calzada Página 41
RESULTADOS


Tesis Doctoral
Soledad María Reyes Calzada Página 42
Los resultados obtenidos en los diferentes estudios que componen esta Tesis
Doctoral, han permitido obtener los siguientes resultados:
ARTÍCULO 1: “Empiric treatment in hospitalized community-acquired
pneumonia. Impact on mortality, length of stay and re-admission”
(Respiratory Medicine,2007;101:1909-1915)
Descripción de la cohorte
En nuestro estudio se incluyeron 425 pacientes: 229 (53.9%) fueron admitidos en
un hospital terciario y 196 (46.1%) en hospitales generales. Los datos
demográficos y características clínicas se muestran en la tabla 1. No hubo
diferencias significativas entre los cuatro hospitales en términos de
comorbilidad, edad y sexo. Sin embargo, el hábito tabáquico fue más frecuente
en el Hospital C y D, p=0.02.
Regímenes antibióticos
Los regímenes antibióticos adherentes que se utilizaron fueron: beta-lactámico +
macrólido (n=244, 57.4%), beta-lactámico en monoterapia (n=72, 16.9%), y
quinolonas (n=11, 2.6%). Los tratamientos no adherentes se clasificaron como:
macrólidos en monoterapia (n=32, 7.5%) y otros (n=66, 15.5%). En este último, se
incluyeron cefalosporinas de segunda generación + macrólidos (n=33, 7.7%),
ciprofloxacino en monoterapia (n=3, 0.7%), ciprofloxacino + macrólido (n=13,
3.2%) o más amoxicilina-clavulánico (n=1, 0.2%), cefalosporina de 3ª o 4ª
generación + amikacina (n=5, 1.1%), imipenem (n=4, 0.9%), cefalosporina de 2ª
generación en monoterapia (n=3, 0.7%), vancomicina más macrólido o
cefalosporina antipseudomónica (n=3, 0.7%), piperacilina-tazobactam (n=1,
0.2%). La distribución por grupos en cada hospital se muestra en la Tabla 2.
El régimen terapéutico más utilizado en los cuatro hospitales fue la combinación
de beta-lactámico y macrólidos. Sin embargo, el régimen fue menos utilizado en
el Hospital B (38.5%), donde se determinó un incremento de la utilización de
otros regímenes (31.5%), debido a una mayor prescripción de cefalosporinas de
segunda generación + macrólidos.
La adherencia del tratamiento a las guías clínicas de la SEPAR para el global de
la cohorte fue 76.5%. La adherencia fue diferente entre los hospitales, sin
embargo, se observó más baja en el hospital B (53.4%) y C (67.2%) comparado
con el hospital A (83.8%) y D (84.6%), p=0.0001. La distribución de los regímenes
antibióticos según gravedad (Tabla 3) fue similar en el grupo de bajo y alto

Tesis Doctoral
Soledad María Reyes Calzada Página 43
riesgo, excepto para el grupo de macrólidos en monoterapia, el cual fue más
frecuente en los pacientes de riesgo más bajo (13.6% versus 3.2%).
Mortalidad
La mortalidad global fue de 8.2%, sin existir diferencias significativas entre los
hospitales estudiados. La mortalidad en el grupo adherente fue 26 (8.2%) y en el
grupo no-adherente 9 (8.5%), p=0.9, y no existieron diferencias tras estratificar
según la gravedad inicial. La mortalidad global para cada régimen antibiótico y
de acuerdo con la gravedad se muestra en la Tabla 3. No hubo diferencias
estadísticamente significativas en la mortalidad global cuando se observaron los
diferentes regímenes de tratamiento. En el grupo de bajo riesgo, la mortalidad
fue más elevada entre los pacientes tratados con beta-lactámicos en monoterapia
(7.1%), aunque no fue estadísticamente significativo. En el grupo de riesgo
elevado (clases Fine IV-V), la mortalidad fue mayor en el grupo de otros
regímenes (24.3%), p=0.02.
Realizamos un análisis detallado de la mortalidad para cada régimen antibiótico
(Figura 1). En esta figura hemos comparado los porcentajes de la mortalidad
actual y predicha. La mortalidad real para todos los regímenes antibióticos fue
más baja que el valor de la predicha, excepto para el grupo de otros antibióticos.
En este último grupo, la mortalidad real fue mayor que la predicha según
gravedad, con un incremento de muerte de un 30.2%.
Estancia Hospitalaria
La mediana de estancia hospitalaria fue de 8 días. No hubo diferencias entre el
grupo adherente y no adherente, p=0.6.
En el análisis de la duración de la estancia por hospitales, encontramos estancias
más cortas en el hospital D, con una mediana de 6 días, p=0.0001. No obtuvimos
diferencias estadísticamente significativas en la duración de la estancia con
respecto a los diferentes regímenes antibióticos utilizados y tampoco según
gravedad inicial, p=0.4 (Tabla 3)
Reingreso
32 (7.6%) pacientes fueron readmitidos dentro de los 30 días tras el alta
hospitalaria. El reingreso en el grupo adherente fue 25(7.9%), p=0.6. La
distribución por hospitales fue: 17 pacientes en el Hospital A (7.5%), 6 en el
hospital B (8.3%), 6 en el Hospital C (10.3%), y 3 pacientes en el hospital D
(4.6%), p=0.6. No se encontraron diferencias estadísticamente significativas en el

Tesis Doctoral
Soledad María Reyes Calzada Página 44
reingreso con respecto al régimen de tratamiento utilizado. Sin embargo, la
readmisión se relacionó con la gravedad inicial (2.1% en pacientes de riesgo bajo
versus 5.4% en el grupo de riesgo elevado), aunque no se alcanzó la significación
estadística (p=0.07) (tabla 3).
Análisis multivariado
Se realizaron tres análisis de regresión logística para predecir mortalidad,
reingreso y estancia prolongada. Los factores de riesgo independientes para
predecir mortalidad fueron escala de riesgo de Fine (OR=11.1, IC 95% 2.6-48.1), y
el tratamiento con otros regímenes (OR=3, IC 95% 1.2-7.3). La monoterapia con
beta-lactámicos fue factor de riesgo independiente para reingreso (OR=2.7, IC
95% 1.2-6.1), y en el tercer modelo, el ingreso en el hospital D fue factor protector
para estancia prolongada (OR=0.2, IC 95% 0.1-0.5). (Tabla 4)
Tabla 1: Descripción del tratamiento empírico según edad, comorbilidad,
estancia hospitalaria, mortalidad y reingreso.
*Comparación regímenes antibióticos entre los diferentes hospitales.
NS: no significativo; EPOC : enfermedad pulmonar obstructiva crónica
ADHERENCIA NO ADHERENCIA
Beta-lactámico
+macrólido
Beta-lactámico
monoterapia
Quinolona Macrólido
monoterapia
Otros
regimenes
p
Edad 70±16 73±14 72±18 55±21 70±16 0,008
Comorbilidad
Cardiopatía 70 (28.7) 23 (31.9) 3 (27.3) 5 (15.6) 18 (27.3) NS
EPOC 80 (32.8) 25 (34.7) 5 (45.5) 10 (31.3) 23 (34.8) NS
Diabetes mellitus 50 (20.6) 16 (22.2) 0 1 (3.1) 18 (27.3) NS
Cerebrovascular 37 (15.2) 10 (13.9) 3 (27.3) 3 (9.7) 10 (15.4) NS
Nefropatía 16 (6.6) 5 (6.9) 0 0 2 (3.0) NS
Hepatopatía 15 (6.1) 3 (4.7) 1 (9.1) 2 (6.3) 2 (3.0) NS
Neoplasia 18 (7.4) 8 (11.1) 2 (18.2) 0 7 (10.6) NS
Tabaco 45 (18.6) 6 (8.5) 2 (18.2) 15 (46.9) 9 (14.1) NS
Asilo 10 (4.1) 1 (1.4) 1 (9.1) 0 6 (9.1) NS
Estancia (días) 9±5 11±7 9±5 8±3 9±4 NS
Muerte 21 (8.6) 5 (6.9) 0 0 9 (13.6) NS
Reingreso 15 (6.2) 10 (13.9) 0 3 (9.4) 4 (6.1) NS
Hospital
A 138 (60.3)* 48 (21.0)* 8 (3.5)* 9 (3.9)* 26 (11.4)*
B 28 (38.4) 11 (15.1) 0 11 (15.1) 23 (31.5)
C 30 (51.7) 9 (15.5) 0 8 (13.8) 11 (19.0)
D 48 (73.8) 4 (6.2) 3 (4.6) 4 (6.2) 6 (9.2)

Tesis Doctoral
Soledad María Reyes Calzada Página 45
Tabla 2: Tratamiento antibiótico empírico según escala de riesgo de Fine.
Régimen antibiótico FINE I-III N (%) FINE IV-V N (%) p
Beta-lactámico+ macrólido
n=244 (57%)
91 (52) 153 (61) 0.04
Beta-lactámico monoterapia
n=72 (17%)
28 (16) 44 (18) 0.6
Quinolona
n=11 (2,6%)
4 (2) 7 (3) 0.7
Macrólido monoterapia
n=32 (7,5%)
24 (14) 8 (3) 0.0001
Otros regímenes
n=66 (15,5%)
29 (16) 37 (15) 0.6
Total 176 (100) 249 (100)
Tabla 3: Descripción del tratamiento empírico inicial deacuerdo con la clase
de riesgo.
ap=0,4 Comparación mediana Estancia hospitalria en pacientes de riesgo bajo vs riesgo alto bp=0,07Comparación reingreso pacientes de riesgo bajo 2.1% versus 5.4% en riesgo elevado cp=0,02: en el grupo de riesgo elevado, la mortalidad fue más elevada en el grupo con otros regímenes de
tratamiento (24,3%)
Regimen antibiótico Mortalidad (n,%)
I-III* IV-V
Estancia hospitalariaa
(mediana)
I-III IV-V
Reingreso (n,%)b
I-III* IV-V
Beta-lactámico+ macrólido 1(1.1) 20(13.1) 8 8 4(1.7) 11(4.5)
Beta-lactámico
monoterapia
2(7.1) 3(6.8) 8 9 4(5.6) 6(8.3)
Quinolona 0 0 8 8 0 0
Macrólido monoterapia 0 0 8 8 1(3.1) 2(6.3)
Otros regímenes 0 9 (24.3)c
3(1.7) 32(12.9)
8 8 0 4(6.1)
Total 8 8 9(2.1) 23(5.4)

Tesis Doctoral
Soledad María Reyes Calzada Página 46
Tabla 4. Resultados del análisis de regresión logística para predecir
mortalidad, reingreso y estancia hospitalaria prolongada.
NS: no significativo
Variables dependientes: mortalidad, reingreso y estancia prolongada (>8 días)
Variables independientes: PSI (bajo y alto riesgo), hospital de ingreso (A,B,C,D), Tratamiento adherente
(si/no) y régimen antibiótico empírico clasificado en: beta-lactámico en monoterapia, beta-lactámico más
macrolidos, quinolonas, macrolido en monoterapia y otros regimenes
Gráfico 1: Mortalidad real y predicha para cada régimen antibiótico.
Mortalidad
OR (95%CI)
Reingreso
OR (95%CI)
Estancia prolongada
OR (95%CI)
FINE(IV-V/I-III) 11.1 (2.6-48.1) NS NS
Adherencia NS NS NS
Otros regímenes 3 (1.2-7.3) NS NS
Betalactámicos NS 2.7 (1.2-6.1) NS
Hospital A NS NS NS
Hospital B NS NS NS
Hospital C NS NS NS
Hospital D NS NS 0.2 (0.1-0.5)
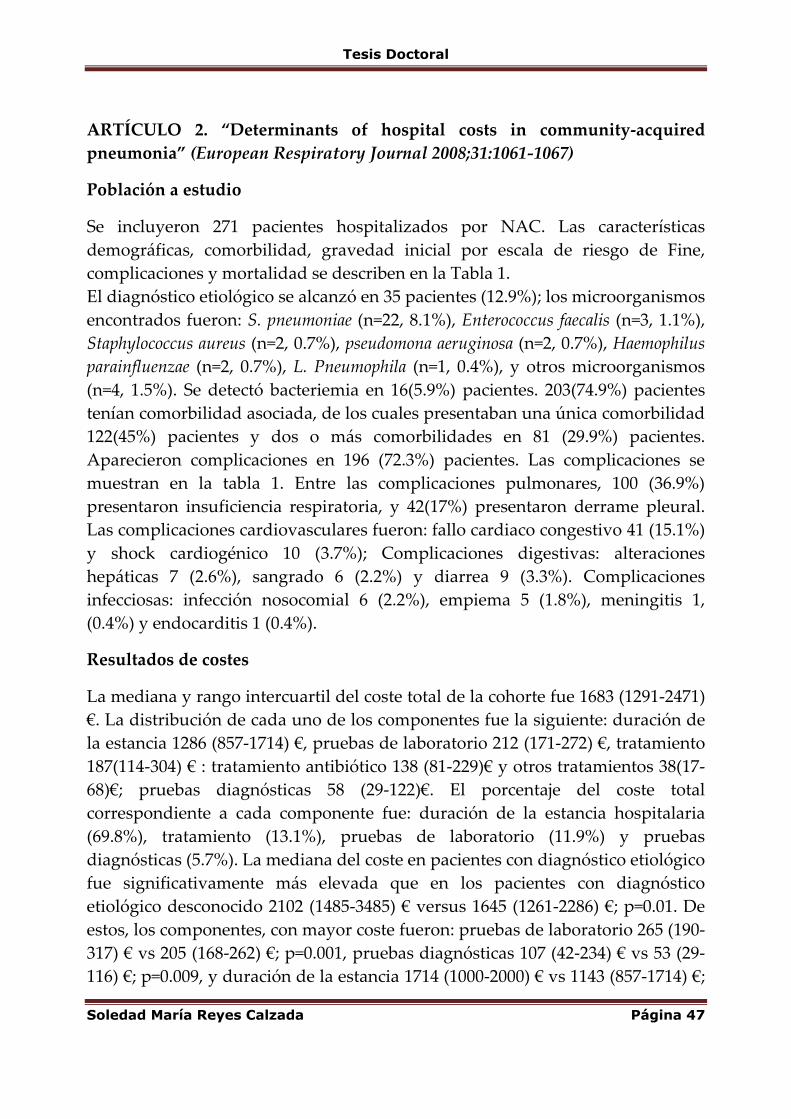
Tesis Doctoral
Soledad María Reyes Calzada Página 47
ARTÍCULO 2. “Determinants of hospital costs in community-acquired
pneumonia” (European Respiratory Journal 2008;31:1061-1067)
Población a estudio
Se incluyeron 271 pacientes hospitalizados por NAC. Las características
demográficas, comorbilidad, gravedad inicial por escala de riesgo de Fine,
complicaciones y mortalidad se describen en la Tabla 1.
El diagnóstico etiológico se alcanzó en 35 pacientes (12.9%); los microorganismos
encontrados fueron: S. pneumoniae (n=22, 8.1%), Enterococcus faecalis (n=3, 1.1%),
Staphylococcus aureus (n=2, 0.7%), pseudomona aeruginosa (n=2, 0.7%), Haemophilus
parainfluenzae (n=2, 0.7%), L. Pneumophila (n=1, 0.4%), y otros microorganismos
(n=4, 1.5%). Se detectó bacteriemia en 16(5.9%) pacientes. 203(74.9%) pacientes
tenían comorbilidad asociada, de los cuales presentaban una única comorbilidad
122(45%) pacientes y dos o más comorbilidades en 81 (29.9%) pacientes.
Aparecieron complicaciones en 196 (72.3%) pacientes. Las complicaciones se
muestran en la tabla 1. Entre las complicaciones pulmonares, 100 (36.9%)
presentaron insuficiencia respiratoria, y 42(17%) presentaron derrame pleural.
Las complicaciones cardiovasculares fueron: fallo cardiaco congestivo 41 (15.1%)
y shock cardiogénico 10 (3.7%); Complicaciones digestivas: alteraciones
hepáticas 7 (2.6%), sangrado 6 (2.2%) y diarrea 9 (3.3%). Complicaciones
infecciosas: infección nosocomial 6 (2.2%), empiema 5 (1.8%), meningitis 1,
(0.4%) y endocarditis 1 (0.4%).
Resultados de costes
La mediana y rango intercuartil del coste total de la cohorte fue 1683 (1291-2471)
€. La distribución de cada uno de los componentes fue la siguiente: duración de
la estancia 1286 (857-1714) €, pruebas de laboratorio 212 (171-272) €, tratamiento
187(114-304) € : tratamiento antibiótico 138 (81-229)€ y otros tratamientos 38(17-
68)€; pruebas diagnósticas 58 (29-122)€. El porcentaje del coste total
correspondiente a cada componente fue: duración de la estancia hospitalaria
(69.8%), tratamiento (13.1%), pruebas de laboratorio (11.9%) y pruebas
diagnósticas (5.7%). La mediana del coste en pacientes con diagnóstico etiológico
fue significativamente más elevada que en los pacientes con diagnóstico
etiológico desconocido 2102 (1485-3485) € versus 1645 (1261-2286) €; p=0.01. De
estos, los componentes, con mayor coste fueron: pruebas de laboratorio 265 (190-
317) € vs 205 (168-262) €; p=0.001, pruebas diagnósticas 107 (42-234) € vs 53 (29-
116) €; p=0.009, y duración de la estancia 1714 (1000-2000) € vs 1143 (857-1714) €;

Tesis Doctoral
Soledad María Reyes Calzada Página 48
p=0.01. No encontramos diferencias en los costes según microorganismo. Sin
embargo, la mediana total del coste en pacientes con bacteraemia fue
significativamente más elevada 2083 (1507-3775) €, que los no bacteriémicos 1628
(1231-2402) €; p=0.04. Cuando estos costes se desglosaron en sus componentes,
los costes más elevados fueron los de laboratorio 256 (196-384) € vs 213 (175-271)
€, p=0.049 y la duración de la estancia 1714 (1143-2429) vs 1143 (857-1714) €,
p=0.03.
Los costes deacuerdo con la edad, sexo, vacunación antigripal, comorbilidades y
complicaciones se describen en la table 2. Se registró una tendencia hacia el
aumento de costes entre los pacientes mayores de 70 años de edad, aunque no se
alcanzó la significación estadística. La vacunación contra el virus influenza no se
relacionó significativamente con la gravedad inicial, la duración de la estancia o
los costes. En los pacientes sin comorbilidad, el coste total promedio fue de 1631
(1304-2218) €, mientras que, en pacientes con una sola condición de
comorbilidad, el coste fue de 1637 (1180-2320) €, y en aquellos con dos o más
comorbilidades, fue 1771 (1386-2695) €; p = 0.03.
Los costes directos de acuerdo con la escala de gravedad de Fine se describen en
la Tabla 3. Se observó una correlación positiva entre el coste total (rho = 0.15, p =
0.009), así como el coste de cada uno de los componentes, a excepción de las
pruebas de diagnóstico y la escala de Fine, es decir, a mayor clase de riesgo,
mayor coste.
El coste total medio de las neumonías sin complicaciones fue de 1295 (1055-1637)
€ frente a 1.692 (1392-2083) € en los pacientes con una sola complicación, y 2111
(1485-3007) € en pacientes con dos o más complicaciones; p = 0.0001 (Tabla 4).
Las diferencias fueron significativas para cada uno de los componentes del coste.
Los costes totales de acuerdo con el tipo de complicaciones se representan en la
Tabla 2; las complicaciones infecciosas, renales y cardiovasculares tenían costes
más elevados.
La mediana del coste total de los supervivientes fue 1690 (1294- 2313) €, y en los
no supervivientes 1574 (978- 3476), p = 0.9. Hubo diferencias significativas en los
siguientes componentes del coste entre los supervivientes y no supervivientes:
coste del tratamiento 177 (113-281) € vs 353 (123-584) €; p = 0.004, en el
tratamiento no antibiótico 33 (15-66) € vs 63 (23 a 271) €; p = 0,001 y en los costes
de laboratorio 205 (168-265) vs 260 (204-298) €; p = 0,003. Sin embargo, no
encontramos diferencias en el coste de la duración de la estancia, 1.286 (857-

Tesis Doctoral
Soledad María Reyes Calzada Página 49
1714) vs 1.000 (429-2.286) €; p = 0.1, aunque la duración de la estancia fue mayor
para los supervivientes (mediana 9 días) que en los no supervivientes (mediana
7 días).
Factores relacionados con coste elevado
Análisis univariado.
La edad avanzada del paciente, el sexo, los hábitos tóxicos, el asilo y las
comorbilidades no se asociaron significativamente con coste elevado en la NAC.
En contraste, la hospitalización previa se asoció con un mayor coste (mediana
1624 € frente a 1888 €, p = 0.01). La gravedad inicial elevada también se asoció
con alto coste (p = 0.01) (Tabla 3). Las alteraciones de laboratorio que se
encuentran en pacientes con altos costes fueron: urea elevada (p = 0.01),
hiperglucemia (p = 0.007), insuficiencia respiratoria (p = 0.002), y la
hipoalbuminemia (p = 0.0001). La mediana del coste de todas las complicaciones
(pulmonar, infecciosa, cardiovascular, digestivo, renal y otros) se asoció
significativamente con alto coste, p = 0.0001
Análisis multivariado. Las siguientes variables independientes se incluyeron en el
modelo, ya que resultaron significativas en el análisis univariado: la
hospitalización previa, insuficiencia respiratoria, hipoalbuminemia, urea
elevada, la hiperglucemia, gravedad inicial elevada y las complicaciones. La
edad avanzada y las comorbilidades (no significativas) también fueron incluidos
porque constituían uno de los objetivos de nuestro estudio. El modelo
matemático seleccionado las siguientes variables asociadas con coste elevado
(Tabla 5): complicaciones infecciosas, digestivas, pulmonares y otras
complicaciones, hipoalbuminemia y admisión previa en el hospital.

Tesis Doctoral
Soledad María Reyes Calzada Página 50
Table 1. Características de la población a estudio
Edad (media ± DT) 70±15
Sexo (M/F) 161 (59.4) / 110 (40.6)
Fumador n (%) 41 (15.1)
Alcohol n (%) 41 (15.1)
Asilo n (%) 8 (3.0)
Comorbilidad n (%)
Neoplasia 13 (4.8)
Hepatopatía 9 (3.3)
Cardiovascular 89 (32.8)
Cerebrovascular 31 (11.4)
Nefropatía 16 (5.9)
Diabetes 57 (21.0)
EPOC 69 (25.5)
Fine n (%)
I 22 (8.1)
II 36 (13.3)
III 53 (19.6)
IV 113 (41.7)
V 47 (17.3)
Duración estancia (mediana) 9
Complicaciones n (%)
Pulmonares 142 (52.4)
Renales 21 (7.7)
Cardiovascular 51 (18.8)
Digestivas 22 (8.1)
Infecciosas 13 (4.8)
Otras 55 (20.3)
Mortalidad n (%) 30 (11.1)
M: male; F: female; COPD: chronic obstructive pulmonary disease;

Tesis Doctoral
Soledad María Reyes Calzada Página 51
Tabla 2. Costes hospitalarios según edad y sexo, presencia de comorbilidades
y complicaciones.
Si No p*
Sexo (Hombre) 1636 (1177-2392) 1812 (1370-2533) 0.2
Edad ≤ 70 años 1548 (1178-2281) 1804 (1367-2548) 0.06
Vacunación antigripal 1796 (1371-2483) 1547 (1333-2786) 0.6
Comorbilidades
Neoplasia 1291 (1030-2059) 1691 (1328-2513) 0.1
Hepatopatía 1426 (1173-2148) 1691 (1292-2504) 0.4
Cardiopatía 1700 (1343-2695) 1665 (1229-2292) 0.5
Sistema nervioso central 1833 (1291-2730) 1655 (1278-2354) 0.2
Nefropatía 1696 (1337-2433) 1674 (1273-2471) 0.7
Diabetes 1700 (1378-2715) 1665 (1271-2367) 0.4
EPOC 1771 (1320-2674) 1658 (1271-2274) 0.2
Complicaciones
Respiratorias 1996 (1394-2843) 1485 (1122-1979) 0.001
Derrame pleural 2324 (1487-3321) 1630 (1250-2206) 0.001
Insuficiencia respiratoria 1846 (1380-2665) 1533 (1175-2140) 0.004
Infeccciones 2783 (2045-6161) 1645 (1271-2332) 0.005
Empiema 2075 (1531-2892) 1666 (1287-2427) 0.3
Infección nosocomial 3405 (1728-5716) 1659 (1282-2392) 0.06
Cardiovascular 2691 (1375-3485) 1634 (1261-2154) 0.002
Digestivas 2591 (1755-3807) 1634 (1263-2275) 0.002
Renales 2744 (1414-3616) 1655 (1271-2292) 0.04
Otras 2068 (1516-3607) 1620 (1182-2223) 0.0001
Resultados expresados en mediana (p25-p75) costes en €; * Mann-Whitney U-test.
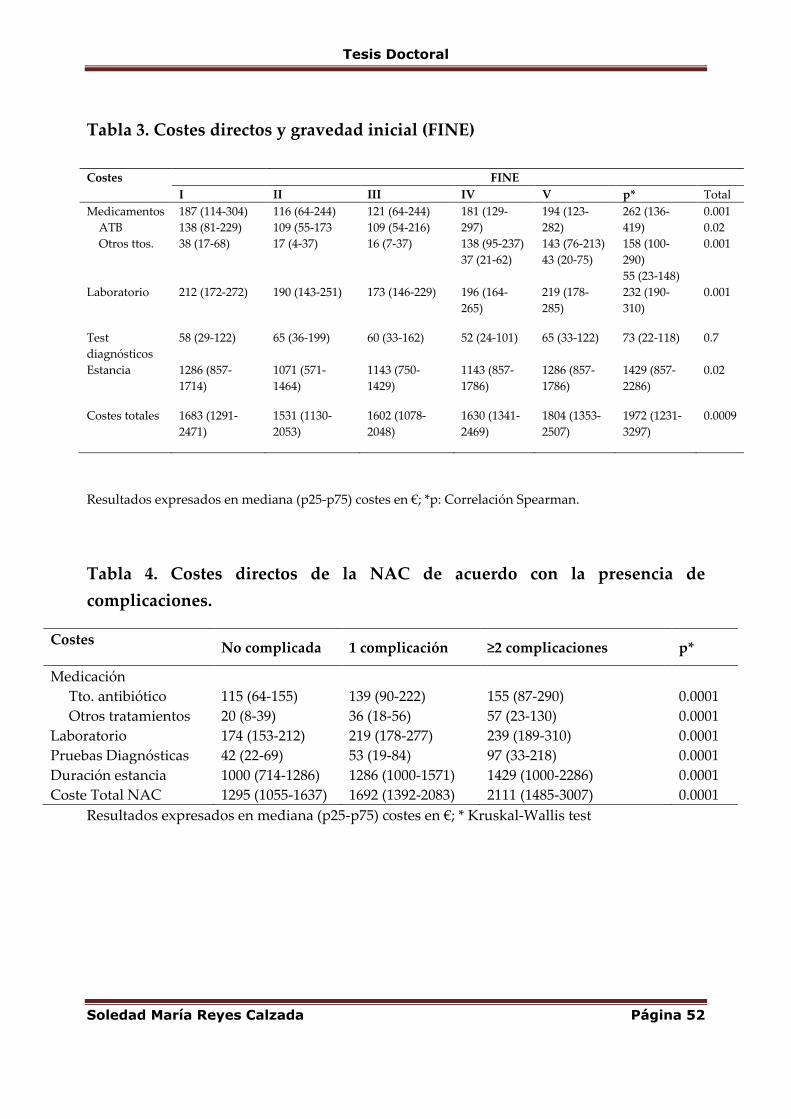
Tesis Doctoral
Soledad María Reyes Calzada Página 52
Tabla 3. Costes directos y gravedad inicial (FINE)
Resultados expresados en mediana (p25-p75) costes en €; *p: Correlación Spearman.
Tabla 4. Costes directos de la NAC de acuerdo con la presencia de
complicaciones.
Costes No complicada 1 complicación ≥2 complicaciones p*
Medicación
Tto. antibiótico
Otros tratamientos
115 (64-155)
20 (8-39)
139 (90-222)
36 (18-56)
155 (87-290)
57 (23-130)
0.0001
0.0001
Laboratorio 174 (153-212) 219 (178-277) 239 (189-310) 0.0001
Pruebas Diagnósticas 42 (22-69) 53 (19-84) 97 (33-218) 0.0001
Duración estancia 1000 (714-1286) 1286 (1000-1571) 1429 (1000-2286) 0.0001
Coste Total NAC 1295 (1055-1637) 1692 (1392-2083) 2111 (1485-3007) 0.0001
Resultados expresados en mediana (p25-p75) costes en €; * Kruskal-Wallis test
Costes FINE
I II III IV V p* Total
Medicamentos
ATB
Otros ttos.
187 (114-304)
138 (81-229)
38 (17-68)
116 (64-244)
109 (55-173
17 (4-37)
121 (64-244)
109 (54-216)
16 (7-37)
181 (129-
297)
138 (95-237)
37 (21-62)
194 (123-
282)
143 (76-213)
43 (20-75)
262 (136-
419)
158 (100-
290)
55 (23-148)
0.001
0.02
0.001
Laboratorio 212 (172-272) 190 (143-251) 173 (146-229) 196 (164-
265)
219 (178-
285)
232 (190-
310)
0.001
Test
diagnósticos
58 (29-122) 65 (36-199) 60 (33-162) 52 (24-101) 65 (33-122) 73 (22-118) 0.7
Estancia 1286 (857-
1714)
1071 (571-
1464)
1143 (750-
1429)
1143 (857-
1786)
1286 (857-
1786)
1429 (857-
2286)
0.02
Costes totales 1683 (1291-
2471)
1531 (1130-
2053)
1602 (1078-
2048)
1630 (1341-
2469)
1804 (1353-
2507)
1972 (1231-
3297)
0.0009

Tesis Doctoral
Soledad María Reyes Calzada Página 53
Tabla 5. Análisis de regresión logística: factores asociados con alto coste.
(>mediana coste total de NAC: 1683€).
OR (IC 95%)
Hospitalización previa 2.3 (1.2-4.3)
Hipoalbuminemia 2.0 (1.1-3.6)
Complicaciones infecciosas 6.8 (1.3-36)
Complicaciones digestivas 5.9 (1.5-22.8)
Complicaciones pulmonares 2.6 (1.4-4.7)
Otras complicaciones 3.9 (1.8-8.4)

Tesis Doctoral
Soledad María Reyes Calzada Página 54
ARTÍCULO 3. “Economic evaluation of adherence to treatment guidelines in
nonintensive care pneumonia” (European Respiratory Journal 2007;29:751-756)
En nuestro estudio se incluyeron 271 pacientes. En la tabla 1, se muestran las
características demográficas, la severidad inicial y la progresión clínica de los
pacientes del grupo adherente y del no adherente. Como podemos observar en
la Tabla 1, no hubo diferencias significativas en las variables demográficas,
comorbilidad o gravedad inicial.
La mortalidad global fue 11%, 10% en el grupo adherente frente a 13.6% en el
grupo no adherente (p=0.3). La duración de la hospitalización fue de 9,8±5,5
días, en el grupo adherente 9,7±5,2 frente a 10,1±6,2 en el grupo no adherente
p=0.1. En cuanto al reingreso, 2% en el grupo adherente vs 6% en el no adherente
(p>0.05)
Cálculos económicos: minimización de coste y análisis coste-efectividad
Entre los resultados del cálculo económico, la media del coste para cada
componente fue: coste tratamiento: 267±317 €, coste pruebas diagnósticas y
laboratorio 353,9±297€, estancia hospitalaria 1403±789€.
En la siguiente Tabla 2 se muestran los costes separados según adherencia o no
al tratamiento. La adherencia al tratamiento resultó la mejor opción para el
paciente en cuanto a resultados (88% vs 81% pacientes curados) y menor coste,
aunque sin alcanzar diferencias estadísticas significativas (p>0.05).
En nuestro estudio se realizaron dos métodos de evaluación económica: 1ª
análisis de minimización de costes, ya que la diferencia en los resultados entre
las dos opciones no se encontró estadísticamente significativa; y 2ª un análisis de
coste efectividad con un método de bootstrapping, ya que este estudio no fue
diseñado para mostrar la equivalencia de los tratamientos.
Análisis de minimización de costes:
El coste incremental entre las dos opciones fue de 78,5 euros (CI 95% -261,7-
418,7). La adherencia a normativas SEPAR ahorró 78,5 euros por paciente en
comparación con el tratamiento no adherente.
Análisis de coste efectividad:
La relación coste-efectividad (C / E) o media del coste por paciente curado fue
2277 € en el grupo adherente y 2.567 € en el grupo no adherente. La relación

Tesis Doctoral
Soledad María Reyes Calzada Página 55
coste-efectividad incremental (ICER) fue negativa, lo que indica que el
tratamiento de acuerdo con las directrices tiene un ahorro de 1.121 euros por
paciente curado en comparación con la opción alternativa de la no adherencia.
Utilizamos un método no paramétrico de bootstrapping usando 2000 re-
muestras con el fin de realizar un análisis estocástico.
El ICER para este bootstrap fue -942.7 euros (IC del 95% -1885.8-0.37). El ICER
tuvo valores <1256 euros en 80% y < 3616 euros en el 90% de las remuestras.
Análisis de sensibilidad:
Se realizaron tres análisis de sensibilidad con los diferentes componentes de los
costes totales, incluyendo: antibióticos, estancia hospitalaria, pruebas de
laboratorio y diagnósticos. Para cada análisis de sensibilidad, todos los costes
fueron re-calculados utilizando los límites extremos del IC del 95% de cada
componente. Para el límite superior e inferior del IC del 95% de la media (tabla
3), la media-coste por paciente en los dos grupos fue recalculado, así como la
relación coste-efectividad y la relación coste-efectividad incremental. Los
resultados (tabla 4) muestran que los resultados de coste-efectividad
permanecen estables a pesar de ser sometido a grandes variaciones en los
diferentes componentes de los costes.

Tesis Doctoral
Soledad María Reyes Calzada Página 56
Tabla 1. Características demográficas, comorbilidad y clase de riesgo inicial en
los grupos de tratamiento adherente/no adherente a las guías clínicas
Adherencia guías clínicas P
Si N = 190 (%) No; N = 81 (%)
Sexo; M/F 82/108 28/53 0.1
Edad; años 69.4±15.6 72.3±14 0.1
Asilo 5(2.6) 3(3.7) 0.6
Tabaco 31(16.3) 10(12.1) 0.3
Hospitalización año
previo
58 (30.5) 24(29.6) 0.8
Antibiótico previo 71/190(37.3) 25/81(30.8) 0.3
Diabetes 40(21.1) 17(21) 0.9
Neoplasia 10(5.3) 3(3.7) 0.5
Hepatopatía 6(3.2) 3(3.7) 0.5
Insuficiencia cardiaca 65(34.2) 24(29.6) 0.4
Enfermedad
cerebrovascular
21(11.1) 10(12.3) 0.7
Enfermedad Renal 12(6.3) 4(4.9) 0.6
EPOC 42(22.1) 27(33.3) 0.06
FINE
I 19 (10) 3(3.7) 0.09
II 23(12.1) 13(16)
III 31(16.3) 22(27.2)
IV 84(44.2) 29(35.8)
V 33(17.4) 14(17.3)
Datos en media±desviación típica o n(%)

Tesis Doctoral
Soledad María Reyes Calzada Página 57
Tabla 2. Resultados de costes en los grupos adherente/no adherente
Adherencia a las guías clínicas
Media
Mediana (p25-p75)
p
Si No
Coste tratamiento (total) 257.9
190.9(113.6-303.3)
289.3
181.1(114.5-311.3)
0.8
Antibióticos 176.8
139.3(82.8-227.4)
170.8
135.2(73.6-236.8)
0.6
Otros 80.3
38.0(14.9-68.3)
118.5
37.7(22.4-69.6)
0.3
Test diagnóstico/laboratorio 355.8
291.5(216.7-393.7)
349.2
283.0(213.5-391.0)
0.6
Estancia hospitalaria 1387.3
1142.9(857.2-1750.1)
1441
1285.8(857.2-1714.4)
0.7
Coste Total 2001.1
1665.5 (1294.8-2513.1)
2.079.6
1710.5(1181.2-2366.7)
0.8
Tabla 3. Valores medios de las variables incluidas en el análisis de
sensibilidad.
Variable Media IC 95%
Límite inferior
IC 95%
Límite superior
Tratamiento antibiótico
Adherencia 176.8 154.8 198.8
No adherencia 170.8 137.8 203.8
Test diagnósticos/laboratorio
Adherencia 355.8 310.5 401.3
No adherencia 349.2 295.1 403.4
Estancia hospitalaria
Adherencia 1387.3 1281.1 1493.6
No adherencia 1441.1 1243.7 1638.4

Tesis Doctoral
Soledad María Reyes Calzada Página 58
Tabla 4. Resultados del análisis coste-efectividad y sensibilidad comparando
el grupo de tratamiento adherente/no adherente.
Coste Efectividad
(%)
C/E ICER Resultado
Análisis cohorte
Adh/ No adh 2.001/2.079 88/81 2276.7/2566.6 -1121 Dominante
Análisis sensibilidad 1
Tratamiento
IC 95% L.inf (Adh/no Adh) 2.251.7/2.511.8 88/81 2.558.7/3.100.9 -3715 Dominante
IC 95%; L.sup(Adh/no Adh) 2.301.8/2.592.7 88/81 2.615.7/3200.8 -4155.7 Dominante
Análisis sensitibilidad 2
Diagnosticos
IC 95%; L.inf(Adh/no Adh) 2225.1/2485.8 88/81 2528.5/3068.8 -3724 Dominante
IC 95%; L.sup(Adh/no Adh) 2328.4/2618.7 88/81 2645.9/3232.9 -4147 Dominante
Análisis sensitibilidad 3
Hospitalización
IC 95%; L.inf(Adh/no Adh) 2155.8/2310.1 88/81 2449.7/2851.9 -2.202 Dominante
IC 95%; L.sup(Adh/no Adh) 2397.6/2794.5 88/81 2724.5/3450.8 -5670 Dominante
Dominante: menor coste y mejores resultados.


Tesis Doctoral
Soledad María Reyes Calzada Página 59
DISCUSION


Tesis Doctoral
Soledad María Reyes Calzada Página 60
El proceso de investigación en la presente Tesis se consideran el punto de
partida para iniciar la discusión sobre el alcance de los resultados de los trabajos
presentados en esta investigación.
ESTUDIO 1
Las características de la población de este estudio fueron similares en los
cuatro hospitales analizados y semejante a los estudios de NAC hospitalizada.
La elección del tratamiento empírico se realizó según las normativas SEPAR [20,
21] en un porcentaje elevado de pacientes 76.5%, con diferente grado de
adherencia entre los cuatro hospitales. Los resultados globales mostraron que la
pauta utilizada con más frecuencia era la que incluía un beta-láctamico más un
macrólido, este hallazgo se confirma en estudios realizados previamente
nacionales e internacionales [22] [15], pero destaca que en un 9-31% se
emplearon pautas o regímenes con antibióticos diferentes a los recomendados
por las normativas. Así, en el hospital B, se instauraron más otros regímenes
antibióticos, debido a una mayor utilización de cefalosporinas de 2ª generación
más macrólidos, que aunque no se adhiere a la normativa SEPAR, por el
contrario sí que sigue la normativa americana [23]. La distribución de las pautas
antibióticas según clase de riesgo inicial fue similar tanto para clases de riesgo
bajo como alto, excepto una mayor utilización de macrólidos en monoterapia en
pacientes menos graves.
La mortalidad encontrada en nuestro estudio (8,2%) fue similar a la
encontrada por otros autores [24-27] y se ajustó a la clase de riesgo de Fine.
Como hallazgo destacable encontramos que la mortalidad fue superior, sin
alcanzar la significación estadística, en pacientes tratados con pautas no
adherentes. Este hallazgo es más evidente en los pacientes con Fine V (38.5%
versus 18.2%). Otros autores ya habían constatado menor mortalidad cuando el
tratamiento se adhería a las normativas [15, 28, 29].
El análisis pormenorizado de las pautas antibióticas empleadas en nuestro
estudio, muestran de forma global que la mortalidad fue superior en los
pacientes tratados con pautas no habituales (13,6% vs 8,2%). Cuando se analiza
en el grupo de pacientes graves, la mortalidad en los tratados con pautas no
frecuentes aumenta de forma significativa (24,3% vs 6,8% y 13,1%). De hecho, la
diferencia encontrada para cada pauta antibiótica entre la mortalidad real en el
estudio y la esperada por clase de riesgo (gráfico 1), evidencia el incremento de
muerte para este mismo grupo. Lo contrario sucedió con el resto de pautas

Tesis Doctoral
Soledad María Reyes Calzada Página 61
antibióticas, donde la mortalidad real fue menor. En este sentido otros autores
[28] [8] [30], también encontraron mayor mortalidad en el grupo de enfermos
tratados con pautas no habituales.
En el análisis multivariado para predecir mortalidad tras ajustar por Fine,
se confirma que las pautas no habituales tienen una tendencia a mayor
mortalidad con una OR 3 IC 95% (1.2-7.3).
En los pacientes de bajo riesgo, la mortalidad en los tratados con
macrólidos y quinolonas en monoterapia fue inferior a la de los tratados con
beta-lactámicos en monoterapia. Sin embargo, estos hallazgos hay que
interpretarlos con cautela dado el escaso número de enfermos tratados con esta
pauta y la escasa mortalidad propia de estas clases de riesgo.
La duración de la estancia hospitalaria no mostró diferencias significativas
para las distintas pautas antibióticas, de hecho, tuvo más influencia el hospital
donde ingresó el paciente. La duración fue menor en el hospital D y tampoco se
relacionó con la adherencia o no a las normativas o con el uso de macrólidos.
Algunos investigadores [31] [32] [33], encontraron menores estancias
hospitalarias en pacientes tratados con macrólidos, pero no todos los autores
coinciden en estos hallazgos [34] y posiblemente la duración de la
hospitalización depende más de factores del propio paciente y del hospital [35-
37]. Una guía clínica es buena cuando produce una reducción de consumo de
recursos y de la duración de estancia hospitalaria sin causar efectos adversos en
la mortalidad o en los reingresos. [38]
El reingreso de forma global fue de 7,6% y mostró tendencia a ser más
elevado en los tratados con beta-lactámico en monoterapia y sobre todo en las
neumonías graves (IV y V). En el estudio multivariado se encontró que, de
forma independiente, el tratamiento beta-lactámico en monoterapia, fue un
factor de riesgo de reingreso (OR 2,4). No existen apenas datos en la literatura
referentes al reingreso en la NAC y las distintas pautas antibióticas [39] .
En conclusión, existe una alta adherencia a las normativas de tratamiento
en la NAC hospitalizada, pero existe una amplia variabilidad de pautas
antibióticas empíricas que se utilizan en la práctica clínica diaria. El empleo de
pautas no adherentes se asocia con mayor tendencia de muerte en la NAC grave.
Existen algunas pautas antibióticas que se asocian a menor porcentaje de
reingreso sin influir apenas en la duración de la estancia hospitalaria. Los beta-

Tesis Doctoral
Soledad María Reyes Calzada Página 62
lactámicos se asociaron a mayor reingreso, aunque se necesitan más estudios
para confirmar este suceso.
ESTUDIO 2
Los costes anuales de la neumonía han sido estimados por la Sociedad
Respiratoria Europea en 10,1€ billones en Europa. De estos, 5,7€ billones
corresponden al coste de pacientes hospitalizados por NAC [3]. En España,
Monge y sus colaboradores [40, 41] registraron 53000 hospitalizaciones al año
con un coste sanitario anual de 115€ millones. En este estudio, los costes
documentados fueron ligeramente superiores a los registrados en la literatura
nacional y europea. En otros estudios realizados en España, los costes directos
de pacientes hospitalizados fueron 1210€ [42] y 1553€ [43]. En Europa, los costes
directos oscilaron entre 1333€ en Alemania [44], hasta 2550€-7650€ en el Reino
Unido [45]. Sin embargo, los coste europeos fueron significativamente más bajos
que los registrados en EEUU, a pesar de medias de estancias hospitalarias más
largas [11, 46] [47]. En un estudio prospectivo de 4 hospitales de EEUU, Fine et
al., [11] determinó un coste total medio de 4468€ en pacientes hospitalizados por
NAC.
La decisión de hospitalización depende de muchos factores, como la
gravedad inicial, las comorbilidades y las complicaciones. En sujetos de edad
avanzada, la hospitalización se decide en base a comorbilidad asociada y
complicaciones, ambos factores son muy frecuentes en este grupo de población
[47, 48] [10]. Sin embargo, en los jóvenes adultos, la mayor probabilidad de
ingreso hospitalario se determina por la presencia de complicaciones graves y en
menor medida por las comorbilidades [48, 49].
La contribución de cada uno de estos factores, comorbilidad, gravedad
inicial y complicaciones en los costes totales de la NAC hospitalizada no han
sido estudiados de forma extensa, aunque existen algunos estudios previos que
han analizado el efecto de la edad del paciente. Así, Bartolomé y cols [43]
encontraron costes significativamente más altos en pacientes de edad ≥ 65 años
aunque no se detalla ni el impacto de la gravedad o de la enfermedad asociada.
Asimismo, Niederman y cols [10] encontraron costes más elevados en pacientes
>65 años 305$ millones versus 192$ millones en <65años. Esta diferencia en el
coste fue fundamentalmente atribuible al mayor porcentaje de hospitalizaciones
y a estancias hospitalarias más prolongadas en pacientes ancianos. Sin embargo,
el impacto de la comorbilidad en el coste solo se confirmó en aquellos pacientes
que requirieron servicios respiratorios, posiblemente en relación con estancias

Tesis Doctoral
Soledad María Reyes Calzada Página 63
hospitalarias prolongadas. Mientras que los resultados de nuestro estudio
muestran una tendencia hacia el incremento del coste en pacientes mayores de
70 años, la diferencias no alcanzaron la significación estadística, y la edad no fue
seleccionada como variable independiente en el análisis multivariado. Además,
la presencia de dos o más comorbilidades no causó un aumento significativo de
los costes hospitalarios
En el presente estudio, obtuvimos un incremento en los costes en
pacientes con NAC más severa y que cursaron con más complicaciones. Bauer et
al [44] demostró costes más elevados en pacientes con neumonías más severas,
que requirieron ingreso en UCI comparado con pacientes con neumonías menos
graves, debido sobre todo a estancias hospitalarias más prolongadas (2300$
versus 1242$); p<0.0001). Kaplan et al [48], también encontró pacientes con NAC
complicada (con ingreso en UCI o necesidad de ventilación mecánica) con
estancias hospitalarias más prolongadas e incremento en los costes comparados
con los pacientes con neumonías no complicadas (8725$ versus 3754$). Aunque
nuestro estudio no incluyó pacientes que requirieron UCI, en pacientes con
mayor puntuación en la escala de riesgo de Fine obtuvimos costes más elevados
debido a mayor número de estudios solicitados y mayor estancia hospitalaria.
Kaplan et al [48] también encontró que en pacientes >65 años y comorbilidad
asociada presentaban más complicaciones. Sin embargo, estos hallazgos también
se explican por el hecho de que el PSI era mayor en este grupo.
El porcentaje de las neumonías complicadas en nuestra cohorte fue
elevado (72,3%), aunque similar a las cifras reportadas en la literatura. [50] Las
complicaciones infecciosas fueron las que ocasionaron mayores costes directos
totales, sobretodo la infección nosocomial (3405€). Es bien conocido que, aunque
la incidencia de la infección nosocomial es baja en la NAC, es una causa de
fracaso del tratamiento y empeora seriamente el pronóstico [51]. Los presentes
autores encontraron esta complicación como causa de coste elevado de hasta seis
veces, debido a la necesidad de más pruebas, tratamientos, y sobre todo, debido
a la prolongación de LOS [52].
Sin embargo, el impacto global de las complicaciones pulmonares,
cardiacas y renales sobre el coste global de la NAC fue elevado, ya que
produjeron un incremento significativo en los costes, y sobretodo porque su
incidencia fue mucho mayor. Por otra parte, no fue raro encontrar
más de una complicación, una condición que a su vez
generó un aumento del coste.

Tesis Doctoral
Soledad María Reyes Calzada Página 64
El análisis multivariado confirmó que las complicaciones infecciosas (OR
6.8), digestivas (OR 5.9), pulmonar (OR 2.6) y otras
complicaciones (OR 3,9) fueron los factores de riesgo independientes más fuertes
para coste elevado. Además, otras dos variables con
efectos independientes fueron identificadas en el modelo matemático:
hipoalbuminemia (OR 2,0) y la hospitalización previa (OR 2,3). La
hipoalbuminemia se asocia con neumonías más severas, y es más frecuente en
ancianos.
Esto contribuye a una respuesta clínica más lenta al tratamiento y peor
pronóstico. [36, 53] Cabré et al [54] encontraron que la hospitalización previa era
un factor predictor de mala evolución en el paciente e incremento de la
mortalidad a los 30 días. Una posible explicación para esto es que la
hospitalización previa es más frecuente en pacientes ancianos [55]. La edad
avanzada les predispone a condiciones más serias, la aparición de
complicaciones y mayor mortalidad [6, 54, 56]. Sin embargo, la literatura
existente no muestra una relación directa entre hospitalización previa, y costes
hospitalarios, aunque todos estos factores producen un incremento total del
coste de la NAC. Curiosamente, ni la edad ni la comorbilidad se asoció de forma
independiente con un incremento del coste en el paciente hospitalizado.
Observaciones similares se aplican al PSI, efecto que también desapareció en el
análisis multivariado. Por lo tanto, el coste hospitalario de la NAC no fue
significativamente mayor en pacientes con comorbilidades, o con PSI elevado, si
no tenían complicaciones asociadas.
En conclusión, las complicaciones, la hipoalbuminemia y la
hospitalización previa fueron los determinantes más importantes de alto coste
asociada a pacientes hospitalizados por NAC. Sin embargo, ni la edad ni las
comorbilidades contribuyeron a elevar los costes directos. La gravedad inicial
(Fine) por sí sola no fue factor de riego independiente para alto coste tampoco.
Estrategias diseñadas para prevenir complicaciones durante la estancia
hospitalaria, y un tratamiento precoz de las complicaciones que aparezcan,
podría contribuir a reducir los costes intrahospitalarios de la NAC.
ESTUDIO 3
Las directrices de las sociedades científicas ayudan al médico en la
selección del tratamiento y su objetivo es mejorar los resultados. En el presente

Tesis Doctoral
Soledad María Reyes Calzada Página 65
estudio, la adherencia a las directrices españolas fue bastante alta (70%) y similar
a la descrita en la literatura, aunque hay una amplia variación entre los
hospitales y médicos [29, 57, 58]. Existen varios factores que podrían explicar el
incumplimiento de las directrices: varios especialistas prescriben el tratamiento
en los servicios de urgencias, la inercia de la práctica anterior (>50%
cefalosporinas segunda generación +/- macrólido o macrólido en monoterapia) o
diferente percepción de la influencia beneficiosa de las directrices [59], aunque
en el presente estudio este interesante tema no ha sido específicamente
investigado. No se encontraron diferencias significativas para el tratamiento de
los pacientes según la edad, el sexo, la comorbilidad y gravedad inicial. La eficacia de la adherencia a las guías en el tratamiento empírico inicial
ha sido evaluada por su impacto en la mortalidad, respuesta clínica, duración de
la estancia hospitalaria y, menos sistemática, en los costes [15, 29, 60]. Existen
varios estudios que han encontrado una menor mortalidad cuando el
tratamiento es adherente a las directrices [8, 28, 57, 60] y, además, una
estabilidad clínica más rápida [52]. Sin embargo, sigue existiendo una falta de
estudios que analicen una evaluación fármacoeconómica centrándose en los
costes [21] [61].
Un análisis de costo-efectividad (CEA) es una herramienta útil cuando
evaluamos costes y resultados con diferentes modalidades de tratamiento. Como
tal, es ideal en el contexto actual [62, 63], incluso cuando no hay diferencias
estadísticamente significativas como se ha demostrado en este estudio. De
hecho, un análisis coste- efectividad se considera un análisis adecuado cuando se
encuentra una falta de significación y el estudio no fue diseñado para demostrar
la equivalencia [61]. Algunos estudios anteriores sobre costes se han centrado en
estrategias para disminuir los ingresos hospitalarios por NAC [38]. Sin embargo,
se ha demostrado que una reducción de los ingresos hospitalarios es posible,
aunque posteriormente hubo un aumento de readmisiones posteriores y una
menor satisfacción de los pacientes [64]. En ese y otros estudios, el objetivo
principal ha sido contener los costes sin comprometer los resultados del paciente
[65, 66]. Estos estudios proporcionan información valiosa para la práctica clínica
a pesar de que sus objetivos se han centrado en evitar efectos adversos, más que
en la eficacia.
Aunque las directrices hacen hincapié en la importancia de implementar y
mantener la adherencia a las recomendaciones, se ha producido una escasez de
datos publicados sobre su impacto en el coste-efectividad del tratamiento. En

Tesis Doctoral
Soledad María Reyes Calzada Página 66
pacientes no hospitalizados con NAC, Gleason et al, [67] encontraron que la
adhesión a las directrices de la American Thoracic Society se asoció con una
reducción de los costes en los pacientes < 60 años de edad y, a la inversa, con un
aumento en los > 60 años de edad con comorbilidades.
En el presente estudio, se decidió incluir todos los componentes de los
costes hospitalarios desde la influencia de la selección de antibióticos en otras
variables pronósticas, como el fracaso del tratamiento y la estabilidad clínica,
que están relacionados con la duración de la estancia hospitalaria. Como medida
de efectividad se utilizó la curación de la neumonía (definido como el paciente
que sobrevive al episodio de neumonía y no presenta readmisión dentro de los
30 días del alta). Estos indicadores de resultados son de aplicación universal y
son ampliamente aceptadas [66, 68, 69].
ORRICK et al. [19] compararon el coste de los cuidados de los pacientes
hospitalizados con NAC. Determinaron que el coste promedio de
hospitalización fue mayor cuando el tratamiento no seguía las recomendaciones
de las guías (US $ 3.085 frente a US $ 2.047). Sin embargo, los autores no
realizaron ningún análisis de coste-efectividad. Recientemente, BAUER et al. [44]
encontró que los pacientes tratados con moxifloxacino se beneficiaron de un alta
precoz, aunque los costes directos y eficacia clínica fueron similares a otros
antibióticos.
En el presente estudio encontramos que la adherencia a las directrices fue
la opción más coste-efectiva ya que la relación fue 2.277 euros por curación
esperada frente a 2.567 euros en los tratamientos no adherentes. Esto produjo un
incremento negativo de la relación coste-efectividad ya que la adherencia ahorró
1.121 Euros por paciente curado en comparación con la no adherencia.
Un análisis bootstraping, demostró que en el 95% de los casos la
adherencia a las directrices ahorra costes [70]. Por otra parte, el coste adicional
de readmisión se redujo cuando el tratamiento era adherente. El análisis de
sensibilidad demostró que los resultados encontrados en el análisis de costo-
efectividad se mantienen estables a pesar de usar amplias variaciones en los
diferentes componentes introducidos en las ecuaciones de costes.
Como limitación del estudio cabe destacar que no se ha realizado ningún
análisis del impacto de los costes indirectos, tales como la pérdida de días de
actividad laboral de los pacientes. Además, el presente estudio fue

Tesis Doctoral
Soledad María Reyes Calzada Página 67
observacional, no aleatorio. Por otra parte, los pacientes de UCI no fueron
incluidos en el presente estudio, ya que es uno de los más altos determinantes
del coste de la NAC [44].
En resumen, para los pacientes hospitalizados por neumonía adquirida en
la comunidad, el tratamiento de acuerdo con las guías clínicas es la alternativa
dominante debido a su coste-efectividad.

Tesis Doctoral
Soledad María Reyes Calzada Página 68
CONCLUSIONES


Tesis Doctoral
Soledad María Reyes Calzada Página 69
Las conclusiones de esta tesis responden a los objetivos que motivaron
la investigación.
Estudio 1:
1) El régimen antibiótico más utilizado fue la asociación betalactámico
más macrólido con una adherencia a las normativas del 76.5% y
heterogeneidad entre los hospitales.
2) Los pacientes graves tratados con regímenes antibióticos no
habituales/adherentes tienen un mayor riesgo de muerte
3) La monoterapia con betalactámicos se asoció con mayor porcentaje de
reingresos.
4) No encontramos asociación entre pautas antibióticas y duración de la
estancia hospitalaria.
Estudio 2:
1) La mediana del coste total en pacientes hospitalizados por NAC fue de
1683€ siendo la estancia el coste directo más alto
2) Las complicaciones incrementan de forma significativa e independiente
el coste de la hospitalización siendo las infecciosas las de mayor coste.
3) Ni la edad del paciente ni las comorbilidades se asociaron de forma
independiente con alto coste.
4) La hospitalización previa en el último año, la hipoalbuminemia son
factores predictivos de coste elevado
Estudio 3:
1) La adherencia a las guías clínicas fue elevada en nuestro estudio.
2) El análisis coste-efectividad demuestra que la adherencia a las
normativas en el tratamiento empírico de la NAC fue la opción
dominante con resultados más eficaces en comparación con la no
adherencia (88% versus 81% de los pacientes curados) y menos
costosas (2,001versus 2.079 euros).
3) El análisis de minimización de costes mostró que la adherencia a las
normativas ahorra 78,5 euros por paciente.
4) La ratio incremental costo-efectividad demostró un ahorro de 1.121
euros por paciente curado comparado con la opción de la no
adherencia.

Tesis Doctoral
Soledad María Reyes Calzada Página 70
Conclusión final
Los resultados de la presente tesis suponen una aportación desde el punto
de vista clínico a la búsqueda de medidas eficaces en el tratamiento de pacientes
con NAC y como consecuencia en la calidad asistencial. Este estudio ha ayudado
a demostrar la eficacia de las normativas SEPAR en términos de mejora de
calidad asistencial y pronóstico. Ha ayudado a demostrar la eficacia en términos
de coste-efectividad de las diferentes alternativas de tratamiento según la
adherencia a las directrices y como consecuencia una reducción de los costes
hospitalarios.

Tesis Doctoral
Soledad María Reyes Calzada Página 71
PUBLICACIONES RELACIONADAS


Tesis Doctoral
Soledad María Reyes Calzada Página 72
Relacionado con los trabajos que forman la presente Tesis Doctoral, se ha
publicado también el siguiente artículo:
Menéndez R, Cremades MJ, Martínez Moragón E, Soler JJ, Reyes S, Perpiñá M.
Duration of length of stay in pneumonia: influence of clinical factors and
hospital type. Eur Respir J 2003;22:643-648.
(Factor de Impacto= 7,636)

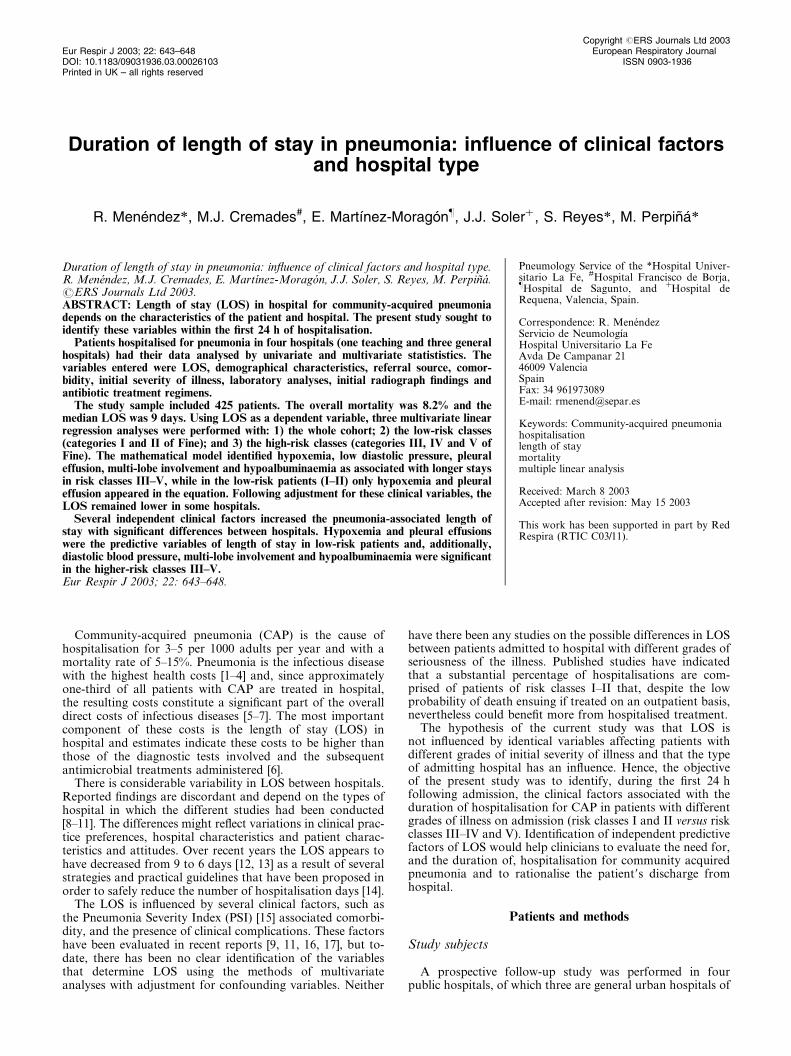
Duration of length of stay in pneumonia: influence of clinical factorsand hospital type
R. Menendez*, M.J. Cremades#, E. Martınez-Moragon}, J.J. Solerz, S. Reyes*, M. Perpina*
Duration of length of stay in pneumonia: influence of clinical factors and hospital type.R. Menendez, M.J. Cremades, E. Martınez-Moragon, J.J. Soler, S. Reyes, M. Perpina.#ERS Journals Ltd 2003.ABSTRACT: Length of stay (LOS) in hospital for community-acquired pneumoniadepends on the characteristics of the patient and hospital. The present study sought toidentify these variables within the first 24 h of hospitalisation.
Patients hospitalised for pneumonia in four hospitals (one teaching and three generalhospitals) had their data analysed by univariate and multivariate statististics. Thevariables entered were LOS, demographical characteristics, referral source, comor-bidity, initial severity of illness, laboratory analyses, initial radiograph findings andantibiotic treatment regimens.
The study sample included 425 patients. The overall mortality was 8.2% and themedian LOS was 9 days. Using LOS as a dependent variable, three multivariate linearregression analyses were performed with: 1) the whole cohort; 2) the low-risk classes(categories I and II of Fine); and 3) the high-risk classes (categories III, IV and V ofFine). The mathematical model identified hypoxemia, low diastolic pressure, pleuraleffusion, multi-lobe involvement and hypoalbuminaemia as associated with longer staysin risk classes III–V, while in the low-risk patients (I–II) only hypoxemia and pleuraleffusion appeared in the equation. Following adjustment for these clinical variables, theLOS remained lower in some hospitals.
Several independent clinical factors increased the pneumonia-associated length ofstay with significant differences between hospitals. Hypoxemia and pleural effusionswere the predictive variables of length of stay in low-risk patients and, additionally,diastolic blood pressure, multi-lobe involvement and hypoalbuminaemia were significantin the higher-risk classes III–V.Eur Respir J 2003; 22: 643–648.
Pneumology Service of the *Hospital Univer-sitario La Fe, #Hospital Francisco de Borja,}Hospital de Sagunto, and
zHospital de
Requena, Valencia, Spain.
Correspondence: R. MenendezServicio de NeumologıaHospital Universitario La FeAvda De Campanar 2146009 ValenciaSpainFax: 34 961973089E-mail: [email protected]
Keywords: Community-acquired pneumoniahospitalisationlength of staymortalitymultiple linear analysis
Received: March 8 2003Accepted after revision: May 15 2003
This work has been supported in part by RedRespira (RTIC C03/11).
Community-acquired pneumonia (CAP) is the cause ofhospitalisation for 3–5 per 1000 adults per year and with amortality rate of 5–15%. Pneumonia is the infectious diseasewith the highest health costs [1–4] and, since approximatelyone-third of all patients with CAP are treated in hospital,the resulting costs constitute a significant part of the overalldirect costs of infectious diseases [5–7]. The most importantcomponent of these costs is the length of stay (LOS) inhospital and estimates indicate these costs to be higher thanthose of the diagnostic tests involved and the subsequentantimicrobial treatments administered [6].
There is considerable variability in LOS between hospitals.Reported findings are discordant and depend on the types ofhospital in which the different studies had been conducted[8–11]. The differences might reflect variations in clinical prac-tice preferences, hospital characteristics and patient charac-teristics and attitudes. Over recent years the LOS appears tohave decreased from 9 to 6 days [12, 13] as a result of severalstrategies and practical guidelines that have been proposed inorder to safely reduce the number of hospitalisation days [14].
The LOS is influenced by several clinical factors, such asthe Pneumonia Severity Index (PSI) [15] associated comorbi-dity, and the presence of clinical complications. These factorshave been evaluated in recent reports [9, 11, 16, 17], but to-date, there has been no clear identification of the variablesthat determine LOS using the methods of multivariateanalyses with adjustment for confounding variables. Neither
have there been any studies on the possible differences in LOSbetween patients admitted to hospital with different grades ofseriousness of the illness. Published studies have indicatedthat a substantial percentage of hospitalisations are com-prised of patients of risk classes I–II that, despite the lowprobability of death ensuing if treated on an outpatient basis,nevertheless could benefit more from hospitalised treatment.
The hypothesis of the current study was that LOS isnot influenced by identical variables affecting patients withdifferent grades of initial severity of illness and that the typeof admitting hospital has an influence. Hence, the objectiveof the present study was to identify, during the first 24 hfollowing admission, the clinical factors associated with theduration of hospitalisation for CAP in patients with differentgrades of illness on admission (risk classes I and II versus riskclasses III–IV and V). Identification of independent predictivefactors of LOS would help clinicians to evaluate the need for,and the duration of, hospitalisation for community acquiredpneumonia and to rationalise the patient9s discharge fromhospital.
Patients and methods
Study subjects
A prospective follow-up study was performed in fourpublic hospitals, of which three are general urban hospitals of
Eur Respir J 2003; 22: 643–648DOI: 10.1183/09031936.03.00026103Printed in UK – all rights reserved
Copyright #ERS Journals Ltd 2003European Respiratory Journal
ISSN 0903-1936

different sizes and one a referral (teaching) hospital, inValencia, Spain. These were: 1) Hospital Universitari La Fe, a900-bed teaching hospital serving a population of 400,000 andwith 13 physicians specialising in lung diseases; 2) Hospital deSagunto, a 270 bed community hospital serving a population128,000 and with three lung specialists; 3) Hospital deGandıa, a 240-bed community hospital serving a populationof 125,000 and with three lung specialists; and 4) Hospital deRequena, a 106-bed hospital serving a population of 58,000and with two lung specialists. Patients consecutively admittedto the four hospitals during a 12-month period were included.Inclusion criteria were the presence of a chest radiograph withevidence of infiltrate and symptoms compatible with CAP.Alternative diagnoses were excluded during the follow-upperiod. Patients with immunosuppression, including humanimmunodeficiency virus infection, patients who had been hos-pitalised in the previous 15 days and those with tuberculosiswere also excluded, as were those patients who receivedattention in the intensive care unit.
Data collection
A protocol was devised that sought data on demographicalcharacteristics, comorbidity, initial evaluation of the risk classaccording to Fine, or the PSI [15], LOS and outcome. Datawere collected as follows. In the first 24 h, the 20 variablesthat comprise the prognostic scale of Fine [15] were evaluatedand the patient was classified in one of the five risk classes(range, I–V). Demographical characteristics including age,gender, smoking habit and alcohol intake were recorded.Specific comorbidity details included chronic obstructivepulmonary disease (COPD), asthma, cardiac diseases, renalor hepatic diseases, diabetes mellitus, prior hospitalisation orprior CAP. Concomitant medications, such as oral or inhaledcorticosteroids and previous antimicrobial treatments, werealso recorded.
Initial clinical symptoms and physical signs noted werepleural pain, cough, expectoration, abrupt onset dyspnoea,and the time-lapse (in days) from symptom onset. The pre-sence of cyanosis, blood pressure measurement, respiratoryrate, level of consciousness and auscultation data were alsonoted. Laboratory analyses recorded leukocyte, haematocrit,plasma urea (BUN), albumin, sodium, potassium and plateletlevels and blood gas measurements (arterial oxygen tension(Pa,O2), arterial carbon dioxide tension, and pH) on admis-sion. Radiograph data on admission assessed the number oflobes affected and the presence/absence of pleural effusion.
Initial antimicrobial regimens prescribed were as follows:third generation cephalosporins, third generation cephalosporins
and macrolides, macrolides alone, quinolones, amoxycillin-clavulanate alone or with macrolides, and other regimens.Antimicrobial treatment was classified as adhering, or not,to Spanish guidelines [18]. Adherence-to-guidelines treat-ment was defined as initial antimicrobial regimen consistingof third generation cephalosporins alone or with macrolides,amoxycillin-clavulanate alone or with macrolides and quino-lones (third or fourth generation) alone. Other treatmentregimens were defined as not adhering to the guidelines. LOSwas defined as the number of days between admission anddischarge.
Statistical analysis
Univariate analyses were performed using all the variablesrecorded on admission, the demographical characteristics,initial risk class, laboratory and radiograph data, and thenumber of days of hospitalisation. Pearson correlationanalysis was used for data that followed a normal distributionand Spearman correlation for those that followed a non-normal distribution. All p-values of v0.05 were consideredstatistically significant.
The variables that were found to be significant (pv0.05) inthe univariate analysis were introduced as independentvariables in a multivariate stepwise linear regression analysiswith the LOS (in days) as the dependent variable.
Results
Study population
A total of 425 patients admitted with CAP were included inthe study. The demographical characteristics, comorbidity,PSI index and mortality in the four hospitals are summarisedin table 1 and table 2. No differences were found between thefour hospitals with respect to age, gender and previouscomorbidities of the most frequent coexisting conditions, suchas congestive heart failure, COPD, diabetes, renal disease andcerebrovascular disease. Active smokers were more frequentin Hospitals C and D (pv0.02). Mortality expressed as afunction of each initial risk class showed statistically non-significant differences in the four hospitals (table 2).
The percentage distributions of patients in the teachinghospital with respect to PSI were 9.6, 10.9, 24, 39.3 and 16.2in the risk classes I, II, III, IV and V, respectively. Thedifferences in the distributions were not statistically different(p=0.18) from the corresponding percentage distributions in
Table 1. – Demographical characteristics, comorbidity and initial risk class of the patient cohort
Characteristic Hospital A Hospital B Hospital C Hospital D
Patients n 229 73 58 65Age yrs# 69¡16 70¡16 68¡17 72¡16Sex M/F 65/35 63/37 59/41 71/29Residence for the elderly % 3.5 2.7 8.6 4.6Alcohol % 16 7 19 21Smokers %* 14.8 19.2 24 25COPD % 32 41 31 34Cardiac disease % 33 18 26 23Diabetes % 22 18 22 14Liver disease % 5 4 7 8CNS disease % 15 11 15 19Renal disease % 5 3 9 6
M: male; F: female; COPD: chronic obstructive pulmonary disease; CNS: central nervous system. #: data are presented as mean¡SD. *: pv0.05.
644 R. MENENDEZ ET AL.
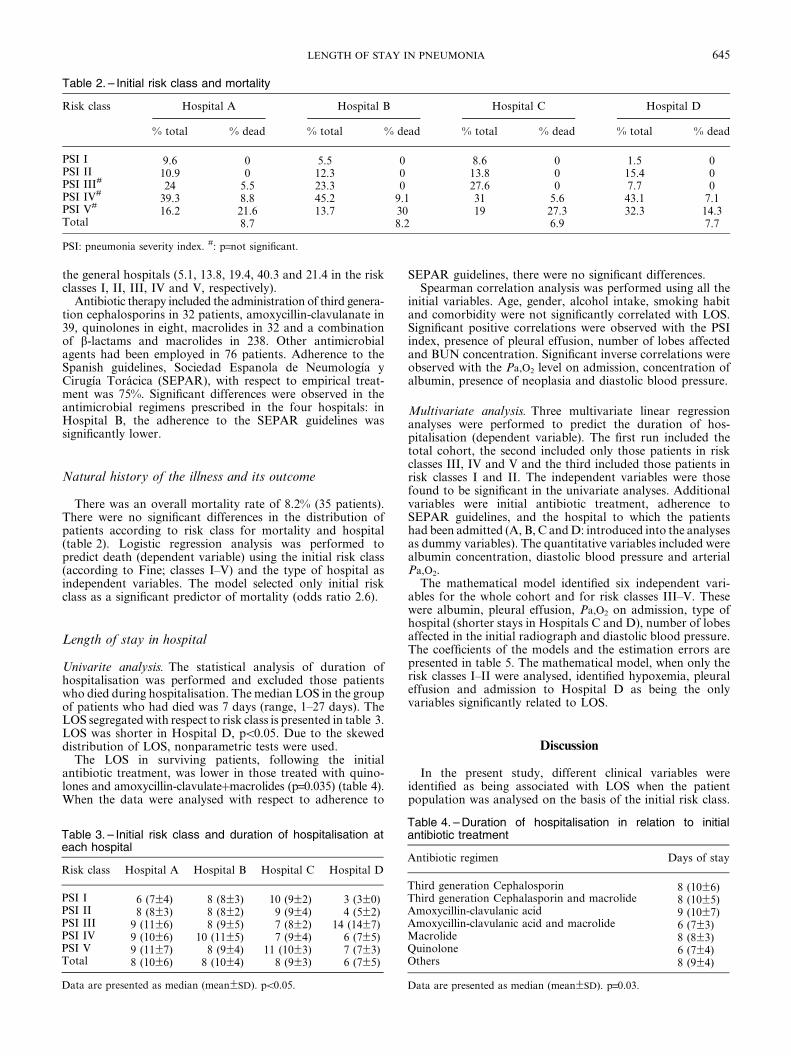
the general hospitals (5.1, 13.8, 19.4, 40.3 and 21.4 in the riskclasses I, II, III, IV and V, respectively).
Antibiotic therapy included the administration of third genera-tion cephalosporins in 32 patients, amoxycillin-clavulanate in39, quinolones in eight, macrolides in 32 and a combinationof b-lactams and macrolides in 238. Other antimicrobialagents had been employed in 76 patients. Adherence to theSpanish guidelines, Sociedad Espanola de Neumologıa yCirugıa Toracica (SEPAR), with respect to empirical treat-ment was 75%. Significant differences were observed in theantimicrobial regimens prescribed in the four hospitals: inHospital B, the adherence to the SEPAR guidelines wassignificantly lower.
Natural history of the illness and its outcome
There was an overall mortality rate of 8.2% (35 patients).There were no significant differences in the distribution ofpatients according to risk class for mortality and hospital(table 2). Logistic regression analysis was performed topredict death (dependent variable) using the initial risk class(according to Fine; classes I–V) and the type of hospital asindependent variables. The model selected only initial riskclass as a significant predictor of mortality (odds ratio 2.6).
Length of stay in hospital
Univarite analysis. The statistical analysis of duration ofhospitalisation was performed and excluded those patientswho died during hospitalisation. The median LOS in the groupof patients who had died was 7 days (range, 1–27 days). TheLOS segregated with respect to risk class is presented in table 3.LOS was shorter in Hospital D, pv0.05. Due to the skeweddistribution of LOS, nonparametric tests were used.
The LOS in surviving patients, following the initialantibiotic treatment, was lower in those treated with quino-lones and amoxycillin-clavulatezmacrolides (p=0.035) (table 4).When the data were analysed with respect to adherence to
SEPAR guidelines, there were no significant differences.Spearman correlation analysis was performed using all the
initial variables. Age, gender, alcohol intake, smoking habitand comorbidity were not significantly correlated with LOS.Significant positive correlations were observed with the PSIindex, presence of pleural effusion, number of lobes affectedand BUN concentration. Significant inverse correlations wereobserved with the Pa,O2 level on admission, concentration ofalbumin, presence of neoplasia and diastolic blood pressure.
Multivariate analysis. Three multivariate linear regressionanalyses were performed to predict the duration of hos-pitalisation (dependent variable). The first run included thetotal cohort, the second included only those patients in riskclasses III, IV and V and the third included those patients inrisk classes I and II. The independent variables were thosefound to be significant in the univariate analyses. Additionalvariables were initial antibiotic treatment, adherence toSEPAR guidelines, and the hospital to which the patientshad been admitted (A, B, C and D: introduced into the analysesas dummy variables). The quantitative variables included werealbumin concentration, diastolic blood pressure and arterialPa,O2.
The mathematical model identified six independent vari-ables for the whole cohort and for risk classes III–V. Thesewere albumin, pleural effusion, Pa,O2 on admission, type ofhospital (shorter stays in Hospitals C and D), number of lobesaffected in the initial radiograph and diastolic blood pressure.The coefficients of the models and the estimation errors arepresented in table 5. The mathematical model, when only therisk classes I–II were analysed, identified hypoxemia, pleuraleffusion and admission to Hospital D as being the onlyvariables significantly related to LOS.
Discussion
In the present study, different clinical variables wereidentified as being associated with LOS when the patientpopulation was analysed on the basis of the initial risk class.
Table 2. – Initial risk class and mortality
Risk class Hospital A Hospital B Hospital C Hospital D
% total % dead % total % dead % total % dead % total % dead
PSI I 9.6 0 5.5 0 8.6 0 1.5 0PSI II 10.9 0 12.3 0 13.8 0 15.4 0PSI III#
24 5.5 23.3 0 27.6 0 7.7 0PSI IV#
39.3 8.8 45.2 9.1 31 5.6 43.1 7.1PSI V#
16.2 21.6 13.7 30 19 27.3 32.3 14.3Total 8.7 8.2 6.9 7.7
PSI: pneumonia severity index. #: p=not significant.
Table 3. – Initial risk class and duration of hospitalisation ateach hospital
Risk class Hospital A Hospital B Hospital C Hospital D
PSI I 6 (7¡4) 8 (8¡3) 10 (9¡2) 3 (3¡0)PSI II 8 (8¡3) 8 (8¡2) 9 (9¡4) 4 (5¡2)PSI III 9 (11¡6) 8 (9¡5) 7 (8¡2) 14 (14¡7)PSI IV 9 (10¡6) 10 (11¡5) 7 (9¡4) 6 (7¡5)PSI V 9 (11¡7) 8 (9¡4) 11 (10¡3) 7 (7¡3)Total 8 (10¡6) 8 (10¡4) 8 (9¡3) 6 (7¡5)
Data are presented as median (mean¡SD). pv0.05.
Table 4. – Duration of hospitalisation in relation to initialantibiotic treatment
Antibiotic regimen Days of stay
Third generation Cephalosporin 8 (10¡6)Third generation Cephalasporin and macrolide 8 (10¡5)Amoxycillin-clavulanic acid 9 (10¡7)Amoxycillin-clavulanic acid and macrolide 6 (7¡3)Macrolide 8 (8¡3)Quinolone 6 (7¡4)Others 8 (9¡4)
Data are presented as median (mean¡SD). p=0.03.
645LENGTH OF STAY IN PNEUMONIA

In the low-risk sub-groups I and II (as defined by Fine),hypoxemia and pleural effusion were the significant indepen-dent variables observed in the multivariate analysis. In riskclasses III, IV and V, further variables were identified. Thesewere diastolic blood pressure, multi-lobe involvement andalbumin concentration. When adjusted for these variables, thetype-of-hospital variable remained significantly different.
The current investigation was a multi-centre study designedto evaluate the clinical variables, at the first 24 h of admissionto hospital, of a cohort of patients with CAP in four hospitalshaving different healthcare remits, and to determine theimpact on LOS. Although there were no differences withrespect to the characteristics of the patients when evaluatedon comorbidity, demographical data and class of initial risk(except a higher numbers of smokers in Hospitals C and D)there were significant differences in the duration of hospita-lisation. The mortality rate in each hospital evaluated for eachinitial risk class (as defined by Fine) did not show significantdifferences.
The authors encountered several factors that correlated(positively or negatively) with the LOS and which corres-ponded to the initial severity of the illness (PSI, or risk class ofFine), characteristics of the patients, initial antibiotic treat-ment and the type of hospital. Previous studies [9, 15, 16, 19]had observed (as did the current study) a correlation betweengreater initial severity of the illness and longer hospitalisation.However, prolonged hospitalisation in low-risk patients wasalso detected. The Fine scale had been designed and validated,originally, to predict mortality but has since been recom-mended for decisions regarding hospitalisation. For example,it is proposed that patients in low-risk classes I and II shouldbe treated on an outpatient basis because of the low mortalityrisk. However, scientific guidelines are not necessarily asubstitute for clinical judgement and when this prognosticscale is employed to decide whether to admit a patient, thepercentage of admissions is reduced, but not eliminated [20,21]. This may be due to the limitations associated with specificcircumstances of the patients and the underestimation of riskin the younger-aged patients.
Less controversial is the need for admission for the higherrisk classes III–V. Therefore, the authors decided to analysethe high-risk sub-group separately and compare the resultswith the low-risk group, since there is a greater consensuswith respect to the decision to admit these high-risk patients.
The advantage of employing multivariate analysis is thatit facilitates the selection of independent variables, whilediscarding those that contain redundant information orconfounding variables. The current study also offers theopportunity to assess the influence of hospital type on LOS,
since the patient types are similar with respect to clinicalcircumstances, as well as risk class.
In the mathematical model of the current study the authorsencountered five independent variables that best predictedLOS for pneumonia in the overall patient cohort and in thehigh-risk classes III–V. The independent variables detectedwere initial hypoxemia, pleural effusion, levels of albumin,number of lobes affected in the initial radiograph and theinitial diastolic pressure. The values of Pa,O2, albumin anddiastolic pressure were inversely related to LOS, while theconverse applied to pleural effusion and the number of lobesaffected in the initial radiographs. However, in the low-riskclasses only two of these clinical factors were detected:hypoxemia and pleural effusion.
Respiratory insufficiency is a morbidity and mortality riskfactor that occurs with CAP and is one of the main reasonsfor hospital admission [22, 23]. HALM et al. [24] observed thatthe resolution of hypoxemia was the clinical parameter thatrequired more days of hospitalisation to achieve clinicalstability. Similarly, the presence of pleural effusion with CAPpredisposes a protracted hospitalisation, since this conditionrequires greater clinical attention, radiological follow-up,thoracocentesis and, eventually, drainage of the thorax. In thecurrent study the authors noted that this was one of theprincipal motives for hospitalisation and prolonged durationof hospital stay, in risk-class I in Hospital C. ROSON et al.[25], in a prospective observational study evaluating hospita-lisation on the basis of conventional criteria versus PSI,indicated that 60% of patients classified as low risk class (Iand II of Fine) needed supplemental oxygen or had pleuralcomplications and these were the reasons for which they werehospitalised.
Hypoxemia and pleural effusion are the two clinical factorsthat can be underestimated in the prognostic scale of Fine,especially in young patients, and account for the admissionrates in the risk-classes I and II. In a very recent editorial,HALM and TEIRSTEIN [26] state that all patients with hypo-xemia (Pa,O2v7.98 kPa (60 mm?Hg) while breathing roomair) or metastasic disease or empyema should be hospitalisedregardless of the score on the Fine scale.
In risk-classes III–V, the effects of hypoxemia and pleuraleffusion on LOS are associated with three additional clinicalvariables. Malnutrition is clearly associated with the gravityof the pneumonia and its poorer prognosis [27]. Further, it ismore frequent in the elderly and contributes to a slowerclinical response to treatment [27, 28]. Several studies haveshown that albumin is a marker of nutritional status and isassociated with mortality risk and recovery time of thepatient. Multi-lobe involvement and low diastolic bloodpressure are risk factors for a complicated clinical course ofdisease and, as such, it is not surprising that these variableswere related to a longer LOS.
The influence of the clinical variables on LOS found in thecurrent study is not unexpected, since they are related to theclinical instability and initial gravity. However, the authorswere unable to evaluate the correlations with the timerequired to reach clinical stability or with the therapeuticresponse. From this perspective, the association between theinitial clinical variables and the resolution of the infectionparameters would have provided more insight into clinicaland nonclinical factors related to LOS.
With respect to the initial antibiotic regimen employed,univariate analysis indicated that there was a shorter LOSin those patients treated with amoxycillin–clavulanate andmacrolides or quinolones. However, this variable was notsubsequently selected in the multivariate model. Previousstudies that analysed the influence of treatment on theduration of hospitalisation obtained discordant results [29,30]. Adherence, or not, to the SEPAR guidelines for the
Table 5. – Predictive factors of length of duration ofhospitalisation
Variable in the model Coefficient
FineI–II#
Fine III, IVand V}
FineI–Vz
Constant 8.8 18.3 18.4Albumin mg?dL-1
-1.5 -1.4Pleural effusion 2.5 3.2 3.2Pa,O2 mm?Hg§
-0.058 -0.075 -0.08Hospital D -3.9 -3.07 -3.2Number of lobes involved 1.59 1.4Diastolic blood pressure -0.059 -0.06Hospital C -0.07 -2.3
Pa,O2: arterial oxygen tension. #: correlation coefficient (r)=0.55; SE=2.5,f value=8.7; }: r=0.442, SE=4.9, f value=8.3;z: r=0.471, SE=4.6; f value=12.4;§: mm?Hg60.133=kPa.
646 R. MENENDEZ ET AL.

treatment of CAP did not relate significantly with LOS, as hasbeen reported previously by the authors [31] and others [32].
The type of hospital to which the patient was admitted wasa factor predictive of LOS. MCCORMICK et al. [9] hadreported that, for a similar risk class, there were differences inhospitals with respect to the duration of stay but withoutnegative effects on several outcomes, such as mortality andre-admission. However, the results reported in the literatureare not completely concordant, since some authors highlightpossible negative consequences for patients after a shortenedstay in hospital [12, 33].
The variability in the duration of hospitalisation withrespect to hospital type emphasises the need for objectivecriteria for the treatment of CAP, so as to reduce thedifferences in the clinical management of this condition [13,17, 34, 35]. These aspects are beginning to be incorporated inthe latest guidelines of the American Thoracic Society [23].
As a limitation of the study, the authors wish to highlightthat the mathematical model obtained is not ideal, since theamount of variance explained by the model is not high.However, other variables exist which are not strictly clinicaland/or quantifiable and which can influence the LOS. Theseinclude hospital inefficiencies, clinical professionals9 prefer-ences/idiosyncrasies and difficulties in the management of thepatient on an outpatient basis. Another limitation is that theauthors did not evaluate the relationships between initialvariables and clinical stability and/or clinical response-to-therapy separate from the LOS so as to distinguish the impactof other factors, such as social variables, on LOS. Never-theless, the authors consider that the information gathered isvaluable for the clinician and healthcare workers, since itprovides a rule of thumb to indicate the probable require-ments with respect to length of hospitalisation in CAP.
In summary, in the present study of community-acquiredpneumonia the authors observed that in low-risk patients,the length of stay is determined mainly by the level ofhypoxemia and pleural effusion, while in the higher riskclasses, additional factors, such as multi-lobe involvement,diastolic blood pressure and the albumin concentration, alsobecome significant. The hospital where the patient wasadmitted exerts an effect on length of stay that is independentof the clinical variables and the severity of the patient9s illnesson admission. A further area of investigation would be toquantify the influence of variables, such as clinical stabilityand response to therapy, and length of stay.
Acknowledgement. Editorial assistance was byP.R. Turner of t-SciMed, Reus, Spain.
References
1. Almirall J, Bolibar I, Vidal J, et al. Epidemiology ofcommunity-acquired pneumonia in adults: a population-based study. Eur Respir J 2000; 15: 757–763.
2. Carretero Gracia JA, Nebreda Mayoral T, Acereda RidruejoAI, Larumbe Sola Y, Martinez Gutierrez MA, TiernoSanquirico C. Neumonia adquirida en la comunidadremitida al medio hospitalario. Epidemiologıa, actituddiagnostica y terpeutica [Community-acquired pneumoniareferred for hospital management. Its epidemiology and thediagnostic and therapeutic approaches]. Arch Bronconeumol1999; 35: 27–32.
3. Monge V, Gonzalez A. Hospital admissions for pneumoniain Spain. Infection 2001; 29: 3–6.
4. Monge V, San-Martin VM, Gonzalez A. The burden ofcommunity-acquired pneumonia in Spain. Eur J PublicHealth 2001; 11: 362–364.
5. Guest JF, Morris A. Community-acquired pneumonia: the
annual cost to the National Health Service in the UK. EurRespir J 1997; 10: 1530–1534.
6. Fine MJ, Pratt HM, Obrosky DS, et al. Relation betweenlength of hospital stay and costs of care for patients withcommunity-acquired pneumonia. Am J Med 2000; 109: 378–385.
7. Niederman MS, McCombs JS, Unger AN, Kumar A,Popovian R. The cost of treating community-acquiredpneumonia. Clin Ther 1998; 20: 820–837.
8. Lave JR, Fine MJ, Sankey SS, Hanusa BM, Weissfeld LA,Kapoor WN. Hospitalized pneumonia. Outcomes, treatmentpatterns, and costs in urban and rural areas. J Gen InternMed 1996; 11: 415–421.
9. McCormick D, Fine MJ, Coley CM, et al. Variation inlength of hospital stay in patients with community-acquiredpneumonia: are shorter stays associated with worse medicaloutcomes? Am J Med 1999; 107: 5–12.
10. Rosenthal GE, Harper DL, Quinn LM, Cooper GS.Severity-adjusted mortality and length of stay in teachingand nonteaching hospitals. Results of a regional study.JAMA 1997; 278: 485–490.
11. Siegel RE. How long a stay in the hospital is needed forpatients with community-acquired pneumonia? Am J Med2000; 109: 434–436.
12. Metersky ML, Tate JP, Fine MJ, Petrillo MK, Meehan TP.Temporal trends in outcomes of older patients withpneumonia. Arch Intern Med 2000; 160: 3385–3391.
13. Rhew DC, Tu GS, Ofman J, Henning JM, Richards MS,Weingarten SR. Early switch and early discharge strategiesin patients with community-acquired pneumonia: a meta-analysis. Arch Intern Med 2001; 161: 722–727.
14. Weingarten SR, Riedinger MS, Hobson P, et al. Evaluationof a pneumonia practice guideline in an interventional trial.Am J Respir Crit Care Med 1996; 153: 1110–1115.
15. Fine MJ, Auble TE, Yealy DM, et al. A prediction rule toidentify low-risk patients with community-acquired pneu-monia. N Engl J Med 1997; 336: 243–250.
16. Menendez R, Ferrando D, Valles JM, Martinez E,Perpina M. Initial risk class and length of hospital stay incommunity-acquired pneumonia. Eur Respir J 2001; 18: 151–156.
17. Fine MJ, Medsger AR, Stone RA, et al. The hospitaldischarge decision for patients with community-acquiredpneumonia. Results from the Pneumonia Patient OutcomesResearch Team cohort study. Arch Intern Med 1997; 157: 47–56.
18. Frias J, Gomis M, Prieto J, et al. Tratamiento antibioticoempırico inicial de la neumonıa adquirida en la comunidad[Initial empirical antibiotic treatment of community-acquired pneumonia]. Rev Esp Quimioter 1998; 11: 255–261.
19. Masotti L, Ceccarelli E, Cappelli R, Barabesi L, Forconi S.Community-acquired pneumonia in elderly patients andlength of hospitalization. Arch Intern Med 2000; 160: 2678–2679.
20. Atlas SJ, Benzer TI, Borowsky LH, et al. Safely increasingthe proportion of patients with community-acquired pneu-monia treated as outpatients: an interventional trial. ArchIntern Med 1998; 158: 1350–1356.
21. Marrie TJ, Lau CY, Wheeler SL, Wong CJ, WandervootMK, Feagan BG. A controlled trial of a critical pathway fortreatment of community-acquired pneumonia. Community-Acquired Pneumonia Intervention Trial Assessing Levoflox-acin (CAPITAL) study investigators. JAMA 2000; 283: 749–755.
22. Dorca J, Bello S, Blanquer J, et al. Diagnostico y tratamientode la neumonıa adquirida en la comunidad. SEPAR.Sociedad Espanola de Neumologia y Cirugia Toracica [Thediagnosis and treatment of community-acquired pneumo-nia]. Arch Bronconeumol 1997; 33: 240–246.
23. Niederman MS, Mandell LA, Anzueto A, et al. Guidelinesfor the management of adults with community-acquired
647LENGTH OF STAY IN PNEUMONIA

pneumonia. Diagnosis, assessment of severity, antimicrobialtherapy, and prevention. Am J Respir Crit Care Med 2001;163: 1730–1754.
24. Halm EA, Fine MJ, Marrie TJ, et al. Time to clinicalstability in patients hospitalized with community-acquiredpneumonia: implications for practice guidelines. JAMA1998; 279: 1452–1457.
25. Roson B, Carratala J, Dorca J, Casanova A, Manresa F,Gudiol F. Etiology, reasons for hospitalization, risk classes,and outcomes of community-acquired pneumonia in patientshospitalized on the basis of conventional admission criteria.Clin Infect Dis 2001; 33: 158–165.
26. Halm EA, Teirstein AS. Clinical practice. Management ofcommunity-acquired pneumonia. N Engl J Med 2002; 347:2039–2045.
27. Riquelme R, Torres A, el-Ebiary M, et al. Community-acquired pneumonia in the elderly. Clinical and nutritionalaspects. Am J Respir Crit Care Med 1997; 156: 1908–1914.
28. Riquelme R, Torres A, El-Ebiary M, et al. Community-acquired pneumonia in the elderly: A multivariate analysis ofrisk and prognostic factors. Am J Respir Crit Care Med 1996;154: 1450–1455.
29. Stahl JE, Barza M, DesJardin J, Martin R, Eckman MH.Effect of macrolides as part of initial empiric therapy on
length of stay in patients hospitalized with community-acquired pneumonia. Arch Intern Med 1999; 159: 2576–2580.
30. Dudas V, Hopefl A, Jacobs R, Guglielmo BJ. Anti-microbial selection for hospitalized patients with presumedcommunity-acquired pneumonia: a survey of nonteachingUS community hospitals. Ann Pharmacother 2000; 34: 446–452.
31. Menendez R, Ferrando D, Valles JM, Vallterra J. Influenceof deviation from guidelines on the outcome of community-acquired pneumonia. Chest 2002; 122: 612–617.
32. Marras TK, Chan CK. Use of guidelines in treatingcommunity-acquired pneumonia. Chest 1998; 113: 1689–1694.
33. Rogers WH, Draper D, Kahn KL, et al. Quality of carebefore and after implementation of the DRG-based pro-spective payment system. A summary of effects. JAMA 1990;264: 1989–1994.
34. Meehan TP, Weingarten SR, Holmboe ES, et al. A statewideinitiative to improve the care of hospitalized pneumoniapatients: The Connecticut Pneumonia Pathway Project. AmJ Med 2001; 111: 203–210.
35. Rhew DC. Quality indicators for the management ofpneumonia in vulnerable elders. Ann Intern Med 2001; 135:736–743.
648 R. MENENDEZ ET AL.

Tesis Doctoral
Soledad María Reyes Calzada Página 79
BIBLIOGRAFIA


Tesis Doctoral
Soledad María Reyes Calzada Página 80
1. database I. Instituto Nacional de Estadística. Defunciones según la causa de muerte 2004.
Avaible from: http://www.ine.es/inebase/cgi/axi. 2004.
2. Minino AM, Smith BL. Deaths: preliminary data for 2000. Natl Vital Stat Rep 2001: 49(12):
1-40.
3. Ambrosino N AA, Beurskens H, et al. Pneumonia., 2003:55–65. EELWB.
4. Alfageme I, Aspa J, Bello S, Blanquer J, Blanquer R, Borderias L, Bravo C, de Celis R, de
Gracia X, Dorca J, Gallardo J, Gallego M, Menendez R, Molinos L, Paredes C, Rajas O, Rello J,
Rodriguez de Castro F, Roig J, Sanchez-Gascon F, Torres A, Zalacain R. [Guidelines for the
diagnosis and management of community-acquired pneumonia. Spanish Society of Pulmonology
and Thoracic Surgery (SEPAR)]. Arch Bronconeumol 2005: 41(5): 272-289.
5. Woodhead M, Blasi F, Ewig S, Huchon G, Ieven M, Ortqvist A, Schaberg T, Torres A, van
der Heijden G, Verheij TJ. Guidelines for the management of adult lower respiratory tract
infections. Eur Respir J 2005: 26(6): 1138-1180.
6. Mandell LA, Wunderink RG, Anzueto A, Bartlett JG, Campbell GD, Dean NC, Dowell SF,
File TM, Jr., Musher DM, Niederman MS, Torres A, Whitney CG. Infectious Diseases Society of
America/American Thoracic Society consensus guidelines on the management of community-
acquired pneumonia in adults. Clin Infect Dis 2007: 44 Suppl 2: S27-72.
7. Menendez R, Torres A, Aspa J, Capelastegui A, Prat C, Rodriguez de Castro F.
[Community acquired pneumonia. New guidelines of the Spanish Society of Chest Diseases and
Thoracic Surgery (SEPAR)]. Arch Bronconeumol: 46(10): 543-558.
8. Gleason PP, Meehan TP, Fine JM, Galusha DH, Fine MJ. Associations between initial
antimicrobial therapy and medical outcomes for hospitalized elderly patients with pneumonia.
Arch Intern Med 1999: 159(21): 2562-2572.
9. Reyes Calzada S, Martinez Tomas R, Cremades Romero MJ, Martinez Moragon E, Soler
Cataluna JJ, Menendez Villanueva R. Empiric treatment in hospitalized community-acquired
pneumonia. Impact on mortality, length of stay and re-admission. Respir Med 2007: 101(9): 1909-
1915.
10. Niederman MS, McCombs JS, Unger AN, Kumar A, Popovian R. The cost of treating
community-acquired pneumonia. Clin Ther 1998: 20(4): 820-837.

Tesis Doctoral
Soledad María Reyes Calzada Página 81
11. Fine MJ, Pratt HM, Obrosky DS, Lave JR, McIntosh LJ, Singer DE, Coley CM, Kapoor
WN. Relation between length of hospital stay and costs of care for patients with community-
acquired pneumonia. Am J Med 2000: 109(5): 378-385.
12. Reyes S, Martinez R, Valles JM, Cases E, Menendez R. Determinants of hospital costs in
community-acquired pneumonia. Eur Respir J 2008: 31(5): 1061-1067.
13. Fine MJ, Auble TE, Yealy DM, Hanusa BH, Weissfeld LA, Singer DE, Coley CM, Marrie
TJ, Kapoor WN. A prediction rule to identify low-risk patients with community-acquired
pneumonia. The New England journal of medicine 1997: 336(4): 243-250.
14. Capelastegui A, Espana PP, Quintana JM, Gorordo I, Ortega M, Idoiaga I, Bilbao A.
Improvement of process-of-care and outcomes after implementing a guideline for the management
of community-acquired pneumonia: a controlled before-and-after design study. Clin Infect Dis
2004: 39(7): 955-963.
15. Menendez R, Ferrando D, Valles JM, Vallterra J. Influence of deviation from guidelines on
the outcome of community-acquired pneumonia. Chest 2002: 122(2): 612-617.
16. Martinez R, Reyes S, Lorenzo MJ, Menendez R. Impact of guidelines on outcome: the
evidence. Seminars in respiratory and critical care medicine 2009: 30(2): 172-178.
17. Metersky ML, Tate JP, Fine MJ, Petrillo MK, Meehan TP. Temporal trends in outcomes of
older patients with pneumonia. Arch Intern Med 2000: 160(22): 3385-3391.
18. Suchyta MR, Dean NC, Narus S, Hadlock CJ. Effects of a practice guideline for
community-acquired pneumonia in an outpatient setting. Am J Med 2001: 110(4): 306-309.
19. Orrick JJ, Segal R, Johns TE, Russell W, Wang F, Yin DD. Resource use and cost of care
for patients hospitalised with community acquired pneumonia: impact of adherence to infectious
diseases society of america guidelines. Pharmacoeconomics 2004: 22(11): 751-757.
20. Dorca J, Bello S, Blanquer J, de Celis R, Molinos L, Torres A, Verano A, Zalacain R. [The
diagnosis and treatment of community-acquired pneumonia. SEPAR. Sociedad Espanola de
Neumologia y Cirugia Toracica]. Arch Bronconeumol 1997: 33(5): 240-246.
21. Frias J, Gomis M, Prieto J, Mensa J, Bouza E, Garcia-Rodriguez JA, Torres A, Dorca J,
Zalacain R, Garcia de Lomas J. [Initial empirical antibiotic treatment of community-acquired
pneumonia]. Rev Esp Quimioter 1998: 11(3): 255-261.

Tesis Doctoral
Soledad María Reyes Calzada Página 82
22. Rello J CM, Diaz E, Bodi M, Alvarez B. Associations between empirical antimicrobial
therapy at the hospital and mortality in patients with severe community-acquired pneumonia..
Intensive care medicine 2002: 28: 1030-1035.
23. Niederman MS, Bass JB, Jr., Campbell GD, Fein AM, Grossman RF, Mandell LA, Marrie
TJ, Sarosi GA, Torres A, Yu VL. Guidelines for the initial management of adults with community-
acquired pneumonia: diagnosis, assessment of severity, and initial antimicrobial therapy.
American Thoracic Society. Medical Section of the American Lung Association. Am Rev Respir Dis
1993: 148(5): 1418-1426.
24. Almirall J, Morato I, Riera F, Verdaguer A, Priu R, Coll P, Vidal J, Murgui L, Valls F,
Catalan F, et al. Incidence of community-acquired pneumonia and Chlamydia pneumoniae
infection: a prospective multicentre study. Eur Respir J 1993: 6(1): 14-18.
25. Lim WS, van der Eerden MM, Laing R, Boersma WG, Karalus N, Town GI, Lewis SA,
Macfarlane JT. Defining community acquired pneumonia severity on presentation to hospital: an
international derivation and validation study. Thorax 2003: 58(5): 377-382.
26. Espana PP, Capelastegui A, Gorordo I, Esteban C, Oribe M, Ortega M, Bilbao A,
Quintana JM. Development and validation of a clinical prediction rule for severe community-
acquired pneumonia. Am J Respir Crit Care Med 2006: 174(11): 1249-1256.
27. Zalacain R, Torres A, Celis R, Blanquer J, Aspa J, Esteban L, Menendez R, Blanquer R,
Borderias L. Community-acquired pneumonia in the elderly: Spanish multicentre study. Eur
Respir J 2003: 21(2): 294-302.
28. Dean NC, Silver MP, Bateman KA, James B, Hadlock CJ, Hale D. Decreased mortality
after implementation of a treatment guideline for community-acquired pneumonia. Am J Med
2001: 110(6): 451-457.
29. Mortensen EM, Restrepo M, Anzueto A, Pugh J. Effects of guideline-concordant
antimicrobial therapy on mortality among patients with community-acquired pneumonia. Am J
Med 2004: 117(10): 726-731.
30. Dudas V, Hopefl A, Jacobs R, Guglielmo BJ. Antimicrobial selection for hospitalized
patients with presumed community-acquired pneumonia: a survey of nonteaching US community
hospitals. Ann Pharmacother 2000: 34(4): 446-452.

Tesis Doctoral
Soledad María Reyes Calzada Página 83
31. Brown RB, Iannini P, Gross P, Kunkel M. Impact of initial antibiotic choice on clinical
outcomes in community-acquired pneumonia: analysis of a hospital claims-made database. Chest
2003: 123(5): 1503-1511.
32. Stahl JE, Barza M, DesJardin J, Martin R, Eckman MH. Effect of macrolides as part of
initial empiric therapy on length of stay in patients hospitalized with community-acquired
pneumonia. Arch Intern Med 1999: 159(21): 2576-2580.
33. Lentino JR, Krasnicka B. Association between initial empirical therapy and decreased
length of stay among veteran patients hospitalized with community acquired pneumonia. Int J
Antimicrob Agents 2002: 19(1): 61-66.
34. Frei CR, Koeller JM, Burgess DS, Talbert RL, Johnsrud MT. Impact of atypical coverage
for patients with community-acquired pneumonia managed on the medical ward: results from the
United States Community-Acquired Pneumonia Project. Pharmacotherapy 2003: 23(9): 1167-1174.
35. Menendez R, Ferrando D, Valles JM, Martinez E, Perpina M. Initial risk class and length
of hospital stay in community-acquired pneumonia. Eur Respir J 2001: 18(1): 151-156.
36. Menendez R, Cremades MJ, Martinez-Moragon E, Soler JJ, Reyes S, Perpina M. Duration
of length of stay in pneumonia: influence of clinical factors and hospital type. Eur Respir J 2003:
22(4): 643-648.
37. McCormick D, Fine MJ, Coley CM, Marrie TJ, Lave JR, Obrosky DS, Kapoor WN, Singer
DE. Variation in length of hospital stay in patients with community-acquired pneumonia: are
shorter stays associated with worse medical outcomes? Am J Med 1999: 107(1): 5-12.
38. Marrie TJ, Lau CY, Wheeler SL, Wong CJ, Vandervoort MK, Feagan BG. A controlled
trial of a critical pathway for treatment of community-acquired pneumonia. CAPITAL Study
Investigators. Community-Acquired Pneumonia Intervention Trial Assessing Levofloxacin. Jama
2000: 283(6): 749-755.
39. Ruiz A, Falguera M, Sacristan O, Vallverdu M, Cabre X, Perez J, Ferrer G. [Community-
acquired pneumonia: usefulness of clinical presentation in the selection of antibiotic treatment].
Med Clin (Barc) 2002: 119(17): 641-643.
40. Monge V, Gonzalez A. Hospital admissions for pneumonia in Spain. Infection 2001: 29(1):
3-6.

Tesis Doctoral
Soledad María Reyes Calzada Página 84
41. Monge V, San-Martin VM, Gonzalez A. The burden of community-acquired pneumonia in
Spain. Eur J Public Health 2001: 11(4): 362-364.
42. Gonzalez-Moraleja J, Sesma P, Gonzalez C, Lopez ME, Garcia JF, Alvarez-Sala JL. [What
is the cost of inappropriate admission of pneumonia patients?]. Arch Bronconeumol 1999: 35(7):
312-316.
43. Bartolome M, Almirall J, Morera J, Pera G, Ortun V, Bassa J, Bolibar I, Balanzo X,
Verdaguer A. A population-based study of the costs of care for community-acquired pneumonia.
Eur Respir J 2004: 23(4): 610-616.
44. Bauer TT, Welte T, Ernen C, Schlosser BM, Thate-Waschke I, de Zeeuw J, Schultze-
Werninghaus G. Cost analyses of community-acquired pneumonia from the hospital perspective.
Chest 2005: 128(4): 2238-2246.
45. Guest JF, Morris A. Community-acquired pneumonia: the annual cost to the National
Health Service in the UK. Eur Respir J 1997: 10(7): 1530-1534.
46. Lave JR, Fine MJ, Sankey SS, Hanusa BH, Weissfeld LA, Kapoor WN. Hospitalized
pneumonia. Outcomes, treatment patterns, and costs in urban and rural areas. J Gen Intern Med
1996: 11(7): 415-421.
47. Colice GL, Morley MA, Asche C, Birnbaum HG. Treatment costs of community-acquired
pneumonia in an employed population. Chest 2004: 125(6): 2140-2145.
48. Kaplan V, Angus DC, Griffin MF, Clermont G, Scott Watson R, Linde-Zwirble WT.
Hospitalized community-acquired pneumonia in the elderly: age- and sex-related patterns of care
and outcome in the United States. Am J Respir Crit Care Med 2002: 165(6): 766-772.
49. Roson B, Carratala J, Dorca J, Casanova A, Manresa F, Gudiol F. Etiology, reasons for
hospitalization, risk classes, and outcomes of community-acquired pneumonia in patients
hospitalized on the basis of conventional admission criteria. Clin Infect Dis 2001: 33(2): 158-165.
50. Fine MJ, Stone RA, Singer DE, Coley CM, Marrie TJ, Lave JR, Hough LJ, Obrosky DS,
Schulz R, Ricci EM, Rogers JC, Kapoor WN. Processes and outcomes of care for patients with
community-acquired pneumonia: results from the Pneumonia Patient Outcomes Research Team
(PORT) cohort study. Arch Intern Med 1999: 159(9): 970-980.

Tesis Doctoral
Soledad María Reyes Calzada Página 85
51. Arancibia F, Ewig S, Martinez JA, Ruiz M, Bauer T, Marcos MA, Mensa J, Torres A.
Antimicrobial treatment failures in patients with community-acquired pneumonia: causes and
prognostic implications. Am J Respir Crit Care Med 2000: 162(1): 154-160.
52. Menendez R, Torres A, Rodriguez de Castro F, Zalacain R, Aspa J, Martin Villasclaras JJ,
Borderias L, Benitez Moya JM, Ruiz-Manzano J, Blanquer J, Perez D, Puzo C, Sanchez-Gascon F,
Gallardo J, Alvarez CJ, Molinos L. Reaching stability in community-acquired pneumonia: the
effects of the severity of disease, treatment, and the characteristics of patients. Clin Infect Dis 2004:
39(12): 1783-1790. Epub .
53. Riquelme R, Torres A, el-Ebiary M, Mensa J, Estruch R, Ruiz M, Angrill J, Soler N.
Community-acquired pneumonia in the elderly. Clinical and nutritional aspects. Am J Respir Crit
Care Med 1997: 156(6): 1908-1914.
54. Cabre M, Serra-Prat M, Bolibar I, Pallares R. [Prognostic factors of community acquired
pneumonia in very old patients]. Med Clin (Barc) 2006: 127(6): 201-205.
55. Saldias Penafiel F, O'Brien Solar A, Gederlini Gollerino A, Farias Gontupil G, Diaz
Fuenzalida A. [Community-acquired pneumonia requiring hospitalization in immunocompetent
elderly patients: clinical features, prognostic factors and treatment]. Arch Bronconeumol 2003:
39(8): 333-340.
56. Bont J, Hak E, Hoes AW, Schipper M, Schellevis FG, Verheij TJ. A prediction rule for
elderly primary-care patients with lower respiratory tract infections. Eur Respir J 2007: 29(5):
969-975.
57. Menendez R, Torres A, Zalacain R, Aspa J, Martin-Villasclaras JJ, Borderias L, Benitez-
Moya JM, Ruiz-Manzano J, de Castro FR, Blanquer J, Perez D, Puzo C, Sanchez-Gascon F,
Gallardo J, Alvarez C, Molinos L. Guidelines for the Treatment of Community-acquired
Pneumonia: Predictors of Adherence and Outcome. Am J Respir Crit Care Med 2005: 172(6): 757-
762.
58. Marras TK, Chan CK. Use of guidelines in treating community-acquired pneumonia. Chest
1998: 113(6): 1689-1694.
59. Cabana MD, Rand CS, Powe NR, Wu AW, Wilson MH, Abboud PA, Rubin HR. Why
don't physicians follow clinical practice guidelines? A framework for improvement. Jama 1999:
282(15): 1458-1465.

Tesis Doctoral
Soledad María Reyes Calzada Página 86
60. Nathwani D, Rubinstein E, Barlow G, Davey P. Do guidelines for community-acquired
pneumonia improve the cost-effectiveness of hospital care? Clin Infect Dis 2001: 32(5): 728-741.
61. Briggs AH, O'Brien BJ. The death of cost-minimization analysis? Health Econ 2001: 10(2):
179-184.
62. Detsky AS, Naglie IG. A clinician's guide to cost-effectiveness analysis. Ann Intern Med
1990: 113(2): 147-154.
63. Russell LB, Gold MR, Siegel JE, Daniels N, Weinstein MC. The role of cost-effectiveness
analysis in health and medicine. Panel on Cost-Effectiveness in Health and Medicine. Jama 1996:
276(14): 1172-1177.
64. Atlas SJ, Benzer TI, Borowsky LH, Chang Y, Burnham DC, Metlay JP, Halm EA, Singer
DE. Safely increasing the proportion of patients with community-acquired pneumonia treated as
outpatients: an interventional trial. Arch Intern Med 1998: 158(12): 1350-1356.
65. Ramirez JA, Vargas S, Ritter GW, Brier ME, Wright A, Smith S, Newman D, Burke J,
Mushtaq M, Huang A. Early switch from intravenous to oral antibiotics and early hospital
discharge: a prospective observational study of 200 consecutive patients with community-acquired
pneumonia. Arch Intern Med 1999: 159(20): 2449-2454.
66. Weingarten SR, Riedinger MS, Hobson P, Noah MS, Johnson B, Giugliano G, Norian J,
Belman MJ, Ellrodt AG. Evaluation of a pneumonia practice guideline in an interventional trial.
Am J Respir Crit Care Med 1996: 153(3): 1110-1115.
67. Gleason PP, Kapoor WN, Stone RA, Lave JR, Obrosky DS, Schulz R, Singer DE, Coley
CM, Marrie TJ, Fine MJ. Medical outcomes and antimicrobial costs with the use of the American
Thoracic Society guidelines for outpatients with community-acquired pneumonia. Jama 1997:
278(1): 32-39.
68. Gilbert K, Gleason PP, Singer DE, Marrie TJ, Coley CM, Obrosky DS, Lave JR, Kapoor
WN, Fine MJ. Variations in antimicrobial use and cost in more than 2,000 patients with
community-acquired pneumonia. Am J Med 1998: 104(1): 17-27.
69. Meehan TP, Weingarten SR, Holmboe ES, Mathur D, Wang Y, Petrillo MK, Tu GS, Fine
JM. A statewide initiative to improve the care of hospitalized pneumonia patients: The
Connecticut Pneumonia Pathway Project. Am J Med 2001: 111(3): 203-210.
Tesis Doctoral
Soledad María Reyes Calzada Página 87
70. Campbell MK, Torgerson DJ. Bootstrapping: estimating confidence intervals for cost-
effectiveness ratios. QJM 1999: 92(3): 177-182.