
Estudio de la propagation del ruido de trafico en diversas ...

Two Propagation Scenarios of Isolated BreakdownLightning Processes in Failed NegativeCloud‐to‐Ground FlashesIvana Kolmašová1,2 , Ondřej Santolík1,2 , Eric Defer3 , Petr Kašpar1 , Andrea Kolínská1,4,Stéphane Pedeboy5, and Sylvain Coquillat3
1Department of Space Physics, Institute of Atmospheric Physics of the Czech Academy of Sciences, Prague, Czechia,2Faculty of Mathematics and Physics, Charles University, Prague, Czechia, 3Laboratoire d'Aérologie, Université deToulouse, CNRS, OMP, UPS, Toulouse, France, 4Faculty of Nuclear Sciences and Physical Engineering, Czech TechnicalUniversity, Prague, Czech Republic, 5Météorage, Pau, France
Abstract Isolated breakdown process (also known as attempted leader or inverted intra‐cloud discharge)is a lightning phenomenon characterized by radio wave pulses similar to signatures of preliminarybreakdown before negative cloud‐to‐ground flashes, but in this case no cloud‐to‐ground return strokesoccur. We identified 128 isolated breakdown pulse trains in measurements collected in the Mediterraneanby a broadband receiver (0.005–7 MHz) in 2015 and 2018. By combining these records with concurrentLightning Mapping Array measurements of very high frequency radiation (60–66 MHz) emitted by in‐clouddischarges we investigate the development of each discharge. We identify two scenarios: Either thedischarges continue to propagate almost horizontally for more than 150 ms (73%), or they quickly fade out(27%). The geo‐localized sources of the observed isolated breakdown pulse trains, together with theirwaveform characteristics (duration, inter‐pulse intervals, regularity, and bipolar shapes) show that bothscenarios are similar to initiation processes preceding negative cloud‐to‐ground flashes.
Plain Language Summary Visible lightning return stroke represents awell‐knownmanifestationof atmospheric electricity. However, it is only the last stage of a complex sequence of phenomenathat starts inside an electrically charged thundercloud by a preliminary breakdown process, continues by astepped leader that moves electrical charges into the lightning channel, neutralized eventually by a largereturn stroke current and followed in most cases by processes leading to subsequent strokes. All thesephenomena occurring inside or below the thundercloud involve impulsive electrical currents and hence emitradio waves. Analysis of our observations of isolated breakdown radio wave pulses which are notfollowed by a return stroke shows that the underlying processes are similar to a usual preliminary breakdownpreceding negative cloud‐to ground discharges. Nevertheless, a strong positive charge layer at thebottom of the thundercloud can force the breakdown current pulses to keep flowing inside the cloud or dieout and thus prevents them from evolving into a return stroke that would move the negative chargefrom the cloud to the ground.
1. Introduction
Both cloud‐to‐ground (CG) and intra‐cloud (IC) lightning flashes usually start with a preliminary break-down (PB) process (sometimes referred to as initial breakdown) which is characterized by a presence oftrains of bipolar pulses in electromagnetic recordings (Marshall et al., 2014, and references herein). Thesepulse trains are emitted by in‐cloud currents and can be detected hundreds of kilometers from their source(Kolmašová et al., 2016; Kotovsky et al., 2016). Measurements conducted several kilometers from lightningrecently showed that the first PB pulse is preceded by an ionizing initiation event followed by an initialelectric field change (Marshall et al., 2014, 2019). The PB stage of negative CG lightning flashes usuallyconverts into a stepped leader followed by the first return stroke (RS) (Rakov & Uman, 2003, and referencesherein).
However, sometimes the pre‐stroke activity does not lead to a regular RS pulse. Norinder and Knundsen(1956) reported for the first time an observation of “pre‐discharges lacking the main discharge”.Nag and Rakov (2008) described observation of trains of electric field pulses, which were not followed by
©2020. American Geophysical Union.All Rights Reserved.
RESEARCH LETTER10.1029/2020GL090593
Key Points:• Preliminary breakdown radio wave
pulses typical for negativecloud‐to‐ground flashes areexceptionally observed withoutreturn strokes
• Data show evidence of two possiblepropagation scenarios: Thedischarge leader either extendshorizontally inside the cloud orfades out
• The first analysis of a large numberof events shows that waveformcharacteristics of pulse trains arevery similar for both scenarios
Supporting Information:• Supporting Information S1
Correspondence to:I. Kolmašová,[email protected]
Citation:Kolmašová, I., Santolík, O., Defer, E.,Kašpar, P., Kolínská, A., Pedeboy, S., &Coquillat, S. (2020). Two propagationscenarios of isolated breakdownlightning processes in failed negativecloud‐to‐ground flashes. GeophysicalResearch Letters, 47, e2020GL090593.https://doi.org/10.1029/2020GL090593
Received 3 SEP 2020Accepted 31 OCT 2020Accepted article online 16 NOV 2020
KOLMAŠOVÁ ET AL. 1 of 10
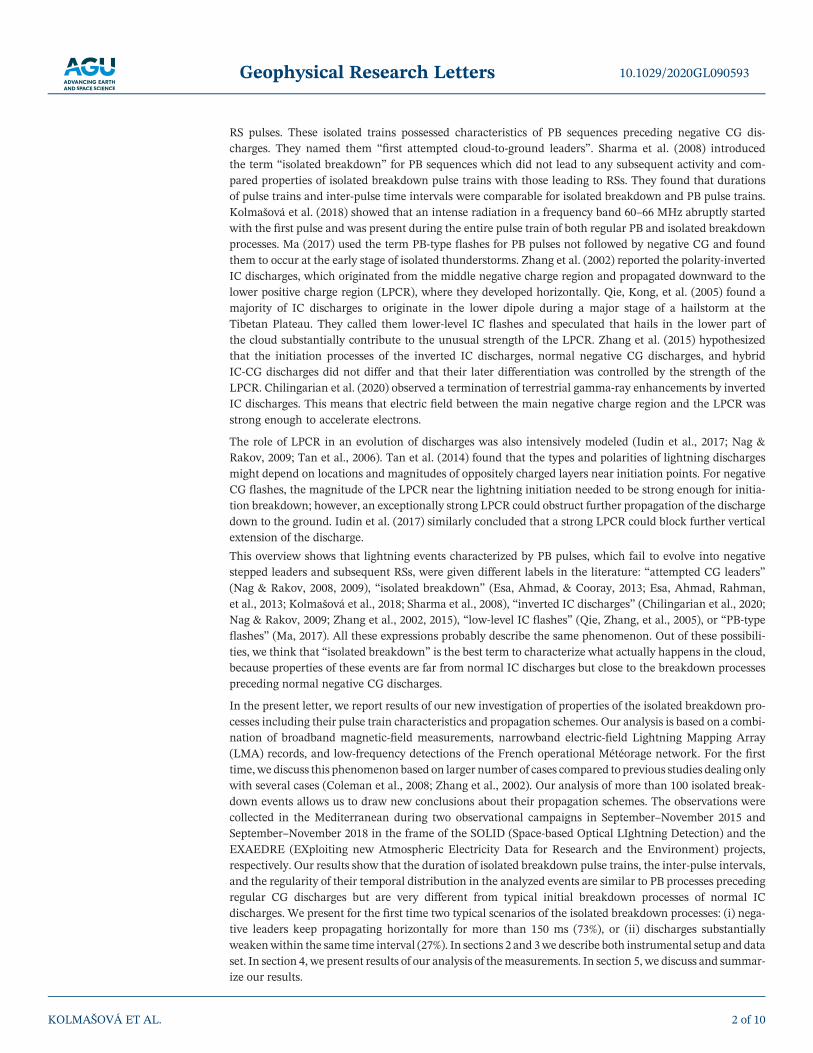
RS pulses. These isolated trains possessed characteristics of PB sequences preceding negative CG dis-charges. They named them “first attempted cloud‐to‐ground leaders”. Sharma et al. (2008) introducedthe term “isolated breakdown” for PB sequences which did not lead to any subsequent activity and com-pared properties of isolated breakdown pulse trains with those leading to RSs. They found that durationsof pulse trains and inter‐pulse time intervals were comparable for isolated breakdown and PB pulse trains.Kolmašová et al. (2018) showed that an intense radiation in a frequency band 60–66 MHz abruptly startedwith the first pulse and was present during the entire pulse train of both regular PB and isolated breakdownprocesses. Ma (2017) used the term PB‐type flashes for PB pulses not followed by negative CG and foundthem to occur at the early stage of isolated thunderstorms. Zhang et al. (2002) reported the polarity‐invertedIC discharges, which originated from the middle negative charge region and propagated downward to thelower positive charge region (LPCR), where they developed horizontally. Qie, Kong, et al. (2005) found amajority of IC discharges to originate in the lower dipole during a major stage of a hailstorm at theTibetan Plateau. They called them lower‐level IC flashes and speculated that hails in the lower part ofthe cloud substantially contribute to the unusual strength of the LPCR. Zhang et al. (2015) hypothesizedthat the initiation processes of the inverted IC discharges, normal negative CG discharges, and hybridIC‐CG discharges did not differ and that their later differentiation was controlled by the strength of theLPCR. Chilingarian et al. (2020) observed a termination of terrestrial gamma‐ray enhancements by invertedIC discharges. This means that electric field between the main negative charge region and the LPCR wasstrong enough to accelerate electrons.
The role of LPCR in an evolution of discharges was also intensively modeled (Iudin et al., 2017; Nag &Rakov, 2009; Tan et al., 2006). Tan et al. (2014) found that the types and polarities of lightning dischargesmight depend on locations and magnitudes of oppositely charged layers near initiation points. For negativeCG flashes, the magnitude of the LPCR near the lightning initiation needed to be strong enough for initia-tion breakdown; however, an exceptionally strong LPCR could obstruct further propagation of the dischargedown to the ground. Iudin et al. (2017) similarly concluded that a strong LPCR could block further verticalextension of the discharge.
This overview shows that lightning events characterized by PB pulses, which fail to evolve into negativestepped leaders and subsequent RSs, were given different labels in the literature: “attempted CG leaders”(Nag & Rakov, 2008, 2009), “isolated breakdown” (Esa, Ahmad, & Cooray, 2013; Esa, Ahmad, Rahman,et al., 2013; Kolmašová et al., 2018; Sharma et al., 2008), “inverted IC discharges” (Chilingarian et al., 2020;Nag & Rakov, 2009; Zhang et al., 2002, 2015), “low‐level IC flashes” (Qie, Zhang, et al., 2005), or “PB‐typeflashes” (Ma, 2017). All these expressions probably describe the same phenomenon. Out of these possibili-ties, we think that “isolated breakdown” is the best term to characterize what actually happens in the cloud,because properties of these events are far from normal IC discharges but close to the breakdown processespreceding normal negative CG discharges.
In the present letter, we report results of our new investigation of properties of the isolated breakdown pro-cesses including their pulse train characteristics and propagation schemes. Our analysis is based on a combi-nation of broadband magnetic‐field measurements, narrowband electric‐field Lightning Mapping Array(LMA) records, and low‐frequency detections of the French operational Météorage network. For the firsttime,we discuss this phenomenon based on larger number of cases compared to previous studies dealing onlywith several cases (Coleman et al., 2008; Zhang et al., 2002). Our analysis of more than 100 isolated break-down events allows us to draw new conclusions about their propagation schemes. The observations werecollected in the Mediterranean during two observational campaigns in September–November 2015 andSeptember–November 2018 in the frame of the SOLID (Space‐based Optical LIghtning Detection) and theEXAEDRE (EXploiting new Atmospheric Electricity Data for Research and the Environment) projects,respectively. Our results show that the duration of isolated breakdown pulse trains, the inter‐pulse intervals,and the regularity of their temporal distribution in the analyzed events are similar to PB processes precedingregular CG discharges but are very different from typical initial breakdown processes of normal ICdischarges. We present for the first time two typical scenarios of the isolated breakdown processes: (i) nega-tive leaders keep propagating horizontally for more than 150 ms (73%), or (ii) discharges substantiallyweakenwithin the same time interval (27%). In sections 2 and 3we describe both instrumental setup and dataset. In section 4, we present results of our analysis of themeasurements. In section 5, we discuss and summar-ize our results.
10.1029/2020GL090593Geophysical Research Letters
KOLMAŠOVÁ ET AL. 2 of 10

2. Instrumentation
To detect fluctuations of the E‐W horizontal component of magnetic field, we use the broadband analyzerBLESKA (Broadband Lightning Electromagnetic Signal Keeper Analyzer) (Kolmašová et al., 2018), aclone of the IME‐HF analyzer (Instrument de Mesure du champ Electrique Haute Fréquence) developedfor the TARANIS (Tool for the Analysis of Radiation from lightning and Sprites) spacecraft (Blancet al., 2007) and adapted for ground‐based measurements. The analyzer is connected to the magneticsensor SLAVIA (Shielded Loop Antenna with a Versatile Integrated Amplifier) and detects signals inthe frequency range from 5 kHz to 37 MHz, sampled at 80 MHz. The absolute time is obtained from aGPS receiver with an accuracy of 1 μs. The duration of triggered waveform snapshots is 208 ms. The recei-ver was installed close to Ersa, France (550 m, 42.97°N, 9.38°E), at the northernmost point of CorsicaIsland, in 2015. It was moved by a few kilometers in 2018 (100 m, 43.00°N, 9.36°E). BLESKA detectsbroadband pulses exhibiting peak‐to‐peak amplitudes larger than 0.4 nT which is well above the levelof environmental interferences.
The magnetic field records are combined with the measurements of the 12‐LMA‐station SAETTA (Suivi del'Activité Electrique Tridimensionnelle Totale de l'Atmosphère) network operated in Corsica sinceJune 2014 (Coquillat et al., 2019; Rison et al., 1999). Each station is equipped with an electric‐field antennaand detects very high frequency (VHF) radiation emitted by lightning discharges in the 60–66 MHz bandand sampled at 25 MHz. In each 80 μs time interval, the individual stations identify the times of arrivalof the strongest VHF peak exceeding a predefined threshold. The arrival times of the radiation peaks com-ing from the same source and detected by at least six individual LMA stations are used to calculate the 3‐Dlocation of a VHF radiation source. SAETTA also estimates power of individual geo‐located VHF sources.GPS receivers are connected to each LMA station and provide a time assignment with an accuracy of 1 μs(Thomas et al., 2004).
Locations, polarities, and peak currents for discharges used in our study were provided by the French light-ning locating system Météorage. To achieve an optimum coverage of the Southeast France and Corsicaregions, it combines sensors installed across France and sensors operated by Italian national service SIRF(Sistema Italiano Rilevamento Fulmini). The detection efficiency is 94%, the median location accuracy is120 m (Pedeboy & Toullec, 2016), and the accuracy of estimation of peak current amplitudes is about 18%(Schulz et al., 2016). Characteristics of both CG and IC discharges were available for both 2015 and 2018 datasets with an improved IC discharge detection efficiency for 2018.
3. Data Set
We visually inspected all triggered 208 ms long magnetic‐field waveform captures recorded by BLESKAduring autumn 2015 and autumn 2018 in order to identify sequences of bipolar pulses. We have chosen onlythe magnetic‐field records containing pulse trains during which SAETTA was able to geo‐locate at least oneVHF source. To distinguish isolated breakdown events from usual PB pulses preceding –CG lightning andfrom PB preceding normal IC discharges, we used the following criteria:
i. RS pulses were absent after the initial pulse sequence within the 208 ms long magnetic‐field waveformsnapshots.
ii. The list of Météorage records did not contain any CG detection within 1 s after the time of the strongestisolated breakdown pulse in magnetic field records.
iii. Knowing that the usual PB pulses have the same initial polarity as the corresponding RS pulses(Rakov & Uman, 2003), we selected only trains of pulses that exhibited the same polarity as negativeRS pulses. This criterion together with a visual inspection of the pulse train waveforms leads to theexclusion of PB pulse trains preceding normal polarity IC discharges. We were able to check the pulsepolarity without any ambiguity by combining the magnetic loop antenna orientation with thelocations of the IC pulses detected by Météorage. By applying this polarity criterion, we reducedour data set by 20%. We verified that the arrival azimuth of all analyzed events was further than 2°from the eastward and westward directions (perpendicular to our magnetic loop) to avoid any mis-classification of the polarity. A visual inspection of excluded trains showed that all excluded eventslacked at least one typical signature of PB pulse trains preceding –CGs: that is, duration of about1–2 ms, inter‐pulse intervals of about 100 μs, and a regular temporal distribution of pulses (Nag &
10.1029/2020GL090593Geophysical Research Letters
KOLMAŠOVÁ ET AL. 3 of 10

Rakov, 2008). We also noted that the peak amplitude of pulses randomly varied within the trains forall excluded events.
The resulting data set consists of 128 isolated breakdown events (33 events in 2015 and 95 events in 2018).
4. Data Analysis
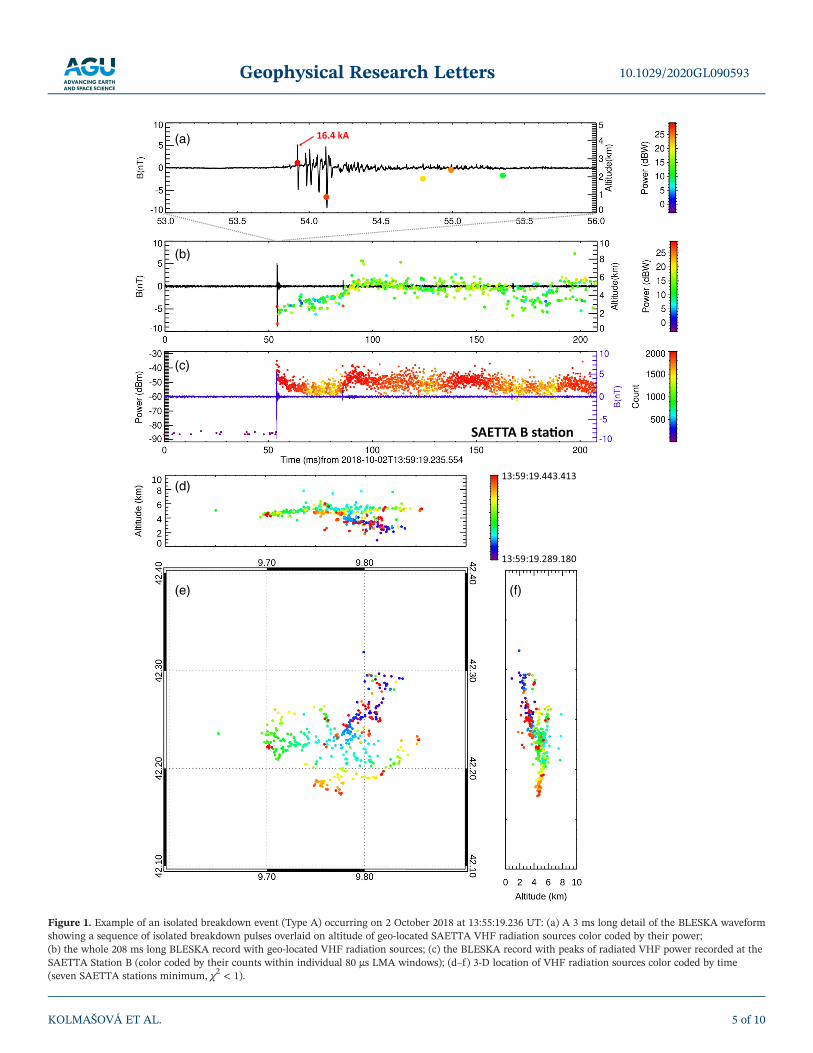
The sequences of the isolated breakdown pulses identified in the magnetic‐field records were usually a fewmilliseconds long. They were preceded by an electromagnetically quiet period lasting several tens of millise-conds in all cases. The inter‐pulse intervals lasted from several tens of microseconds to a few hundred ofmicroseconds. The strongest pulses in individual sequences usually occur during the first millisecond afterthe first recognizable pulse. The pulse activity following the sequences of the isolated breakdown pulses wasweak or completely absent. Two examples of magnetic‐field waveforms containing the isolated breakdownevents recorded by BLESKA are shown in Figures 1a and 2a, displaying a detail of 3 ms, while Figures 1b, 1c,2b, and 2c present the whole 208 ms long waveforms. Waveforms in Figures 1 and 2 were respectivelycaptured on 2 October 2018 and 13 October 2015. Red arrows point at the time of Météorage IC detections.Their peak currents were estimated to be 16.2 and 9.4 kA, respectively.
Correspondence of the isolated breakdown pulsesmeasured by BLESKA and the VHF sources geo‐located bySAETTA is shown in Figures 1a, 1b, 2a, and 2b: each dot corresponds to one reconstructed source of VHFradiation color coded by its power. It is evident from Figures 1a and 2a that almost none of the observed iso-lated breakdown pulses have a counterpart within the geo‐located VHF radiation sources during the dis-played three milliseconds. This effect was already reported by Kolmašová et al. (2018) and explained by adecreased ability of the LMA system to geo‐locate VHF sources if the counts of samples above the thresholdreached a maximum of 2,000 (40 ns) detections within an 80 μs LMA window at individual stations. Thismaximum of 2,000 detections was regularly reached at the LMA stations located close to developingdischarges suggesting that continuous VHF radiation was received during the initial phase of the isolatedbreakdown events. During the 208 ms‐long records in Figures 1b and 2b, SAETTA was able to geo‐locate444 and 159 VHF sources, respectively. The number of geo‐locations during all 128 events varies from 1(our condition for including an event in the analysis) to 843 VHF sources. The first geo‐located VHF sourceoccurred within the ±1 ms window around the first detectable isolated breakdown pulse in 75% of cases. Inmore than 85% of events, the geo‐located VHF source occurring close to the first detectable magnetic‐fieldpulse was also the most powerful one, with power varying from 8 to 36 dBW (24 dBW on average).Geo‐located VHF sources occurring later in time were weaker in amplitude, and, similarly as in Figures 1band 2b, their power did not exceed 20 dBW. VHF sources were predominantly reconstructed at an altitudebetween 2 and 6 km, even if some sources appeared also below and above this altitude range (for an overview,see Movies S1 and S2 in the supporting information). We also noted localized VHF sources, which did nothave their counterparts in the broadbandwaveforms. These VHF sources occurred especially in the later partof the records, well behind the train of the isolated breakdown pulses. This effect can be explained by a lowersensitivity of the broadband analyzer to signals generated by horizontal currents. We also speculate that dur-ing the horizontal propagation of the discharges, the in‐cloud channelsmight become shorter, and as a result,the frequency of emitted radiationmight have shifted above the upper frequency limit of the broadband recei-ver (37MHz) but still stay detectable by SAETTA at 66MHz. Kolmašová et al. (2018) reported that individualpeaks of strong VHF radiation recorded at individual stations (raw LMA data) still corresponded well to thebroadband pulses during lightning initiation, even in the situation when the LMAwas unable to reconstructgeo‐located VHF sources. Examples of VHF radiation detected by SAETTA Station B are illustrated inFigure 1c (29 km away) and Figure 2c (108 km away). VHF radiation in Figure 1c remained very intenseup to the end of the record, while in Figure 2c it was generally weaker and the counts and strengths ofVHF sources dropped after 120 ms to very low values, suggesting a different discharge development. Weinspected the time evolution of both strength and count of raw LMA station data for the 128 events and foundthat for three quarters of them the intense VHF radiation continued to occur at least for the closest LMA sta-tion up to the end of the 208 ms long magnetic‐field record, similarly to Figure 1c. For the remaining quarterof cases, the VHF radiation substantially dropped at all LMA stations before the end of the magnetic‐fieldrecord, similarly to Figure 2c.
10.1029/2020GL090593Geophysical Research Letters
KOLMAŠOVÁ ET AL. 4 of 10
(a)
(b)
(c)
(d)
(e) (f)
Figure 1. Example of an isolated breakdown event (Type A) occurring on 2 October 2018 at 13:55:19.236 UT: (a) A 3 ms long detail of the BLESKA waveformshowing a sequence of isolated breakdown pulses overlaid on altitude of geo‐located SAETTA VHF radiation sources color coded by their power;(b) the whole 208 ms long BLESKA record with geo‐located VHF radiation sources; (c) the BLESKA record with peaks of radiated VHF power recorded at theSAETTA Station B (color coded by their counts within individual 80 μs LMA windows); (d–f ) 3‐D location of VHF radiation sources color coded by time(seven SAETTA stations minimum, χ2 < 1).
10.1029/2020GL090593Geophysical Research Letters
KOLMAŠOVÁ ET AL. 5 of 10

(a)
(b)
(c)
(d)
(e) (f)
Figure 2. Same as Figure 1 but for an isolated breakdown event (Type B) occurring on 13 October 2015 at 22:09:30.073 UT.
10.1029/2020GL090593Geophysical Research Letters
KOLMAŠOVÁ ET AL. 6 of 10
(a) (b)
(c) (d)
(e) (f)
(g)
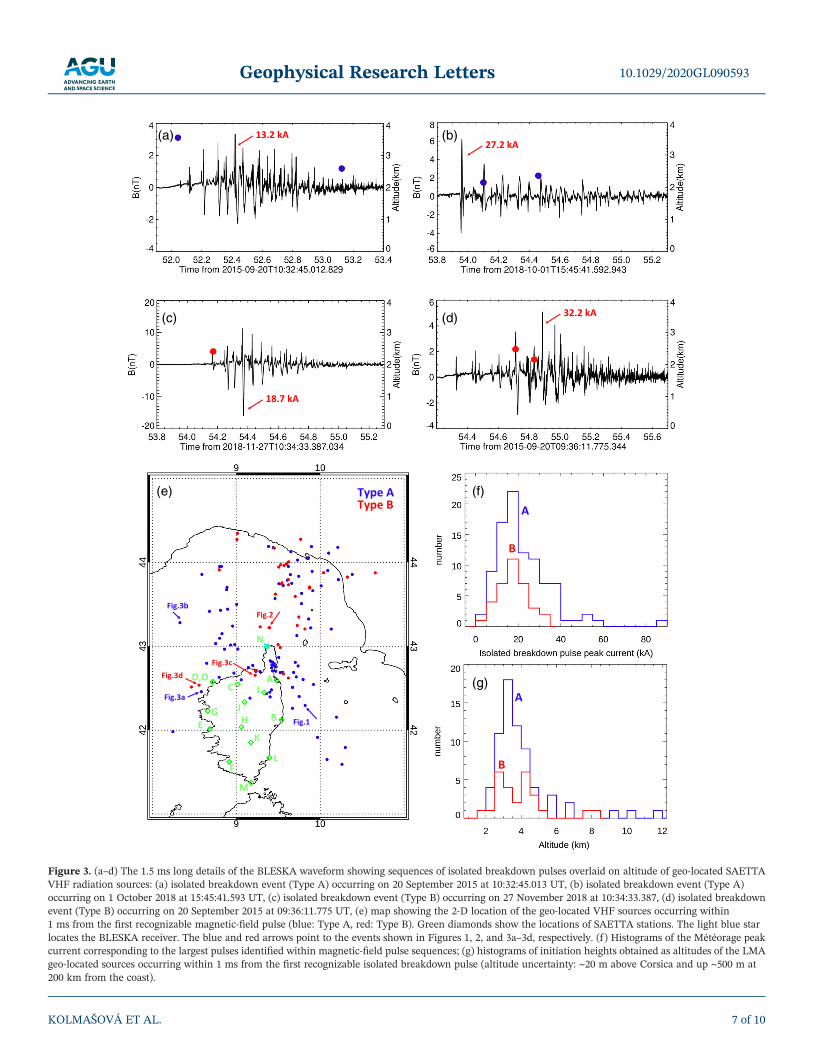
Figure 3. (a–d) The 1.5 ms long details of the BLESKA waveform showing sequences of isolated breakdown pulses overlaid on altitude of geo‐located SAETTAVHF radiation sources: (a) isolated breakdown event (Type A) occurring on 20 September 2015 at 10:32:45.013 UT, (b) isolated breakdown event (Type A)occurring on 1 October 2018 at 15:45:41.593 UT, (c) isolated breakdown event (Type B) occurring on 27 November 2018 at 10:34:33.387, (d) isolated breakdownevent (Type B) occurring on 20 September 2015 at 09:36:11.775 UT, (e) map showing the 2‐D location of the geo‐located VHF sources occurring within1 ms from the first recognizable magnetic‐field pulse (blue: Type A, red: Type B). Green diamonds show the locations of SAETTA stations. The light blue starlocates the BLESKA receiver. The blue and red arrows point to the events shown in Figures 1, 2, and 3a–3d, respectively. (f ) Histograms of the Météorage peakcurrent corresponding to the largest pulses identified within magnetic‐field pulse sequences; (g) histograms of initiation heights obtained as altitudes of the LMAgeo‐located sources occurring within 1 ms from the first recognizable isolated breakdown pulse (altitude uncertainty: ~20 m above Corsica and up ~500 m at200 km from the coast).
10.1029/2020GL090593Geophysical Research Letters
KOLMAŠOVÁ ET AL. 7 of 10

We illustrate the propagation of discharges starting with the isolated breakdown pulses in Figures 1d–1f and2d–2f. Each dot represents one geo‐located VHF source color coded by its time of occurrence. The dischargein Figure 1 started at an altitude of about 2 km, moved up by about 2 km in 30 ms, and kept propagating withnearly horizontal branches in a limited interval of altitudes for 100 ms (Figure 1b). Finally, one branchmoved down back to the initiation altitude, and the other one propagated horizontally. This dischargewas recorded during a weak lightning activity (seven discharges over 20 min). It was the first discharge ofa three‐discharge sequence of 150 s duration with a similar vertical distribution of geo‐located VHF sources.The discharge in Figure 2 shortly propagated almost at a constant altitude (Figure 2b). This discharge wasalso recorded during a rather weak lightning activity (seven discharges in 12 min). After combining all3‐D propagation maps with the information about the presence/absence of VHF sources detected at indivi-dual LMA stations for all isolated breakdown events, we identify two different propagation scenarios: thedischarges continue to propagate horizontally for more than 150 ms (Type A, as in Figure 1–73%), or theyfade out sooner than 150 ms (Type B, as in Figure 2–27%).
We inspected the magnetic field waveforms of individual pulse trains in order to compare their characteris-tics with typical signature of PB pulse trains prior –CGs: duration of about 1–2 ms, inter‐pulse intervals ofabout 100 μs, and a regular distribution of bipolar pulses (Nag & Rakov, 2008). We have found that themajority of the pulse sequences lasted about 2 ms or less for both scenarios (91% of Type A events, 94% ofType B events); the pulses within the trains were bipolar in all cases and regularly distributed in more thanone half of cases (57% of Type A events, 66% of Type B events). Inter‐pulse intervals were typically about100 μs long (82% of Type A events, 60% of Type B events). The intervals between pulses within individualtrains were sometimes also shorter, about 50 μs (9% of Type A events, 20% of Type B events) or longer upto 150–200 μs (9% of Type A events, 20% of Type A events).
In 86% of cases for both scenarios, the pulse peak amplitudes within the entire duration of trains were mono-tonically increasing and then decreasing or only decreasing (examples in Figure 3). In the remaining 14% ofcases for both scenarios, the pulse peak amplitudes were distributed randomly within the pulse sequences.
Figure 3e shows that the two scenarios do not imply any clear differences in terms of spatial distributions ofthe locations of the first geo‐located VHF source in each event, time stamped close to the first recognizableisolated breakdown pulse. Figure 3f presents the distribution of peak currents reported byMétéorage, alwayscorresponding to a pulse with the largest amplitude in each individual sequence. Median values of the peakcurrent are 20 and 17 kA for Types A and B, respectively. Note that these distributions are similar in bothcases and that the currents might be underestimated for both categories, as shown by Kašpar et al. (2016).The distribution of initiation heights for Types A and B is again similar (Figure 3g) with median values of3.5 and 3.8 km, respectively.
5. Discussion and Summary
We have analyzed 128 sequences of the isolated breakdown pulses observed simultaneously by a broadbandreceiver, a LMA network, and Météorage in West Mediterranean for two periods, in 2015 and in 2018. Weverified findings of Kolmašová et al. (2018) that intense VHF radiation in raw LMA data coincides withthe first isolated breakdown pulse in the broadband magnetic‐field measurements and that the most intenseVHF radiation are often correlated with the broadband pulses. The number of geo‐located VHF sourceswithin the 208 ms‐long magnetic‐field records, varied from units to hundreds. There were only a fewgeo‐located VHF sources occurring simultaneously with the magnetic‐field isolated breakdown pulse trains.In the majority of cases (85%), the VHF sources occurring within 1 ms around the first detectable isolatedbreakdown pulse in each event were also the most powerful ones detected during each pulse train. Theirpower ranged from 8 to 36 dBW (~6 W to 4 kW), about 2 orders of magnitude weaker than the typicalVHF power accompanying narrow bipolar events as reported by Bandara et al. (2020) but by 2 orders of mag-nitude stronger than the typical VHF radiation detected around the initiation event of –CG flashes or normalIC discharges (Marshall et al., 2019).
We have identified two scenarios of the isolated breakdown process based on the 128 sequences: Thedischarge continues to propagate horizontally for more than 150 ms (Type A, 73%) or dies out sooner(Type B, 27%). Typical in‐cloud currents, which generated the strongest isolated breakdown pulses, aresimilar for both types. These currents are reported by Météorage around 20 kA, and they do not differ
10.1029/2020GL090593Geophysical Research Letters
KOLMAŠOVÁ ET AL. 8 of 10

from peak currents, which emitted the most intense PB pulses preceding –CG discharges in Florida, USA(Karunarathne et al., 2020). Typical initiation altitudes (3.5 km, similar for both types) correspond to theregion between the main negative and lower positive charge centers, where –CG discharges are initiated(Stolzenburg & Marshall, 2008). Geo‐located VHF sources occurring close to the first detectablemagnetic‐field pulses in both types of trains also exhibited similarly strong power (on average 24 dBW).Our analysis of pulse train wave shapes shows that isolated breakdown pulse trains of both types cannotbe distinguished from the reported pulse sequences preceding –CG discharges (e.g., Kolmašová etal., 2019, 2014, 2018; Smith et al., 2018; Zhang et al., 2015) and exhibit different properties compared tothe ones of initiation pulses preceding normal IC discharges (Nag et al., 2009; Nag & Rakov, 2008). Theseresults therefore indicate that isolated breakdown processes of both types correspond to usual –CG dis-charges, which failed to propagate to ground. Several modeling investigations (Iudin et al., 2017; Nag &Rakov, 2009; Tan et al., 2014) show that an excessive LPCR can play a crucial role in blocking the propaga-tion of the CG discharges through a potential well. Figures S1 and S2 in the supporting information showhow this potential well changes as a function of LPCR properties. Both a larger strength and/or a lower alti-tude of the LPCR can lead to the development of a positive potential well below it. Our results are consistentwith the outcomes from Iudin et al. (2017) even though they used a different LPCR charge distribution, posi-tion, radius, and thickness. Our results also agree with observation from Coleman et al. (2008), who com-bined balloon measurements of vertical electric field and LMA VHF sources and found that horizontalextensions of lightning channels correlated with potential extrema.
In conclusion, we find that the isolated breakdown events (also known as attempted –CG leaders, invertedIC discharges, low‐level IC flashes, or PB‐type flashes) can show two different discharge propagation scenar-ios: The discharge either continues to propagate horizontally or quickly fades out. Based on the observedduration of the isolated breakdown pulse trains, on the inter‐pulse intervals, on their regularity, and onthe bipolar shapes of the pulses, as well as on the geo‐localization of their sources, we find that both scenar-ios described in this study are similar to PB processes preceding –CG flashes. More studies are needed todetail the geographical or seasonal variation of these two types of the isolated breakdown processes and theirrelation to the microphysical and electrical structure of the parent thunderstorms.
Data Availability Statement
The broadband data are available online (at http://bleska.ufa.cas.cz/ersa/storage/tar/). The SAETTA dataare available online (at https://doi.org/10.17632/8cdzb27mmv.1).
ReferencesBandara, S., Marshall, T., Karunarathne, S., & Stolzenburg, M. (2020). Electric field change and VHF waveforms of positive narrow bipolar
events in Mississippi thunderstorms. Atmospheric Research, 243, 105000. https://doi.org/10.1016/j.atmosres.2020.105000Blanc, E., Lefeuvre, F., Roussel‐Dupré, R., & Sauvaud, J. (2007). TARANIS: A microsatellite project dedicated to the study of impulsive
transfers of energy between the Earth atmosphere, the ionosphere, and the magnetosphere. Advances in Space Research, 40(8),1268–1275. https://doi.org/10.1016/j.asr.2007.06.037
Chilingarian, A., Khanikyants, Y., Rakov, V. A., & Soghomonyan, S. (2020). Termination of thunderstorm‐related bursts of energeticradiation and particles by inverted intracloud and hybrid lightning discharges. Atmospheric Research, 233, 104713. https://doi.org/10.1016/j.atmosres.2019.104713
Coleman, L. M., Stolzenburg, M., Marshall, T. C., & Stanley, M. (2008). Horizontal lightning propagation, preliminary breakdown,and electric potential in New Mexico thunderstorms. Journal of Geophysical Research, 113, D09208. https://doi.org/10.1029/2007JD009459
Coquillat, S., Defer, E., de Guibert, P., Lambert, D., Pinty, J.‐P., Pont, V., et al. (2019). SAETTA: High‐resolution 3‐D mapping of the totallightning activity in the Mediterranean Basin over Corsica, with a focus on a mesoscale convective system event. AtmosphericMeasurement Techniques, 12, 5765–5790. https://doi.org/10.5194/amt‐12‐5765‐2019
Esa, M. R. M., Ahmad, M. R., & Cooray, V. (2013). Wavelet analysis of the first electric field pulse of lightning flashes in Sweden.Atmospheric Research, 138, 253–267. https://doi.org/10.1016/j.atmosres.2013.11.019
Esa, M. R. M., Ahmad, M. R., Rahman, M., & Cooray, V. (2013). Distinctive features of radiation pulses in the very first moment of lightningevents. Journal of Atmospheric and Solar‐Terrestrial Physics, 109, 22–28. https://doi.org/10.1016/j.jastp.2013.12.019
Iudin, D. I., Rakov, V. A., Mareev, E. A., Iudin, F. D., Syssoev, A. A., & Davydenko, S. S. (2017). Advanced numerical model of lightningdevelopment: Application to studying the role of LPCR in determining lightning type. Journal of Geophysical Research: Atmospheres,122, 6416–6430. https://doi.org/10.1002/2016JD026261
Kašpar, P., Santolík, O., Kolmašová, I., & Farges, T. (2016). A model of preliminary breakdown pulse peak currents and their relation to theobserved electric field pulses. Geophysical Research Letters, 44, 596–603. https://doi.org/10.1002/2016GL071483
Kolmašová, I., Marshall, T., Bandara, S., Karunarathne, S., Stolzenburg, M., Karunarathne, N., & Siedlecki, R. (2019). Initial breakdownpulses accompanied by VHF pulses during negative cloud‐to‐ground lightning flashes. Geophysical Research Letters, 46, 5592–5600.https://doi.org/10.1029/2019GL082488
10.1029/2020GL090593Geophysical Research Letters
KOLMAŠOVÁ ET AL. 9 of 10
AcknowledgmentsThe work of I. K. and O. S. wassupported by European RegionalDevelopment Fund‐Project CRREAT(CZ.02.1.01/0.0/0.0/15_003/0000481)and by the Praemium Academiaeaward of the Czech Academy ofSciences. The work of P. K., A. K., R. L.,and L. U. was supported by the GACRgrant 20‐09671S. The work of E. D.,S. C., and S. P. was supported by CNESthrough the SOLID project and by ANRthrough the ANR‐16‐CE04‐0005EXAEDRE project. The SAETTAnetwork was operated with the supportfrom CNES, HyMeX program, andCollectivité de Corse.

Kolmašová, I., Santolík, O., Defer, E., Rison, W., Coquillat, S., Pedeboy, S., et al. (2018). Lightning initiation: Strong VHF radiation sourcesaccompanying preliminary breakdown pulses during lightning initiation. Scientific Reports, 8(1), 3650. https://doi.org/10.1038/s41598‐018‐21972‐z
Kolmašová, I., Santolík, O., Farges, T., Cummer, S. A., Lán, R., & Uhlíř, L. (2016). Subionospheric propagation and peak currents of pre-liminary breakdown pulses before negative cloud‐to‐ground lightning discharges. Geophysical Research Letters, 43, 1382–1391. https://doi.org/10.1002/2015GL067364
Kolmašová, I., Santolík, O., Farges, T., Rison, W., Lán, R., & Uhlíř, L. (2014). Properties of the unusually short pulse sequences occurringprior to the first strokes of negative cloud‐to‐ground lightning flashes. Geophysical Research Letters, 41, 5316–5324. https://doi.org/10.1002/2014GL060913
Kotovsky, D. A., Moore, R. C., Zhu, Y., Tran, M. D., Rakov, V. A., Pilkey, J. T., et al. (2016). Initial breakdown and fast leaders in lightningdischarges producing long‐lasting disturbances of the lower ionosphere. Journal of Geophysical Research: Space Physics, 121, 5794–5804.https://doi.org/10.1002/2015JA022266
Karunarathne, N., Marshall, T. C., Karunarathne, S., & Stolzenburg, M. (2020). Studying sequences of initial breakdown pulses in cloud‐to‐ground lightning flashes. Journal of Geophysical Research: Atmospheres, 125, e2019JD032104. https://doi.org/10.1029/2019JD032104
Ma, D. (2017). Characteristic pulse trains of preliminary breakdown in four isolated small thunderstorms. Journal of Geophysical Research:Atmospheres, 122, 3361–3373. https://doi.org/10.1002/2016JD025899
Marshall, T., Bandara, S., Karunarathne, N., Karunarathne, S., Kolmasova, I., Siedlecki, R., & Stolzenburg, M. (2019). A study of lightningflash initiation prior to the first initial breakdown pulse. Atmospheric Research, 217, 10–23. https://doi.org/10.1016/j.atmosres.2018.10.013
Marshall, T., Schulz, W., Karunarathna, N., Karunarathne, S., Stolzenburg, M., Vergeiner, C., & Warner, T. (2014). On the percentage oflightning flashes that begin with initial breakdown pulses. Journal of Geophysical Research: Atmospheres, 119, 445–460. https://doi.org/10.1002/2013JD020854
Marshall, T., Stolzenburg, M., Karunarathna, N., & Karunarathne, S. (2014). Electromagnetic activity before initial breakdown pulses oflightning. Journal of Geophysical Research: Atmospheres, 119, 12,558–12,574. https://doi.org/10.1002/2014JD022155
Nag, A., DeCarlo, B. A., & Rakov, V. A. (2009). Analysis of microsecond‐ and submicrosecond‐scale electric field pulses produced by cloudand ground lightning discharges. Atmospheric Research, 91(2–4), 316–325. https://doi.org/10.1016/j.atmosres.2008.01.014
Nag, A., & Rakov, V. A. (2008). Pulse trains that are characteristic of preliminary breakdown in cloud‐to‐ground lightning but are notfollowed by return stroke pulses. Journal of Geophysical Research, 113, D01102. https://doi.org/10.1029/2007jd008489
Nag, A., & Rakov, V. A. (2009). Some inferences on the role of lower positive charge region in facilitating different types of lightning.Geophysical Research Letters, 36, L05815. https://doi.org/10.1029/2008GL036783
Norinder, H., & Knudsen, E. (1956). Pre discharges in relation to subsequent lightning strokes. Arkiv foer Geofysik, 2(27), 551–571.Pedeboy, S. & Toullec, M. (2016). Impact study of the ‘Millau Bridge’ on the local lightning occurrence. In International Lightning Protection
Symposium 2016.Qie, X., Kong, X., Zhang, G., Zhang, T., Yuan, T., Zhou, Y., et al. (2005). The possible charge structure of thunderstorm and lightning
discharges in northeastern verge of Qinghai–Tibetan Plateau. Atmospheric Research, 76(2005), 231–246.Qie, X., Zhang, T., Chen, C., Zhang, G., Zhang, T., & Wei, W. (2005). The lower positive charge center and its effect on lightning discharges
on the Tibetan Plateau. Geophysical Research Letters, 32, L05814. https://doi.org/10.1029/2004GL022162Rakov, V. A., & Uman, M. A. (2003). Lightning—Physics and effects. New York: Cambridge University Press. ISBN:9780521583275.Rison, W., Thomas, R. J., Krehbiel, P. R., Hamlin, T., & Harlin, J. (1999). A GPS‐based three‐dimensional lightning mapping system: Initial
observations in Central New Mexico. Geophysical Research Letters, 26(23), 3573–3576. https://doi.org/10.1029/1999GL010856Schulz,W., Diendorfer, G., Pedeboy, S., & Roel Poelman, D. (2016). The European lightning location system EUCLID—Part 1: Performance
analysis and validation. Natural Hazards and Earth System Sciences, 16(2), 595–605. https://doi.org/10.5194/nhess‐16‐595‐2016Sharma, S. R., Cooray, V., & Fernando, M. (2008). Isolated breakdown activity in Swedish lightning. Journal of Atmospheric and Solar ‐
Terrestrial Physics, 70(8–9), 1213–1221. https://doi.org/10.1016/j.jastp.2008.03.003Smith, E. M., Marshall, T. C., Karunarathne, S., Siedlecki, R., & Stolzenburg, M. (2018). Initial breakdown pulse parameters in intracloud
and cloud‐to‐ground lightning flashes. Journal of Geophysical Research: Atmospheres, 123, 2129–2140. https://doi.org/10.1002/2017JD027729
Stolzenburg, M., & Marshall, T. C. (2008). Charge structure and dynamics in thunderstorms. Space Science Reviews, 137(1–4), 355–372.https://doi.org/10.1007/s11214‐008‐9338‐z
Tan, Y., Tao, S., Liang, Z., & Zhu, B. (2014). Numerical study on relationship between lightning types and distribution of space charge andelectric potential. Journal of Geophysical Research: Atmospheres, 119, 1003–1014. https://doi.org/10.1002/2013JD019983
Tan, Y., Tao, S., & Zhu, B. (2006). Fine‐resolution simulation of the channel structures and propagation features of intracloud lightning.Geophysical Research Letters, 33, L09809. https://doi.org/10.1029/2005GL025523
Thomas, R. J., Krehbiel, P. R., Rison, W., Hunyady, S. J., Winn, W. P., Hamlin, T., & Harlin, J. (2004). Accuracy of the Lightning MappingArray. Journal of Geophysical Research, 109, D14207. https://doi.org/10.1029/2004JD004549
Zhang, Y., Krehbiel, P. R., & Liu, X. (2002). Polarity inverted intracloud discharges and electric charge structure of thunderstorm. ChineseScience Bulletin, 47(20), 1725–1729. https://doi.org/10.1007/BF03183317
Zhang, Y., Zhang, Y., Zheng, D., & Lu, W. (2015). Preliminary breakdown, following lightning discharge processes and lower positivecharge region. Atmospheric Research, 161, 52–56.
References From the Supporting InformationBazelyan, E. M., & Raizer, Y. P. (2000). Lightning physics and lightning protection. Abingdon: Taylor and Francis group. https://doi.org/
10.1887/0750304774Mansell, E. R., MacGorman, D. R., Ziegler, C. L., & Straka, J. M. (2002). Simulated three‐dimensional branched lightning in a numerical
thunderstorm model. Journal of Geophysical Research, 107(D9), 4075. https://doi.org/10.1029/2000JD000244Mazur, V., & Ruhnke, L. H. (1998). Model of electric charges in thunderstorms and associated lightning. Journal of Geophysical Research,
103(D18), 23,299–23,308. https://doi.org/10.1029/98JD02120Press, W. H., Teukolsky, S. A., Vetterling, W. T., & Flannery, B. P. (1996). Numerical recipes in C (Vol. 2). New York: Cambridge University
Press.
10.1029/2020GL090593Geophysical Research Letters
KOLMAŠOVÁ ET AL. 10 of 10