Tereos 4T 2014/15 Presentation Eng
15
Tereos Internacional 2014/15 Year End Results São Paulo – June 03 rd , 2015
-
Upload
tereosir -
Category
Presentations & Public Speaking
-
view
361 -
download
0
Transcript of Tereos 4T 2014/15 Presentation Eng
Tereos Internacional2014/15 Year End Results
São Paulo – June 03rd, 2015
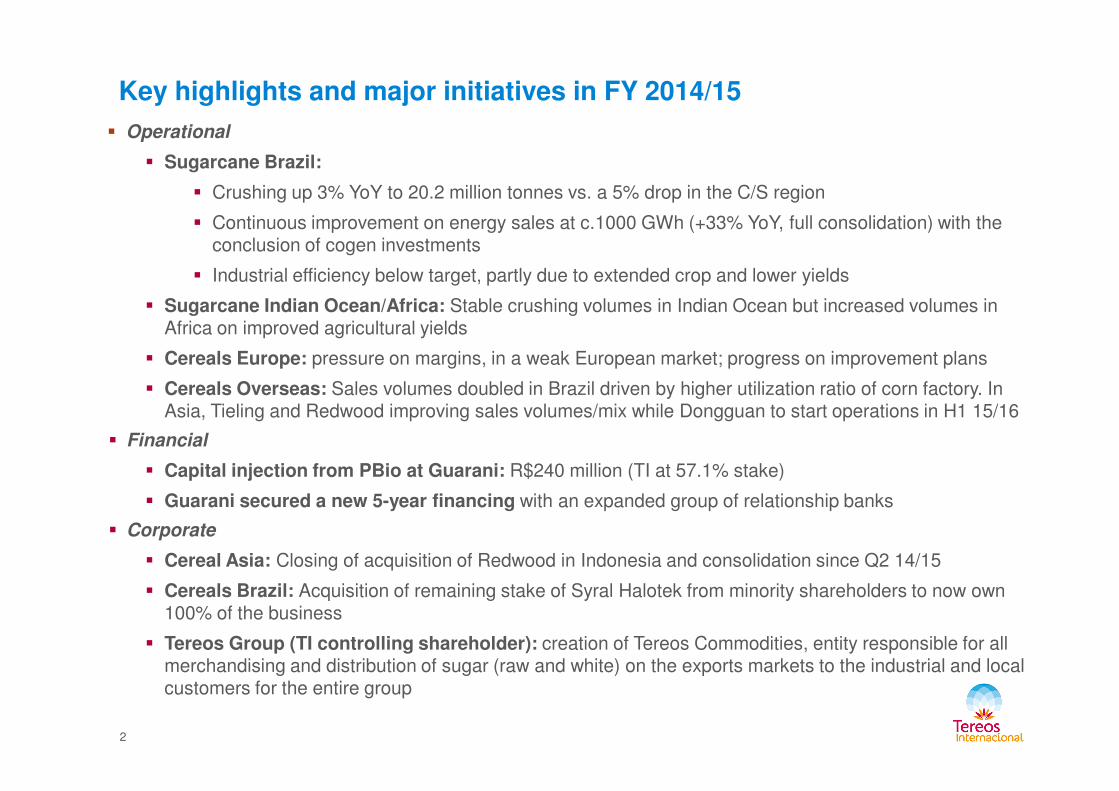
Key highlights and major initiatives in FY 2014/15
� Operational
� Sugarcane Brazil:
� Crushing up 3% YoY to 20.2 million tonnes vs. a 5% drop in the C/S region
� Continuous improvement on energy sales at c.1000 GWh (+33% YoY, full consolidation) with the conclusion of cogen investments
� Industrial efficiency below target, partly due to extended crop and lower yields
� Sugarcane Indian Ocean/Africa: Stable crushing volumes in Indian Ocean but increased volumes in Africa on improved agricultural yields
� Cereals Europe: pressure on margins, in a weak European market; progress on improvement plans
� Cereals Overseas: Sales volumes doubled in Brazil driven by higher utilization ratio of corn factory. In
2
� Cereals Overseas: Sales volumes doubled in Brazil driven by higher utilization ratio of corn factory. In Asia, Tieling and Redwood improving sales volumes/mix while Dongguan to start operations in H1 15/16
� Financial
� Capital injection from PBio at Guarani: R$240 million (TI at 57.1% stake)
� Guarani secured a new 5-year financing with an expanded group of relationship banks
� Corporate
� Cereal Asia: Closing of acquisition of Redwood in Indonesia and consolidation since Q2 14/15
� Cereals Brazil: Acquisition of remaining stake of Syral Halotek from minority shareholders to now own 100% of the business
� Tereos Group (TI controlling shareholder): creation of Tereos Commodities, entity responsible for all merchandising and distribution of sugar (raw and white) on the exports markets to the industrial and local customers for the entire group
210
230
250€/MT
11
12
13
14
15
16
17
18
19
20
21
350
390
430
470
510
550
Mar-14 Jun-14 Sep-14 Dec-14 Mar-15
LIFFE #5 NY#11
US$/MT US$ Cts/lb
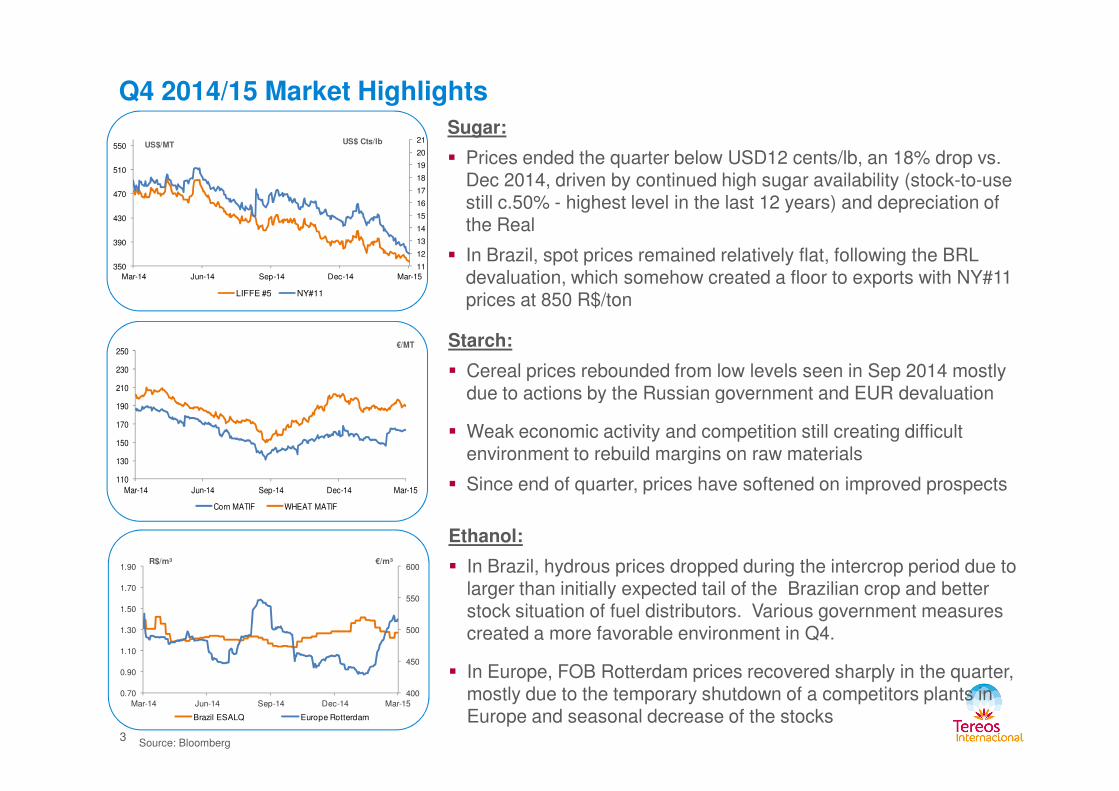
Q4 2014/15 Market Highlights
Sugar:
� Prices ended the quarter below USD12 cents/lb, an 18% drop vs. Dec 2014, driven by continued high sugar availability (stock-to-use still c.50% - highest level in the last 12 years) and depreciation of the Real
� In Brazil, spot prices remained relatively flat, following the BRL devaluation, which somehow created a floor to exports with NY#11 prices at 850 R$/ton
Starch:
� Cereal prices rebounded from low levels seen in Sep 2014 mostly due to actions by the Russian government and EUR devaluation
400
450
500
550
600
0.70
0.90
1.10
1.30
1.50
1.70
1.90
Mar-14 Jun-14 Sep-14 Dec-14 Mar-15
Brazil ESALQ Europe Rotterdam
R$/m³ €/m³
110
130
150
170
190
Mar-14 Jun-14 Sep-14 Dec-14 Mar-15
Corn MATIF WHEAT MATIF
3Source: Bloomberg
due to actions by the Russian government and EUR devaluation
� Weak economic activity and competition still creating difficult environment to rebuild margins on raw materials
� Since end of quarter, prices have softened on improved prospects
Ethanol:
� In Brazil, hydrous prices dropped during the intercrop period due to larger than initially expected tail of the Brazilian crop and better stock situation of fuel distributors. Various government measures created a more favorable environment in Q4.
� In Europe, FOB Rotterdam prices recovered sharply in the quarter, mostly due to the temporary shutdown of a competitors plants in Europe and seasonal decrease of the stocks
848 505
4,2114,138
1,0631,057
2,2172,339
Brazil
Africa/Indian Ocean
Starch & Sweeteners
Alcohol & Ethanol Europe
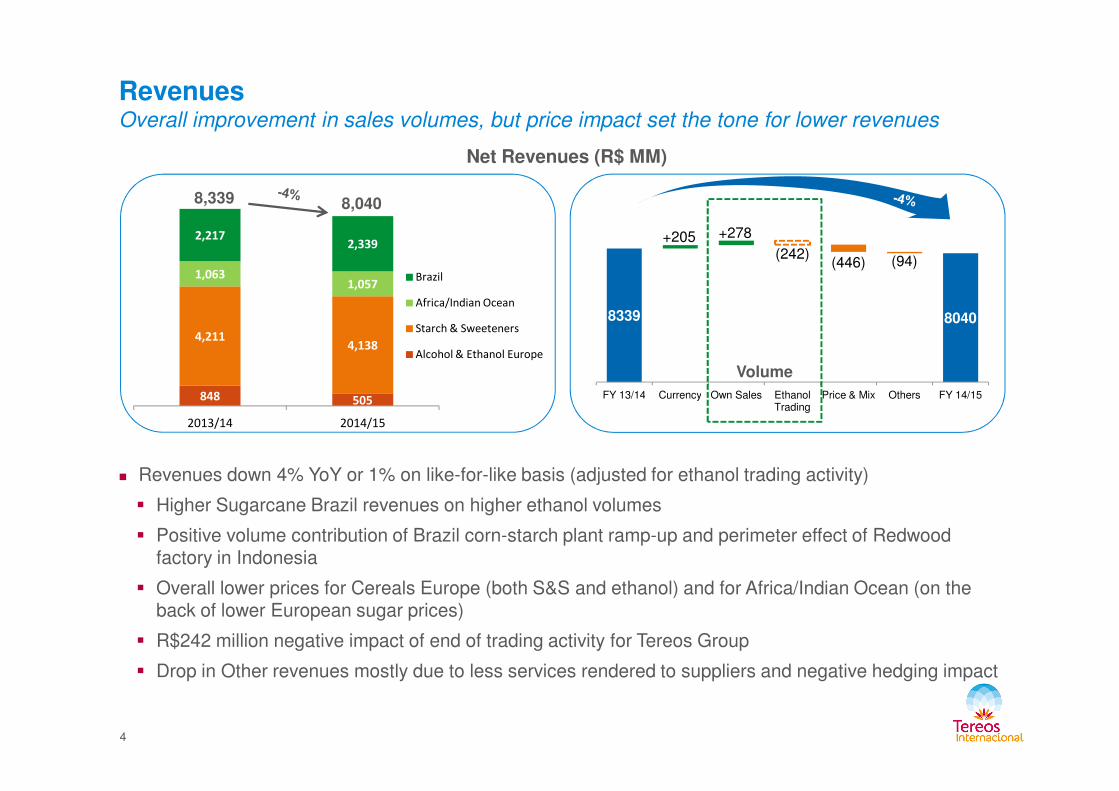
RevenuesOverall improvement in sales volumes, but price impact set the tone for lower revenues
Net Revenues (R$ MM)
8,339 8,040
8339 8040
+205 +278
(242)(446) (94)
FY 13/14 Currency Own Sales Ethanol Price & Mix Others FY 14/15
Volume
848 505
2013/14 2014/15
4
� Revenues down 4% YoY or 1% on like-for-like basis (adjusted for ethanol trading activity)
� Higher Sugarcane Brazil revenues on higher ethanol volumes
� Positive volume contribution of Brazil corn-starch plant ramp-up and perimeter effect of Redwood factory in Indonesia
� Overall lower prices for Cereals Europe (both S&S and ethanol) and for Africa/Indian Ocean (on the back of lower European sugar prices)
� R$242 million negative impact of end of trading activity for Tereos Group
� Drop in Other revenues mostly due to less services rendered to suppliers and negative hedging impact
FY 13/14 Currency Own Sales Ethanol Trading
Price & Mix Others FY 14/15
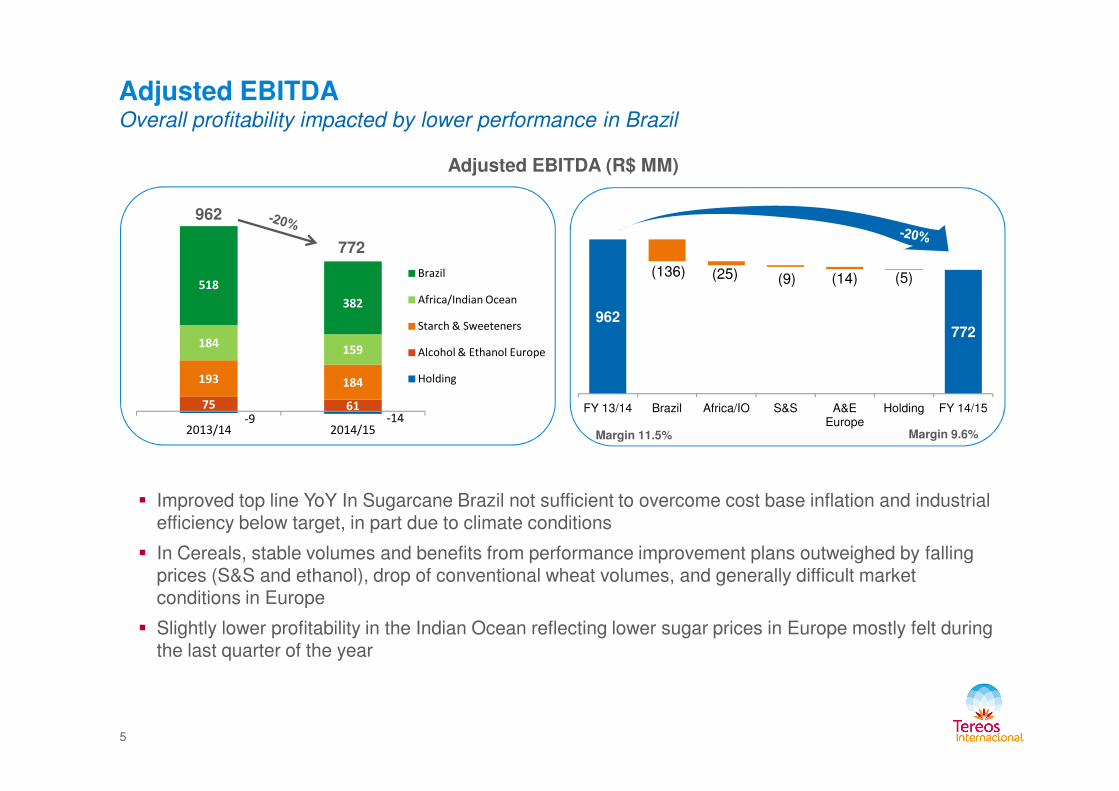
962772
(136) (25) (9) (14) (5)
193 184
184159
518
382
Brazil
Africa/Indian Ocean
Starch & Sweeteners
Alcohol & Ethanol Europe
Holding
Adjusted EBITDAOverall profitability impacted by lower performance in Brazil
Adjusted EBITDA (R$ MM)
962
772
FY 13/14 Brazil Africa/IO S&S A&E Europe
Holding FY 14/15-9 -14
75 61
2013/14 2014/15
5
� Improved top line YoY In Sugarcane Brazil not sufficient to overcome cost base inflation and industrial efficiency below target, in part due to climate conditions
� In Cereals, stable volumes and benefits from performance improvement plans outweighed by falling prices (S&S and ethanol), drop of conventional wheat volumes, and generally difficult market conditions in Europe
� Slightly lower profitability in the Indian Ocean reflecting lower sugar prices in Europe mostly felt during the last quarter of the year
Margin 9.6%Margin 11.5%
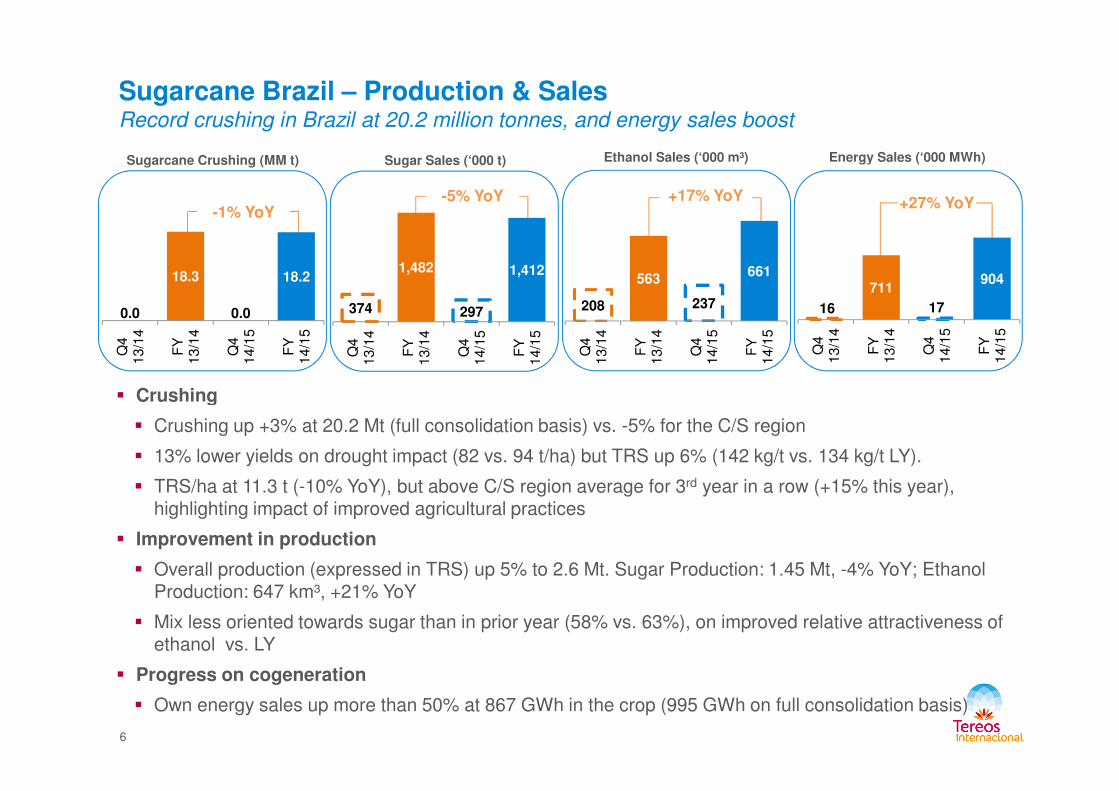
Ethanol Sales (‘000 m³)Sugarcane Crushing (MM t) Sugar Sales (‘000 t)
Sugarcane Brazil – Production & SalesRecord crushing in Brazil at 20.2 million tonnes, and energy sales boost
Energy Sales (‘000 MWh)
� Crushing
-1% YoY
0.0
18.3
0.0
18.2
Q4
1
3/1
4
FY
1
3/1
4
Q4
1
4/1
5
FY
1
4/1
5
-5% YoY
374
1,482
297
1,412
Q4
1
3/1
4
FY
1
3/1
4
Q4
1
4/1
5
FY
1
4/1
5
+17% YoY
208
563
237
661
Q4
1
3/1
4
FY
1
3/1
4
Q4
1
4/1
5
FY
1
4/1
5
+27% YoY
16
711
17
904
Q4
1
3/1
4
FY
1
3/1
4
Q4
1
4/1
5
FY
1
4/1
5
6
� Crushing
� Crushing up +3% at 20.2 Mt (full consolidation basis) vs. -5% for the C/S region
� 13% lower yields on drought impact (82 vs. 94 t/ha) but TRS up 6% (142 kg/t vs. 134 kg/t LY).
� TRS/ha at 11.3 t (-10% YoY), but above C/S region average for 3rd year in a row (+15% this year), highlighting impact of improved agricultural practices
� Improvement in production
� Overall production (expressed in TRS) up 5% to 2.6 Mt. Sugar Production: 1.45 Mt, -4% YoY; Ethanol Production: 647 km³, +21% YoY
� Mix less oriented towards sugar than in prior year (58% vs. 63%), on improved relative attractiveness of ethanol vs. LY
� Progress on cogeneration
� Own energy sales up more than 50% at 867 GWh in the crop (995 GWh on full consolidation basis)
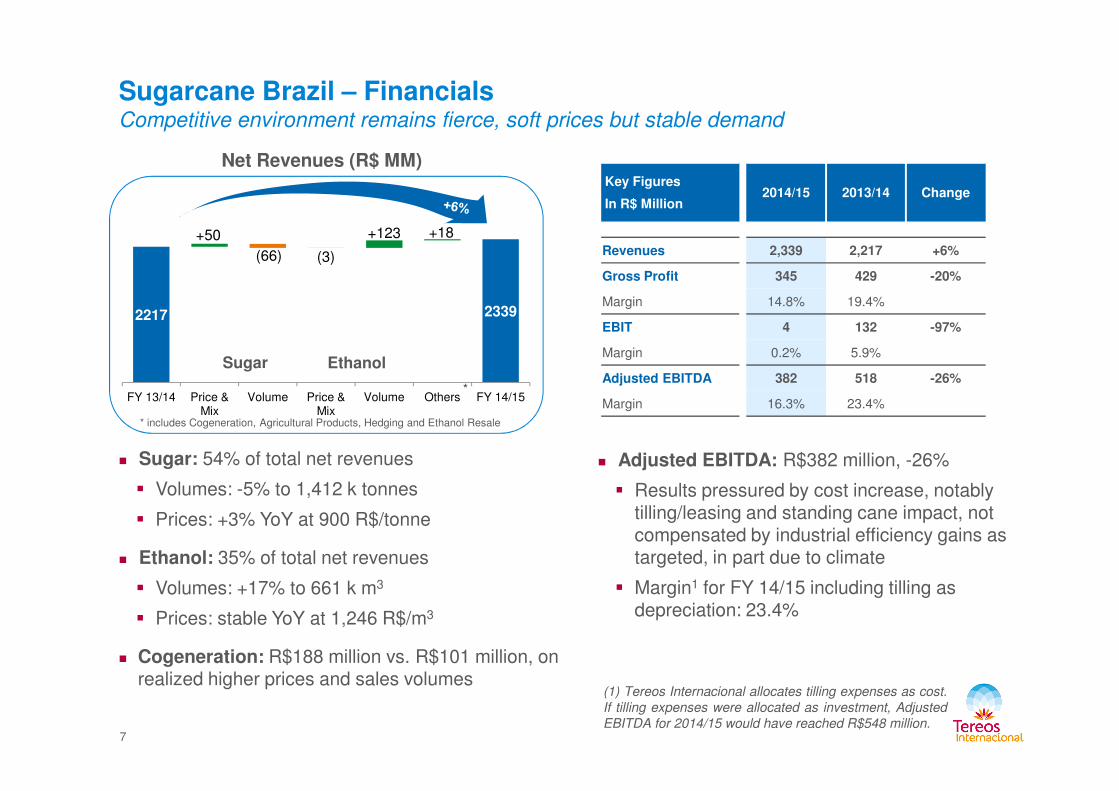
2217 2339
+50
(66) (3)
+123 +18
FY 13/14 Price & Volume Price & Volume Others FY 14/15
Sugarcane Brazil – FinancialsCompetitive environment remains fierce, soft prices but stable demand
Net Revenues (R$ MM)
Sugar Ethanol
Key Figures
In R$ Million2014/15 2013/14 Change
Revenues 2,339 2,217 +6%
Gross Profit 345 429 -20%
Margin 14.8% 19.4%
EBIT 4 132 -97%
Margin 0.2% 5.9%
Adjusted EBITDA 382 518 -26%*
FY 13/14 Price & Mix
Volume Price & Mix
Volume Others FY 14/15
* includes Cogeneration, Agricultural Products, Hedging and Ethanol Resale
7
(1) Tereos Internacional allocates tilling expenses as cost.If tilling expenses were allocated as investment, AdjustedEBITDA for 2014/15 would have reached R$548 million.
� Sugar: 54% of total net revenues
� Volumes: -5% to 1,412 k tonnes
� Prices: +3% YoY at 900 R$/tonne
� Ethanol: 35% of total net revenues
� Volumes: +17% to 661 k m3
� Prices: stable YoY at 1,246 R$/m3
� Cogeneration: R$188 million vs. R$101 million, on realized higher prices and sales volumes
� Adjusted EBITDA: R$382 million, -26%
� Results pressured by cost increase, notably tilling/leasing and standing cane impact, not compensated by industrial efficiency gains as targeted, in part due to climate
� Margin1 for FY 14/15 including tilling as depreciation: 23.4%
Margin 16.3% 23.4%
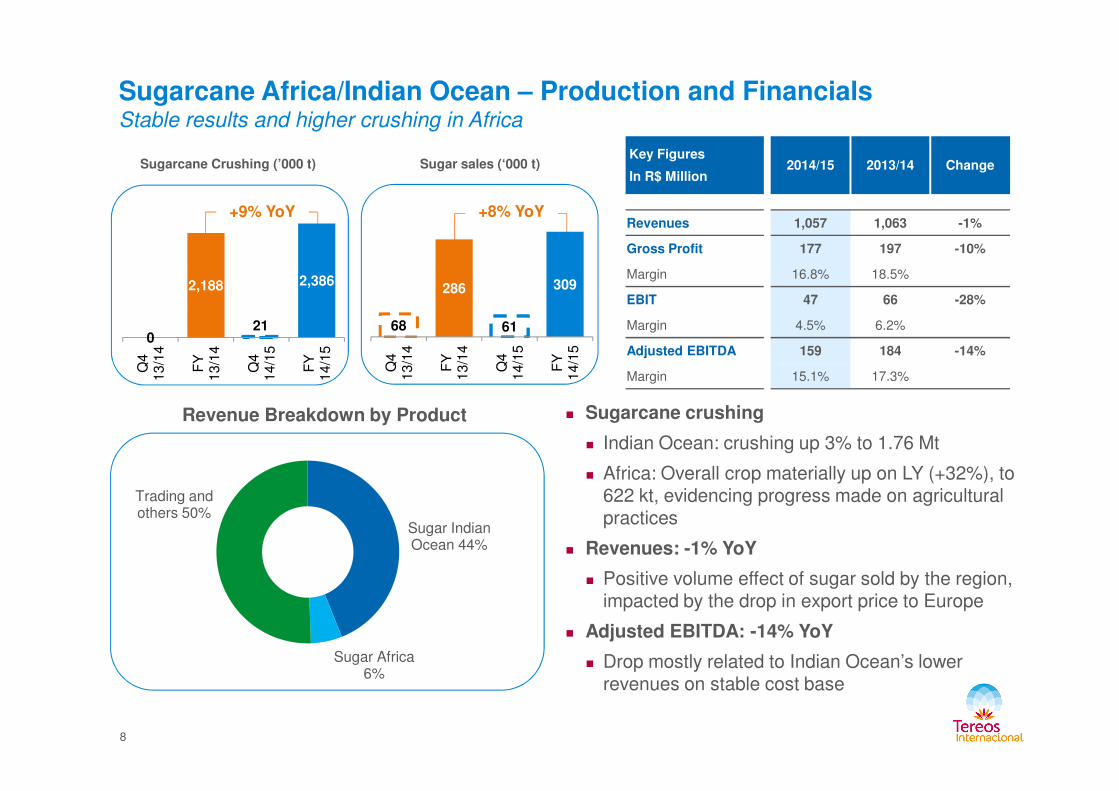
Sugarcane Africa/Indian Ocean – Production and Financials Stable results and higher crushing in Africa
Sugarcane Crushing (’000 t) Sugar sales (‘000 t)Key Figures
In R$ Million2014/15 2013/14 Change
Revenues 1,057 1,063 -1%
Gross Profit 177 197 -10%
Margin 16.8% 18.5%
EBIT 47 66 -28%
Margin 4.5% 6.2%
Adjusted EBITDA 159 184 -14%
Margin 15.1% 17.3%
+9% YoY
0
2,188
21
2,386
Q4
1
3/1
4
FY
1
3/1
4
Q4
1
4/1
5
FY
1
4/1
5
+8% YoY
68
286
61
309
Q4
1
3/1
4
FY
1
3/1
4
Q4
1
4/1
5
FY
1
4/1
5
8
Revenue Breakdown by Product � Sugarcane crushing
� Indian Ocean: crushing up 3% to 1.76 Mt
� Africa: Overall crop materially up on LY (+32%), to 622 kt, evidencing progress made on agricultural practices
� Revenues: -1% YoY
� Positive volume effect of sugar sold by the region, impacted by the drop in export price to Europe
� Adjusted EBITDA: -14% YoY
� Drop mostly related to Indian Ocean’s lower revenues on stable cost base
Sugar Indian Ocean 44%
Sugar Africa 6%
Trading and others 50%
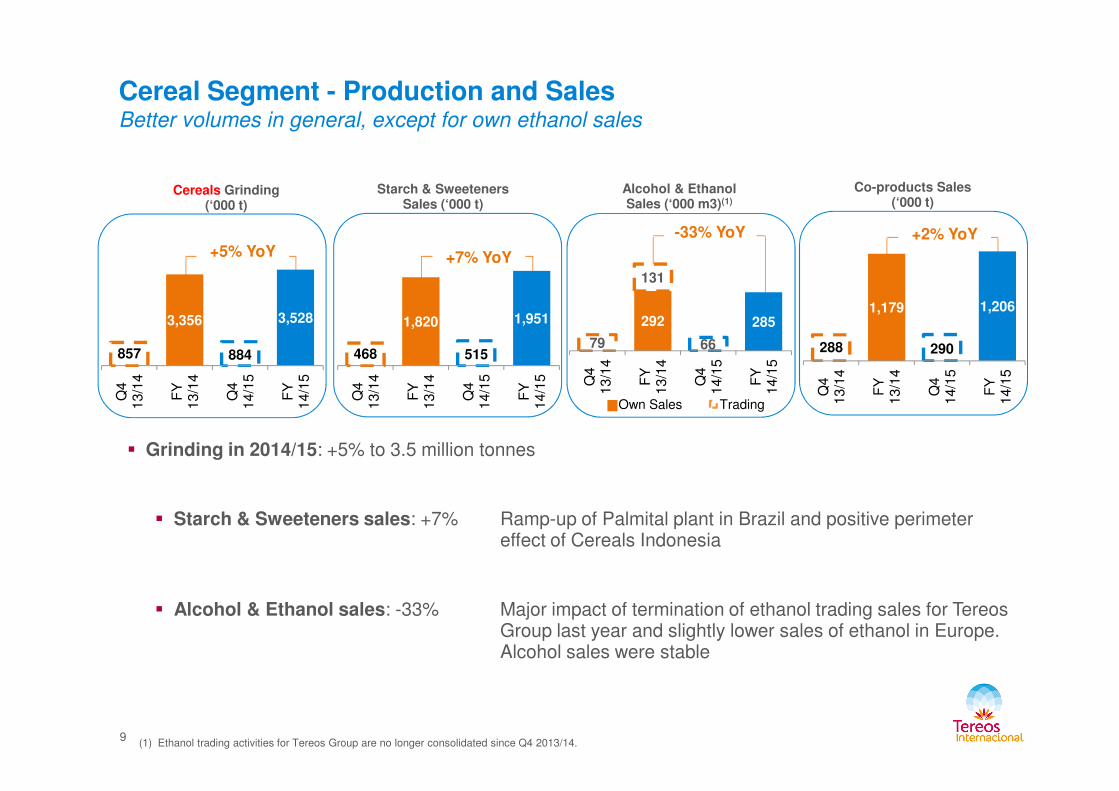
Cereal Segment - Production and SalesBetter volumes in general, except for own ethanol sales
Cereals Grinding (‘000 t)
Starch & Sweeteners Sales (‘000 t)
Alcohol & Ethanol Sales (‘000 m3)(1)
Co-products Sales (‘000 t)
+5% YoY
857
3,356
884
3,528
Q4
1
3/1
4
FY
1
3/1
4
Q4
1
4/1
5
FY
1
4/1
5
-33% YoY
79
292
66
285
131
Q4
1
3/1
4
FY
1
3/1
4
Q4
1
4/1
5
FY
1
4/1
5
+7% YoY
468
1,820
515
1,951
Q4
1
3/1
4
FY
1
3/1
4
Q4
1
4/1
5
FY
1
4/1
5
+2% YoY
288
1,179
290
1,206
Q4
1
3/1
4
FY
1
3/1
4
Q4
1
4/1
5
FY
1
4/1
5
9
� Grinding in 2014/15: +5% to 3.5 million tonnes
� Starch & Sweeteners sales: +7% Ramp-up of Palmital plant in Brazil and positive perimeter effect of Cereals Indonesia
� Alcohol & Ethanol sales: -33% Major impact of termination of ethanol trading sales for Tereos Group last year and slightly lower sales of ethanol in Europe. Alcohol sales were stable
Own Sales Trading
Q4
1
3/1
4
FY
1
3/1
4
Q4
1
4/1
5
FY
1
4/1
5
(1) Ethanol trading activities for Tereos Group are no longer consolidated since Q4 2013/14.
Q4
1
3/1
4
FY
1
3/1
4
Q4
1
4/1
5
FY
1
4/1
5
Q4
1
3/1
4
FY
1
3/1
4
Q4
1
4/1
5
FY
1
4/1
5
4211 4138
+140 +164
(394)+16
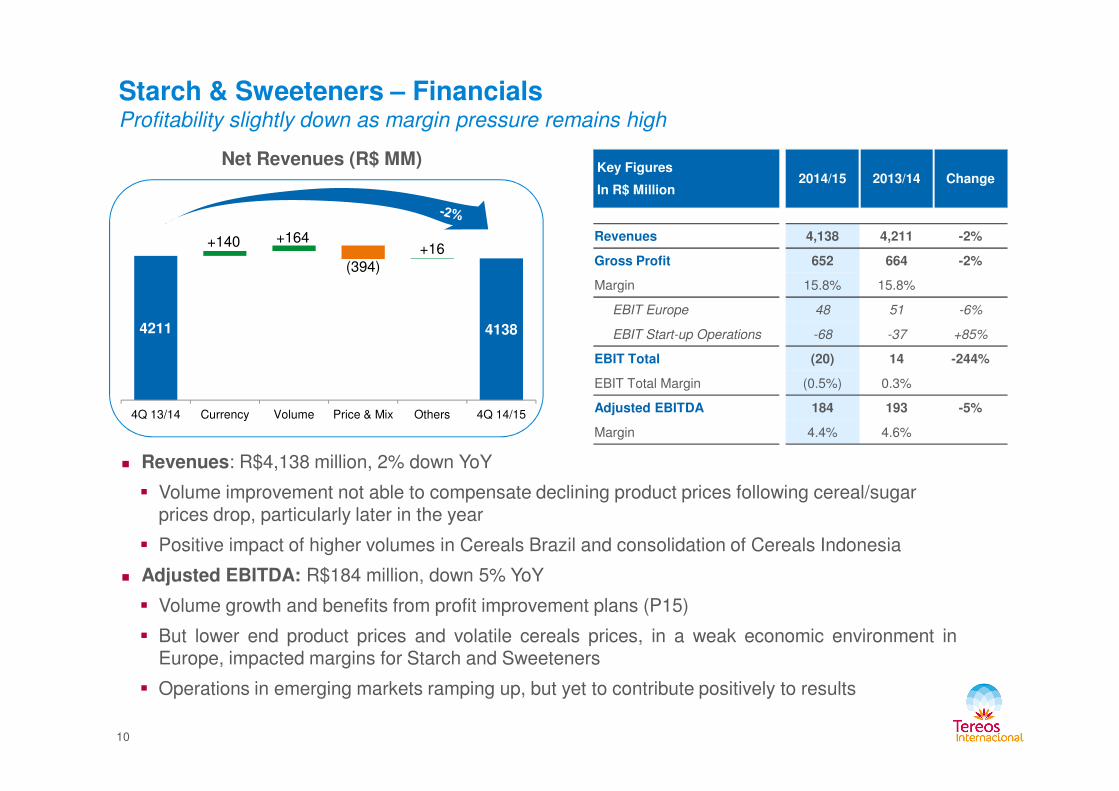
Starch & Sweeteners – FinancialsProfitability slightly down as margin pressure remains high
Net Revenues (R$ MM)Key Figures
In R$ Million2014/15 2013/14 Change
Revenues 4,138 4,211 -2%
Gross Profit 652 664 -2%
Margin 15.8% 15.8%
EBIT Europe 48 51 -6%
EBIT Start-up Operations -68 -37 +85%
EBIT Total (20) 14 -244%
EBIT Total Margin (0.5%) 0.3%
4Q 13/14 Currency Volume Price & Mix Others 4Q 14/15
10
� Revenues: R$4,138 million, 2% down YoY
� Volume improvement not able to compensate declining product prices following cereal/sugar prices drop, particularly later in the year
� Positive impact of higher volumes in Cereals Brazil and consolidation of Cereals Indonesia
� Adjusted EBITDA: R$184 million, down 5% YoY
� Volume growth and benefits from profit improvement plans (P15)
� But lower end product prices and volatile cereals prices, in a weak economic environment inEurope, impacted margins for Starch and Sweeteners
� Operations in emerging markets ramping up, but yet to contribute positively to results
Adjusted EBITDA 184 193 -5%
Margin 4.4% 4.6%
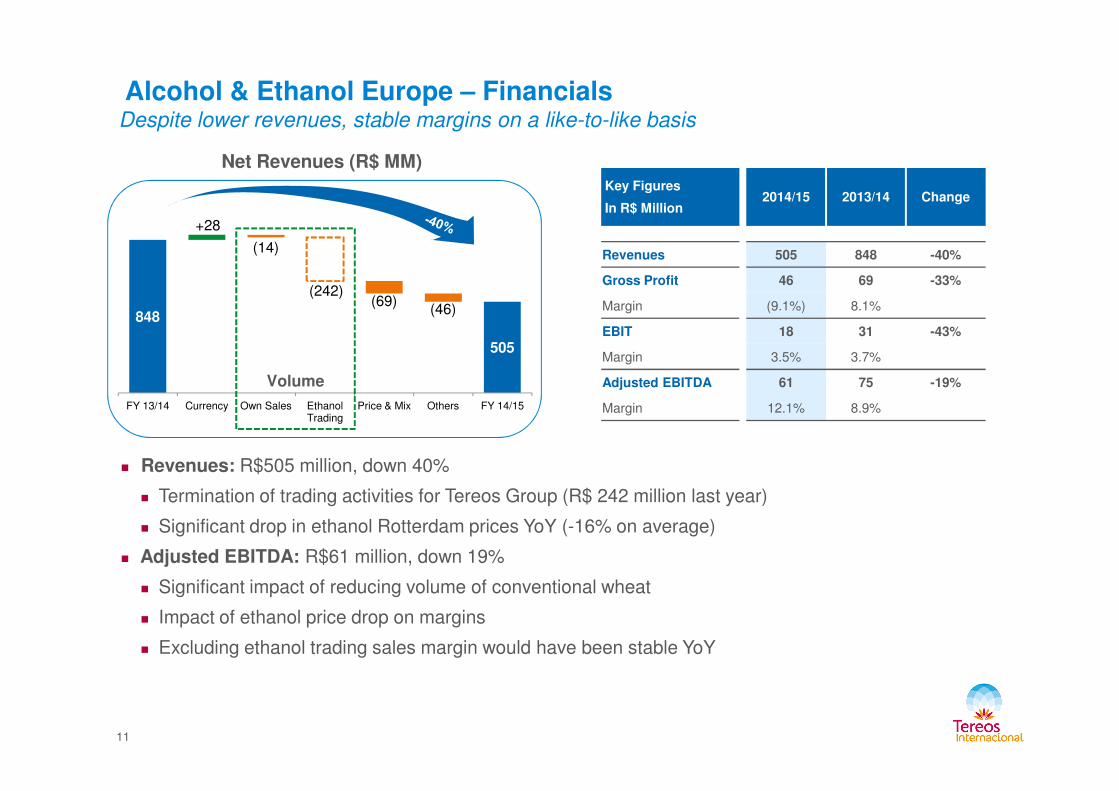
Alcohol & Ethanol Europe – FinancialsDespite lower revenues, stable margins on a like-to-like basis
Net Revenues (R$ MM)Key Figures
In R$ Million2014/15 2013/14 Change
Revenues 505 848 -40%
Gross Profit 46 69 -33%
Margin (9.1%) 8.1%
EBIT 18 31 -43%
Margin 3.5% 3.7%
Adjusted EBITDA 61 75 -19%
848
505
+28
(14)
(242)(69)
(46)
Volume
� Revenues: R$505 million, down 40%
� Termination of trading activities for Tereos Group (R$ 242 million last year)
� Significant drop in ethanol Rotterdam prices YoY (-16% on average)
� Adjusted EBITDA: R$61 million, down 19%
� Significant impact of reducing volume of conventional wheat
� Impact of ethanol price drop on margins
� Excluding ethanol trading sales margin would have been stable YoY
11
Margin 12.1% 8.9%FY 13/14 Currency Own Sales Ethanol Trading
Price & Mix Others FY 14/15
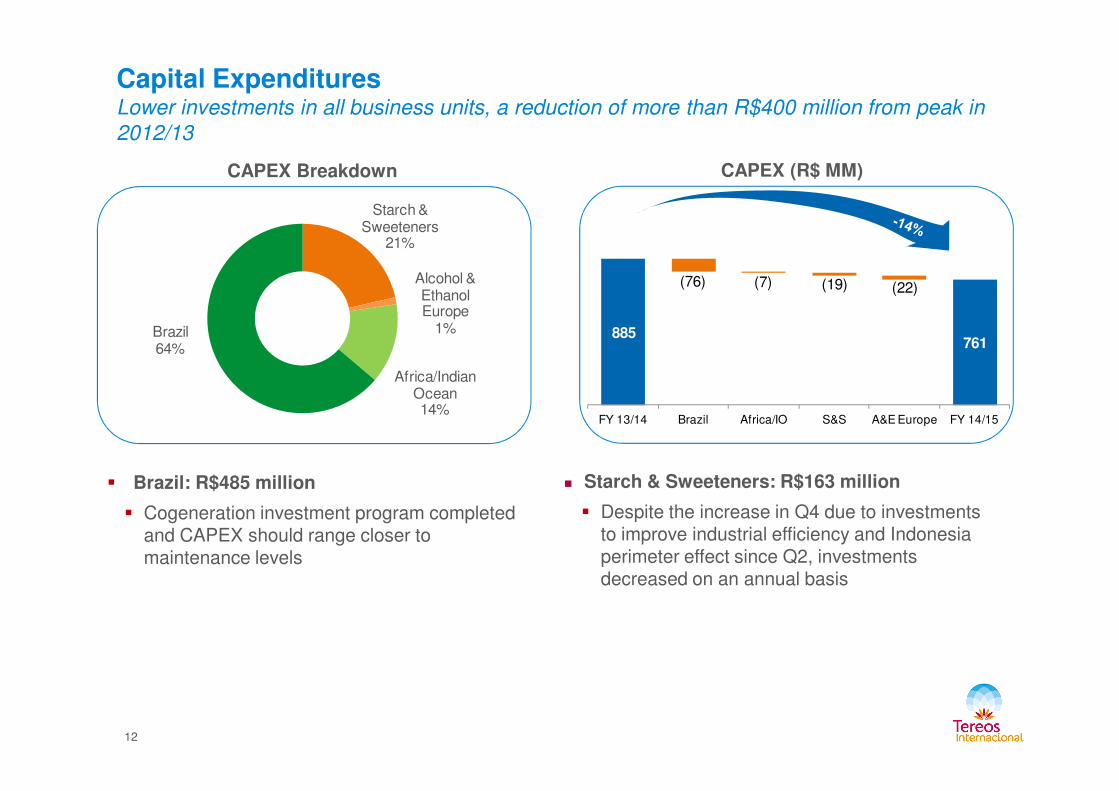
Capital ExpendituresLower investments in all business units, a reduction of more than R$400 million from peak in 2012/13
CAPEX (R$ MM)CAPEX Breakdown
Starch & Sweeteners
21%
Alcohol & Ethanol Europe
1%
Africa/Indian Ocean
Brazil64%
885761
(76) (7) (19) (22)
12
� Brazil: R$485 million
� Cogeneration investment program completed and CAPEX should range closer to maintenance levels
� Starch & Sweeteners: R$163 million
� Despite the increase in Q4 due to investments to improve industrial efficiency and Indonesia perimeter effect since Q2, investments decreased on an annual basis
Ocean14%
FY 13/14 Brazil Africa/IO S&S A&E Europe FY 14/15
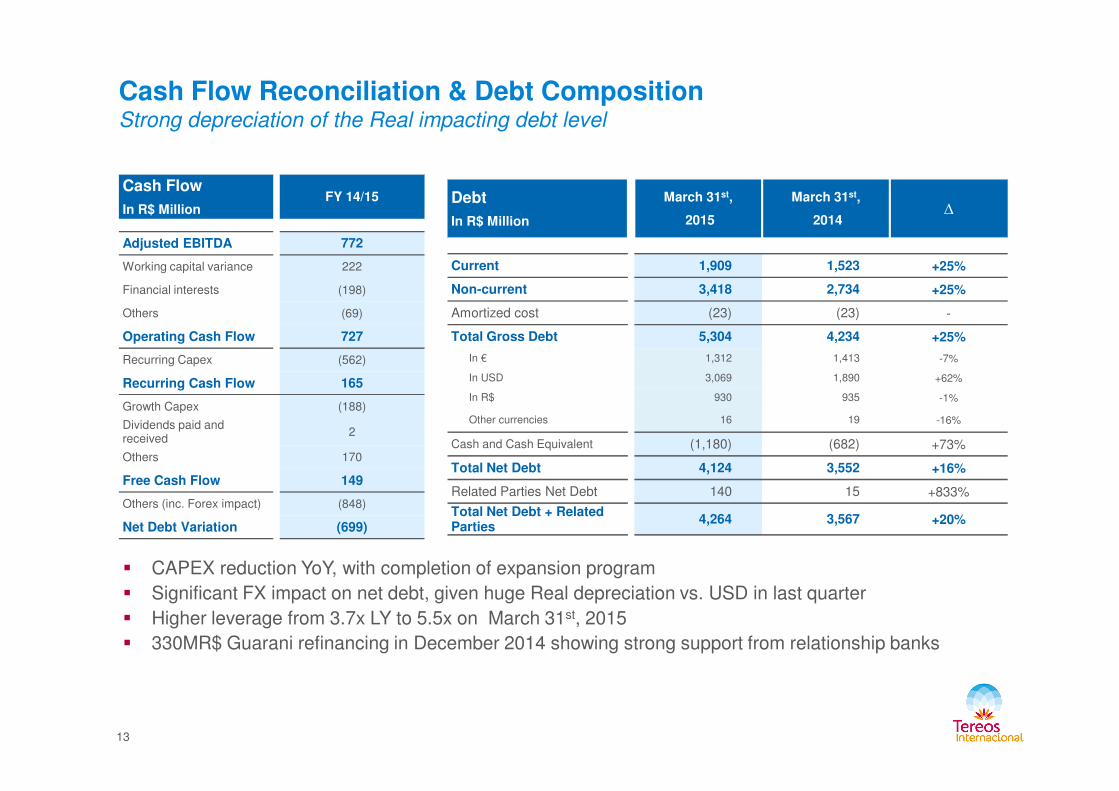
Cash Flow Reconciliation & Debt Composition Strong depreciation of the Real impacting debt level
Cash Flow
In R$ MillionFY 14/15
Adjusted EBITDA 772
Working capital variance 222
Financial interests (198)
Others (69)
Operating Cash Flow 727
Recurring Capex (562)
Recurring Cash Flow 165
Debt
In R$ Million
March 31st,
2015
March 31st,
2014∆
Current 1,909 1,523 +25%
Non-current 3,418 2,734 +25%
Amortized cost (23) (23) -
Total Gross Debt 5,304 4,234 +25%
In € 1,312 1,413 -7%
In USD 3,069 1,890 +62%
In R$ 930 935 -1%
13
� CAPEX reduction YoY, with completion of expansion program
� Significant FX impact on net debt, given huge Real depreciation vs. USD in last quarter
� Higher leverage from 3.7x LY to 5.5x on March 31st, 2015
� 330MR$ Guarani refinancing in December 2014 showing strong support from relationship banks
Growth Capex (188)
Dividends paid and received
2
Others 170
Free Cash Flow 149
Others (inc. Forex impact) (848)
Net Debt Variation (699)
In R$ 930 935 -1%
Other currencies 16 19 -16%
Cash and Cash Equivalent (1,180) (682) +73%
Total Net Debt 4,124 3,552 +16%
Related Parties Net Debt 140 15 +833%
Total Net Debt + Related Parties
4,264 3,567 +20%
Outlook
� Sugarcane Brazil:
� World sugar prices remain at depressed levels
� Ethanol demand expected to pick-up in recent government announcements (blend ratio, reintroduction of gasoline CIDE tax and VAT taxes in Minas Gerais state)
� Focus on industrial efficiency, notably through intercrop maintenance process improvement
� Cogeneration volumes to increase further as straw use is ramping-up
� Multi-year investment program in Brazil completed to keep Capex level close to maintenance
� Sugarcane Africa/Indian Ocean:
� Expectation of a similar crop for Indian Ocean while Africa should improve volumes on higher irrigated areas
Sharp drop of European sugar prices to impact export prices and continue to weigh on profitability
14
� Sharp drop of European sugar prices to impact export prices and continue to weigh on profitability
� Cereals:
� Europe:
� Economic environment to remain difficult; will limit profit recovery potential in the short term
� Efficiency plan “Performance 15” expanded to “Score 2018”
� Capex selectivity, focus on support of “Score 2018”
� International:
� Brazil: Continuous customer diversification, and focus on industrial performance optimization
� Indonesia: process improvements, in part thanks to increased automation, together with customer portfolioexpansion expected to benefit profit contribution

15