Software e Ingeniería de Sistemas e Ingeniería de Sistemas.pdf · in two parts: a Media...
42
Software e Ingeniería de Sistemas
Transcript of Software e Ingeniería de Sistemas e Ingeniería de Sistemas.pdf · in two parts: a Media...

Software e Ingeniería de Sistemas
291

A Hybrid Adaptation Model For Universal MultimediaAccess.
Roberto Soto BarreirosUniversidade de Vigo
ETS de Telecomunicación,Campus Lagoas-Marcosende36310 Vigo (Galicia), Spain
Manuel J. FernándezIglesias
Universidade de VigoETS de Telecomunicación,
Campus Lagoas-Marcosende36310 Vigo (Galicia), Spain
Luis E. Anido RifónUniversidade de Vigo
ETS de Telecomunicación,Campus Lagoas-Marcosende36310 Vigo (Galicia), [email protected]
ABSTRACTIn this paper we introduce an original model for Univer-sal Multimedia Adaptation (UMA) that blends together themost relevant state-of-the-art technologies and standards fordelivering multimedia content. The proposed model relieson the MPEG suit of multimedia standards to describe theusage environment and to dynamically define adaptive me-chanisms to condition content to existing network environ-ment constraints. It has a modular architecture that facili-tates its implementation in a broad portfolio of systems andcontent servers, and supports the delivery of dynamicallyadapted multimedia content, avoiding at the same time there-encoding of existing content according to each user’s pref-erences and profiles. Differently to other approaches thatinterrupt delivery and reinitiate the full adaptation processwhen the environment changes, the proposed system decidesdynamically which stream is more suitable according to ac-tual environment status, without interrupting the deliverybut reducing or increasing the video quality in real-time.This proposal also offers personalization, reduces the infor-mation exchange between server and client, and supports themanagement of different types of multimedia information.
KeywordsMPEG-DASH, MPEG-7, MPEG-21, Multimedia Adapta-tion, UMA.
1. INTRODUCTIONThe growing demand for multimedia content over hetero-
geneous networks, the continuous evolution of multimediatechnologies, the increasing variability in multimedia devicesand the improvements in network infrastructure generateda Babel of multimedia assets with different technical fea-tures. In this scenario, the delivery of multimedia contentin a way that it can be consumed by any user becomes acomplex task that has been addressed by several standards
like MPEG-21 [2], MPEG-7 [4] and MPEG-DASH [5].
Although existing solutions like the ones mentioned abovehave successfully addressed many of the challenges of multi-media delivery, they do not offer a complete solution to allpossible delivery situations, specifically when content hasto be dynamically adapted to cope with changing networkconditions, device properties or user characteristics. Someapproaches addressed multimedia adaptation for MPEG-21.For example, Jannach et. al. [6] introduced a system tointegrate reasoning techniques from Artificial Intelligenceto adapt multimedia content, and Lopez et. al. [7] pro-posed a model based on the constrains-satisfaction problemand MPEG-21 descriptions to discover the tools required todynamically adapt content. Others approaches addressedadaptation in the context of the MPEG-DASH standard.Sieber et. al [10] proposed a user-centric algorithm to in-crease playback quality and the efficiency of video delivery,while Cong Thang et. al. [12] introduced a mechanism toestimate the best posible user-perceived quality in a givensituation.
These approaches based on server-centric models did notaddressed the integration of the several MPEG standardsin the same solution. In dynamic contexts like state-of-the-art multimedia networks, MPEG-21 and MPEG-7 alone donot offer a satisfactory solution because their descriptionsare static and the mechanisms provided to update them donot support real-time adaptation. In this context, MPEG-DASH would be a better solution, because it supports dy-namic stream adaptation to cope with real-time changes indelivery conditions. However, MPEG-21 would still be themost appropriate solution to describe the multimedia con-tent and usage environment (UE), and therefore to selectthe original content according to user preferences or othersemantic descriptions supported by this standard. There-fore, to offer a complete adaptation solution that considersboth network status and user characteristics would be nece-ssary to introduce a new model that integrates both MPEGstandards in a single system.
In this paper we introduce an original model for Univer-sal Multimedia Adaptation (UMA) that blends together themost relevant state-of-the-art technologies and standards fordelivering multimedia content. Section 2 describes the maincharacteristics of the standards involved in the multimedia
292

delivery. Section 3, introduces the model proposed, whileSection 4 analyzes this model in several usage scenarios.Finally, some concluding remarks are provided, and someongoing research activities related to this proposal are enu-merated.
2. TECHNOLOGICAL BASE
This section introduces and discusses the most relevant tech-nologies and standards related to Universal Multimedia Ac-cess (UMA) [13], which will serve as the foundation to de-velop a new hybrid model for multimedia content delivery.First, we will focus our attention on the different representa-tion standards to describe the echnical and semantic featuresof multimedia content.
2.1 Multimedia Representation ApproachesTo deliver multimedia content in a correct way, a previousknowledge about multimedia features like spatial resolution,bit rate, languages, format and coding parameters becomesrelevant. The adequate selection of these parameters is re-quired to achieve the main objetives of UMA, that is, toprovide the best user experience and/or perceived quality.So, multimedia content delivery systems need technologiesor standards to describe the multimedia characteristics andusage environment (i.e., user profile, network status and de-vice features) to adapt the multimedia content to the actualdelivery conditions.
The MPEG group introduced the MPEG-7 standard as aresponse to UMA requirements. This standard provides arich set of tools to describe multimedia content data. Thesedescriptions support different granularity to offer the possi-bility to describe content at different levels and to provideoperational requirements like filtering, searching, indexing,classification or extraction of certain multimedia features.Note that this information does not depend on the actualmultimedia container or format, but it may be physicallyembedded in the multimedia content, in the same stream,in the same storage device or even obtained from an existingdescriptions’ repository.
To describe UEs and their related context, actions, resourcesand elements involved in multimedia delivery, the MPEGgroup introduced the MPEG-21 standard, which among otherfeatures defines the technology to support the exchange, ac-cess, consumption, trade and other types of multimedia de-livery in an efficient, transparent and interoperable way. Itsarchitecture is based on two concepts: the definition of aDigital Unit (DI), and the user interaction with this unit.Moreover, part 7 of MPEG-21 defines a new concept, namelythe digital items adaptation (DIA) framework. This newtechnology offers the necessary support to adapt DIs accor-ding to the usage environment, that is, this part defines aset of environment description tools to describe the mainentities involved in the multimedia delivery chain.
To sum up, the use of both standards supports the genera-tion of a full description of multimedia content assets, theactions to be performed with them, and their relation withother multimedia elements or collections of elements. Inother words, both standards put together can be used to de-
Media
Presentation
Period
Period
Start=100
...
...
Adaptation set 2
Video
Adaptation set 2
Representation
1
...
Representation
2
...
Representation
n
Representation 2
Bandwidth=5 Mbit/s
width = 1280
height =720
Segment 5
start=100s
http://.../
video1-5.mp4
...
Period
Period
Period
......
Figure 1: MPEG-DASH Data Model.
velop or integrate adaptation methods or processes to sup-port UMA.
2.2 Multimedia Streaming ProtocolThe MPEG group introduced the Dynamic Adaptive Strea-ming over HTTP (MPEG-DASH) protocol as alternative tothe RTP protocol and other streaming protocols. MPEG-DASH is a stateless (i.e., it does not require session man-agement) and dynamic protocol that is more effective whenstreaming is performed with large HTTP data chunks.Thisstandard is based on the combination of different media con-tent streams and a manifest file that identifies the most ap-propriate streams for any delivery situation. In the MPEG-DASH, multimedia content is made available on the severin two parts: a Media Presentation Description (MPD) anda collection of URLs identifying the actual content. MPDsdefine a collection of sequences of small HTTP segments, asdepicted in Fig. 1 and this entity describes available con-tent, its alternatives, their URLs and other characteristicsin a manifest file. Each HTTP sequence corresponds to ashort interval of playback time (a period) of the originalmultimedia content. These periods contain one or multipleadaptation sets that describe one or more representation ofa single stream.The representations may define one or morevideo or audio streams with different technical parameters,like different format coding or other alternatives.
Thus, MPEG-DASH requires several content alternativesto be available at the server to offer dynamically adaptedstreams, that is, several alternatives of the same multimediacontent are enumerated in the MPD, and then the DASHclients may select the best representation according to theactual status of the usage environment. This type of adap-tation is named client-side, because clients are responsiblefor selecting the correct representation.
2.3 Multimedia Representation StandardsThe increasing range of devices, user’ needs and associatedservices posed new challenges not addressed by standardslike MPEG-2 or MPEG-1. In respond to this situation, theMPEG group proposed the MPEG-4 suite, and more spe-cially its part 10 [3] or H.264/AVC.
This new representation of video data is more efficient thanprevious solutions, and has additional flexibility and cus-tomizability. MPEG-4 part 10 or AVC/H.264 was designedto represent video content through a video coding layer (VCL)
293

and a network abstraction layer (NAL) that provides formatto the VCL representation of a video asset, and the informa-tion required to facilitate storage or streaming in a varietyof networks. The NAL units were designed to support themapping of VCL data to transport it over RTP/IP or anyother real-time Internet service, file format or legacy MPEG-2 platforms.
The MPEG-4 part 10 suite defines a set of profiles and lev-els. These concepts specify conformance points to facilitatethe interoperability among implementations of this standardthat have similar functional requirements. Profiles define aset of coding tools and algorithms to generate a conform-ing bit stream, whereas levels specify constrains over keyparameters of the bit stream. However, besides the profileand level definitions, in most adaptation situations it is alsoneeded to re-encode the original multimedia content to sat-isfy the UE needs. Moreover, existing devices do not supportall profiles and levels. In other words, MPEG-4 part 10 pro-vides a dramatic improvement when compared to previousstandards, but lacks some key features to offer full supportto all possible delivery scenarios.
3. THE HYBRID MODELAlong the following paragraphs we describe the purpose
and objetives of an hybrid adaptation model for multimediacontent adaptation. This model corresponds to a layeredarchitecture to manage multimedia content and the descrip-tions associated to this content.
3.1 Purpose and ObjetivesThe introduction of the previous standards alleviates someof the challenges posed by the present-day heterogeneity ofUE. The MPEG group offers tools, technologies and codecstandards (cf. Sec 2), so any new model addressing this si-tuation shall use these technologies to provide an adaptationmechanism. On the other side, the MPEG suite (MPEG-7,MPEG-21 and MPEG-DASH) offers a great toolbox to ma-nage multimedia content, but it does not provide an archi-tecture or model, neither defines the methods and/or pro-cesses required to achieve the final objetives of UMA . More-over, these standards are generally integrated in a given sys-tem in an independent way.
Previous adaptation models and proposals provided eitherclient-side or sever-side adaptation, but the introduction ofMPEG-DASH and its combination with other standards inthe MPEG suite, enabled the context and tools to developa model that integrates both types of adaptation. As aninitial step, the system would adapt the existing streamsto generate new streams from the original ones to matchgeneral pre-defined UEs. In some cases, when the UE is di-fferent to the pre-defined ones, the system would adapt therequired streams to the new conditions. For this, MPEG-21and MPEG-7 are required as the integration of these stan-dards enables the tools and procedures to manage contentand personalize the streams according to UEs. Note thatthis type of descriptions are not supported by MPEG-DASHas it does not support all the semantic information requiredto find out which adaptation or adaptations are required ineach case. With this integration, the final system can beclassified among the ones providing server-side adaptation.
Content Server
MPD
Commands
Commands
Descriptions
Basic MPD
Decider Layer
Transport Layer
Content LayerManagement Layer
Descriptor Layer
Figure 2: Layered architecture of the model.
On the other side, MPEG-21 and MPEG-7 are not strea-ming protocols and do not directly tackle the delivery pro-cess. This aspect is addressed by MPEG-DASH. Indeed, itnot only provides a delivery protocol, but this standard alsooffers the mechanisms to dynamically adapt content for de-livery. To achieve this goal, this last standard communicatesthe streams available and their technical characteristics touser devices. With this information, the user device selectsthe best adaptation set or a variation thereof according to itsactual UE needs. From this point of view, the system pro-posed can be classified among the ones providing client-sideadaptation.
To sum up, our objetive is to integrate in the same systemboth types of adaptation to offer a hybrid solution address-ing the UMA goal: the adaptation of multimedia content toa dynamic usage environment.
3.2 The ModelTo develop the pursued mode and its functions and services,a language with sufficient expressive power to manage thecomplete adaptation process is required. In our case, theJava programming language was selected because it sup-ports both the specification of the model’s architecture, thedevelopment of its layers, access to content via any network,and native XML data binding. Fig. 2 provides a generaloverview of the architecture of this new model.
3.2.1 Content Layer
The content layer manages the different types of informa-tion in the system (i.e., media files, MPEG descriptions andMPD files). This layer does not contain any managementinformation, but only data and metadata for recovering, dis-covering and recording physical data.
The information managed by the system has different for-mats according to the several types of existing content. Inthe case of media content, AVC coding determines the mul-timedia format, so this type of data is stored according tothe MPEG-4 part 10 physical-layer description. In the cases(e.g., legacy content) when the new registered multimediacontent does not comply with this representation standard,the content layer transforms from the original multimediacontent to comply with the H.264/AVC standard.
294

decoder/
codec
Multimedia Content
Physical Storage
MPEG Descriptions(Users, Contents,
Devices, Networks)
adaptation
process
Description LayerTransport
Layer
Normalized Multimedia Content
(MPEG-4 AVC)
Multimedia Content
XML Descriptions(MPEG-21/7)
Figure 3: Content Layer.
Moreover, in all cases, the physical layer splits the streams tofacilitate the composition and/or future adaptation processand generates multimedia content from the original one withdefault spatial-temporal parameters (i.e., pre-adaptation pro-cess or off-line adaptation) according to pre-defined UEs.Most devices support H.264/AVC, the difference being in thetype of container implemented, so the choice of H.264/AVCavoids hard recoding and improves the system’s responsetime because in most real-world scenarios it only will berequired to re-encode the container format. In the caseof audio streams, the system has the capacity to decodeand encode the audio streams according to the devices’ re-quirements and users’ profile. The description files (i.e.,MPD files, media description files, user description files, net-work description files and device description files) are storedas XML files according to their respective standards (i.e.,MPEG-DASH, MPEG-7 and MPEG-21).
The implementation of the methods and functions are pro-grammed in Java. The information managed by this layeris encoded as XML files according their respective stan-dards. Note that Java natively supports XML files andbindings.This binding operation provides the mechanism totransform XML information in to Java clases for manipula-tion. This last service is provided by an Application Pro-grammer’s Interface named Java architecture for XML Bind-ing (JAXB, cf. Sect. 3.2.2 below) [8].
3.2.2 Descriptor Layer
To take correct adaptation decisions, the system must haveability to create, update and remove descriptions about me-dia content, users, devices and networks. These abilities areprovided by the descriptor layer. As discussed in section 2,this layer implements the MPEG-7 and MPEG-21 standardsto generate descriptions related to the application environ-ment and multimedia content (cf. Fig 4).
The media content registered in the system is automaticallydescribed by the descriptor layer through the MPEG-7 stan-dard, that is, this layer produces the required descriptionsand meta-information to support adapted multimedia con-tent delivery. Moreover, during the multimedia registrationprocess, this layer generates an initial MPD file with the ne-
Descriptor Layer
JAXB
Physical
Layer
Multimedia
Information(JAVA Class)
MPEG Descriptions(XML)
Enviroment DescriptionsMultimedia
Content
Enviroment Descriptions(JAVA Classes)
Figure 4: Descriptor Layer.
cessary stream information obtained from MPEG-7 informa-tion. As mentioned in section 3.2.1, the registration processgenerates several initial variations from the original sources.The information about these streams is also included in theinitial MPD.
This layer also implements the MPEG-21 standard to offersupport to create, update or remove descriptions about themain elements involved in delivering multimedia content.When the system registers new elements (e.g., users’ pro-files, networks or devices), the information received by thetransport layer (and processed by the management layer)is received by this layer in Java format class. Then, thedescriptor layer generates the required meta-information toadapt the content to final users according to this informa-tion.
Therefore, this layer offers services to the management layerto describe multimedia content and usage environments. More-over, the parsing of MPEG description files is implementedin this layer. When the management layer requests a MPEGdescription file, this layer parses the MPEG description filesand builds the classes and artifacts needed to manipulatemeta-information.
For managing XML files, the descriptor layer uses the classesgenerated by MPEG XML schema data binding operations.This technology enables the automation of XML schema’scustomizing mappings. XML schemas are mapped into Javaclasses or value classes that provide access to content via aset of access methods. JAXB offers an easy way to createand process XML documents compared to SAX or DOM [11].The conversion process creates a tree of elements of objectsthat represents the content and organization of the XMLdocument. Complex types are mapped into value classesand attribute declarations or elements with simple types aremapped into properties or fields with these value classes.JAXB converts the Java objects back into XML content.In this case, the Java methods are deployed as WSDL [14]operations and determine the schema components.
Finally, this layer does not fully implement the MPEG-21and MPEG-7 standards, because this model is focused onthe adaptation process and does not tackle other functionslike digital management rights, protection information and
295

Content Server
putContent(LocalPathContent)
saveDescripton(LocalPathContent, Description, MPD)
Descriptor Layer
Content LayerManagement LayerPut
Content
Multimedia Content
Information
getMultimediaInfo(LocalPathContent)
addContet(LocalPathContent,Content)
Figure 6: Management Layer in register mode.
other information not related to multimedia adaptation. Tosum up, the descriptor layer uses the services offered by thecontent layer to physically record, update and remove meta-information and offers a description service to the upperlayers.
3.2.3 Management LayerThe management layer orchestrates and manages a collec-tion of content servers hosting multimedia-adapted content.The services provided by the management layer are acces-sible through RestFul Web Services [9]. This layer can beconsidered a smart layer in the sense that it has the abil-ity to take correct decisions, actions or submit commandsto different layers to provide adapted multimedia contentaccording to any usage environment. The management layerimplements the logic required to manage media content files,description files, requests, searches and content indexing.
The management layer operates in two modes: request andregister mode. In request mode (cf. Fig. 5), the managementlayer generates actions and submits commands to deliver thebest-adapted multimedia content. In this scenario, the man-agement layer precesses the request and recovers though thedescription layer the required usage environment informa-tion (i.e., MPEG-7 and MPEG-21 descriptions) and the ap-propriate MPD descriptions. Then, the management layerlocates and indexes physical media content through URLsand submits this information to the decision layers.
In register mode, this layer generates the corresponding com-mands and submits them to the content and descriptionlayers. When a user or device is registered, the informa-tion received about the user profile, devices or networks isprocessed and submitted to the description layer in JSONform [1] format. In the case of content registration (cf.Fig 6), this layer initiates the storage process by submittinglocal path folder information to the content and descriptorlayers about where the piece of content will be stored. Then,the descriptor layer would generate appropriate descriptionrecords to be stored in the content server.
To avoid multiple copies of users’ profiles, network and de-vice descriptions in content servers, the management layeroffers query services on this information. To locate theservers that host this information, the content search and lo-cation service through URLs from MPEG-21 is used. There-fore, when a given server requieres this information, the localmanagement layer consults the information in its local copyof the MPEG-21 file to locate the appropriate server, and
then submits a request to that server’s management layer tofetch it. The server would process the obtained informationlocally. Moreover, each content server implements contentlocation and discovery through the MPEG-21 standard, soeach server may redirect media content request to the ap-propriate content server.
Once the content server has received a request and the man-agement layer has processed it, the decider layer receives theappropriate commands and description files to support thedelivery to the best-adapted multimedia content.
3.2.4 Decider LayerThe decider layer analyses the descriptions delivered by themanagement layer in Java class form.The UE descriptions(UEDs) and content descriptions are used to generarte apersonalized MPD. For instance, it would remove and au-dio stream because according to the user’s profile only onelanguage version is required (e.g. the English sound track)or it would discard a high-quality video stream according tothe actual network status.
In the other words, the decider layer receives the classeswith environment description information, processes this in-formation, and creates a new MPD with the most adequateparameters to stream multimedia content in a specific sce-nario. In some cases, the original multimedia registered con-tent needs to be adapted to UE to generate the personalizedMPD. In this case, the decider layer searches the best pathto adapt the content and initiates the adaptation processthrough the management layer according to those decisions.For this, this layer implements an algorithm that identifiesthe actual technical changes to be performed to some ofthe original content elements to satisfy the actual UE con-straints. During this decision process, the decider layer willnot only consider one multimedia variation, as the MPDincludes several multimedia variations with different para-meters that depend on the actual environment. As a con-sequence, the decider layer creates one optimal and severalsub-optimal variations of multimedia content to anticipatethe changes in the network’s status. This adaptation processis performed on the server side and prepares the content fordelivery.
To avoid re-encoding when the environment’s conditions change,the decider layer generates the personalized MPD with thestreams selected by the decider layer for this actual ses-sion. The integration of MPEG-DASH enables the contextto monitor the quality of service to take decisions and/oractions in real-time without interrupting the ongoing strea-ming process and corresponding user interactions. This mon-itoring mechanism is generally integrated in the DASH client,so this layer only enables client-side adaptations throughpersonalized MPD.
Finally, the decider layer initiates the adaptation or com-position processes according to the actual environment, andcreates an MPD including the relevant multimedia infor-mation in the MPEG-7/MPEG-21 descriptions and otherinformation about the environment.
The meta-information is reused in the different multimediadescriptions considered along the adaption process. First,
296

Get
Content
Content Server
getContent(Content)
getDescriptons(Content, User, Device)
Descriptor Layer
Content Layer
Usage Descriptions & MPD
Management Layer
Decider Layer
Classes and artifacts
Classes and artifacts
Transport Layer
Internet
User
Device
User Get
Content
Adapted
Data Content
Get Adapted
Data Content
Adapted
MPD
Adapted
MPD
Adapted
Data Content
Get
Content
Get Adapted
Data Content
Adapted
Data Content
(User,Device)
Adapted
MPD
Get Adapted
Data Content
Adapted
Data Content
Figure 5: Management Layer in request mode.
when new multimedia content is registered, the descriptionlayer collects the relevant information form the multimediawrapper’s header and creates an MPEG-21 file (includedMPEG-7 in) file. The description layer captures video codecdetails, audio codec streams, spatial resolution and audiochannels. This information, together with the UEDs, is usedto generate the optimal and sub-optimal adaptations. Then,the decider layer uses this information to analyze the envi-ronment and to take decisions considering the constraintsdescribed in the UEDs. Finally, the decider layer creates anMPD describing the multimedia adapted content. Thus, theMPD file will be a combination of the different parametersincluded in the UED descriptions that will eventually char-acterize the adapted multimedia content. The constraintsare primarily imposed by user and device descriptions, sothe spatial resolution, audio channels, audio language, videocodec or subtitles depend on these descriptions, which inturn will be used to set up the initial parameters to adaptthe multimedia content.
To sum up, this layer modifies an MPD description accor-ding to an actual environment and user’s profile, and gene-rates a new MPD description including the optimal optionsto deliver multimedia content in that specific situation. ThisMPD description is submitted to the transport layer to ini-tiate the actual media delivery process.
3.2.5 Transport LayerThe transport layer manages the transmission of multimediacontent. In this proposal, this layer receives MPD descrip-tions from the decider layer and sends the appropriate mul-timedia content to the MPEG-DASH client. In other words,when an MPEG-DASH client requests multimedia content,this layer provides access to adapted content through MPDdescriptions.
This layer does not implement the MPEG-DASH standard,but it only makes available to the MPEG-DASH client theoptimized MPD description and the corresponding adaptedmultimedia content. Moreover, this layer would not sig-nificantly increase the load of the content sever because itdoes not need to maintain session state information. Notethat MPEG-DASH is not a transmission protocol, so it doesnot drive the delivery of content, but only the definition ofMPD and segment information. However, it provides an en-abler for the efficient and high-quality delivery of multime-dia streams on top of the HTTP layer. This latter protocolprovides transport services for most real-world situations,including mobile environments.
Table 4: Nerworks.Type ADSL 3GMax. Capacity 20.0 Mb/s 14.4 Mb/sMin. Guaranteed 1.00 Mb/s 0.72 Mb/s
Table 5: Scenarios.Scenario User Device Network
A 1 1 1A 2 2 2A 3 3 1
4. DISCUSSION
In the previous sections, we described the architecture of thehybrid model, its interlayer relationships and the standardfunctions implemented. In this section, we discuss the be-nefits of this model with a usage example. This example isbased on the adaptation of a video asset (cf. Table 1) tobe consumed by three registered users with different profiles(cf. Table 2) and three different devices (cf, Table 3.)
As discussed along the previous sections, the first step per-formed would be the registration of multimedia content.During the registration process, multimedia information likevideo, audio codecs and streams, available languages andsubtitles, spatial resolution, frame rates, bit rates and videoprofiles is analyzed. With this information, the system in-dividually extracts the different streams that compose themultimedia file, and in the case of a video stream, the systemre-encodes it according to MPEG-4 part 10 standard. In thisoperation, the system generates a several video streams toadapt the content to pre-defined scenarios according to net-work features with normalized spatial resolution and diffe-rent bit rates: 1080p, 720p and 640p. With this offline adap-tation, the system tries to avoid re-encoding in most popularscenarios. This operation is managed by the managementlayer and executed by the physical layer (cf. Sect. 3.2.1).Concurrently, the descriptor layer analyses the multimediainformation and describes the information of the generatedstreams according to the MPEG-21 standard.
Unfortunately, the characterization just discussed is not pro-vided in present-day delivery systems. As a consequence,when it is necessary to take decisions about how to delivercontent and which delivery format is most adequate accor-
297

Table 1: Example Content asset.Feature Value Feature Value Feature ValueMedia Audio-Visual Audio language English Audio language SpanishFile format MOV Audio codec Apple Lossless Audio language Apple LosslessBit rate 4479 kbps Audio bit rate 791 kbps Audio bit rate 791 kbpsVideo codec AVC Sample rate 48 Khz Sample rate 48 KhzSpatial resolution 1920x1080 Audio channels 2 Audio channels 2Frame rate 23,976 fps Subtitles English Subtitles SpanishVideo bit rate 2893 kbps
Table 2: Users.User 1 User 2 User 3
Feature Value Feature Value Feature ValueNative Language English Audio Language Spanish Audio Language GermanSecond Language Japanese Audio Codec English Audio Language Japanese
ding to the actual environment, state-of-the-art systems donot have the required capabilities to accomplish this task.With the integration of MPEG-21 and MPEG-7, this hy-brid model is similar to other server-side centric systems (cf.Sect. 1), that is, this system has the ability to personalizethe video streams, manage semantic information and UEDs.This adaptation approach, in this sense, it can considered aknowledge-based server-side adaptation.
The three scenarios in this example are (cf. Table 5): sce-nario A including user 1, device 1 and network 1; scenarioB including user 2, device 2 and network 2; and scenarioC including user 3 device 3 network 1. In scenario A, user1 will not encounter any problem to consume the contentasset because neither the device’s profile, user’s profile ornetwork’s profile impose severe constraints. So, the deciderwould adapt the content to anticipate any future networkchanges, that is, with the information about the UED, thedecider selects the predefined adaptation with spatial reso-lution 720p and 640p, and creates an MPD with these videostreams and an audio stream compliant to the Apple lossescodec. The second audio stream and subtitle streams arenot required to be delivered to user A because they do notprovide andy benefit to that user. In this example, the de-cider shows how to personalize the delivery content througha personalized MPD. Moreover, the system shows the bene-fits of a server-side adaptation as it tries to select the bestcontent variations from pre-adapted content, but in the casethat pre-defined adaptation is not suitable, the decider se-lects the stream more suitable to adapt it according to theactual UE and generates the optimal stream for this case andalso creates the personalized MPD. With this approach, thesystem has the benefits of client-side adaptation (supportedby MPEG-DASH) and server-side adaptation (supported byMPEG-21/MPEG-7). If the network status changes, thesystem does not need to re-encode or reinitiate the decisionprocess as the DASH client that received the personalizedMPD will manage the adaptation process by selecting eachperiod defined in the MPD according to the changes in net-work status.
Scenarios B and C have some additional problems to solve.In scenario B, the default language, spatial resolution andaudio codec are not suitable to the requirements of user
and device. In this case, the decider will take decisions totransform content to the best suitable for this environment’sneeds. The decider integrates a knowledge-based algorithm,in which the inputs are the predefined adaptation and theoutput is an optimal solution. The UED set the constraintsto satisfy. In scenario B, the optimal content is a multi-media asset including two streams: video and Spanish au-dio. The decider would not adapt the spatial resolution, butmultimedia content wrapper and audio codec are adaptedaccording to user’s device (ACC codec). Moreover, the de-cider includes the sub-optimal decisions, that is, selects thepre-defined adaptions with reduced spatial and temporal res-olution (pre-defined adaptation with spatial resolution 720pand 640p) but with the correct wrapper and audio codec.With this adaptations, the decider composes the personali-zed MPD.
In scenario C, the decider would take similar decisions toScenario B, but the optimal decision corresponds to a multi-media content asset including three streams: video, Englishaudio and German subtitles. In this case, the German audioand subtitles are not available, so the decider composes themultimedia content including the English audio and subti-tles because the algorithm try to deliver the content as sim-ilar as the original content. The adaption process is similarto Scenario B, but the decider composes the personalizedMPD with optimal solution and pre-defined adaption withreduced spatial and temporal resolution, English AAC audiocodec and English subtitles.
5. CONCLUSIONSWe have introduced a hybrid model to alleviate and over-come the usage environment constraints of multimedia con-tent distribution. This model has a modular architecturethat facilitates its implementation in a broad portfolio ofsystems and content servers, and supports the delivery ofdynamically adapted multimedia content, avoiding at thesame time the re-encoding of existing content according toeach user’s preferences and profiles.
This model relies on the MPEG suit of multimedia stan-dards to describe the usage environment, and on MPEG-DASH to dynamically define adaptive mechanisms to con-dition content to existing network environment constraints.
298

Table 3: Devices.Type Smartphone (Samsung S3) Smart TV (Philips pfl8685h) Computer (IMac mid’11)Max. video rate 3500kbps 5000 kpbs 6000 kpbsAvg. audio rate 320 kbps 320 kbps 320 kbpsSpatial resolution 1280x720 1920x1080 2560x1440Video codec AVC/H.264 / H.263 AVC/H.264 AVC/H.264/H.263Audio codec AAC, MP3 AAC, MP3 AAC, MP3Audio channels 2 2 2
The benefits of this hybrid adaptation model include its re-duced response time and the use of predefined adaptationsto simplify the adaptation process in spatial and temporalaspects. This model’s server-side architecture for contentadaptation to user and device characteristics makes it to beless constrained by the processing power available for con-tent processing and therefore provides better response whencompared to client-side adaptation. Moreover, the systemalso provices dynamic client-side adaption to changing net-work conditions through MPEG-DASH integration. Whencompared to other sever-side models like [6] or [7], this modeloffers similar performance but supports dynamic client-sideadaptation, which is not available in the referenced models.In cases that the UEs status changes, these systems reiniti-ate the full adaptation process, stopping the actual deliveryprocess. This dramatically affects user experience. In ourcase, the client side decides dynamically which stream ismore suitable for each period (defined by MPD) accordingto actual UE status, without interrupting the delivery butreducing or increasing the video quality defined by the de-cider in the personalized MPD. In comparison to client-sideadaptation, the hybrid model offers personalization, reducesthe information exchange between server and client, sup-ports the management of different types of information (i.e.,semantic, technical, etc.), and offers additional capabilitiesto adapt multimedia content.
The authors are presently working on improving the integra-tion of the SVC standard in the model, and on the develop-ment of tools to generate MPD files with different time gran-ularities, that is, on the generation of MPD files includingdifferent periods that integrate several video streams withdifferent spatial and temporal resolutions and several audiostreams with different qualities per period. In the same line,we are also considering the development of tools to supportSVC granularity in each MPEG-DASH period, and the de-velopment of decoders supporting time granularity in user’sdevices.
6. ACKNOWLEDGMENTSThe work presented in this article is partially funded byGradiant (Centro de Telecomunicacions de Galiza) throughgrant 10SEC001CT (Consellerıa de Economıa e Industria,Regional Government of Galicia, Spain). The content ofthis paper is the sole responsibility of its authors and itdoes not represent the opinion of the Galician Government,which is not responsible of any use that might be made ofthe information contained herein.
7. REFERENCES[1] Introducing JSON. http://www.json.org. Accessed
4/13/2014.
[2] ISO/EIC JTC1/SC29/WG11 N5231. MPEG-21overview v.5. 2002.
[3] ISO/IEC 14496-10. Information technology – codingof audio-visual objects – part 10: Advanced videocoding. International Organization for Standardization(ISO), 2005.
[4] ISO/IEC 15938-5. Multimedia content descriptioninterface (MPEG-7) – part 5: Multimedia descriptionschemes. International Organization forStandardization (ISO), 2003.
[5] ISO/IEC 23009-1. Information technology – dynamicadaptive streaming over HTTP (DASH)– part 1:Media presentation description. InternationalOrganization for Standardization (ISO), 2012.
[6] D. Jannach, K. Leopold, C. Timmerer, andH. Hellwagner. A knowledge-based framework formultimedia adaptation. Applied Intelligence,24(2):109–125, Apr. 2006.
[7] F. Lopez, J. M. Martınez, and V. Valdes. Multimediacontent adaptation within the cain framework viaconstraints satisfaction and optimization. InProceedings of the 4th International Conference onAdaptive Multimedia Retrieval: User, Context, andFeedback, AMR’06, pages 149–163, Berlin, Heidelberg,2007. Springer-Verlag.
[8] Oracle Corporation. Java Architecture for XMLBinding (JAXB). Oracle Corporation, 2005.
[9] Richardson L. and Ruby S. RESTful Web Services.O’Reilly Media, May 2007.
[10] C. Sieber, T. Hossfeld, T. Zinner, P. Tran-Gia, andC. Timmerer. Implementation and user-centriccomparison of a novel adaptation logic for dash withsvc. In Integrated Network Management (IM 2013),2013 IFIP/IEEE International Symposium on, pages1318–1323, May 2013.
[11] F. Simeoni, D. Lievens, R. Conn, and P. Mangh.Language bindings to xml. Internet Computing, IEEE,7(1):19–27, Jan 2003.
[12] T. C. Thang, J.-W. Kang, and A. Pham.Quality-guided adaptivity for audiovisual contentstreaming by mpeg dash. In Consumer Electronics(ICCE), 2012 IEEE International Conference on,pages 94–95, Jan 2012.
[13] A. Vetro, C. Chistopoulos, and T. Ebahimi. Iuniversalmultimedia access (special issue). In IEEE SignalProccesing Magazine, volume 20, March 2003.
[14] Web Services Description Language.http://www.w3.org/TR/wsdl. Accessed 4/13/2014.
299

Mashup Architecture for Connecting Graphical LinuxApplications Using a Software Bus
Mohamed-IkbelBoulabiarLab-STICC
Telecom Bretagne, Francemohamed.boulabiar
@telecom-bretagne.eu
Gilles CoppinLab-STICC
Telecom Bretagne, Francegilles.coppin
@telecom-bretagne.eu
Franck PoirierLab-STICC
University of Bretagne-Sud,France
ABSTRACT
Although UNIX commands are simple, they can be com-bined to accomplish complex tasks by piping the output ofone command, into another’s input. With the invasion ofGUI applications, we have lost this ability to chain manysmall tools in order to accomplish a composite task or thepossibility to script applications. As such we have becomeimprisoned into the interface as designed by the developer.Most applications are also designed to be used through akeyboard and a mouse even if the user has newer inputdevices. In this paper, we demonstrate how we can re-move most of these limits and provide the possibility toscript, adapt and automate GUI applications using a soft-ware bus in a Linux operating system. We provide imple-mented proof-of-concept cases in addition to conceptual sce-narios showing the possibilities arising from the approach.
Categories and Subject Descriptors
H.5.2 [Information interfaces and presentation]: UserInterfaces; I.3.6 [Computer Graphics]: Methodology andTechniques
Keywords
Operating system, interaction, architecture, post-wimp, fac-torization, automation
1. INTRODUCTIONThe UNIX operating system has introduced the success-
ful concept of building all the system experience by usingsmall command-line tools which can be connected togetherthrough pipes. Unfortunately, this concept of “do one thingand do it well” is only available through the console and cannot be applied to the GUI applications which have becomemore complex in each iteration. These applications are ac-tually used as separated islands. They have some similar
Permission to make digital or hard copies of all or part of this work forpersonal or classroom use is granted without fee provided that copies arenot made or distributed for profit or commercial advantage and that copiesbear this notice and the full citation on the first page. To copy otherwise, torepublish, to post on servers or to redistribute to lists, requires prior specificpermission and/or a fee.Interaccion ’14 Puerto de la Cruz. Tenerife. SpainCopyright 2014 ACM X-XXXXX-XX-X/XX/XX ...$15.00.
functionalities and with different and redundant implemen-tations that forced special users as designers to use a hugelist of tools in order to accomplish a bigger task. In thispaper we are trying to solve the problem of GUI applicationcomplexity, inability of the reuse of specific functionalities,and inflexibility by introducing a new concept of commu-nicating between the GUI applications, and describing sce-narios that show the importance of such a mechanism. Thescenarios we are exposing show numerous cases where thepossibilities exceed the communication with a single appli-cation.
Our contribution mainly lies in the use of a software bus toensure the applications connection and the ideation of newscenarios offered by this technique. Scenarios are a groundpoint to rethink how application could be architected in acommon open source platform like Linux and evaluate theapproach by enumerating and testing the feasibility of sce-narios. We target creative tools and graphical design soft-ware used mainly by designers, novice or advanced. First,we start by presenting the concept of reducing the use ofcreative applications to their canvas and presenting the rea-sons which led to such a decision. Then we start presentingscenarios sorted in terms of complexity.
2. APPLICATIONS AS CANVAS
2.1 Definition of a Software BusA Software Bus is an inter-process communication system
which allows different applications to connect to a sharedchannel and then communicate information or invoke dis-tant method calls. In the case of Linux systems, D-Bus isused to facilitate the communication of three message types:method calls, signals and properties. It is possible to call amethod in a remote application, subscribe to signals eventsemitted or read variable properties shared on the bus. As de-fined by the standard, each application has an address and alist of methods which can be introspected by any applicationreading from the bus. The choice of D-Bus is suggested bythe number of tools, libraries and applications that alreadysupport it.
2.2 Previous and Related workWhen Linux developers have finished the work on support-
ing multi-touch events inside Linux kernel, they faced theproblem of modifying a big list of software libraries and lay-ers to support the event routing between the kernel and theapplication. A faster solution developed was Ginn, which
300

is a Linux daemon that transforms multi-touch events intokeyboard taps and mouse clicks. The transformation rulesnamed “wishes”, are loaded depending on the applicationcurrently in focus. The concept of transforming input eventsis similar to the one of the iCon project by Dragicevic [5].A small piece of code enabled legacy applications to havea feeling that they react to the new events, without mod-ifying the code of the legacy applications or soliciting thedevelopers to do so. Ginn proposed a solution to adapt oldapplications to new ways of interaction, but it still needsto have the application in focus, and the old interface inwhich events are injected. From this case, we felt the im-portance of including pieces allowing applications to evolvein the future to support new means of interaction as referredby Chatty [4] than keyboard and mouse events. Ginn coulddo a better job if it were able to trigger, by a certain rule orwish, an internal function of the application. In this case, itwould bypass the proposed GUI interface and only need theapplication canvas where the command response is shown asthe case in Figure 1.
Figure 1: Connecting hand palm angle rotation
events to control the movement of boxes inside
inkscape, no modification to the target application
code is needed
2.3 Reducing applications into their canvasGUI applications have eliminated the need to memorize
commands in order to accomplish tasks. Meanwhile, theyhave removed the possibility of scripting and intercommu-nication. Some attempts have tried to use software buseslike TUIO [6] and IvyBus [3]. In the first case to transportinput events which are more complex than the one stan-dardized in the operating system, and in the second caseto communicate between application to transport a generictype of information. Olivo et al. [8] have pointed out thisproblem while trying to handle multi-touch events, but usednetwork protocols. That does not completely solve the prob-lem, especially when many applications do not use the sameplatform standard. We also present how we can reduce thedictatorship of the applications interface on what the useris able to do. This is different of what has been done byStuerzlinger et al. [9] by trying to innovate at the interfacelevel in order to reach the same goal. Minimizing the role ofmost of the applications into a visualization canvas of whatis being done by accessing its internal functionalities from asoftware bus. It can also simplify the application migration
into a new post-wimp paradigm because we will only needto connect new input events into these internal methods andneed the canvas only for feedback. Contrary to model-view-controller pattern where frontiers of a single application areknown, we are addressing a platform with multiple appli-cations that can be used on multiple devices which is notlimited to original developers intended use. In most of theupcoming scenarios, we target the vector drawing applica-tion Inkscape and show what are the new possibilities arisingfrom it.
3. SCENARIOS
3.1 Scripting GUI ApplicationsGraphical applications can only be used through their in-
terface, and using the input devices supported. When wewant to handle a complex manipulation we are stuck in re-peating input actions, especially when developers have notprovided neither a macro recorder nor an app-internal script-ing API like VBA or Gimp PDB (Procedural DataBase).Some of the solutions to this problem is to use an externaldaemon for input record and replay, or more complex oneslike MIT Sikuli [10] use computer vision to detect the posi-tion of graphical interface elements then generates clicks onthem. Using computer vision for such operation means thatwe still need the graphical interface on the screen. This ismore like a hack than a permanent solution, as the interfacecan change anytime between versions. In our case, by ac-cessing the application methods exposed on a standardizedsoftware bus, we are able to script all needed actions using asimple python script executed from the outside of the appli-cation itself which is then transformed into a visualizationcanvas.
3.2 Interactive ProgrammingWhen we script application as we discussed, we also have
the possibility to combine useful scripts, make them config-urable and create a GUI for them. By taking the exampleof a drawing application like Inkscape, the application is di-vided into a canvas, where elements are drawn, and a defaultuser interface. We can use floating windows in the same wayof Magic Lenses by Bier et al. [2] to add a new functional-ity to the application. The floating windows will internallycontain a script to handle an object inside Inkscape as in Fig-ure 3. The window can use sliders to configure the values todraw a complex shape, and generate the DBus commandsin order to stream them to the application. From simpleapplication methods like “draw line” or “draw circle ”, wecan write external plug-ins able to draw any shape. Theywill communicate with Inkscape using the software bus, de-veloped in any selected language and are solely limited bythe imagination of this plug-in developer.
Figure 2: Implementation of an interactive geomet-
ric shapes drawing. The user can select a value
and visualize the change instantly on Inkscape while
moving the slider.
301

This new way of adding features to applications is verygeneric in terms of the programming language used or whatis possible to, and can force the application to behave innewer ways. Figure 2 shows the use of C++ or python lan-guages to add interactivity. For example we can make adrawing application to behave as a plotting tool by read-ing values from a file and transforming them into drawingcommands to the app. We have even created an animatedvisualization by using the “move” method on a graphicalelement inside the plug-in internal loop which can export aframe each time then combined to create an video. Inkscapegained the animation ability just by plugging an external ap-plication that is based on its methods and compose them tocreate a new environment.
Figure 3: Implementation of a“magic lens”example.
The completely separated application has a semi-
transparent window and can modify the elements
color in Inkscape
3.3 Factorization of applications developmentIn the previous example, we reached the level where we
can make a normal application behave in new ways just byusing external plug-ins that do not depend on the providedinterface. This means that the important part of the ap-plication is changed. What are the limits if we push thisconcept into a new level by completely removing the defaultinterface and providing new ones?
Any designer use many tools to create a mock-up or ananimation. Tools he uses do not always come from a sin-gle company. Thus he needs to learn to use the interface ofeach of them. A beginner will find that these tools do notshare the same icons, the same interaction design, even thesame positioning of toolbar elements which is a problem ofinconsistency in the actor platform. This problem can besolved when the developer of a platform can access inter-nal functions through the installed software and provide byhimself an interface which contain the same set of icons andbased on a the same interaction design. And such an ac-cess can be done using a software bus between applications.We are proposing a resolution of a single platform incon-sistency. But nowadays, applications now can be run onmobile phones, tablets, desktop computers and TVs. Evenif the applications type can differ from one device to another,we still have a common space of functionalities used. In or-der to target all of these devices, a typical developer wouldcreate an application for each of them, with the proper in-
terface and interaction, compile it and release a new versionfor each device. The problem here is that a lot of workand multiple skills from development to design are needed.When the person porting an application to another deviceis different, it becomes sometimes difficult to convince themain developer to create a new interface. This scenario ap-plies the two levels of separation: Core functionalities in-cluding a visualization canvas, and a superposed interface.The core exports the internal functionalities into a softwarebus, and the interface connects to that bus, loads a selectedinterface and a “functionalities matching process” depend-ing on the device. This concept is represented by Figure 4.The interfaces are created by main platform developers andthe intellection will move from application level to platformlevel. The amount of work needed to adapt the applicationto a new device or modality is reduced to the creation of theinterface and the matching. The core application role willbe to show a canvas, and to export its internal methods intothe bus. Here in addition to the proposed inconsistency res-olution for single and multiple platform, we have factorizedthe application development into core functionalities whichaccelerate the development, and factorized also the interac-tion design which will be made by the designer for all theplatforms. The link between the two layers is a componentthat matches the interaction to the functionality. Think-ing about the platform and not the application itself, canpush the thoughts into the solution of showing the canvas ofthe same application through many connected devices andbeing able to modify elements at the same time using thecomputer, the tablet and the phone, do part of the workon a device and finish it using another one. Events will behandled in each device and transformed into DBus methodcalls.
Figure 4: Concept of multi-device application de-
velopment where the application will provide only
a drawing canvas and export its functions through
the bus
3.4 Applications ComposerIn a platform where many applications get their inter-
nal methods exported and handled with the same way ofthinking, we need a tool that is able to connect to any inter-nal method of a chosen target application. Then run morecomplex tasks than what is provided by a single applica-tion. This tool capable for example to open a file insidean application as the “open file” is an exported method, ap-ply operations on it and save it in a external file. Then,after completing with the first application, open these in
302

a new one and so on. This tool will make GUI applica-tion as powerful as UNIX command line tools with a lotmore possibilities. Since it looks like Apple Quartz Com-poser, but using applications as building blocks, let’s callit “Applications Composer”. This concept enables applica-tions scripting, and simplifies complex tasks for the user. Itreduces the meaning of having many alternative tools to dothe same task inside a platform. If we have many drawingapplications that do almost the same thing, the composerinterface eclipses these applications the way of independentunits they used to be. A simple user who wants to accom-plish a task will load a script, provide the input files andget the output, with no need to look at how this is donein details and what applications will be used in the chain.Some developers can even develop small applications withno interface and no significance when used alone, but thatare here to fill the gap when used inside the composer. Weare speaking about interaction with application using tools,without being limited to a specific interface this is a wayto rethink the interaction in a platform as multi-device andmulti-application, but single interaction design [1].
3.5 Interactive DocumentationThe current way to create a documentation for a GUI
application is either to write textual tutorials accompaniedwith pictures of the buttons where to click, screen-shots ofthe application windows, or to record a video of the authorusing the application directly. In both ways, the learninguser should switch between the textual or video tutorial andthe real application many times and to follow step by stepwhat is shown. The switching is intensive and the user caneasily lose focus and get lost as described by Laput et al. [7]Using the core model of a software bus, documentation canbe built independently of the type of the current interfacevisible to the user, but on the core functions of the applica-tion instead. We have newer way to create documentationwith DBus. For example, we can invoke an action, and wecan also detect when a user does a specific step in a tu-torial using signals. These can be used to show a part ofthe tutorial and go to the next step only when the user hasdone the previous required work. Using transparent win-dows, the user will no more switch between the applicationhe is learning and the tutorial. The latter will be shown ontop of the application step at-a-once that can even be writ-ten inside the learning document for a drawing application.Using this scenario, we have removed the switch betweenan application and its tutorial. The old forms of documen-tation can still be generated using a screen-shot taking orvideo recording script and will take into account the currentinterface according to the platform.
4. CONCLUSION AND LIMITSIn this paper we have presented many scenarios showing
how the export of an application’s internal methods can bebeneficial for new platform design possibilities. Using thesame concept we have also proposed solutions for problemslike inconsistency in the interface and interactions of a plat-form. It also addresses the reduction of development time,multi-device deployment, unification of the documentationsystem. A side effect of our approach is the reducibility ofcreative creation GUI applications into their bare canvas.We have explained how this brings better interactions withcomputers for the developer who will write less code, as well
as for the user who will get his task accomplished by writingsmall scripts. Developers do not want their tools eclipsedand hidden below a platform made, application composer.This also leads to the use of their applications in new, un-intended way, which needs some standardization efforts likethe MPRIS for video players.
5. REFERENCES[1] M. Beaudouin-Lafon. Designing interaction, not
interfaces. In Proceedings of the Working Conferenceon Advanced Visual Interfaces, AVI ’04, pages 15–22,New York, NY, USA, 2004. ACM.
[2] E. A. Bier, M. C. Stone, K. Pier, W. Buxton, andT. D. DeRose. Toolglass and magic lenses: Thesee-through interface. In Proceedings of the 20thAnnual Conference on Computer Graphics andInteractive Techniques, SIGGRAPH ’93, pages 73–80,New York, NY, USA, 1993. ACM.
[3] M. Buisson, A. Bustico, S. Chatty, F.-R. Colin,Y. Jestin, S. Maury, C. Mertz, and P. Truillet. Ivy: Unbus logiciel au service du developpement de prototypesde systemes interactifs. In Proceedings of the 14thFrench-speaking Conference on Human-computerInteraction (Conference Francophone SurL’Interaction Homme-Machine), IHM ’02, pages223–226, New York, NY, USA, 2002. ACM.
[4] S. Chatty, A. Lemort, and S. Vales. Multiple inputsupport in a model-based interaction framework. InHorizontal Interactive Human-Computer Systems,2007. TABLETOP ’07. Second Annual IEEEInternational Workshop on, pages 179–186, Oct 2007.
[5] P. Dragicevic and J.-D. Fekete. Support for inputadaptability in the icon toolkit. In Proceedings of the6th International Conference on MultimodalInterfaces, ICMI ’04, pages 212–219, New York, NY,USA, 2004. ACM.
[6] M. Kaltenbrunner, T. Bovermann, R. Bencina, andE. Costanza. Tuio: A protocol for table-top tangibleuser interfaces. In Proc. of the The 6th IntaAZlWorkshop on Gesture in Human-Computer Interactionand Simulation, 2005.
[7] G. Laput, E. Adar, M. Dontcheva, and W. Li.Tutorial-based interfaces for cloud-enabledapplications. In Proceedings of the 25th Annual ACMSymposium on User Interface Software andTechnology, UIST ’12, pages 113–122, New York, NY,USA, 2012. ACM.
[8] P. Olivo, D. Marchal, and N. Roussel. Softwarerequirements for a (more) manageable multi-touchecosystem. In EICS 2011 Workshop on EngineeringPatterns for Multi-Touch Interfaces, 2011.
[9] W. Stuerzlinger, O. Chapuis, D. Phillips, andN. Roussel. User interface facades: Towards fullyadaptable user interfaces. In Proceedings of the 19thAnnual ACM Symposium on User Interface Softwareand Technology, UIST ’06, pages 309–318, New York,NY, USA, 2006. ACM.
[10] T. Yeh, T.-H. Chang, and R. C. Miller. Sikuli: Usinggui screenshots for search and automation. InProceedings of the 22Nd Annual ACM Symposium onUser Interface Software and Technology, UIST ’09,pages 183–192, New York, NY, USA, 2009. ACM.
303

Semantic Web End-User Tasks
Alfons Palacios1,2 1Escola Superior Politècnica
TecnoCampus Mataró-Maresme (Universitat Pompeu Fabra)
Av. Ernest Lluch 32 (Porta Laietana) E-08302 Mataró, Spain
Telephone +34 169 65 01 FAX +34 169 65 05
Roberto García2 2Universitat de Lleida,
Jaume II 69, E-25001 Lleida, Spain Fax +34 973 702 702 [email protected]
Toni Granollers2 2Universitat de Lleida,
Jaume II 69, E-25001 Lleida, Spain Fax +34 973 702 702
Marta Oliva2 2Universitat de Lleida,
Jaume II 69, E-25001 Lleida, Spain Fax +34 973 702 702 [email protected]
ABSTRACT In order to make the Semantic Web reach “real world” end-users it is important to take into account Semantic Web usability. We focus our study of Semantic Web user tasks in end-user online applications, trying to contribute to establishing guidelines that help the adoption of the Semantic Web. However, as starting point, we take into account existing tasks analysis for Web systems and even online information systems in general in order to avoid constraining our view to the current state of development of the Semantic Web. The proposed set of end-user Semantic Web tasks is Search, Browse, Annotate, Mashup, Map, Share, Communicate and Transact.
Categories and Subject Descriptors H.5.2 [Information Interfaces and Presentation (HCI)]: User Interfaces – evaluation/methodology, graphical user interfaces (GUI), interaction style, standardization, theory and methods, user-centered design, user interface management systems.
General Terms Design, experimentation, human factors, standardization.
Keywords Human computer interaction (HCI), Semantic web, Interaction patterns, Semantic web end-user tasks, Semantic web usability.
1. INTRODUCTION The Semantic Web has been around for some time and many people are asking why it has not taken off as quickly as the World Wide Web did. One of the main impediments is that it is not reaching the end-users, who can give it the required critical mass for widespread adoption. In fact, end-users find most Semantic Web applications very hard to use [1].
In the context of this paper, end-user is defined as a user with no
or limited knowledge about Semantic Web. End-user tasks supported by the early Web are now neatly defined and are becoming part of Web developers’ common practice. Knowledge about tasks in the Semantic Web is much less clear due to its novelty [2].
As the starting point, and in order to make the range of tasks broad enough and avoid constraining our view to the current state of development of the Semantic Web, the focus should be broader than existing Semantic Web applications and studies of Semantic Web user tasks. We also consider user tasks in the context of the Web and even in the context of information systems. This makes it possible to check the consistency and coverage of the proposal. We build our proposal of a set of generic Semantic Web end-user tasks, which is presented in Section 2. Finally, Section 3 presents the conclusions and the future work.
2. SEMANTIC WEB END-USER TASKS From the analysis of the existing literature, as detailed below for each task, we have synthesized a set of generic end-user tasks that can assist Semantic Web developers.
The users we are considering are used to web and other Internet applications, like electronic mail or instant messaging. Therefore, we should also take into account a broader categorization of online user tasks.
The next section presents the set of end-user tasks we propose. Each task is first considered from the point of view of an end-user, i.e. without taking into account the particularities of the Semantic Web. Some examples of particular end-users tasks are then presented, together with references to the related tasks in the literature previously analysed.
All the proposed tasks are atomic. Usually, in the context of specific Semantic Web applications, user tasks will be composed of a mixture of these atomic tasks. The objective is to define a set of user tasks that would facilitate tasks analysis while being easily combinable in order to derive more complex and specific user tasks.
2.1 Search This kind of tasks corresponds to those when a user poses a query and obtains a set of results that might be rendered in different ways. We include here when the search might be delayed or repeated in the future, like in monitoring scenarios.
Permission to make digital or hard copies of all or part of this work for personal or classroom use is granted without fee provided that copies are not made or distributed for profit or commercial advantage and that copies bear this notice and the full citation on the first page. To copy otherwise, or republish, to post on servers or to redistribute to lists, requires prior specific permission and/or a fee. Interaccion’14, September 10–12, 2014, Puerto de la Cruz, Tenerife, Spain, Copyright 2014 ACM ISBN 978-1-4503-2880-7
304

Examples of this task are when a user performs a simple keyword based search using a Web search engine, an advanced query that allows constraining different search dimensions, query by example, monitoring elections results or a sports match, etc.
In the context of the Semantic Web, the user can benefit from the implicit semantics when performing a search and get more accurate results, i.e. higher precision and recall. Moreover, the knowledge captured in ontologies can be used in order to guide the user through the query construction process, in order to facilitate query by example or in results display.
In some cases, and after some user testing, it might be concluded that it is preferred to hide all these subtleties from the user, to keep a simple user interface, make use of the available semantics as part of the query engine internal mechanisms and exploit the semantics from the point of view of user interaction when presenting the results.
This task includes Locating and Monitoring (Heath et al. [3]), is similar to Fact Finding and takes into account the temporal dimension of monitoring scenarios (Kellar et al. [4]). It also considers Information Seeking (Battle [5]) though some of the examples Battle et al. propose may require other tasks, e.g. some sort of mash up in the case of combining news from different news sources. This task is also related to Semantic Content Consumption (Mäkelä et al. [6]), though it is more specific because Semantic Content Consumption also includes when users browse search results.
This task can be related to some semantic technologies capabilities (Paola Di Maio [7]), which completely or in part are met be means of this user task: Answer Engine, Concept-based Search, Context-aware Retriever, Enhanced Search Query, Expert Locator, Navigational Search or Product Design Assistant. Finally, it is also a component of the complex user task Word Sense Disambiguation (Sabou et. al [8]).
2.2 Browse This task is performed when the user moves through the information currently displayed. In the context of Web information systems this is usually done by following the links that connect the information to related information pieces.
In the context of the semantic web, it is possible to build a richer browsing experience because the underlying model is built from component of a smaller granularity, the triples formed by a subject, a predicate and an object. The combination of many triples builds up a graph. This graph might be browsed by following the links between nodes following different criteria, not but just showing the graph structure to the user.
Another alternative is to provide a faceted view if the metadata being browsed is homogeneous. In addition to the explicit metadata structure, it is also possible to take profit from the underlying ontologies in order to derive new links among resources using mechanism like inference, clustering or semantic queries to other sources, for instance in order dynamically suggest related products based on the semantic description of the product being browsed.
This task is related with both Exploring and Grazing (Heath), and also with Browsing (Kellar). Some of the examples of Information Seeking (Battle) also include aspects related with this task, e.g. learning more about a topic. This task is also related to Semantic
Content Consumption (Mäkelä), though it is more specific because Semantic Content Consumption also includes searching.
This task can be related to some semantic technologies capabilities (Di Maio), which completely or in part are met be means of this user task: Connection and Pattern Explorer, Context-aware Retriever, Interest-based Information Delivery, Navigational Search or Semantic Form Generator and Results Classifier. Finally, it is also a component of the complex user task Word Sense Disambiguation (Sabou).
2.3 Annotate In this task the user describes a resource by providing properties and values that model its characteristics, its relations to other resources, etc. This task includes providing a completely new description but also complementing an existing one, modifying it or deleting some or all of the attributes currently available.
Particular examples of this task are when a user tags a particular URL as it bookmarks it, providing the title and the description of a video, geographically locating a photo, defining a user profile that includes personal details and preferences, etc.
The main particularity of this task, in the context of the Semantic Web, is that the annotations are based on a formal model. Consequently, annotations go beyond informal and ambiguous tags into properties and values that might be constrained by the specifications captured in schemas and ontologies. The user can benefit from a domain specification defining the available kinds of resources, their properties depending on the resource type and the corresponding values. It is up to the user interface to guide the user through this knowledge space, dynamically constraining the choices to be made depending on previous user actions, the context of use and the intended goals.
An example of tool giving support to this task in the context of the Semantic Web is the Semantic Forms extension for Semantic MediaWiki [9], which takes profit from the underlying semantic models that structure available types, properties and their values. This task is connected with Asserting (Heath), especially if we consider that the statements made are metadata. It is also related with a broader task that considers maintaining information, Maintenance (Kellar), and also with a more specific one that concentrates on updating content, Content Update (Battle).
Taking into account tasks identified in the literature in the context of Semantic Web applications, this task is related with Content Indexing (Mäkelä) in the sense that by that task semantic annotations are generated, but just as long as some user intervention is required. Otherwise, it is not a user task but a system task. It can be also related with Ontology Maintenance and Publishing (Mäkelä), though from the end-user characterisation we have made this tasks lays outside the set of user tasks under consideration.
Finally, this task is employed in order to attain some of the semantic capabilities (Di Maio): Automated Content Tagging, Content Annotation, Dynamic User Interface, Semantic Service Discovery and Choreagraphy or Virtual Consultant.
2.4 Mashup This task is about the user gathering different pieces of information and combining them in order to get something more than the simple aggregation of those pieces. Specific examples of this task range from simple mashups such as combining a set of resources that are geographically situated in order to, for instance, which are the hotels near a venue, or resources with temporal
305

dimension that are arranged in a calendar or timeline in order to facilitate scheduling. In the context of the Semantic Web, this task involves combining two or more pieces of metadata about common resources in order to aggregate the available descriptions about them. It is also possible that the metadata is about different resources, but in this case they should be similar in some sense in order to make possible the aggregation in some dimension.
The main benefit of Semantic Web technologies and methodologies for this task is that as semantic metadata and ontologies are available, it is easier to implement some sort of assistance for the user during the aggregation process. The assistance may range from the ability to propagate the aggregations made to one particular resource property to all the uses of that property in the metadata being mashed up, like in the Potluck mashup tool [10], or exploiting in a more automatic way the available semantic metadata using semantic and statistical measures in order to provide a preliminary mashup that the user might then customise, like in the case of the semantic information mashup tool Sig.ma [11].
This task is related with, though slightly more specific than, Information Gathering (Kellar) and includes the main characteristics of both Evaluating and Arranging (Heath), which might also involve search and browse but whose added value is about combining information and extracting something more that its pure addition. It is also related with Information Synthesis (Battle) and the Semantic Content Consumption user task (Mäkelä), which is much wider and also includes searching and browsing.
This task might be also required in order to deploy semantic capabilities (Di Maio) like: Answer Engine, Connection and Pattern explorer, Context-aware Retriever, Product Design Assistant, Semantic Form Generator and Results Classifier.
2.5 Map This task takes place when the user defines mappings among terms from different vocabularies. It is not constrained to a particular set of resources like in the case of the Mashup task, and it does not operate at the level of particular resource descriptions. On the contrary, in this task, the user is working at the level of the vocabularies. These vocabularies might be used in descriptions for many resources, some of which the user might not be aware of it at the moment.
Results from a mapping task might be used in order to facilitate or automate a mashup, or both tasks might be carried out alternatively and coordinately as a process where the user is mashing up a set of resource descriptions and during that process some mappings among the vocabularies being used are defined.
Examples of this task range from simple scenarios like stating that two tags are equivalent to more complex ones like relating different product categories. In the Semantic Web this task includes, for instance, when the user defines simple mappings among classes or properties defined in different ontologies.
This task is a particular case of Ontology Mapping (Battle), geared towards very simple mappings and usually triggered by the system that asks users for confirmation because we focus on end-users that are not ontologists. It is also related with Ontology Maintenance and Publishing (Mäkelä) but that is also a task geared toward ontologists and domain experts, not end-users. The same applies when considering Content Indexing (Mäkelä) or
Ontology Matching (Sabou), while Folksonomy Enrichment might be easier and more appropriate for end-users.
2.6 Share This task considers uploading, publishing, updating and deleting pieces of content with the intention of making them available to other users, who can access the content from a place and at a time individually chosen by them. This last statement allows to clearly distinguishing this tasks from the Communicate task, which is presented next.
This task is also differentiated from Annotate in the sense that data –and not metadata- is added, edited or removed. This data will usually correspond to different kinds of content that users want to share online, like videos, text or images.
Examples of this task are posting a blog or micro-blogging, sharing a photo in a social network, making a file available through a Peer-to-Peer network, etc. In the context of the Semantic Web, this task, as long as related with data and not with metadata, is just equivalent to the corresponding Web task. However, it might be enriched by triggering some sort of content indexing or automatic metadata generation that serves as input for an Annotate task, which allows the user editing and managing this metadata.
This task is similar to Sharing (Heath) and Information Sharing (Battle). There are not tasks related with this one in the studies of Semantic Web tasks we have analysed. This seems related with the fact that, as we have previously said, in the context of the Semantic Web sharing semantic descriptions is a task included in annotation tasks.
2.7 Communicate This task is about sharing information directly with particular users, without the intention of making it available to other users. The process is in this case driven by the user participating in this task as the emitter.
Examples of this task are to participate in a chat, to send an e-mail, videoconference, etc. We have included here e-mails because they are usually kept private and not intended to make them publicly available to other users apart from the recipient. Moreover, the communication is driven from the emitter as long as the recipient has the e-mail client up and listening.
This task is related with Notifying and Discussing (Heath). On the other hand, Expert locator is a semantic capability (Di Maio) that might involve this task if a part from locating the expert the capability also involves facilitating the communication with the expert.
2.8 Transact This task is associated with user actions that provoke a change in the state of a real-world entity or of a resource in a system outside the scope of the system the user is interacting with.
Examples of this task are buying a book, ordering a money transfer between bank accounts, etc. The range of specific tasks included in this category might vary a lot depending on the interactive system attention is focused on. If we concentrate on the user tasks for a specific application, any task that involves interacting with other systems might be considered a transaction as a way to focus the analysis.
On the other hand, if a broader system is taken into account, for instance any information system, the study might be detailed
306

further and particular tasks among the ones presented before might be identified as the goal of that interaction. In any case, applications might take profit from these technologies and methodologies while supporting this task before and after the processing outside the Semantic Web takes place. For instance, by facilitating form filling while the user provides the required data to complete the transaction. Another way to support the transaction might be adapting the results to user preferences and context, for instance performing currency conversions following user preferences.
This task is present in two of the tasks list considered. There are Transacting (Heath) and Action-oriented (Battle) tasks.
3. CONCLUSIONS AND FUTURE WORK In order to make the Semantic Web reach “real world” end-users, special care must be placed in making Semantic Web applications more usable. It is very useful to define a set of common user tasks in the context of a particular domain, e.g. Web information systems, in order to establish guidelines and common interaction patterns for that domain.
This is the main aim of this work, to identify a set of common user tasks for the Semantic Web. However, it is important to specify the user profile; it is not enough to say that tasks are for any user. In this case, as the aim is to contribute to the widespread adoption of the Semantic Web, the target user is the end-user. The context is any online application based on Semantic Web technologies.
Once the user and the context are defined, it is time to determine the user tasks. In order to take into account a broad range of user tasks, it is important to avoid constraining the analysis to the current Semantic Web. Consequently, it is necessary to take into account more than existing Semantic Web applications and studies of Semantic Web user tasks. The set of Semantic Web end-user tasks proposed is based on the analysis of existing tasks inventories for the Web and even for online information systems in general.
The set of tasks includes Search, Browse, Annotate, Mashup, Map, Share, Communicate and Transact. Each of these tasks has been described avoiding technological considerations and then presented from the point of view of the Semantic Web. They are also related to the tasks proposed in the literature under consideration.
Once the user tasks have been identified, it is really useful to have an inventory of interaction patterns that give support to these user tasks as a guideline. There are many lists of interaction patterns, though most of them focus on Web systems or other interactive systems without adapting their proposal to Semantic Web user tasks.
Our aim is to build an inventory of Semantic Web interaction patterns starting from existing inventories, e.g. Tidwell’s1 van Welie’s2, Toxboe3, the Yahoo! Design Pattern Library4, or Crumlish & Malone's5. This objective will be build on top of these 1 http://designinginterfaces.com 2 http://www.welie.com 3 http://ui-patterns.com 4 http://developer.yahoo.com/ypatterns 5 http://www.designingsocialinterfaces.com
pattern libraries and classified them taking into account the proposed Semantic Web end-user tasks. Many of them might be mapped directly from the Web domain to the Semantic Web, like Welie’s patterns for Search and Browse, two tasks near clear equivalents in the Semantic Web. In any case, they must be studied in detail, new opportunities should be detected and there is also room for novel interaction patterns that the Semantic Web might make possible. Our analysis against related work specific for Web information systems shows that the user tasks where the contribution of Semantic Web technologies might be more important, because they a less consider or not considered at all, are Annotate, Mashup and Map.
4. ACKNOWLEDGEMENTS Partially supported by the research project InDAGuS, Infrastructures for Sustainable Open Government Data with Geospatial Features (Spanish Government TIN2012-37826-C02).
5. REFERENCES
1. T. Heath, J. Domingue and P. Shabajee: "User interaction and uptake challenges to successfully deploying Semantic Web technologies". In Proc. 3rd International Semantic Web User Interaction Workshop, Athens, Georgia, USA, 2006.
2. K. Bakshi, D.R. Karger, End-User Application Development for the Semantic Web, Semantic Desktop 2005 Workshop, International Semantic Web Conference (ISWC), October 2005.
3. T. Heath, M. Dzbor, E. Motta: "Supporting User Tasks and Context: Challenges for Semantic Web Research", in: Proc. ESWC2005 Workshop on End-User Aspects of the Semantic Web (UserSWeb), 2005.
4. M. Kellar, C. Watters, M. Shepherd. A Goal-based Classification of Web Information Tasks. In 69th Annual Meeting of the American Society for Information Science and Technology, Austin, US, 3-8 November 2006.
5. L. Battle, Preliminary Analysis of Users and Tasks for the Semantic Web, Semantic Web User Interaction Workshop, International Semantic Web Conference, Athens, GA, 2006.
6. E. Mäkelä, K. Viljanen, O. Alm, J. Tuominen, O. Valkeapää, T. Kauppinen, J. Kurki, R. Sinkkilä, T. Känsälä, R. Lindroos, O. Suominen, T. Ruotsalo and E. Hyvönen. Enabling the Semantic Web with Ready-to-Use Web Widgets. FIRST - First Industrial Results of Semantic Technologies Workshop, at the ISWC+ASWC Conference, Busan, Korea, November 11-15, 2007.
7. P. Di Maio, Toward Global User Models for Semantic Technologies: Emergent Perspectives, in Proceedings of the Third Asian Semantic Web Conference, ASWC’08 Bangkok, Thailand, 2008, pp. 141-152.
8. M. Sabou, J. Garcia, S. Angeletou, M. D'Aquin and E. Motta. Evaluating the Semantic Web: A Task-based Approach” in The 6th International Semantic Web Conference and the 2nd Asian Semantic Web Conference, 2007.
9. M. Krötzsch, D. Vrandečić, M. Völkel, Semantic MediaWiki, in: The Semantic Web - ISWC 2006, Heidelberg, DE, Springer, 2006, pp. 935-942.
10. D. Huynh, R. Miller, Robert, and D.R. Karger, Potluck: Data Mash-Up Tool for Casual Users, 6th International Semantic Web Conference (ISWC) , November 2007.
11. M. Catasta, R. Cyganiak, G. Tummarello, Towards ECSSE: live Web of Data search and integration, Semantic Search 2009 Workshop, Madrid, Spain, 2009.
307

Empowering Interfaces for System Administrators: Keeping the Command Line in Mind when Designing GUIs
Sandra R. Murillo
Universidad Popular Autónoma del Estado de Puebla
Puebla, Puebla 72410, México [email protected]
J. Alfredo Sánchez Interactive and Cooperative Technologies Lab
Universidad de las Américas Puebla [email protected]
ABSTRACT In terms of usability, network management software based on
command line interfaces (CLI) is efficient but error prone. With
GUIs, a new generation of security tools emerged and were
adopted by young system administrators. Though usability has
improved, it has been argued that CLI-based software tends to
support better user performance. Incorporating CLI advantages
into graphical versions (or vice versa) remains a challenge. This
paper presents a quantitative study regarding system
administrators’ practices and preferences regarding GUIs and CLIs
and reports on initial results of a usability evaluation performed on
proposed interfaces that are informed by our study. Personalization
features are particularly appreciated by network administrators,
which suggests possible strategies for graphical interface designs
that improve user experience while maintaining the positive
aspects of CLI-based software.
Categories and Subject Descriptors
H.1.2 [User/Machine Systems]: Human factors
General Terms
Human Factors, Design, Security
Keywords Human factors, Usability, Security, GUIs, command line
interfaces.
1. INTRODUCTION The administration of computing and telecommunications
infrastructure supporting services is a continuous challenge.
Nowadays, there are several tools that can be implemented to
manage the basic principles a safe system should have in place:
integrity, confidentiality, availability, authentication and non-
repudiation. Though most software in this area complies with its
technical objective, it does not typically adhere to guidelines for
interface design, and may not be the best for the technology
consumers in terms of critical factors of user experience. In some
cases, this causes frustration, waste of time and prevents the
transference of the acquired experience on to the utilization of
other tools in a natural manner, forcing users to adapt to each tool,
and not the other way around.
At present, each user has to be not only an expert in information
security, but also in interface usage. With such a poor integration,
users are responsible for correlating and making sense of the
results obtained through multiple distributed systems using
different techniques, including some manual procedures.. Tools
based on the command line interface (CLI) are still considered
very powerful, as they allow a detailed handling of data and
parameters, including those provided by graphical interfaces. In
order to take advantage of CLI-based tools, users should have
syntactic knowledge of sentences to be executed, and are
constantly at risk of making typing errors. This paper presents a
quantitative study about system administration practices and
preferences regarding GUIs and CLIs. The paper is organized as
follows: Section 2 discusses the main issues in the usability and
security management tools. The main problem is defined in
Section 3, whereas Section 4 describes the methodology followed
in our study. Our initial results are presented in Section 5. A
prototype measurement is presented in Section 6. Finally, Section
7 presents the future work derived from our study.
2. SECURITY AND USABILITY Due to the constant growth of Internet usage, working in security
software is a challenge for all of those involved [1]. According to
[2], over 70% of the security breaches against company networks
come from the “application level” and not from the “network
level” in terms of the OSI model [3]. This indicates that having a
deep knowledge of programming, routing protocols or operating
systems is not even necessary to cause severe damage through easy
to use applications. Having the tools to predict and mitigate
undesirable acts and to opportunely detect “false positives” within
a network is indispensable [1] [2].
According to [3], a security support tool would have a high level of
usability if it had standard formats that permit inter-tool
integration, data mining applications, events flow automatic
processing, collaboration and information interchange, as well as
effective, scalable work spaces that allow personalization with
programmable visualizations. Moreover, in [9] it is said that
reporting capabilities, historical analysis and real time monitoring
are data analysis strategies that must be present in security related
tools. As stated by [4], when designing graphical interfaces for
tools based on command lines, it is necessary to identify user
experience elements that are important and are strongly correlated,
making sure the design avoids blindness due to lack of attention.
A good interface design should offer the possibility of finding the
interaction elements that pinpoint what/who the interface
addresses, where the elements are located, and how it performs its
tasks. Various authors [5] [6] agree that the principles of interface
design should focus on ensuring consistency between the
functionality of the applications and the environment where they
will be utilized, so they can offer a comprehensible space for
interaction. There is a considerable amount of security tools based
on command line [7] [8]. A command line interface (CLI) is a
type of human-computer interface that relies solely on a set of
specific commands and their corresponding parameters, all of this
in pure text (for entering commands) and textual display of results.
308

That is, the entire display screen, or the currently active portion of
it, shows only characters, and input is usually performed entirely
with a keyboard [9]. Some advantages according to [10], first, the
user faces less distraction as there is no need to interact with GUI;
second, commands in CLI can be used to create complex shell
scripts to solve complex tasks. In the other hand, a disadvantage of
CLI is the user´s high cognitive workload because they have to
remember the commands and parameters.
3. THE PROBLEM There are several specific tools based on CLI for each security
administration task in a given network. It is very hard to transfer
the experience acquired while using one of these tools to the use of
another that is based on a different interface paradigm, as the
representations of the basic factors that are common to such tasks
have not yet been standardized. For every system, the user must
know beforehand the command syntax and parameters for the task
to be executed. Security administrators consider an application
usable as long as it fulfils the specific technical objective for which
it was originally developed [11]. For years, applications have
maintained the same format and it is well known that experts in
this area should be able to totally adapt to them, with no certainty
of whether or not both GUI and CLI versions would be available.
We thus formulated the following working hypothesis:
The performance of network administrators will improve by
relying on usable graphical interfaces of the corresponding
command line tools.
4. METHODOLOGY In order to investigate the validity of our hypothesis, we conducted
a quantitative study, based on a parametric analysis using
frequencies and correlation coefficients [12]. Frequency analysis
and the Pearson correlation method were applied using the SPSS
software to identify relationships between the study variables. A
prototype was designed and a usability study [13] and a survey
were applied. Fifteen experienced network administrators were
asked to mention the 20 basic tools they utilize to perform their
duties as network security administrators, regardless of whether
they like to use them or not. The following was observed: 53% use
a CLI version, 31% a GUI version, and 16% both versions.
According to these results, only the four most voted tools based on
Command line version were selected: an intrusion detection system
(Snort [14]), a password cracking program (John the Ripper [15]),
an email policy administrator (Procmail [16]), and a remote device
administrator (SNMP [17]).
4.1 Technical elements and interface elements By means of a survey, the participants were asked to indicate the
technical elements and the interface elements that they consider
should have a common and consistent representation throughout
the four tools selected for this study. The technical elements, in no
particular order, that participants would expect to find in a
consistent manner throughout network security tools are the
following:
Internet Protocol (IP)
address range
Ports menu
Protocols menu
Network card menu
Workgroup
Progress bar
Execution time
(Hours, minutes,
seconds)
Execution mode
(Online, offline)
Application status
(Active / inactive)
Scheduling tasks
Basic functions (Start,
stop, pause, reset)
Administrative menu
Network map
Percentage of
completion
Real time log
Expected results
Advanced functions
Save/send log
Save/send partial
results
Save/send final
results
Save/send Log
The interface elements, in no particular order, that participants
would expect to find in a consistent manner throughout network
security tools are the following: Customizing colors, customizing
typography, representative icons, relocating elements, graphical
version and command line version. The participants answered four
paper-based questionnaires (one per tool) containing five-point
Likert scale items in order to determine the importance of each one
of the elements present in the tools. The relationship between
variables was analyzed using SPSS [12].
5. INITIAL RESULTS These are the main results of this study:
The values obtained through the SUS evaluation for the four
tools under study range between 20.5 and 28.3. This data
shows that there is a perceived low usability level for CLIs.
None of the participants feel satisfied with the idea that CLI
tools facilitate network security tasks.
For the four tools, there are strong correlations between each
tool’s basic functions and interface related elements (Table 1
to 4).
6. IMPLEMENTATION AND
MEASUREMENT A prototype based on the results presented in Section 5 was
designed as follows. See an example in Figure 1.
1. Interactive elements were placed near or far from each
other according to the values of the correlations
presented in Section 5 of this paper. If the correlation
was very high, proximity was immediate. For example,
in Snort GUI prototype, proximity of the Colors and
Typography is based on the highest identified correlation
value (Figure 1).
2. The proportion of the interaction elements on the screen
was considered based on the importance of the
corresponding task. For example, the area of Expected
Results (highlighted by an oval) is very important for
potential users of the graphical version of Snort (Figure
1).
Participants were asked to assess the original CLI tools, according
to their previous experience and to assess a second version of this
prototype, as well as the usability of such tools by means of the
questionnaire recommended by the SUS methodology [13]. The
average scores given by the 15 participants are shown in Table 5.
309

Table 1 . Snort results
Correlations Interpretation
Changing colors is correlated
to basic functions (0.891**),
to expected results (0.721), to
change typography (0.908**)
and to progress bar
(0.881**).
Representative icons is
correlated to basic functions
(0.928**), to expected results
(0.784*), to change
typography (0.874*) and to
progress bar (0.906**).
It is necessary to
include representative
icons and to apply
changing colors option
to basic functions ,
expected results, change
typography and
progress bar.
Change typography is correlated
to graphical version (0.700).
It is very important to
include change
typography option in a
GUI version.
Figure 1. Prototype
Table 2. John the Ripper results
Correlations Interpretation
Change colors is correlated to
administrative menu (0.725),
to Command line version
(0.960**), to basic functions
(0.725), to relocate elements
(0.735) and to change
typography (0.960**).
It is necessary to include
change colors option to
administrative menu, CLI,
basic functions, relocate
elements and change
typography.
Relocate elements is
correlated to basic functions
(0.730) and to real time log
(0.730).
It is necessary to include
relocate elements option to
basic functions and to real
time log.
Representative icons and
basic functions (0.923**) are
strongly correlated.
It is indispensable to include
representative icons in basic
functions.
Table 3. SNMP results
Correlations Interpretation
Change colors is correlated to
command line version
(0.725), to scheduling tasks
(0.702), to relocate elements
(0.710) and to change
typography (0.764*).
It is necessary to include
change colors option to
scheduling tasks, relocate
elements and change
typography tasks.
Expected results is correlated
to change colors (0.711), to
representative icons (0.753)
and to relocate elements
(0.826*).
Expected results needs
change colors,
representative icons and
relocate elements options.
Table 4. Procmail results
Correlations Interpretation
Basic functions is correlated to
representative icons (0.795*), to
application status (0.859*), to
advanced functions (0.723), to
change colors (0.881), to
graphical version (0.786) and to
command line version (0.779*).
Basic functions need
representative icons
and change colors
options, also need to be
close to application
status, advanced
functions, GUI and
CLI.
Change colors is correlated to
change typography (0.842*).
Change colors option
needs to be close to
chance typography.
Command line version is
correlated to representative icons
(0.921**).
CLI version needs
representative icons.
7. PRELIMINARY CONCLUSIONS This study was conducted with the help of senior undergraduate
students majoring in Information Security, and lecturers with more
than fifteen years of experience in information security education
and consulting. Future studies will include security experts
coming from different geographical and cultural regions in order to
assess the impact of these variables. There is a strong correlation
between changing colors and changing typography, which means
that the users consider them as very important elements and they
should be placed one next to the other within the interface. For all
security tools, including representative icons is an indispensable
feature.
Users expect to find the available options represented in a
graphical language, consistent throughout all the evaluated tools.
This element shows a high correlation with the tool’s basic
functions for all the four cases studied. When it comes to
performing tasks as a security administrator, the presence of these
icons is considered even more important than the presence of
technical options. Establishing a universal set of security icons to
be applied on the interface could increase the tools’ usability and
improve users’ performance. Changing the position of the
elements within the interface and having a graphical version,
additional to the command line version are options the users of
these tools consider of high priority. This suggests that
personalization of the workspaces could increase the tools’
310

usability and improve users’ performance. It is possible that the
best option for some users is command line version; however,
people with other profiles could make better use of their different
skills using a graphical version.
Table 5. SUS Results Part 1
Tool SUS Results
CLI
SUS Results
Prototype
Snort 22 70.6
John the Ripper 28.3 71.3
Procmail 20.5 69
SNMP 23.3 68.6
The initial values obtained through the SUS evaluation (Table 5)
show that the level of usability for the tools under study is low and
it doesn’t satisfy the users who utilize them on a daily basis. There
is an improved usability of GUI management security tools, which
typically are used as CLI (Table 5). Further studies may investigate
whether specific personality characteristics of administrators may
suggest customization models to improve their performance. It is
necessary to conduct a study with users in which they are asked to
perform a set of typical network administration tasks using
different versions of the considered tools and make comparisons to
determine whether the usability of one tool is objectively better
than the other. At this point in the study, we do not have final
results regarding usability metrics such as the number of
completed tasks, runtime, number of requests for help, errors and
level of satisfaction according to age, gender and experience. After
that, it will be possible to document the observations and
determine the outcome of the hypothesis proposed at the beginning
of this work.
8. ACKNOWLEDGMENTS We are thankful for support received from Conacyt through the
ReAuMobile project.
9. REFERENCES [1] G. Jackson, Predicting Malicious Behavior: Tools and
Techniques for Ensuring Global Security, John Wiley &
Sons, 2012.
[2] D. Miller and S. Harris, Security Information and Event
Management (SIEM) Implementation, McGraw-
Hill/Osborne, 2011.
[3] E. Kandogan and E. Haber, "Security Administration Tools
and Practices," 2005. [Online]. Available:
http://www.plunk.org/eben/PublishedPapers/Security-
ch18.pdf. [Accessed 2014].
[4] S. Rubio-Valdehita, E. Díaz-Ramiro and R. López-Higes,
"Effects of task load and cognitive abilities on performance,"
Anales de psicología, vol. 28, no. 3, pp. 986-995, 2012.
[5] J. Nielsen, Usability Engineering, Morgan Kaufmann, 1993.
[6] L. Constantine, Software for Use: A Practical Guide to the
Models and Methods of Usage-Centered Design, Addison-
Wesley, 1999.
[7] I. SANS, "Securing Linux/Unix," 2013. [Online]. Available:
https://www.sans.org/course/securing-linux-unix.
[8] S. Ross, Unix system securiy tools, McGraw-Hill, 2010.
[9] M. Loukides, System performance tuning, O´Reilly &
Associates, Inc., 2002.
[10] J. Preece, Human-Computer Interaction: Concepts And
Design, Addison Wesley, 1994.
[11] E. Nemeth and G. Snyder, Unix system administrator
handbook, Prentice Hall, 2011.
[12] N. Malhortra, Investigación de Mercados., Pearson Prentice
Hall. 5ª. Edición, 2008.
[13] J. Brook, "System Usability Scale," [Online]. Available:
http://www.usability.gov/how-to-and-tools/methods/system-
usability-scale.html.
[14] Sourcefire, " Open source network intrusion prevention and
detection system (IDS/IPS)," [Online]. Available:
http://www.snort.org.
[15] Openwall, "John the Ripper password cracker," [Online].
Available: http://www.openwall.com/john/.
[16] S. Van den Berg, "Welcome to procmail.org," [Online].
Available: http://www.procmail.org/.
[17] S. Research, "Secure Internet Management and SNMP,"
[Online]. Available: http://www.snmp.com/.
311

Avanzando Hacia la Consideración de la Calidad de Adaptación en ISATINE
Cristina Roda LoUISE Research Group, I3A
Universidad de Castilla-La Mancha Campus, s/n, Albacete, Spain
+34 967 599 200 +2656
Víctor López-Jaquero LoUISE Research Group, I3A
Universidad de Castilla-La Mancha Campus, s/n, Albacete, Spain
+34 967 599 200 +2461
Francisco Montero LoUISE Research Group, I3A
Universidad de Castilla-La Mancha Campus, s/n, Albacete, Spain
+34 967 599 200 +2468
RESUMEN
La calidad es importante para cualquier tipo de producto software.
Por ejemplo, la usabilidad es un factor determinante en el éxito de
un producto, siendo éste uno de los factores de la calidad de un
producto software. El proceso de diseño, ejecución y evaluación
de la adaptación no escapa por supuesto a esta necesidad de
consideración de la calidad. El marco de adaptación ISATINE
considera todas las actividades concernientes al proceso de
adaptación, desde su concepción a su evaluación, sin embargo no
contempla la calidad de adaptación en cada una de las etapas del
proceso de adaptación que incluye. En este artículo, se describe
qué es la calidad de adaptación y su descomposición en cuatro
tipos (Calidad Esperada de la adaptación, Calidad Deseada de la
adaptación, Calidad Alcanzada de la adaptación y Calidad
Percibida de la adaptación). Además, se distinguen los tipos de
calidad de adaptación que están involucrados en cada etapa de
ISATINE. Saber esto nos permitirá en un futuro integrar la
calidad de adaptación en cada una de las etapas de ISATINE,
describiendo qué técnicas, métricas y métodos utilizar en cada
fase para evaluar dicha calidad de adaptación. De esta forma,
dispondremos de un proceso de adaptación que contemple la
calidad en su totalidad.
Categories and Subject Descriptors
H.5.2 [Information Interfaces and Presentation]: User
Interfaces – evaluation/methodology, screen design, user-centered
design.
General Terms
Design, Human Factors, Theory.
Keywords
Interaction, ISATINE, adaptation, quality.
1. INTRODUCCIÓN El creciente uso de aplicaciones que facilitan tareas cotidianas al
usuario, como comprar billetes de avión o de teatro, o la variedad
de personas que usan una aplicación en particular, son algunos de
los ejemplos que ilustran la necesidad de crear aplicaciones
apropiadas para cualquier tipo de usuario, cualquier dispositivo y
capaz de funcionar en cualquier situación. Desafortunadamente,
incluso aunque se apliquen métodos de diseño centrados en el
usuario, es imposible prever todas las combinaciones de los
parámetros que influyen en la interacción o a veces simplemente
demasiado costoso para realizarlo. En este escenario es donde la
adaptación puede desempeñar un papel determinante.
Así, la adaptación al contexto que nos rodea se ha convertido en
una rutina diaria en nuestros dispositivos que pasa inadvertida
para muchos usuarios. Por ejemplo, el brillo de nuestra pantalla se
adapta automáticamente de acuerdo a las condiciones actuales de
iluminación, la pantalla se apaga automáticamente cuando
acercamos el teléfono a nuestra cara para hablar para evitar que
pulsemos sin querer, o la interfaz de usuario se acondiciona
cuando rotamos nuestro dispositivo. Además, los distintos tipos de
usuarios también imponen importantes restricciones para
conseguir un diseño apropiado para cada arquetipo de usuario.
En este sentido, existen procesos de adaptación que guían al
diseñador para producir una experiencia de adaptación agradable.
El más ampliamente aceptado fue propuesto por Dieterich en
1993 [1], pero presenta varias deficiencias, entre ellas no
considerar la calidad de adaptación, es decir, no permitir la
evaluación de la adaptación para saber si es apropiada o no, ya
que se centra sólo en la ejecución de la adaptación. Para atajar
este problema, se propuso un marco de trabajo de adaptación
llamado ISATINE [16] que consta de siete etapas y especializa el
modelo mental de Norman [3] para la adaptación.
Obviamente, los marcos de adaptación, y en general los procesos
de adaptación, deben garantizar cierta calidad que dé como
resultado una adaptación apropiada y certera para una situación
concreta. De la misma manera que una interfaz de usuario (una
aplicación software en general) se crea con el objetivo de alcanzar
un grado de calidad específico, así debe suceder con la
adaptación. A este último tipo de calidad es al que nos referimos
como Calidad de Adaptación (en adelante QoA, de sus siglas en
inglés: Quality of Adaptation) [2], el cual será detallado en la
sección 2.2.
Debido a una consideración deficiente o insuficiente de la calidad
en el proceso de adaptación, no se suele proporcionar una buena
experiencia de adaptación al usuario, produciendo un rechazo. En
este trabajo se describe la QoA en el marco de adaptación
ISATINE, con el objetivo de considerar apropiadamente la QoA
en cada una de sus etapas.
Este artículo está organizado de la siguiente manera: en la sección
2 se describe la QoA en el marco de adaptación ISATINE,
propuesto en trabajos previos [16], caracterizándola a partir del
propio concepto de calidad (sección 2.1) y especialmente del
concepto más genérico de QoA (sección 2.2); en la sección 3 se
incluye una discusión sobre los aspectos descritos en este artículo,
finalizando en la sección 4 con unas conclusiones y trabajo futuro.
2. QoA EN ISATINE A lo largo de esta sección, se describe cómo podemos considerar
la calidad en las distintas facetas de una adaptación,
concretamente aquellas incluidas en ISATINE.
2.1 ¿Qué es la calidad? El significado de calidad causa bastante confusión, debido a que
es un concepto utilizado habitualmente en múltiples contextos y,
312

por tanto, posee diferentes interpretaciones y definiciones, como
las propuestas por Crosby [4], Juran [5] o Taguchi [8]. De manera
más formal, la IEEE en su estándar 610.12 [6] define la calidad
como el grado en que un sistema, componente o proceso satisface
los requisitos especificados y las necesidades o expectativas del
cliente o usuario. En la familia de estándares ISO 9000 [7],
también podemos encontrar otra definición de calidad: capacidad
de un producto software para satisfacer necesidades explícitas o
implícitas cuando se utiliza bajo unas condiciones determinadas.
Hoy en día, existen diversos estándares de calidad de carácter
internacional y bien madurados, como el ISO 9241-11:1998
(centrado en la usabilidad) y el ISO/IEC 25010:2011 (centrado en
la calidad del producto software y la calidad en uso), donde la
calidad se descompone en modelos de calidad. Estos modelos de
calidad pueden utilizarse para dar soporte a la especificación y
evaluación del software desde diferentes perspectivas [9],
asociadas a la adquisición, los requisitos, el desarrollo, el uso, la
evaluación, el soporte, el mantenimiento, la garantía de calidad y
la auditoría de software.
La calidad depende de cada usuario y de sus objetivos de negocio.
Por ejemplo (adaptado del ISO/IEC 9126-1:2001):
─ Un usuario (user) o una unidad de negocio de usuario puede
identificar la calidad con la idoneidad de un producto software,
utilizando criterios asociados a la usabilidad y la calidad en uso.
En este contexto, los usuarios con discapacidad pueden asociar
la calidad con la accesibilidad de su software.
─ Un adquiridor (acquirer) reconoce la calidad de un producto
software por medio de medidas externas de funcionalidad,
fiabilidad, usabilidad y eficiencia, o de calidad en uso.
─ Un mantenedor (maintainer) generalmente establece una
correspondencia entre calidad y mantenibilidad.
─ Una persona responsable de implementar (person responsible
for implementing) el software en diferentes entornos y
plataformas, asocia la calidad con la portabilidad.
─ Un desarrollador (developer) puede identificar la calidad de un
producto software por medio de medidas internas de cualquier
característica de la calidad.
─ Un evaluador (evaluator) puede asociar la calidad de un
producto software con la productividad, la satisfacción y la
efectividad de dicho producto.
Además de estos seis puntos de vista de la calidad, podemos
preguntarnos cómo podemos describirla. El trabajo propuesto en
[10], sugiere describir la calidad desde cuatro perspectivas
diferentes:
─ Calidad Esperada (Expected Quality), la calidad que el cliente
o usuario necesita, es decir, los elementos o requisitos necesarios
en la especificación del Sistema en Estudio (SuS, System under
Study).
─ Calidad Deseada (Wished Quality), el grado de calidad que el
experto en calidad quiere conseguir para la versión final del
SuS. Este tipo de calidad se deriva de la Calidad Esperada, ya
que está relacionada también con la especificación.
─ Calidad Alcanzada (Achieved Quality), la calidad obtenida a
partir de una implementación dada del SuS. Idealmente, debe
satisfacer la Calidad Deseada.
─ Calidad Percibida (Perceived Quality), la percepción sobre los
resultados que el cliente o usuario tiene, una vez que el SuS ha
sido entregado.
En este punto, es interesante establecer relaciones entre los
diferentes puntos de vista de la calidad y los cuatro tipos de
calidad que acabamos de ver. De esta forma, sabremos qué puntos
de vista se asocian con cada tipo de calidad:
─ La Calidad Esperada puede ser tratada desde el punto de vista
del usuario, ya que se refiere a los requisitos del sistema, es
decir, satisfacer las necesidades del usuario. Este tipo de calidad
también está relacionado con la vista del adquiridor dado que
también es adaptable a las necesidades del cliente.
─ La Calidad Deseada puede ser tratada desde los siguientes
puntos de vista: mantenedor, persona responsable de la
implementación, desarrollador y evaluador, ya que representan
a expertos en calidad que quieren alcanzar una calidad final con
respecto a la mantenibilidad, la portabilidad, medidas internas
de calidad, y la efectividad del sistema, respectivamente.
─ La Calidad Alcanzada, como la deseada, también puede ser
tratada desde los puntos de vista del mantenedor, persona
responsable de la implementación, desarrollador y evaluador,
ya que representan a expertos en calidad que finalmente logran
cierta calidad de acuerdo a la mantenibilidad, la portabilidad,
medidas internas de calidad, y la efectividad del sistema,
respectivamente.
─ La Calidad Percibida, como la esperada, también puede ser
tratada desde los puntos de vista del usuario y el adquiridor,
dado que está centrada en la calidad del producto después de la
entrega del sistema, es decir, la percepción de la calidad por el
usuario/adquiridor final. La usabilidad, calidad en uso,
funcionalidad o experiencia de usuario son conceptos asociados
a este tipo de calidad.
Finalmente, se puede concluir que los tipos de calidad anteriores
están relacionados entre sí. Concretamente, la calidad esperada y
la deseada son complementarias. Los usuarios y los
desarrolladores deben trabajar siguiendo un diseño centrado en el
usuario. Así, un producto software será de calidad cuando la
calidad esperada y la deseada estén altamente solapadas. De esta
forma, este elevado nivel de calidad será percibido por los
usuarios cuando la calidad deseada y la alcanzada se centren en la
consecución de las necesidades del usuario.
Estos seis puntos de vista de la calidad pueden reagruparse a su
vez en dos puntos de vista más genéricos: Usuario – Interacción,
y Desarrollador – Adaptación. El primero de ellos incluye a los
puntos de vista del usuario y el adquiridor, mientras que el
segundo incluye a los puntos de vista del mantenedor, persona
responsable de la implementación, desarrollador y evaluador.
2.2 La calidad en la adaptación En trabajos previos [2], hemos definido la QoA como el grado
con el que un conjunto de adaptaciones produce interfaces de
usuario que permiten al usuario lograr objetivos específicos con
usabilidad (ISO 9241-11 [11]; ISO/IEC 25010 [12]) en contextos
de uso concretos. Dentro del contexto de uso consideramos las
características del usuario, de la plataforma (hardware y software),
del entorno físico donde la interacción tiene lugar y de la tarea que
el usuario está realizando.
En este sentido, Gjørven, Eliassen y Aagedal proponen en [13]
que la QoA se use para valorar cuán diferentes son las salidas de
una adaptación real de las salidas ofrecidas por un servicio de
adaptación ideal. Los autores definieron un servicio de adaptación
como el trabajo hecho (work done) especificado por un
subconjunto de eventos de salida y aquello que provocó la
petición del trabajo (work request), especificado por un conjunto
313

de entradas, a una componente o conjunto de ellas. De esta forma,
un servicio de adaptación puede definirse como aquel cuyo evento
de entrada es un disparador de la adaptación y cuyos eventos de
salida son un conjunto de servicios que potencialmente han sido
modificados o producidos durante la adaptación.
La QoA también puede describirse en términos de factores de
calidad del software. En muchas instituciones se establecen
grupos de profesionales encargados de seleccionar estándares,
procesos y herramientas para garantizar la calidad del software
[14]. De esta forma se consideran, por ejemplo, modelos de
calidad y sus distintos factores asociados durante diferentes fases
del ciclo de vida del software, concretamente durante el diseño, el
uso y la adaptación. En este artículo nos interesa concretamente la
última de esas fases, donde la QoA está incluida. En este ámbito,
la QoA se describe de acuerdo a los siguientes seis factores de
calidad [15]: facilidad de extensión, flexibilidad, portabilidad,
reutilización, interoperabilidad e intraoperabilidad.
2.3 Calidad de adaptación en ISATINE En la sección 2.1, se han presentado cuatro tipos diferentes de
calidad de adaptación: esperada, deseada, alcanzada y percibida.
Considerando la QoA, las distintas vistas de la calidad pueden
definirse de la siguiente forma:
─La calidad esperada de la adaptación es la que surge de la
relación entre los objetivos de la adaptación y los requisitos que
el usuario espera que facilite una aplicación.
─La calidad deseada de la adaptación es la que aparece entre la
especificación de la adaptación y las políticas de selección
utilizadas para elegir entre las adaptaciones posibles, y el
objetivo que persigue es lograr cierto grado de calidad derivado
de la QoA esperada.
─La calidad alcanzada de la adaptación es la que surge cuando
se implementa e interpreta una adaptación.
─La calidad percibida de la adaptación se presenta como la
calidad de adaptación que percibe el usuario una vez ha hecho
uso de la IU adaptada.
Una vez definidas las distintas perspectivas de la QoA, es
interesante relacionar estos cuatro tipos con las distintas fases del
marco de trabajo ISATINE. El objetivo de esto es clarificar qué
tipo de calidad de la adaptación debe considerarse en cada
momento.
1. Objetivos de la adaptación (Objetivos). Esta fase está
relacionada con la calidad esperada de la adaptación en tanto en
cuanto representa lo que se espera de la adaptación por parte de un
usuario, un sistema o un tercero. Por ejemplo, en una página web
que soporte actividades de comercio electrónico es necesario que
las ofertas sigan estando presentes, aunque se adapte la interfaz.
2. Iniciativa de la adaptación (Iniciativa). Esta fase también está
relacionada con la calidad esperada de la adaptación dado que,
en este punto, el actor involucrado (usuario, sistema o tercero)
muestra su voluntad de que se desencadene el proceso de
adaptación, debido a que el estado de la interfaz no le permite
lograr sus objetivos bajo el contexto de uso actual.
3. Especificación de la adaptación (Especificac.). En esta fase se
especifican y seleccionan las adaptaciones que pueden llevarse a
cabo para lograr cierto grado de calidad. El tipo de calidad que
hay que contemplar es la calidad deseada de la adaptación.
4. Aplicación de la adaptación (Aplicación). Esta fase está
también asociada con la calidad deseada de la adaptación,
resultado de la aplicación de las adaptaciones especificadas en la
fase previa.
5. Transición de la adaptación (Transición). Es obvio que el
cambio de la interfaz de usuario de la original a la adaptada debe
realizarse considerando criterios de la calidad alcanzada. En esta
fase, el actor encargado de la adaptación debe poder dar cuenta de
la calidad lograda con la adaptación y facilitar que se retomen las
actividades que venían realizándose antes de la adaptación. El tipo
de calidad que se considera en esta fase es la calidad alcanzada de
la adaptación.
6. Interpretación de la adaptación (Interpretac.). En esta fase
surge la necesidad de ser capaz de justificar el nivel de calidad
logrado fruto de la realización de la adaptación. Por tanto, en esta
fase, los actores involucrados deberían poder interpretar o explicar
las decisiones tomadas a través de la comprensión de ese tipo de
calidad alcanzada de la adaptación.
7. Evaluación de la adaptación (Evaluac.). En esta fase se
comprueba si los objetivos iniciales de la adaptación se han
cubierto o no. Lo que puede ser interpretado como la calidad
percibida de la adaptación que el usuario final tiene. Por ello, en
esta fase, el tipo de calidad a considerar es la relacionada con la
calidad percibida de la adaptación.
La Tabla 1 muestra un resumen con los tipos de calidad que se
ven involucrados en cada etapa de ISATINE, así como los puntos
de vista de calidad relacionados.
Tabla 1. Relaciones entre puntos de vista de la calidad, tipos
de calidad y etapas de ISATINE
Calidad
Vistas Esperada Deseada Alcanzada Percibida
Usuario -
Interacción
Objetivos
Iniciativa Evaluac.
Desarrollador
- Adaptación
Especificac.
Aplicación
Transición
Interpretac.
3. DISCUSIÓN
Se ha visto que es necesario un proceso que guíe la adaptación
para poder crear adaptaciones adecuadas que no conlleven al
rechazo por parte del usuario. Este proceso de adaptación debería
ir más allá de la simple ejecución de la adaptación e incluir el
punto de vista de la evaluación. ISATINE proporciona dicho
proceso de adaptación, cubriendo desde el primer paso en que se
da forma a la adaptación, hasta la evaluación de lo que el usuario
obtiene de la adaptación. Como para cualquier otro proceso, la
calidad debe ser considerada, de la misma forma en que la
usabilidad es considerada en el diseño de una interfaz de usuario.
Para ello es necesaria la utilización de un proceso de adaptación
que considere dicha calidad en todas sus etapas.
El concepto de calidad (en este caso, de un proceso de adaptación)
es algo abstracto que depende de múltiples factores,
especialmente de las preferencias fijadas por el usuario con
respecto al producto final (IU adaptada). La calidad, por tanto, se
convierte en un elemento mayormente subjetivo que debemos
considerar, y así poder determinar con claridad y cierta exactitud
si dicha calidad ha sido alcanzada por el producto final (IU
adaptada).
Como hemos visto, la calidad de adaptación depende del usuario y
de sus objetivos, con lo que se pueden distinguir seis puntos de
vista diferentes de la calidad. Además de estos puntos de vista, se
pueden distinguir también cuatro tipos de calidad, dependiendo
314

del punto de vista desde el cual se describa: calidad esperada,
calidad deseada, calidad alcanzada y calidad percibida. Así,
hemos establecido las distintas relaciones entre estos puntos de
vista y los tipos de calidad.
También hemos visto que, dependiendo de la etapa de ISATINE
en la que nos encontremos, podemos hablar de un tipo de calidad
u otro. Han quedado, por tanto, establecidas relaciones entre los
puntos de vista de la calidad, tipos de calidad y las distintas etapas
de ISATINE. A partir de estas relaciones, se podrán proponer
mecanismos o técnicas que permitan especificar/medir la calidad
de la adaptación en cada una de las etapas de ISATINE.
4. CONCLUSIONES Y TRABAJO FUTURO En este trabajo, se ha descrito la consideración de la calidad en un
proceso de adaptación. La Calidad de la Adaptación ha sido
refinada para un mejor entendimiento sobre cómo este concepto
aplica a las distintas etapas que incluye un proceso de adaptación.
Garantizar que se alcanza un nivel de calidad adecuado durante el
proceso de adaptación es imprescindible para que el usuario no
rechace las adaptaciones realizadas y abandone el sistema, por
ejemplo porque no comprenda qué ha ocurrido al realizar la
adaptación o cómo retomar sus tareas tras la aplicación de dicha
adaptación.
A lo largo del proceso de adaptación, se ha presentado cómo se
puede considerar la calidad de la adaptación en cada una de las
etapas de ISATINE. Esto permitirá en un futuro detallar qué
técnicas o métricas encajan mejor dentro de cada etapa de dicho
proceso. Al lograr esto, se podrá llegar a un mejor entendimiento
sobre qué es la calidad de adaptación y cómo puede ser utilizada
realmente en un proceso completo de adaptación.
También como trabajo futuro, nuestro objetivo será proporcionar
un modelo de calidad de adaptación completo que guíe
minuciosamente a cualquier diseñador de adaptación durante el
proceso de diseño de las capacidades de adaptación.
AGRADECIMIENTOS Este trabajo ha sido financiado por el Ministerio de España de
Economía y Competitividad, y por los fondos FEDER de la Unión
Europea bajo la subvención para el proyecto insPIre (TIN2012-
34003). También ha sido financiado por el Ministerio Español de
Educación, Cultura y Deporte, gracias a la beca FPU
(FPU12/04962).
BIBLIOGRAFÍA [1] H. Dieterich, U. Malinowski, T. Kühme, y M. Schneider-
Hufschmidt, “State of the Art in Adaptive User Interfaces,”
en Adaptive User Interfaces: Principles and Practice,
Elsevier B.V., 1993, pp. 13–48.
[2] V. López-jaquero, F. Montero, y P. González, “Quality of
Adaptation : User Cognitive Models in Adaptation Quality
Assessment,” en Computer-Aided Design of User Interfaces
VI, 2009, pp. 265–275.
[3] D. A. Norman, “Cognitive Engineering,” en User Centered
System Design, D. A. Norman y S. W. Draper, Eds.
Hillsdale, Michigan, USA: Lawrence Erlbaum Associates,
1986, pp. 31–61.
[4] P. B. Crosby, Quality is free: The art of making quality
certain. New York: McGraw Hill Custom Publishing, 1979,
p. 318.
[5] J. M. Juran y A. B. Godfrey, Juran’s quality handbook. New
York: McGraw Hill, 1999.
[6] IEEE Computer Society, IEEE Std. 610 - A Compilation of
IEEE Standard Computer Glossaries. IEEE Computer
Society, 1991.
[7] ISO, “ISO 9000 - Quality management systems -
Fundamentals and vocabulary,” 2000.
[8] G. Taguchi, Introduction to quality engineering: designing
quality into products and processes. Quality Resources
(Octubre 1986), 1986, p. 191.
[9] ISO/IEC, “ISO/IEC 9126-4: Software Engineering -
Software product quality - Part 4: Quality in use metrics,”
2007.
[10] A. García Frey, “Quality of Human-Computer Interaction :
Self-Explanatory User Interfaces by Model-Driven
Engineering,” Université de Grenoble, 2006.
[11] ISO/IEC, “ISO 9241-11: Ergonomic requirements for office
work with visual display terminals (VDTs) - Part 11:
Guidance on usability,” 1998.
[12] ISO/IEC, “ISO/IEC 25010, Software engineering - Software
product quality - Requirements and Evaluation (SQuaRE)
Quality model,” 2008.
[13] E. Gjørven, F. Eliassen, y J. Ø. Aagedal, “Quality of
Adaptation,” en Autonomic and Autonomous Systems, 2006.
ICAS’06. 2006 International Conference, 2006, vol. 00, no.
c, pp. 9–9.
[14] G. G. Schulmeyer, Handbook of Software Quality Assurance,
4th ed. Norwook, Massachusetts, USA: Artech House, 2008,
p. 485.
[15] N. Ashrafi, “The impact of software process improvement on
quality: in theory and practice,” Inf. Manag., vol. 40, no. 7,
pp. 677–690, Aug. 2003.
[16] V. López-Jaquero, J. Vanderdonckt, F. Montero y P.
González, “Towards an Extended Model of User Interface
Adaptation: the ISATINE framework”, en Proc. of
Engineering Interactive Systems, EIS’2007, 2007,
Salamanca, pp. 22-24.
315

UP4VED: Método de Desarrollo basado en el Proceso Unificado y en Buenas Prácticas para la Construcció n de
Entornos VirtualesJesús David Cardona Q.
Universidad Autónoma de Occidente Cll 25 # 115 – 85 Cali-Colombia
(057+2) 318 80 00 [email protected]
Luis Joyanes Aguilar Universidad Pontificia de Salamanca
campus Madrid-España (034+91) 5141700
David Alejandro Castro B. Universidad Autónoma de Occidente
Cll 25 # 115 – 85 Cali-Colombia (057+2) 318 80 00
ABSTRACT En este artículo se presenta una propuesta metodológica denominada UP4VED (Unified Process for Virtual Environment Development), una metodología de desarrollo que se fundamenta en el Proceso Unificado y en buenas prácticas para la construcción de entornos virtuales; la metodología recoge las mejores propuestas planteadas en las metodologías existentes para el desarrollo de Entornos Virtuales (EVs), las consideraciones especiales para su modelado, los pilares del proceso unificado, así como las sugerencias del estándar SPEM 2.0 de OMG. Además, se expone el desarrollo de una aplicación denominada “Plataforma Para La Generación Asistida De Entornos Virtuales (3DGEN)” que tiene como proceso metodológico a UP4VED.
Categorías y Descriptores temáticos D.1.1 [Applicative (Functional) Programming]: Software - Assisted generation platform for virtual environments; D.2.10 [Methodologies]: Design - Methodology for the development of virtual environments
Términos Generales Entornos Virtuales
Palabras Clave Virtual Environments, Software Engineering, Unified Process, UP4VED, SPEM 2.0.
1. INTRODUCCIÓN Desde el año 1962 cuando Morton Heilig realizó la primera aproximación a un sistema de Realidad Virtual (RV) con su Sensorama, han sido varios los autores que han intentado definirla ([1], [2]). Para Cruz por ejemplo, el término RV hace referencia “a un entorno generado por computador, tridimensional, centrado en el espectador, multisensorial, interactivo e inmersivo, y a la combinación de tecnologías para construir dichos entornos” [2]. La necesidad de generar ilusiones de experiencias en mundos virtuales con cierto grado de presencia, al mismo tiempo que se potencia el grado de inmersión, requiere la combinación de varias tecnologías tanto hardware, como software, que hace difícil que todas las aplicaciones que se desarrollan puedan catalogarse como un sistema de RV. Aparece por tanto, el concepto de Entorno Virtual (EV) para reunir aquellos entornos que recrean en una pantalla de computador un espacio real o imaginario en 3D, en donde no se busca la sensación de inmersión sino la interacción en tiempo real con objetos tridimensionales ([3], [4], [5], [6], [7]).
Los EVs, proveen un medio interesante para experimentar una gran variedad de situaciones que pueden ir desde la simulación científica, pasando por entornos de aprendizaje y entrenamiento. Se puede observar como a partir del abanico de aplicaciones, usos, forma y medio de acceso de los EVs, puede plantearse la necesidad de agruparlos o tipificarlos dentro de “categorías”, dando origen a los entornos colaborativos, sociales, en red, tiempo real o videojuegos, además de la posibilidad de combinarlos dependiendo del marco de aplicación en donde se requiere su convergencia. En los siguientes apartados se mostrará una recopilación del proceso para el desarrollo de la metodología UP4VED. Un panorama general, la estructura de UP4VED que se compone de las dimensiones del contenido del método, guía metodológica, finalizando con la presentación de una plataforma desarrollada con la metodología, así como las conclusiones del trabajo.
2. MODELADO DE ENTORNOS VIRTUALES Uno de los aspectos más importantes que debe considerarse a la hora de abordar el desarrollo de un EV, es lo relacionado con el modelado de aquellos aspectos propios de estos sistemas y que no se consideran explícitamente en el desarrollo de otro tipo de software. Además de modelar el aspecto de los distintos objetos de la escena, también se debe considerar la forma en la que éstos reaccionaran en el mundo simulado y cómo se comportarán dependiendo de las reglas que se hayan considerado de acuerdo al contexto de aplicación. Para entenderlo de una mejor manera, vale la pena considerar los distintos procesos que se ejecutan en el momento que se lanza un entorno virtual: entrada, despliegue, interacción, simulación comportamiento y carga de objetos. Debido a los procesos anteriores, aparecen algunos requisitos de modelado que se deben adelantar durante el proceso de desarrollo para garantizar el adecuado funcionamiento del sistema. Dentro de los tipos de modelado esenciales para el desarrollo de un EV, se encuentran: modelado geométrico, modelado cinemático, modelado físico, modelado del comportamiento (comportamiento inteligente) y modelado de la interacción.
2.1 Modelado Geométrico Este tipo de modelado siempre se debe realizar sin importar el tipo de EV a construir. El objetivo fundamental de este modelado, es determinar la forma y aspecto de los distintos objetos tridimensionales que formarán parte del EV. Debe permitir
316

determinar toda la información necesaria del objeto (en cuanto a forma y aspecto), que permita realizar operaciones de edición, visualización y cálculo de propiedades. Uno de los elementos clave, una vez se ha determinado con claridad los requisitos y restricciones para cada uno de los objetos del EV, es la selección del tipo de representación geométrica más adecuada dependiendo del contexto de aplicación y del tipo de comportamiento esperado del objeto dentro del entorno. Entre los tipos de representación geométrica más representativos se encuentran: modelos o representaciones de sólidos, modelado de superficies y blobby objects.
2.2 Modelado Cinemático A través de este tipo de modelado se busca definir el movimiento de los objetos dentro del EV independientemente de la causa del movimiento, es decir, solo se estudia la trayectoria del objeto a través del espacio. Según Choi, en el modelado cinemático se deben considerar los siguientes puntos: matrices de transformación homogénea, posición del objeto, jerarquía del objeto y visualización del mundo 3D.
2.3 Modelado Físico El objetivo principal del modelado físico es integrar cada una de las características de los objetos virtuales, tales como el peso, la inercia, el modo de deformación (elástico o plástico). El modelado físico debe considerar la detección de colisiones, retroalimentación de fuerza y la textura háptica, las dos últimas especialmente para el caso de sistemas de realidad virtual [8]: detección de colisiones, retroalimentación de fuerza y textura háptica.
2.4 Modelado de Comportamiento Se busca modelar el comportamiento que tendrán los objetos dentro del EV, considerando cada uno de los cambios como la posición, orientación, color, etc. [9]. Además del comportamiento de un objeto asociado a sus propiedades físicas o cinemáticas, también se debe tener en cuenta el comportamiento en cuanto a su nivel de inteligencia, es decir, las reacciones que deben tener los objetos que forman parte del EV. Por ejemplo, puede existir un objeto avatar para dar la bienvenida y orientar al usuario en un recorrido virtual. Aquí puede aparecer la necesidad de modelar el comportamiento de un objeto a través de lo que se conoce como agentes virtuales inteligentes, si se considera la solución más adecuada.
2.5 Modelado de la Interacción Es uno de los tipos de modelado más importante debido a que precisamente la interacción, es una de las principales características de un entorno virtual. Para que este modelado sea realizado con éxito, se tiene que definir detalladamente cual será el grado de interacción que tendrá el usuario con los distintos objeto 3D, teniendo en cuenta la posición y la orientación del objeto para que la escena se vea real y coincida con la orientación que tendrá el usuario dentro del EV. Además, debe considerarse el tipo de dispositivo de entrada y de despliegue para seleccionar la técnica más adecuada dependiendo de los requisitos del sistema y el contexto de aplicación.
3. UN PANORAMA GENERAL DE UP4VED UP4VED nace como propuesta para soportar el desarrollo de EVs, desde una mirada de la ingeniería del software y considerando las particularidades y retos que supone desarrollar este tipo de aplicaciones.
Este artículo presenta de forma general la propuesta metodológica y muestra las consideraciones que se tuvieron en cuenta para integrar no sólo los aspectos relacionados con el dominio de los EVs, sino también, su incorporación dentro del marco de un proceso de desarrollo genérico y prácticas asociadas a la ingeniería del software.
UP4VED plantea una estrategia fundamentada en la ingeniería del software para desarrollar EVs, así como la incorporación de buenas prácticas para desarrollarlos, con lo que se busca solucionar los inconvenientes que se han mostrado en el estado del arte y que se presentan comúnmente al final del proceso de desarrollo de un EV: EVs poco flexibles, monolíticos, arquitectura poco robusta, falta de documentación, carencia de mecanismos específicos para abordar las particularidades de modelado de este tipo de sistemas, así como, baja reutilización de sus componentes.
Una de las hipótesis de partida de la investigación planteaba que el uso de un proceso de desarrollo robusto, flexible, completo y estándar, convenientemente adaptado, mejora la construcción de entornos virtuales. Para el caso de UP4VED, se optó por el proceso unificado como modelo base sobre el cual soportar una nueva propuesta aplicada al contexto de los EVs.
Sin embargo, y a pesar de las bondades del proceso unificado, es posible plantear de forma general cinco grandes carencias del proceso unificado para el desarrollo de EVs, que no permiten gestionar adecuadamente los siguientes aspectos:
• Gestionar la interdisciplinaridad de los miembros del
equipo de desarrollo: Inclusión de nuevos roles que garantizan el adecuado desarrollo de las actividades propias y particulares del dominio, al mismo tiempo que se asegura una traza adecuada de las actividades a través de los roles en cada una de las disciplinas que se proponen.
• Reutilizar componentes propios de los EVs:
Incorporación de productos de trabajo dentro de las disciplinas de UP4VED, que permiten documentar y catalogar los distintos objetos 3D y multimedia que se desarrollan en un proyecto determinado. Estos registros, pueden servir para recuperar en un proyecto posterior aquellos elementos que se aproximen a los requisitos del entorno, lo que disminuiría tiempos de desarrollo. Es claro que no será posible en todos los casos reutilizar el cien por ciento de los modelos o componentes multimedia, pero los tiempos de ajuste y modificación pueden ser mucho menores que los de iniciar desde cero su diseño y construcción.
• Mejorar la comunicación entre participantes del
desarrollo: Inclusión de productos de trabajo adecuados que permiten la participación de profesionales expertos dentro del proceso de desarrollo de un EV, para definir
317
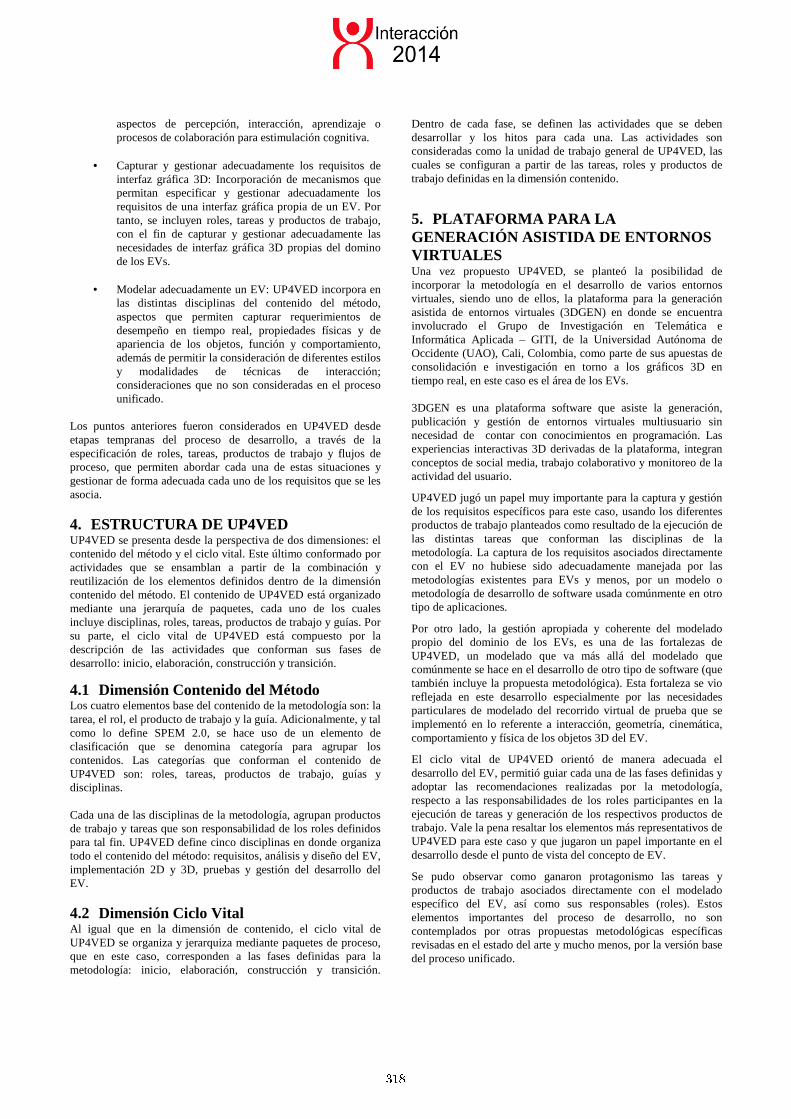
aspectos de percepción, interacción, aprendizaje o procesos de colaboración para estimulación cognitiva.
• Capturar y gestionar adecuadamente los requisitos de interfaz gráfica 3D: Incorporación de mecanismos que permitan especificar y gestionar adecuadamente los requisitos de una interfaz gráfica propia de un EV. Por tanto, se incluyen roles, tareas y productos de trabajo, con el fin de capturar y gestionar adecuadamente las necesidades de interfaz gráfica 3D propias del domino de los EVs.
• Modelar adecuadamente un EV: UP4VED incorpora en
las distintas disciplinas del contenido del método, aspectos que permiten capturar requerimientos de desempeño en tiempo real, propiedades físicas y de apariencia de los objetos, función y comportamiento, además de permitir la consideración de diferentes estilos y modalidades de técnicas de interacción; consideraciones que no son consideradas en el proceso unificado.
Los puntos anteriores fueron considerados en UP4VED desde etapas tempranas del proceso de desarrollo, a través de la especificación de roles, tareas, productos de trabajo y flujos de proceso, que permiten abordar cada una de estas situaciones y gestionar de forma adecuada cada uno de los requisitos que se les asocia.
4. ESTRUCTURA DE UP4VED UP4VED se presenta desde la perspectiva de dos dimensiones: el contenido del método y el ciclo vital. Este último conformado por actividades que se ensamblan a partir de la combinación y reutilización de los elementos definidos dentro de la dimensión contenido del método. El contenido de UP4VED está organizado mediante una jerarquía de paquetes, cada uno de los cuales incluye disciplinas, roles, tareas, productos de trabajo y guías. Por su parte, el ciclo vital de UP4VED está compuesto por la descripción de las actividades que conforman sus fases de desarrollo: inicio, elaboración, construcción y transición.
4.1 Dimensión Contenido del Método Los cuatro elementos base del contenido de la metodología son: la tarea, el rol, el producto de trabajo y la guía. Adicionalmente, y tal como lo define SPEM 2.0, se hace uso de un elemento de clasificación que se denomina categoría para agrupar los contenidos. Las categorías que conforman el contenido de UP4VED son: roles, tareas, productos de trabajo, guías y disciplinas.
Cada una de las disciplinas de la metodología, agrupan productos de trabajo y tareas que son responsabilidad de los roles definidos para tal fin. UP4VED define cinco disciplinas en donde organiza todo el contenido del método: requisitos, análisis y diseño del EV, implementación 2D y 3D, pruebas y gestión del desarrollo del EV.
4.2 Dimensión Ciclo Vital Al igual que en la dimensión de contenido, el ciclo vital de UP4VED se organiza y jerarquiza mediante paquetes de proceso, que en este caso, corresponden a las fases definidas para la metodología: inicio, elaboración, construcción y transición.
Dentro de cada fase, se definen las actividades que se deben desarrollar y los hitos para cada una. Las actividades son consideradas como la unidad de trabajo general de UP4VED, las cuales se configuran a partir de las tareas, roles y productos de trabajo definidas en la dimensión contenido.
5. PLATAFORMA PARA LA GENERACIÓN ASISTIDA DE ENTORNOS VIRTUALES Una vez propuesto UP4VED, se planteó la posibilidad de incorporar la metodología en el desarrollo de varios entornos virtuales, siendo uno de ellos, la plataforma para la generación asistida de entornos virtuales (3DGEN) en donde se encuentra involucrado el Grupo de Investigación en Telemática e Informática Aplicada – GITI, de la Universidad Autónoma de Occidente (UAO), Cali, Colombia, como parte de sus apuestas de consolidación e investigación en torno a los gráficos 3D en tiempo real, en este caso es el área de los EVs. 3DGEN es una plataforma software que asiste la generación, publicación y gestión de entornos virtuales multiusuario sin necesidad de contar con conocimientos en programación. Las experiencias interactivas 3D derivadas de la plataforma, integran conceptos de social media, trabajo colaborativo y monitoreo de la actividad del usuario.
UP4VED jugó un papel muy importante para la captura y gestión de los requisitos específicos para este caso, usando los diferentes productos de trabajo planteados como resultado de la ejecución de las distintas tareas que conforman las disciplinas de la metodología. La captura de los requisitos asociados directamente con el EV no hubiese sido adecuadamente manejada por las metodologías existentes para EVs y menos, por un modelo o metodología de desarrollo de software usada comúnmente en otro tipo de aplicaciones.
Por otro lado, la gestión apropiada y coherente del modelado propio del dominio de los EVs, es una de las fortalezas de UP4VED, un modelado que va más allá del modelado que comúnmente se hace en el desarrollo de otro tipo de software (que también incluye la propuesta metodológica). Esta fortaleza se vio reflejada en este desarrollo especialmente por las necesidades particulares de modelado del recorrido virtual de prueba que se implementó en lo referente a interacción, geometría, cinemática, comportamiento y física de los objetos 3D del EV.
El ciclo vital de UP4VED orientó de manera adecuada el desarrollo del EV, permitió guiar cada una de las fases definidas y adoptar las recomendaciones realizadas por la metodología, respecto a las responsabilidades de los roles participantes en la ejecución de tareas y generación de los respectivos productos de trabajo. Vale la pena resaltar los elementos más representativos de UP4VED para este caso y que jugaron un papel importante en el desarrollo desde el punto de vista del concepto de EV.
Se pudo observar como ganaron protagonismo las tareas y productos de trabajo asociados directamente con el modelado específico del EV, así como sus responsables (roles). Estos elementos importantes del proceso de desarrollo, no son contemplados por otras propuestas metodológicas específicas revisadas en el estado del arte y mucho menos, por la versión base del proceso unificado.
318

Otras funcionalidades requeridas como la gestión de usuarios y gestión de objetos del EV, fueron especificadas y modeladas a través de los productos de trabajo definidos para tal fin y que corresponden a las salidas de las distintas tareas que debían realizarse en cada una de las fases del ciclo vital.
UP4VED mostró su potencial con el desarrollo de este primer EV puesto que facilitó la adecuada captura de los requisitos funcionales propios de los EVs, así como los asociados a los módulos de gestión requeridos. Las consideraciones de modelado y su afinamiento a los largo del ciclo vital, no revistieron complejidad debido a los productos de trabajo incorporados dentro del marco de la propuesta.
Finalmente, al contar con un proceso documentado que permite hacer traza del proceso, así como la definición clara de cada una de las necesidades específicas de modelado a través de los distintos productos de trabajo planteados y ajustado a las necesidades de desarrollo de este tipo de aplicaciones, facilita el desarrollo de nuevas funcionalidades que permitan el uso la plataforma para otros contextos de aplicación como la identificación de riesgos en escenarios o para su integración a plataformas E-Learning.
6. CONCLUSIONES La conceptualización de entorno virtual y la identificación de los elementos clave de modelado para este tipo de sistemas, se complementa con una revisión completa de las propuestas existentes para el desarrollo de entornos virtuales. Esta información, se puede decir, forma parte hoy en día, de una de las fuentes más completas alrededor del concepto de entorno virtual y de los modelos de proceso existentes para soportar su desarrollo. La identificación de las debilidades de las propuestas de desarrollo existentes para soportar la construcción de entornos virtuales, descritas anteriormente, mostraban la necesidad de abordar la problemática desde la mirada de la ingeniería del software, por tanto, el paso que seguía era determinar si las metodologías genéricas de desarrollo de software se ajustaban a las necesidades particulares de los entornos virtuales. La investigación abordó esta situación, realizando una revisión de las metodologías genéricas para el desarrollo de software, profundizando en el proceso unificado por su madurez dentro de la industria del software y por las distintas propuestas que se han realizado a partir de sus pilares.
La utilización de UP4VED en el desarrollo de varios proyectos, ha permitido ir consolidando la metodología y mostrando su potencial para asistir el desarrollo de entornos virtuales, en especial, se destaca el proyecto 3DGEN como plataforma que ha recibido reconocimientos y que actualmente se encuentra en etapa de validación en el mercado.
Finalmente, se está planteando como trabajo futuro, proponer una versión más ligera de UP4VED, que permita su fácil adopción en pequeños equipos de desarrollo, así como para situaciones en las que la evolución y adaptación del producto de acuerdo al surgimiento de nuevos requerimientos o modificaciones de los existentes, ocurre durante el proceso de desarrollo de un entorno virtual.
7. REFERENCIAS [1] Gigante, M.A., Virtual Reality: definitions, history and
applications, in Virtual Reality Systems, ed. by R.A. Earnshaw, M.A. Gigante, H. Jones. London: Academic Press, 1993.
[2] C. Cruz-Neira: Virtual Reality Overview. SIGGRAPH’93 Course, No 23, pp. 1.1-1.18. 1993.
[3] Kim, G. Designing Virtual Reality Systems: The Structured Approach. Springer. 2005.
[4] Stuart, R.: The design of virtual environments, New York: McGraw-Hill, 1996.
[5] Singhal, S. y Zyda, M.: Networked Virtual Environments: design and implementation, ACM Press. 1999.
[6] Ellis, S., What are virtual environments?, en IEEE Computer Graphicsand Applications, vol. 14, no. 1, 1994, pp. 17-22.
[7] Vince, J., Virtual Reality Systems, Addison-Wesley, 1995. [8] Burdea, G. y Coiffet, P. Virtual Reality Technology," 2nd Ed.,
John Wiley & Sons, Inc., 2003. [9] Alexandre, T.: "Using Design Patterns To Build Dynamically
Extensible Collaborative Virtual Environments" En: 2nd international conference on Principles y practice of programming in Java 21-23, 2003.
[10] Kim, G., Kang, K., Kim, H. y Lee, J.: “Software Engineering of Virtual Worlds” En ACM symposium on virtual reality and technology. 1998.
[11] Lozano, M. Departamento de Informática, Universidad de Valencia - Entornos virtuales 3D clásicos e inteligentes: hacia un nuevo marco de simulación para aplicaciones graficas 3D interactivas. Revista Iberoamericana de Inteligencia Artificial, Vol. 8, Nº. 23, 2004 , pags. 85-94. 2003.
[12] Bouras C. y Filopoulos A. Distributed virtual reality environments over web for distance education. University of Patras, Computer Engineering and Informatics Department, Grecia. 2005.
[13] Brutzman D., Zyda M., Watsen K., Macedonia M. Virtual Reality Transfer Protocol (vrtp) Design Rationale. Workshops on Enabling Technology: Infrastructure for Collaborative Enterprises (WET ICE): Sharing a Distributed Virtual Reality, MIT, Cambridge Massachusetts, June, 1997.
[14] Burdea, G. y Coiffet, P. Virtual Reality Technology," 2nd Ed., John Wiley & Sons, Inc., 2003.
[15] De la Rosa, F.; Córdoba, E. y Cardona, J.D. “Entorno Virtual de Aprendizaje como apoyo a la Educación a Distancia" en Revista de Investigación Interdisciplinaria, Innovación de productos, materiales y automatización de procesos industriales. Universidad Nacional, Colombia. ISSN 20112416. Número 4. 2013.
[16] Lionel Bennes, Florence Bazzaro, and Jean-Claude Sagot. 2012. Virtual reality as a support tool for ergonomic-style convergence: multidisciplinary interaction design methodology and case study. In Proceedings of the 2012 Virtual Reality International Conference (VRIC '12). ACM, New York, NY, USA, , Article 24 , 10 pages.
[17] Jinseok Seo and Gerard Jounghyun Kim. 2004. Explorative construction of virtual worlds: an interactive kernel approach. In Proceedings of the 2004 ACM SIGGRAPH international conference on Virtual Reality continuum and its applications in industry (VRCAI '04). ACM, New York, NY, USA, 395-401.
319

Learning with an IT tool: analysis of the student’s activity
Jean-François Hérold Aix Marseille Université, ADEF EA 4671
13331, Marseille, France
+33 (0)4 91 10 75 75
ABSTRACT
In France, more and more teachers use an IT tool in their
teaching sequence. This raises the question of the
effectiveness of this type of tool for student learning. In order
to answer this question, we initiated a research program to
determine the elements to be taken into account to ensure the
effectiveness of the teaching-learning process with an IT tool.
For this, we rely on an analysis of student activity in the
classroom, through the main results given by the theory of
cognitive load. We present in this paper the results of three
experimental studies.
General Terms
Performance, Design, Human factors, Theory
Keywords
Information Technology – Learning – Interaction – Analysis
of activity – Cognitive load theory
1. INTRODUCTION
The research presented in this paper focuses on the analysis of
the interactions between the learner and the information
technology (IT) tool used in the teaching situation. This paper
outlines a research work to explore the use of IT tools in
teaching situations. In such teaching situations, according with
ergonomic studies from research works, learners have to know
how to use the IT tool (the “procedural process”) and to know
why to use this tool (the “meaningful process”), and if we
analyze this, we can define which kind of knowledge students
need to use IT tool, to search information and to use it
(Ginestié, 2013).
In France, the different curricula of the National Education
emphasize the use of IT tools in the classroom. As Baron &
Bruillard (1997) say, in the school context, information
technology corresponds to different uses like educational
technology (multimedia software, Internet), software tools
used in school work, office automation software (word
processing software, spreadsheet …). In such case, teaching
situation with an IT tool becomes a system where entities like
student, teacher and IT tool are in interactions. These
interactions cannot be understood in a simple way. One
possibility is then to analyze the activity of these actors in real
time in the teaching situation instrumented with an IT tool,
especially to analyze the learning undertaken by learners, or
not, during their activity (Ginestié, 2013). It is then, in
particular through the analysis of the activity of the student, to
determine what elements of the teaching situation interfere
with learning, those that promote learning, in order to better
use IT tools in the classroom.
This paper aims to show that according to how IT tools are
implemented by teachers in the classroom, it may be
limitations in the effectiveness of student learning. So, it is
necessary to identify what are the elements of the IT tool that
the teacher has to take into account to ensure a certain
effectiveness of the teaching-learning process for the students
: knowledge about the use of the software, characteristics of
the HMI (Human-Machine Interface), nature of the help
(Hérold, 2008, 2012). A cognitive analysis of the activity of
students allows understanding some indicators of learners’
profiles, with a good efficiency from the viewpoint of learning
and answers to the needs of learners (Ginestié, 2013). The
cognitive analysis is based on how students do the task in
according to the learning of knowledge referred (Hérold,
2012). So, a cognitive analysis of the activity of students is a
possibility to identify the elements of the IT tool that helped
students or prevent them from doing the prescribed task, by
highlighting knowledge used by students, their skills; and
thus, to ensure a certain effectiveness of the teaching-learning
process with the IT tool.
2. THE TEACHING-LEARNING PROCESS
WITH AN IT TOOL-BASED
ENVIRONMENT
The use of an IT tool in a learning situation often involves, for
the student, to have to perform two tasks: the learning task
corresponding knowledge covered by the teaching situation
and the task of using IT tool used in the teaching situation
(Amadieu & Tricot, 2006). If the student does not have
320

sufficient knowledge to perform these two tasks, then she/he
will be very quickly in cognitive overload (Sweller, 2010),
especially if the prescribed task requires some time to be
achieved by the student (Barrouillet et al., 2004). So the
student does not learn if it is a learning phase or she/he fails if
it is an activation phase of knowledge. Indeed, Sweller’s
cognitive load theory is a psychological theory which takes
into account phenomena of cognitive overload in learning
activities. Sweller raises the question of what are the elements
of the learning situation which the student learns or does not
learn. Especially, an analysis of the consequences of the
various cognitive load effects in terms of element interactivity
is discussed (Sweller, 2010).
Therefore make use of an IT tool for students in the
classroom, requires the teacher, or the designer of IT tools, to
analyze the prescribed task in order to take into account the
possible extraneous cognitive load imposed by the use of the
IT tool due to a lack of knowledge to effectively help students
in their learning. Extraneous cognitive load is cognitive load
that is not necessary for learning and that can be altered by
instructional interventions (Van Merrienboer & Sweller,
2005). This kind of cognitive load is due to activities that do
not contribute to do the main activity (like solving a problem,
design a part, for instance).
Also, the research questions are how the use of an IT tool
facilitates or impedes learning; what knowledge of the IT tool
the student must have to learn the target knowledge of the
teaching situation with an IT tool.
The research presented in this paper tries to answer these
questions by analyzing the activity of students in class.
Analyze the activity of students in class with a cognitive
approach is:
- to understand what knowledge they use to perform the
task, that knowledge is appropriate or not, what skills
they implement to try to solve the problem of the
prescribed task;
- to highlight times when students are in a deadlock and, in
that case, what are the cognitive processes that redirect
their activity.
To illustrate this, we present three studies: two exploratory
studies, one on the use of Solidworks and one on the use of a
software selection of parts in the design of a refrigeration
system; and a study on the use of Excel spreadsheet in class.
3. EXPERIMENTATIONS
3.1. Exploratory studies
The methodological device used for the two exploratory
studies is to observe students’ difficulties to perform the tasks
during a teaching sequence. Observational data collected
about students’ activity are mainly about the understanding of
the instructions (by moving quickly into action), the self-
confidence (students are working continuously, without give
up) and their skill to collect the data to solve the problem of
the prescribed task.
3.1.1. A study on the use of Solidworks
Solidworks is a 3D design software mainly used for the design
of mechanical parts. It is also used for the simulation
(deformations of parts, assembly ...). In education, in France,
Solidworks is used in Technology education and in some
professional training.
The study was conducted with students in Technology
education (8th grade, thirteen- fourteen years old students). We
observed the activity of twelve students during a teaching
sequence devoted to a rapid start of the software Solidworks
(time used in this activity: fifty minutes). The teacher had
planned a task of designing a simple mechanical part and gave
explanations on the use of software as and as students
progressed in their task performance (“learning by doing”
principle).
The students had a lot of difficulties in doing the job. Students
often accosted their teacher to request additional information
on using the software, where they had to click, which icon
should be used. Most of the students were in a deadlock
without possibility to do something else. Therefore, the course
was much parceled; students learned little.
We then proposed the teacher to change the banner icon HMI
to suit the students' knowledge as and when they are learning.
After analyzing the prescribed task, we defined, with the
teacher, which icons should be displayed at each phase of the
exercise. At the beginning of the exercise, the students have
thus a minimal interface, and new icons were introduced by
the teacher as and when required by the task at hand. At the
end of this second version of the sequence of instruction, all
students were able to do the job.
Here, so, it is the extraneous cognitive load imposed by the
nature of the HMI software application which penalized
students. Many icons in the taskbar software, due to the fact
that the software has many features, hampered students in
their learning task by imposing a high cognitive load. In
limiting icons strictly necessary, ie the icons that the student
needs to do the task at a given time, the extraneous cognitive
load imposed by the nature of the HMI is strongly reduced. As
a result, that frees cognitive resources for the student, which
allows him to do the exercise, and so, to learn.
By introducing the useful icons as the work of students
progresses, students more easily learn new software features
(principle of the guidance fading effect of the cognitive load
theory; see Renkl’s research findings, Renkl et al. (2000,
2002), for instance). Also, since at the beginning students are
totally beginners in using the software, they need to be
strongly guided. In that case, teaching provides to the students
scaffolds for doing the task with meaningful learning (Bruner,
1983), in carrying out the elements of the task for which
students do not yet have all the necessary knowledge.
3.12. The design of a refrigeration system
Twelve students (11th grade, sixteen-seventeen years old
students) participated in this experiment. These are students
who were learning to become a technician in industrial
refrigeration systems.
The experiment consisted in producing a training sequence
dedicated to the selection of a compressor for a refrigeration
system. The researcher collaborated with the teacher in order
to discuss a specific activity. Two versions of the training
sequence have been made. In the first version, students used a
paper catalog. In the second version, the students had access
to a parts’ selection software of the same manufacturer.
Prescribed task was to select a compressor whose
characteristics meet the constraints of the specifications of the
refrigeration system and design the system. The students had
four hours to do the work. They worked alone, independently.
The teacher answered students' questions when necessary.
The main results show that students have a lot of trouble
finding the information in the catalog. They fail to select the
321

right information, sometimes written down the page.
Furthermore, information needed to choose the right
compressor were on different pages of the catalog. Also four
students have not selected the correct compressor, eight
students have selected a compressor meet the performance
criteria. But no student has succeeded in the correct
dimensioning of the installation (incorrect installation
diagram, some specifications have not been taken into account
...). This is mainly due to the fact that students were forced to
browse the catalog to find all the information needed to design
the system. Also, they did not take into account certain
important parameters. With the catalog, the synthesis is on the
responsibility of the student, which is difficult, therefore
cognitively expensive task.
For the version of the training sequence with the selection
software, students were much more successful. All students
have chosen the right compressor and proposed an operational
system. Informations relevant to a good selection of different
elements of the system have all been taken into account. Only
one student made a mistake on the pressure reducing valve.
With the selection software, research methodology
information has been properly respected. Students were
quickly felt comfortable with the software, even students in
greatest difficulty. They easily understand the running of the
plant through the block diagram generated by the application.
This success is mainly due to the fact that it is the software
that makes the synthesis. The student gives the operating
conditions of the system and is guided by the software to
make the necessary choices. Extraneous cognitive load is
lower in this case. The student can thus devote more cognitive
resources to complete the exercise. However, it is necessary
that the teacher makes a presentation using the software.
3.2. The use of Excel spreadsheet at school
In a certain number of education sections, spreadsheets are
often used because they are one of the IT tools that students
will have to use in their future career. But a spreadsheet is first
and foremost software which is used by people who know the
using of a spreadsheet, who understand jobs that require using
IT of this kind. The software developers of the IT tool
spreadsheet think that these users have, or are presumed to
have, a mastery of the concepts of arithmetic averages, data
extraction and classification, connectives. However, the
spreadsheet is used in class as a tool in a teaching sequence.
At school, the student has to learn how to use the software,
whilst also being required to learn the concepts of the
profession, to solve the problems set by the teacher in the
context of learning tasks or evaluations. As a result, the use of
a spreadsheet in activities of this kind forces the student to
learn, to master how a spreadsheet works and to solve the set
problem. If the student does not have the necessary knowledge
to use the spreadsheet and solve the problem of the prescribed
task, then she/he finds her/himself quickly in cognitive
overload, and she/he cannot learn.
In this study, we analyzed the students’ activity in order to
know the strategies effectively used by students when using
the spreadsheet. In this analysis of the students’ activity, we
are trying to find out what knowledge they used and what
evaluations they carried out on the result of the procedures
used. This study was conducted for eight 17-18 years old (12th
grade) in a vocational secondary marketing school. Eleven
questions were put into an Excel file, where each spreadsheet
represented a question. Each question was of varying
difficulty and looked at formats for representing data, using
graphs, the use of single and multiple sorting. Each session
lasted for an hour. The students did the same test on the
spreadsheet with the same displayed toolbar.
Data collections for process analysis have been done with
records of detailed view of the uses of spreadsheets. To
capture all actions appearing on the screen during interaction,
the software Camtasia Studio© by TechSmith was used. A
free video player is used to re-play all recorded videos. These
data were triangulated with direct observations (field notes).
Just after the record, every student was able to view and
observe their own ''path'' with the help of the mouse video
with the possibility to comment them at loud voice. All the
remarks were transcribed. So, researches data consist of
mouse videos, transcribed group discussions and interviews.
Results show that the student is in great difficulty or not, the
student uses prior knowledge after a mental representation
change when she/he doesn’t know to do the task, or
sometimes after an evaluation of her/his actions. These prior
knowledge have been built in other situations than those using
spreadsheets. So, they are not fitted to situations using
spreadsheets. With ''Copy/Paste'' for instance, you copy the
formula and not the cell content. Therefore, before using a
spreadsheet to solve problems, the student has to know the
spreadsheet functions needed to do the task. So, when students
use a spreadsheet, students need to know how it works, the
specific form it takes.
The use of a spreadsheets by a student in classroom with
learning tasks represents a cognitive overload due to the
extraneous cognitive load (Van Merrienboer & Sweller,
2005), which may be higher or lower depending upon the
student’s knowledge of the spreadsheet tool. This extraneous
cognitive load will be reduced if the student possesses enough
specific knowledge about spreadsheet, and will allow
cognitive resources to be called upon to do the task. So, the
student must have built some “spreadsheet procedural
knowledge”. But she/he does not need to know all the
functions, only those that are useful in solving the problem
will be used.
Furthermore, results show the help of the software is not
useful to students, it is a help for people who know the using
of a spreadsheet. So, the vocabulary and syntax structures
need to be adapted for students. Therefore, learning how to
use this help, how to understand it, is necessary.
4. CONCLUSION
The first results of our research presented in this paper show
that the use of an IT tool can either be a hindrance or an
obstacle to learning, or, conversely, help learning for students.
Therefore, it is necessary to precisely identify the elements of
use of an IT tool in class. The effectiveness of the teaching-
learning process with an IT tool will then depend on the
relevance of this preliminary analysis.
Research work in this direction is underway. We choose as
study framework the use of software-assisted learning in
algorithms or computer languages learning sequences, for
students of the first year of higher education (Ovono et al.,
2014).
So, a better understanding of human-machine interactions is
necessary. Specifically, teacher must have a new role as
situations’ manager rather only knowledge referent (Ginestié,
2013). That is why it is necessary to develop understanding
about IT tools in class in order to imagine school situations
that allow students elaboration of operational tools they
322

master, notably about the significant knowledge they need to
give meaningful to their learning.
This better understanding of human-machine interactions is
necessary especially for the design of intelligent tutoring
system.
5. REFERENCES
[1]
[2]
[3]
[4]
[5]
[6]
[7]
[8]
[9]
[10]
[11]
[12]
Baron, G. L., and Bruillard, E. 1997. Information
technology in French education: implications for
teacher education. Journal of Information
Technology for Teacher Education, 6:3, 241-254.
DOI: 10.1080/14759399700200016
Ginestié, J. 2013, 2-6 December. Giving meaning to
the use of tools: some elements of discussion about
ICT in the French curriculum of technology
education. Paper presented at the 27th PATT
Conference, Christchurch (New-Zealand).
Hérold, J.F. 2008. Conception et réalisation d'un outil
informatisé d'aide à l'apprentissage. In M. Sidir, G.-
L. Baron and E. Bruillard (Eds.), Journées
Communication et Apprentissages Instrumentés en
Réseau (pp. 265-276). Paris: Hermès France.
Hérold, J.F. 2012. Analyse cognitive de l’activité de
l’élève pour une personnalisation d’un
environnement numérique d’apprentissage. Revue
STICEF, 19, 285-307.
Amadieu, F., and Tricot, A. 2006. Utilisation d'un
hypermédia et apprentissage : deux activités
concurrentes ou complémentaires ? Psychologie
française, 51, 5-23.
Sweller, J., 2010. Element interactivity and intrinsic,
extraneous, and germane cognitive load. Educational
Psychology Review, 22, 123-138.
Barrouillet, P., Bernardin, S., and Camos, V. 2004.
Time constraints and resource sharing in adults’
working memory spans. Journal of Experimental
Psychology, 133(1), 83-100.
Van Merrienboer, J. G., and Sweller, J., 2005.
Cognitive load theory and complex learning: recent
developments and future direction. Educational
Psychology Review, 17(2), 147-177.
Renkl, A., Atkinson, R., and Maier, U. H. 2000.
From studying examples to solving problems: fading
worked-out solution steps helps learning. In L.
Gleitman and A. Joshi (Eds.), Proceedings of the
22nd Annual Conference of the Cognitive Science
Society (pp. 393-398). Mahwah, NJ: Erlbaum.
Renkl, A. 2002. Worked-out examples: instructional
explanations support learning by self-explanations.
Learning and Instruction, 12, 529-556.
Bruner, J. 1983. Le Développement de l'enfant :
savoir faire, savoir dire. Paris : Presses
Universitaires de France.
Ovono, M. S., Hérold, J.F. and Ginestié, J. 2014.
Introduction d’un logiciel de simulation
d’algorithmes dans le processus enseignement
apprentissage de l’algorithmique chez les apprenants
débutants de l’ENSET de Libreville. Paper presented
at the 4e colloque International du RAIFFET
« Éducation technologique, formation professionnelle
et formation des enseignants », Marrakech (Maroc).
323

Generic Classifier Potential Users of Visual Systems Laura Patricia Ramírez Rivera Risto Fermin Rangel Kuoppa
UAM-Azcapotzalco UAM-Azcapotzalco
Av. San Pablo No. 180 Av. San Pablo No. 180 C.P. 02200 D. F. México C.P. 02200 D. F. México
Tel: +52 (55) 5318-9000 Tel:+52 (55) 5318-9000
[email protected] [email protected]
[email protected] [email protected]
ABSTRACT
The area of visualization has been widely developed since it
provides users the capability to obtain and assimilate information
from complex data, therefore a lot of applications and systems that
generate such views have been created. Still, certain questions
have not been fully answered yet, for example, what kind of
visualization can be more useful in certain types of users? or
which displays for different deployments are better accepted?
Such problems are highly related to the design of graphical user
interfaces which involve obtaining key features that allow us to
differentiate user productivity observed depending on the type of
display and deployment tendencies. The study we are reporting is
intended to include the analysis of mental processes developed by
the user in order to characterize and to record the actual
productivity gained.
Categories and Subject Descriptors
H.5 [Information Interfaces and Presentation]: Miscellaneous
General Terms
Human Factors
Keywords
Visual systems, user classification, mental model.
1. INTRODUCTION This project is set to obtain a classification of various types of
users who need to use a visual system; a visual system is defined
as an information system whose purpose is to display views that
represent some type of numeric data. This classification should be
performed taking into account the needs, tastes and abilities of
users. To perform the classification we used sample group defined
by age, gender, prior knowledge, etc.
Scientific visualization is an area responsible for processing
complex data in order to obtain a display that helps users obtain
information from the data. There are many types of displays
directed to different areas of research. Scientific visualization
should teach, develop and disseminate scientific visualization
tools to help researchers.
Researchers working at different areas of a country can improve
their collaboration by using computers; unfortunately this
involves an extra cost that sometimes not everyone nor every
institution can deal with.
2. BACKGROUND
The background of this project is based in the experience of one
of the authors while she was working with video walls (A video
wall is a large display and high resolution formed by a group of
screens) during her PhD studies [Ramirez-13]
Video walls are a scientific-visualization tool that enables the
deployment of high resolution visualizations over a large are. One
advantage provided by such tool is that it enables the user or users
to visualize large amounts of digital data as they are rendered on
various displays for easier understanding. In addition to its large
size the video wall used in the research includes a surround
environment that enhances the user's attention.
Most video wall applications are created to solve specific
problems. After analyzing each problem it is possible to obtain a
hierarchical abstraction of the problem to identify the major
components necessary in the development of its visualization
applications; the development of such applications is complicated
because it involves various aspects (display, networking, human-
computer interaction, etc.). Unfortunately, the nature of research
itself makes impossible to have a standard template to generate
any kind of visualization application. Although generalized
functions can be obtained due to common functionality.
Generalized functions can be identified irrespectively of the final
application and be applied to an initial model. The use of such
model can be used in the construction of distributed interfaces but
would require an interface handler. The handler would facilitate
the deployment of any type of display environments in video
walls. One of the authors thesis proposed a model based on the
object-oriented paradigm that will create a distributed window-
manager.
The proposed model is based on layers, where each layer is
responsible for performing each of the generalized functions. The
window manager creates a distributed remote desktop, facilitating
generation of applications for video walls. The main components
of the model are distributed visual objects, which have their origin
in the composition of distributed objects and visuals.
Another precedent of the research done is one of the authors
master's project [Ramirez-08] that involved purchasing the video-
wall hardware for its construction. The construction of what is
now known as CinvesWall (video wall located at Cinvestav
laboratories) allowed the generation of applications that accept the
rendering of high resolution visualizations. One of the first
applications developed in CinvesWall was a Visual Data Mining
Permission to make digital or hard copies of all or part of this work for
personal or classroom use is granted without fee provided that copies are
not made or distributed for profit or commercial advantage and that
copies bear this notice and the full citation on the first page. To copy
otherwise, or republish, to post on servers or to redistribute to lists,
requires prior specific permission and/or a fee.
324

(MDV), developed in order to obtain data from various sources
and generate the Pearson correlation. Mining can displaying
multiple windows containing 3D spheres with information related
to mean, variance and standard deviation of an input dataset.
Windows were controlled by a mouse (see Figure 1).
Figure 1. Cinveswall
Both projects were aimed at creating a base component that could
become the basis for a distributed window manager. The window
manager is responsible for allowing any type of application to be
displayed on the video wall.
Many application tests were conducted, most of the cases, the
problems of user interaction were evident. The usability of
applications in such environments has not been fully described.
These usability problems seem to keep away scientists that could
otherwise make use of scientific visualization and improve their
results. To overcome usability issued we began constructing the
mental models generated by the video-wall users [Soren-05].
There are studies that attempt to characterize video walls through
their advantages and disadvantages compared to other forms of
deployment, Elaine [Elaine-06] discussed the behavior of users
considering collaborative systems that work on video walls.
George [George-00] defined a desktop in three dimensions to
improve user interaction with large displays. Dan [Dan 07]
conducted an evaluation of various interfaces for users of many
systems try to identify the characteristics that make an interface is
good. What one of the authors proposed was to start the research
from the user's perspective. Knowing what type of data used, what
type of deployment required, which display achieves better
understanding of the results, so that at the end it is possible for us
to identify the user and provide full implementation and the
deployment needed. The research involves scientific visualization
supporting other disciplines to improve their performance through
appropriate use of technology, and to avoid, as far as possible, to
worry about learning a new tool. Researchers need a familiar and
simple application to use. To achieve such goal it is necessary to
obtain a classification of the potential users of a visual system
from different perspectives (taking the specific characteristics of
each user) in order to obtain a generality towards defining a model
of user behavior visual systems (mainly scientific visualization).
3. OBJECTIVES For this project it is very important to recognize the type of users
requiring a visualization system. The users were differentiated by
the type of data they use and the deployment needs. The
hypothesis of this project is that one can obtain a classification of
different types of visualization-system users based of generalized
functions. Therefore the main objective of this project is to obtain
a generic classification of the visualization-system users while
taking into account most of the required features.
Particular objectives are:
• Determine the most important characteristics of a generic user.
• Define user groups and subgroups to be considered within the
classification of users.
• Define the skills of the users regarding the visual systems to
consider.
• Define a generic classification of user characteristics, taking into
account the above definitions.
3.1 Methodology We propose the following methodology to achieve the
classification:
• Research classifications of visualization system users.
• Conduct analysis of classifications previously investigated,
obtaining the most important aspects.
• Conduct analysis of each characteristic evaluated in previous
classifications.
• Define a classification that takes into account the characteristics
considered most relevant to the visualization systems.
• Evaluate the classification with real users.
4. FIRST APPROACH USER CLASSIFIER
The first approached that we obtained was a user classification in
Online Communities [Adi-12]. The classifier built in that case
made division of web activities. Those activities were
to answer public questions using the online services,
make questions and wait responses. User features were topic
knowledge, politeness, etc. because such features describe the
user type. We defined a classifier as a conceptual diagram that
summarized the perspective of online communities (see figure 2).
Figure 2. User classification in Online Communities.
The user profile definition includes interests, characteristics,
behaviors and preferences. The construction of the user behavior
profile was online mode of data stream, and they extract an
ordered sequence for recognizing events. They present the
classifier as a mapping from the features space to the class label
space. The feature space was defined by distributions of event
subsequences. The class label space represents a specific behavior
which is one of the prototypes proposed (see figure 3).
325

Figure 3. Construction of the user behavior profile.
4.1 User classification of visual systems
The main features we took into account were data kind, and
visualization kind per data. We can explain better this perspective
showing the relationship that exists between both data and
visualization data (see figure 4).
Figure 4. User classification of visual systems.
Additionally we matched data and its appropriate visual
representation. In order to get the knowledge from the data-
representation relation (see figure 5), we had to explain our
experience with the mental model of large displays users.
Figure 5. Relationship between user and knowledge.
4.2 User experiences building mental model
for large display
The CinvesWall is our large display used in testing. Introducing
user to CinvesWall causes curiosity and many people want to
use it. Most of the users were school-aged children visiting
Cinvestav installations. In groups of 12 to 18 years old their
first impression was similar, they asked: “Can I play a video
game or watch a movie in it?” They, probably, think in video
games and movies most of time and when they see a large
displays they related them to movies. Although, 12-18 aged
groups lost interest when formal explanations started. Older
groups made questions such as: “How do I use it? How can I
manipulate it?” The students started to manipulate the
application when they were told about the centralized manager.
Although, most of them seemed to be disappointed when they
realized the distributed application was a simple drawing
software.
Users’ response changed drastically in the 19-25 years range.
They did not have problems interacting with the visualization
server but when the interaction was directly with the large
display using the input device that makes the moves recognition
they appeared somewhat intimidated for the size of the display
in front of him. The questions made in that case were: How does
it works? Who use that kind of display?
The user mental-model of the last type of user is close to the real
functionality of the large display and previous knowledge
helped them understand that the large display was created to
provide functionalities of scientific visualization. Once users
learnt to manipulate the application they felt they were just
working with a big mouse instead of the little desktop type.
Maybe if they would have started interacting with the input
device they would not feel the difference so drastically but we
have left that for future research.
Other types of users were invited to use the video wall: grad
students and other faculty/researchers. Grad students did not
want to even try the video wall. Why this behavior? The
students argued they had homework and exams and they did not
want waste time trying to operate a large display if that did not
represent some help for them (homework and exams). This
means that they could not build a good mental model of the
large display because if they would have paid attention they
would have understood that they could use the video-wall tool
to understand complex ideas and visualize data to work with
more students. This means they did not use the tool because
they did not know the help it could provide. Older people that
had never used a large display kept their initial idea that video-
walls are just toy for kids watching movies or playing video
games. Only people that really understood how the video-wall is
used and its benefits built a good mental model.
4.3 Explanation of large display features
The video-walls’ features that provide benefits in the user
productivity are many but in this part we explain only those that
demonstrate the importance of the tool.
Figure 6. The large display wraps the user focusing his attention.
The first feature is defined by the human behavior (see figure 6).
The user cannot get distracted because his visual field is
completely covered by the video-wall and he has to watch some
data on it. This behavior can be exampled as some person is
watching pictures in the wall of the gallery, he can watch one or
more pictures in the same wall and naturally he is able to be closer
of his favorite but what occurs when in the gallery is a mural. All
persons that see it feel an attraction to be close to it. And when
they were in front of it they only put attention on the mural. They
326

can move the head left and right and they only can see some part
of the mural.
Figure 7. The large display shows information for many users
simultaneously.
The second feature is used in collaborative environments (see
figure 7). This feature follows the principle of two heads think
more than one. The large display enables more than one
simultaneous user. A human behavior related to this feature is
when a person looks something and cannot understand what is
happening with it. He calls someone for taking his
opinion in trying to get knowledge of the phenomena. When many
ideas are taken into account it is possible to create a concept that
use the perspective of different experts from the same area.
Figure 8. The large display shows different perspectives at the
same information.
The third feature is focus in the kind of visualization that can be
showed (see figure 8). Each user has a favorite type of data
visualization and problems may occur when multiple users use the
same display. This issue is constantly addressed by researchers in
collaborative environments. They choose to block parts of the full
deployment to share control between all participants. This strategy
is easily implementable in large displays because it is possible to
define working windows and allow users to control a visualization
area as long as the process of interaction is on the window
assigned to the user. There is a complicated relationship between
the input devices and interaction provided between the user and
the application. In this study the relation between users and the
display was established by using a single shared display and a
common input device.
4.4 Problems defining the design for user
application on the large display
The researchers are busy people: they are managing projects with
documentation, outlines, and so on. They do not have time to
learn new tools and so they prefer traditional methods to display
their results. Some of the younger can try a new technology but
they always take into account the complexity of the tool. Finally
we realized the interface design is a key element to satisfy the user
needs but also to motivate his willingness to learn new types of
interactions and for a proper interface design it is imperative to
know the terminology and symbolism the user uses to do his job.
A significant advance in the previously discussed problem is to
build a user classifier and a visualization-preferences catalog and
match them according to their mental model as well as their user
group profile.
4. CONCLUSIONS We have shown an initial attempt to classify users according to
visualization systems. The classification takes into account
similar projects with different focuses and it explains some mental
models observed with large displays such as a video-wall. In the
future research relations between the mental models, data
representations and user visualization preferences will be
explored.
5. ACKNOWLEDGMENTS Our thanks to UAM / Universidad Autónoma Metropolitana.
6. REFERENCES [1] [Ramirez-08] Laura Patricia Ramírez Rivera, “Minería de
datos visual: Minería Visual sobre una pared de video". By
September 7, 2011. Publisher: Editorial Académica
Española. ISBN-10: 3845492562. ISBN-13:978-
3845492568.
[2] [Ramirez-13] Laura Patricia Ramírez Rivera, “Objetos
distribuidos visuales”, Departamento de computación,
Cinvestav-IPN, 2 de diciembre del 2013.
[3] [Soren-05] LAUESEN, S. 2005. User Interface Design A
software engineering perspective. Pearson Addison-Wesley,
United Kingdom, London.
[4] [Elaine-06] HUANG, E. M., MYNATT, E. D., RUSSELL,
D. M., AND SUE, A. E. 2006. Secrets to success and fatal
flaws: The design of large-display groupware. In IEEE
Computer Graphics and Applications. 37–45.
[5] [George-00] ROBERTSON, G., VAN DANTZICH, M.,
ROBBINS, D., CZERWINSKI, M., HINCKLEY, K.,
RISDEN, K., THIEL, The task gallery: A 3d window
manager. In In Proceedings of CHI, 2000. 494–501.
[6] [Dan-07]DAN, R. AND OLSEN, J. 2007. Evaluating user
interface systems research. In In Proceedings of UIST 07.,
251–258.
[7] [Adi-12]Aditya Pal, Joseph A. Konstan, 2012. User
Classification in Online Communities. Thesis of Doctor of
Philosophy, University of Minnesota, 2012.
[8] [Iglesias-12] Jose Antonio Iglesias, Plamen Angelov,
Agapito Ledezma, Araceli Sanchis. Creating Evolving User
Behavior Profiles Automatically, IEEE Transcactions on
knowledge and data engineering, vol. 24, No. 5, May 2012,
854-867.
327

Improving User-Insurance Communication on Accident Reports
Habib M. Fardoun, Daniyal M. Alghazzawi King Abdulaziz University
Jeddah, Saudi Arabia {hfardoun, dghazzawi}@kau.edu.sa
Antonio Paules Cipres European University of Madrid
Madrid, Spain [email protected]
ABSTRACT This paper presents an easy to use methodology and system for insurance companies targeting at managing traffic accidents reports process. The main objective is to facilitate and accelerate the process of creating and finalizing the necessary accident reports in cases without mortal victims involved. The diverse entities participating in the process from the moment an accident occurs until the related final actions needed are included. Nowadays, this market is limited to the consulting platforms offered by the insurance companies.
Categories and Subject Descriptors J.1 [Administrative Data Processing]: Government, Law.
General Terms Performance.
Keywords Accident Report, Accident part, Traffic, Cloud, Interaction, DUI, Insurance
1. INTRODUCTION This paper aims at providing easy to use solutions and facilitating possible resolutions for accident reports through the Cloud. Cloud functionalities can support the accident-related problem solving processes management for friendly agreed (or not) accident reports.
Currently, if one needs to fill an accident report, it is necessary to go through a set of steps, as for example, indicating the accident location, situations and conditions as well as individuals involved. This information is currently taken through carbon copy formularies, where the main actors describe the situation. Usually, these are small accidents without any medical intervention such as hits between cars in the cities. The security services, as for example, the Civil Guard of Traffic and the local police, assist on resolutions as well as filling the formularies in order to accelerate the process and help the citizens. In Spain, the Dirección General de Tráfico (Traffic General Direction) or DGT is the organization entitled to keep the data archives for every vehicle and associated drivers.
The resolutions needed for an accident follows a specific and formal process. First, the involved parts have to reach to an agreement. The insurance companies facilitate the agreements between the parts and establish deadlines so not to go for a trial.
Then, the information collection for the expert report is carried out by the insurance companies so to acquire information about the severity of the vehicle’s damage and any physical damage of the individuals involved in the accident.
Therefore, it is necessary for a system to be in place in order to support and if possible, to: accelerate the data collection, prohibit vehicles being on the roads without the obligatory insurance, allow involved actors to solve the situation as soon as possible and officially inform and update the insurance system.
Moreover, such system can support the required accident reports process management and any needed elements (e.g. photos of the location and the cars involved) so to guarantee that the users can effectively follow the process using their mobiles. As such, location maps are necessary to appear on the reports; this is possible by including new layers on the system so to provide an editable accident sketch and adding any required external elements.
The main goal in this paper is to present the design and development of a state of the art information system located on the Cloud that allows the users to perform the previously commented actions. These actions refer to the necessary tasks so to facilitate and accelerate the administrative procedure for the reports process initiation and finalization. The system is designed to be used in accidents where there are not mortal victims or minor injured individuals involved. (In case of mortal victims the protocol changes as the process follows the judicial path and the agents make the pertinent actions.)
2. SYSTEM ARCHITECTURE The Cloud is the ideal place to locate such a system. The users participating in the process, the number of users and the origin of the collected data need to be taken into account. The system carries out a process where different entities participate in; the Cloud favors the communication among the systems and as such, interaction is supported so to allow the users to interact with the data located in different clouds.
The previous Figure 2 depicts a system divided into three parts following the platform necessities. In light brown, the official systems are presented; these allow the cloud to communicate the official reports that need to follow the judicial way. In addition, there is a storage system for accident reports sent by the traffic agents supporting the following functionalities:
328

Figure 1. System Architecture
• Official Parts: This service receives the official reports sent from the “Part Accident” cloud. Thus, the agents’ reports are kept on the system database. This cloud interacts and migrates the data with the justice department, here called the “e-Court”, so to accelerate the procedures. The system can be saturated and not every case can reach the court; however, a major number of individuals achieve a friendly agreement. Often the cases reaching the judicial way are the ones having mortal victims or indicating increased cost in reference to material damage.
Search Data: This service is used to search existing data for vehicles and their drivers. In Spain, DGT is in charge of verifying such information (e.g. official documentation of vehicles, proprietary’s data, vehicle insurance) in a specialized centre in León [3]. Thus, data can be easily inserted within the forms by providing just the vehicle’s data such as the registration plate, so to obtain the necessary information for the procedure to be executed. Moreover, there is assurance that any data related problems or mistakes are avoided; as for the case a vehicle is not insured, the agents must be alerted and visit the accident location immediately.
The architecture is emphasized in green colour, suggesting the accident reports initiation on the system as well as the information provision to the rest of the clouds:
• Generate Parts: This service is an interaction space for the connected users involved in the accident so to fill in the report together. Then the insurance companies will
process it. This service is used for friendly agreement and official accident reports.
• Insurance Resolution: Once the accident reports are generated, they are introduced into the system and sent to another cloud where the insurance companies perform the resolution actions towards a friendly agreement for the vehicle reparation. The system keeps a copy of the original report.
The incidences management process is presented in purple colour, this is from the resolution process conducted by the insurance companies towards the friendly agreement reports, the agreement location etc., to the vehicle reparation process monitoring by any collaborators and garages involved.
• Parts: This service obtains the accident reports. The insurance companies verify these reports and talk to involved parts to reach agreement following the traffic legislation. [4].
• Tracing: It allows every participant in the system to verify to check the processes related to resolution, reparation and paying the affected victims.
• Insurance Agents and Cars Repairs: The service “Cars Repairs” receives the order for the vehicle reparation; then, the control passes to the service “Insurance Agents”. The union point of these services is called e-WKCar. This is referred to perform damage evaluation and the verification and validation process
329

before reparation is initiated. During this verification process, the company and the reparation garage reach an agreement on the estimated cost.
The cloud is considered to be the ideal place for such system architecture in this paper due to information systems adaptation to the Cloud, and thus, allowing different entities to use the offered system services. For example, e-Government services are included into the system, taking advantage the information provided by the official services from the traffic department in order to accelerate the administrative procedures for the public entities.
2.1 Generate Parts This section presents the interaction within the “Generate Parts” service. In our research line we have worked with interactive and collaborative environments [5] as well as Distributed User Interfaces (DUI) [6]. The results from the first area of investigation indicate that such work is a collaborative workspace
where the interaction process is carried out; as for DUI, in our previous research it is related to educational environments where the interaction is directly affected by the didactical methodology in a collaborative classroom environment.
In this research, the data insertion process is treated as collaborative work where the involved users provide the data and fill the formularies with the friendly agreement report. For that, a system is used to facilitate users to interact with their mobile devices takings into consideration the necessities and formularies of such characteristics.
Figure 3 depicts the ways the initiation and final provision accident reports processes are delivered. The clouds related to the data delivery system are also included. The system is divided into the following parts, as in Figure 3:
Figure 2. Interaction Process
• Creation Part: When a report is created, the mobile devices connect to each other by a connection such as Bluetooth or Wi-Fi; thus, a collaborative work environment is initiated. The users send and receive the information needed using their mobile devices to complete the accident report. This is server architecture with a connection among mobile devices, which receive the data and the formulary from the cloud. Therefore, a faster interaction is established without the necessity for every device to have a 3G Internet connection because communication with the server is established using only one terminal. The accident report contains users’ data, information about the vehicles involved as well as the
accident situation, pictures etc. so to provide maximum information to the insurance companies and improve the process. As such, GPS services can be provided by one mobile device and a map system so to facilitate the user to select the exact accident locus used to create a sketch of the way the accident occurred. Figure 4 depicts the accident sketch presenting on a map; thus, it simplifies the accident description the users are obliged to include. For that reason a map system is included to provide the exact position and a mobile application for the user to draw and add any external elements involved (signals, traffic lights...). These elements must be photographed so to provide evidence at the moment of the accident
330

and to facilitate the insurance companies checking their state. In Spain, the traffic signals and related elements are catalogued into a central database and secured.
Figure 3. Accident Sketch
• Send Part: Once the report has been filled by the users involved in the accident, they sign the report using a scanned digital signature on their mobile device. This signature is stored by the insurance companies and is included into the system. It is not the traditional digital signature, which also could be used, but a signature scanned by the insurance companies when the users contract their insurance policy.
• Confirmation part: After sending the signed formulary, it is queued, validated and sent to the insurance companies Cloud. A confirmation is sent to the users by SMS with the corresponding indicator for each of the involved individuals. This message also provides acknowledgment of receipt in order to secure that the user is aware that the insurance company has received the report.
This section discussed the process for the reports generation to the point of its delivery to the insurance companies. It is based on ISO usability standards and graphical user interfaces design.
The communication protocol and the data delivery among the terminals can be executed by XML or JSON. This protocol has to be described by the formulary type filled by the users. The selection on a specific formulary from a menu can accelerate the process. The accidents data table is depicted and an official check can be performed on the most common accidents in order to generate a formulary for each one of them. As such, the system provides the users a formulary with most of the fields filled in.
3. INTERACTION PATTERNS The following interaction patterns are included into the proposed application:
• Drag and Drop: The user inserts an object into the sketch to describe the accident. These objects are the external elements and can be vehicles, pedestrians, traffic signals, etc.
• Graphical file inclusion: Users can add the pictures associated with the accident locus as a graphical element into the accident report.
• Confirm: The accident report confirmation is delivered including the needed signatures.
• Initialize: The type of the accident can be selected from different options and menu provided so to facilitate the creation of the correct formulary and hence, directly accelerate the process.
• Connect: The users should select a master device and the connection mode (4G or Bluetooth). Thus, a common report can be created on the main device.
These interaction patterns are included into the application; the users can use them quickly so to easily send the reports to the insurance central office.
4. PROOF OF CONCEPT A complete accident report is presented as the proof of concept related to a front-lateral accident produced in an urban area. There are two vehicles and their drivers involved; a pedestrian as a witness; also the traffic agents are directed to the place of the accident to help the drivers filling in the accident report.
A traffic agent fills in the accident report (this is the friendly agreement) to be sent to the insurance central office. The traffic agent uses a tablet (IPad) with an Internet connection.
Figure 4. Creating the accident report
Figure 5 depicts the way the traffic agent creates the accident report by selecting the type of the accident and providing the necessary pictures. The application uses the GPS service to locate the place of the accident on the local map. The users’ connection with the system is through 3G. The agent only verifies the data as the users’ devices provide the information. This verification is important so to check whether there is a fraud on the users’ information, on the insurance data or on the vehicles involved in the accident.
In addition, the traffic agent has the following options:
• Crowed Traffic: The agent can create official reports about the incidences found in his/her daily work and send a copy to the central office.
• History: Access to data archive of his/her service: fines, parts and traffic reports created by the particular agent.
• Search: This functionality is connected to the security system and referred to the necessities appearing on the daily patrol. A web page is available for the agent to connect with his/her office accessing it in a secure way. The agents receive the account’s password every morning (1 day password) on their computer; they use their user login information and password to authenticate and login into the system so to work using these credentials along the day.
331

• Maps: The agents have access to an incidence database, which cooperates with their navigator so to obtain the shortest way to reach the accident related with the reported incidence.
• Fines: A fines management system is integrated; the agent initiates the fines and the driver may use the secure payment option provided.
• Traffic Laws: Consultation of the traffic bulletin on traffic laws can be consulted for infractions. The agent receives the actualized bulletins and the modifications of the traffic laws.
The agent generates the accident report by clicking the “Generate Part” button.
Figure 5. Accident Sketch Generation
Figure 6 presents the traffic agent working on the accident sketch report indicating the situation the accident occurred and the collision point. In addition, the agent adds the locations the witnesses were positioned and the vehicles’ direction, also providing their registration plates. As such, our system changes the way accident reports are generated and circulated by facilitating and accelerating the transit of information and documents needed. As for the users’ mobile device as such, when a user runs the application, it detects whether there is a device in server mode so to send the insurance data to this device. This action is performed when the traffic agent creates the accident report (previous Figure 5).
Figure 7 presents the mobile device belonged to one of the accident’s victims. As seeing on the left, the device provides the option to connect with the server (agent’s mobile terminal), also displaying information about the vehicle and the insurance. When the user is connected (Figure 8), s/he obtains a screen to check the sketch and the accident report. This screen depicts an agreement between the drivers as they have to verify the sketch and even include new elements; this is a DUI (Distributed User Interface) screen among the users involved in the process.
When the traffic agent clicks on the “Sign” button, the users’ signatures with the accident report are prepared for delivery. The users have to confirm the delivery on their own mobile devices. When the ‘Sign Confirmation’ button is clicked, the confirmation is sent to the agent’s device; once the agent acquires authorizations by all involved drivers, the final accident report is sent to the system.
Figure 6. Device in connecting
mode
Figure 7. Device in sketch mode
5. CONCLUSIONS AND FUTURE WORK This paper proposes a solution for developing car accidents reports based upon the interaction among users’ devices and obtaining the data required from the Cloud. Moreover, the interaction among devices was also presented using one as a server to control the report’s creation, reducing the costs and minimizing the bandwidth. Thus, the interaction is established by directly connecting mobile devices.
This interaction process is facilitated by DUI systems on the cloud, also converting one mobile device as the Cloud extension; in other words, we use the mobile device for the data processing and the interaction process as such, by converting the cloud system into a distributed system. Taking advantage of such distributed cloud system for mobile devices; the companies and other entities can store documents and process information to each other much faster. This market is open to multiple possibilities, such as the collaborative educational environments.
6. REFERENCES [1] Soria J. El centro de tramitación de denuncias automatizadas
de la DGT ya está en marcha. Revista de Trafico y Seguridad Vial. Pp (33-34) Marzo-Abril 2008 ISSN: 1886-3558.
[2] Real Decreto Legislativo 339/90, de 2 de marzo, Ley sobre tráfico, circulación de vehículos a motor y seguridad vial.
[3] Fardoun, H.M., Zafar, B., Altalhi, A.H., Paules, A. (2013). Interactive design System for schools using cloud computing. Journal of Universal Computer Science 19 (7), pp. 950-964.
[4] Fardoun, H. M., & Alghazzawi, D. M., Cipres A. P. (January 2013). Distributed User Interfaces: Usability and Collaboration. Distributed User Interfaces. Human–Computer Interaction Series 2013 (pp 151-163). ISBN 978-1-4471-5498-3. Springer London.
332


![Journal of Arrhythmia - COnnecting REpositories · of arrhythmia diagnosis [1], and implantable loop recorders are especially suitable for identifying undetected sources of a suspected](https://static.fdocuments.ec/doc/165x107/607210056cc22557db7f5efd/journal-of-arrhythmia-connecting-repositories-of-arrhythmia-diagnosis-1-and.jpg)