Secretaría o dirección Argentina: A case study on the Plan Jefes de Hogar Desempleados or the...
43
Secretaría o dirección Argentina: A case study on the Plan Jefes de Hogar Desempleados or the employment road to economic recovery Daniel Kostzer Dirección de Estudios y Coordinación Macroeconómica Subsecretaria de Programación técnica y Estudios Laborales
-
date post
21-Dec-2015 -
Category
Documents
-
view
236 -
download
0
Transcript of Secretaría o dirección Argentina: A case study on the Plan Jefes de Hogar Desempleados or the...

Secretaría o dirección
Argentina: A case study on the Plan Jefes de Hogar Desempleados or the employment road to economic recovery
Daniel KostzerDirección de Estudios y Coordinación MacroeconómicaSubsecretaria de Programación técnica y Estudios Laborales

Economic volatility…
-15.00%
-10.00%
-5.00%
0.00%
5.00%
10.00%
15.00%

The relationship between employment and the economy in the 90´s
• The target were the macroeconomic fundamentals, leaving the labor market to automatically adjust.
• Labor market should adjust freely in terms of prices and quantities.
• Every rigidity should be removed to let markets work..• Labor costs should be reduced in order to maintain
competitiveness. • Almost religious believe that productivity increases
would impact on wages.

The unfulfilled promise ...
• Notwithstanding labor market flexibilization, unemployment, precariousness and informality grew.
• Even with very high GDP growth poverty increased.• Productivity increases were not transferred to salaries
and wages.• Labor costs reduction were not translated into increases
in employment.

Perverse results of labor market policies …
Tasa de empleo no registrado y alícuota promedio de contribuciones patronales
37,3
29,317,7
32,9
26
27
28
29
30
31
32
33
34
35
36
37
38
1991 1992 1993 1994 1995 1996 1997 1998 1999 2000
Tasa d
e E
NR
15
17
19
21
23
25
27
29
31
33
35
Alíc
uota
de c
on
tribu
cio
nes p
atro
nale
s
Tasa de Empleo no registrado
Alícuota de Contribuciones
Patronales
Fuente: SPTyEL - DGEyEL

A simple diagnosis ...
Economic growth was disarticulated• Socially, since wages were a mere cost of production.
Deficit in terms of quantity and quality of employment. • Sectorally since imposed international integration,
reducing the level of domestic linkages and networks, destroying firms and sectors.
• Regionally due to the fact that many regions lost their economic viability and reduced levels of domestic demand.

The evolution of employment during the decade
9.750
10.000
10.250
10.500
10.750
11.000
11.250
11.500
11.750
12.000O
ct-
91
Oct-
92
Oct-
93
Oct-
94
Oct-
95
Oct-
96
Oct-
97
Oct-
98
Oct-
99
Oct-
00
Oct-
01
May-0
2
Oct-
02
Variación Oct-02 / Oct-01
426.000
Variación Oct-02 / May-02
859.000

Formal employment declined by 25%
80
85
90
95
100
105
Nov-9
5
Mar
-96
Jul-9
6
Nov-9
6
Mar
-97
Jul-9
7
Nov-9
7
Mar
-98
Jul-9
8
Nov-9
8
Mar
-99
Jul-9
9
Nov-9
9
Mar
-00
Jul-0
0
Nov-0
0
Mar
-01
Jul-0
1
Nov-0
1
Mar
-02
Jul-0
2

The number of unemployed increased more than three times …
0
500
1000
1500
2000
2500ab
r-80
abr-
81
abr-
82
abr-
83
abr-
84
abr-
85
abr-
86
abr-
87
abr-
88
abr-
89
abr-
90
abr-
91
abr-
92
abr-
93
abr-
94
abr-
95
abr-
96
abr-
97
abr-
98
abr-
99
abr-
00
abr-
01
abr-
02
GBA
Ag.Interior

The unemployment rate …
6,0 7,0
9,3
12
,2
16
,6
17
,4
13
,7
12
,4 13
,8
14
,7
18
,3
21
,5
17
,8
5,0
7,0
9,0
11,0
13,0
15,0
17,0
19,0
21,0
Oct
-91
Oct
-92
Oct
-93
Oct
-94
Oct
-95
Oct
-96
Oct
-97
Oct
-98
Oct
-99
Oct
-00
Oct
-01
May
-02
Oct
-02

The number of underemployed…
700
900
1.100
1.300
1.500
1.700
1.900
2.100
2.300
2.500
2.700
2.900O
ct-
91
Oct-
92
Oct-
93
Oct-
94
Oct-
95
Oct-
96
Oct-
97
Oct-
98
Oct-
99
Oct-
00
Oct-
01
May-0
2
Oct-
02
Variación Oct-02 / May-02
290.000
Variación Oct-02 / Oct-01
571.000

Evolution of poverty and indigence …
2.180
327 402
3.176
6.672
6.047
3.463
2.347
3.052
3.039
3.226
2.836
1.877
1.966
4.295
867720
492353
748
813
797
1.480
923
2.762
3.035
-
500
1.000
1.500
2.000
2.500
3.000
3.500
4.000
4.500
5.000
5.500
6.000
6.500
7.000
7.500
Oct-
91
Oct-
92
Oct-
93
Oct-
94
Oct-
95
Oct-
96
Oct-
97
Oct-
98
Oct-
99
Oct-
00
Oct-
01
May-0
2
Oct-
02
Línea de pobreza
Línea de indigencia

The new pattern of growth...
New relative prices ...–De facto protection of domestic production by the
new exchange rate
–Technologically there is no bias to imported technologies with low labor content
–New fiscal instruments (export taxes).
–Fiscal surplus
–A buffer stock that allowed policies of income redistribution.

The new political context
•Redefinition of the role of the state–Re-programming of the foreign debt–Recovery of monetary sovereignty–Capital flows control–Universal social policies

Active participation of the Ministry of Labor in the definition of the strategy
• Policies articulation as a strategic definition.• Prioritize employment goals in the design of
policies, plans and programs.• Active participation in the labor market inducing
social dialogue.• New and redesigned tools of labor administration• Full employment as an objective of the
administration.

Tools …
Income policies tools•Head of household program (Plan Jefes)•Fixed amount increases•Minimum wage•Increases of family allowance•Rise in pensions and retirements

Plan jefes y jefas de hogar desempleados
Job guarantee or the State as Employer of Last Resort

Struggles against poverty and Struggles against poverty and exclusionexclusionImproves income distributionImproves income distributionMaintains levels of overall demandMaintains levels of overall demandFixes a minimum wage for the Fixes a minimum wage for the formal and the informalformal and the informal sectorsector
Advantages of a system of job guarantee

Political advantages
•Constitutes a global strategy against Constitutes a global strategy against exclusion and povertyexclusion and poverty•It is a clear schema of social It is a clear schema of social protection, not charityprotection, not charity•Reduces unemploymentReduces unemployment•Integrates excluded groupsIntegrates excluded groups•Permits the identification of Permits the identification of problems for further interventionsproblems for further interventions

Social advantages of employment programs
•It is basically a counter-cyclical It is basically a counter-cyclical strategystrategy•Solves basic needs problems of Solves basic needs problems of householdshouseholds•Improves human capital at individual Improves human capital at individual and global leveland global level•Involves beneficiaries in collective Involves beneficiaries in collective plans and projectsplans and projects•Reduces pressure on informal labor Reduces pressure on informal labor marketsmarkets

Regional advantages of employment programs
•Improves infrastructure and services Improves infrastructure and services at local levelat local level•Generate multiplying and Generate multiplying and accelerating effectsaccelerating effects•Can articulate with productive Can articulate with productive sectors in order to create stable, good sectors in order to create stable, good quality jobsquality jobs•Does not distort negatively local Does not distort negatively local marketsmarkets

Plan Jefes de Hogar Desempleados
• Provides an income to those head of households with dependants•There is a work commitment of 20 hours per week•Managed by the Ministry of Labor•Decentralized at local level•Projects by Municipalities and NGO´s•Total amount: 0.92% of GDP•4.9% of Federal Budget

Some characteristics…
•Covers 16% of the overall households of the country•In some provinces it reaches 40% of households•Very young population: 47% are below 35 years old•71% are female•60% of the female are head of household (single parent)

more than 425%
1-2 kids59%
3 kids16%
Number of kids…

Educational level of beneficiaries
University7%
unfinished 120%
finished 211%
finished 137%
unfinished 225%

81% engage in work commitment
Microenterprise8%
Local Adminst.20%
School attendance
6%
Training4%
Other2%
Community Project
60%

The community projects…
•Production of goods–Bakery–Clothing–Bricks–Community farms
•Production of services–Childcare–Elderly care–Teaching assistance–Community and school kitchens–Health programs support

The micro-enterprises…
•Individual –Small scale production–Self employment in services
•Joint projects –Cooperatives–Joint ventures with private firms

Education …
•Back to school•Vocational Training

In relation to the labor market
Male Female Total Works in the program and outside 51.9% 29.1% 35.7% Works in the program and is unemployed 24.4% 23.4% 23.7% Does not work in the program and works Outside the program
11.4%
6.9%
8.2%
Does not work in the program and is unemployed
1.8%
3.0%
2.6%
Works in the program and is inactive 7.1% 28.2% 22.1% Does not work in the program and is inactive
3.4%
9.4%
7.7%
Total 100.0% 100.0% 100.0%

Qualifications of beneficiaries
prof/ técnica5%
sin calificación68%
operativa27%

Skills of beneficiaries according to gender
0%
10%
20%
30%
40%
50%
60%
70%
80%
90%
100%
Male Female
Technical Skills
Operational Skills
Unskilled

Skills and experience
Previous experience•98% of male had previous experience•82% of female had previous experience•Male workers were formerly in industries and construction•Female workers were in manufactures and house care and administration

The program, poverty and indigence
•90% of the households are under the poverty line•53% are under the indigence line•The benefit represents an increase of 63% of the household income•With the program indigence has reduced by 25 percentage point among beneficiaries•Poverty only by 8%•20% of the households have the benefit as sole source of income•

Impact of the program
•The multiplying effect of the program is 2.57•400 thousands beneficiaries found a job in the formal sector of the economy•Almost half of them have a part-time job informally•20% engaged in temporary jobs (in and out the program)

Evolution of beneficiaries as % of employed population
0.00%
1.00%
2.00%
3.00%
4.00%
5.00%
6.00%
7.00%
8.00%
9.00%
1°Trim
03
2°Trim
03
3°Trim
03
4°Trim
03
1°Trim
04
2°Trim
04
3°Trim
04
4°Trim
04
1°Trim
05
2°Trim
05
3°Trim
05

The impact on the overall economy
Economic growth in every region of the country• Recovery of the employment• Before in the provinces than in Buenos Aires•Reduction of unemployment•Recovery of purchasing power of wages, including the informal sector.
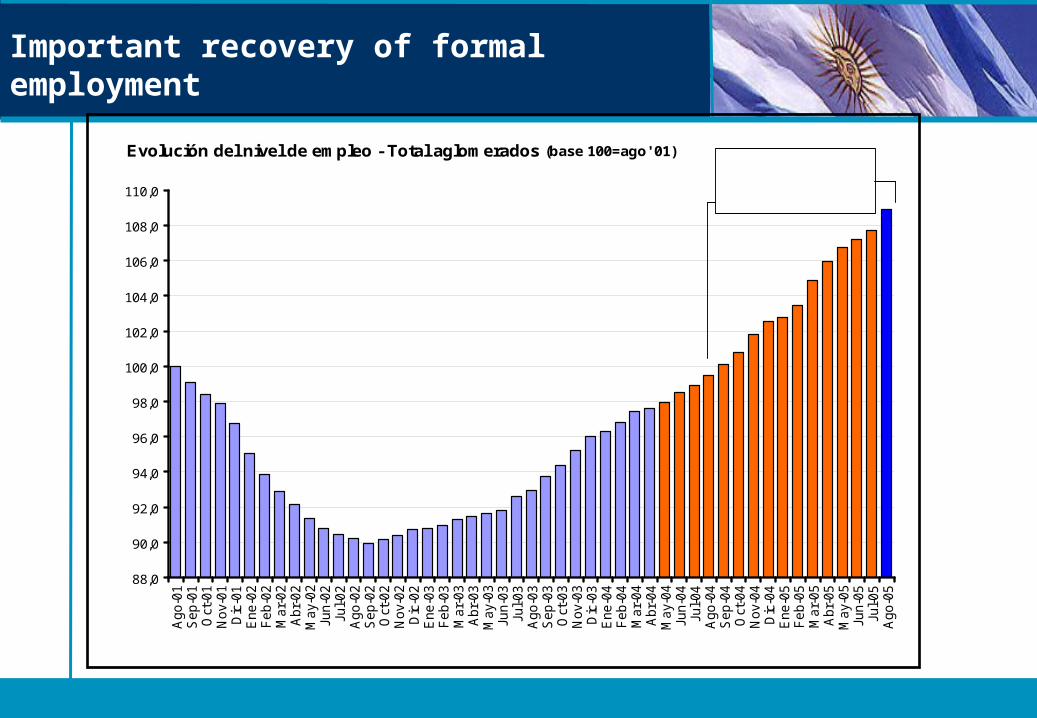
Important recovery of formal employment
Evolución del nivel de empleo - Total aglomerados (base 100=ago' 01)
88,0
90,0
92,0
94,0
96,0
98,0
100,0
102,0
104,0
106,0
108,0
110,0A
go
-01
Sep
-01
Oct
-01
Nov-
01
Dic
-01
Ene
-02
Feb-0
2M
ar-
02
Abr-
02
May-
02
Jun
-02
Jul-
02
Ago
-02
Sep
-02
Oct
-02
Nov-
02
Dic
-02
Ene
-03
Feb-0
3M
ar-
03
Abr-
03
May-
03
Jun
-03
Jul-
03
Ago
-03
Sep
-03
Oct
-03
Nov-
03
Dic
-03
Ene
-04
Feb-0
4M
ar-
04
Abr-
04
May-
04
Jun
-04
Jul-
04
Ago
-04
Sep
-04
Oct
-04
Nov-
04
Dic
-04
Ene
-05
Feb-0
5M
ar-
05
Abr-
05
May-
05
Jun
-05
Jul-
05
Ago
-05
Variación anual ago 05 - ago 04:
9,5%

Employment rise, reduction of unemployment …
1.522
3.00814.125
12.073
1.400
1.600
1.800
2.000
2.200
2.400
2.600
2.800
3.000
3.200
I -03 I I -03 I I I -03 IV-03 I -04 I I -04 I I I -04 IV-04 I -05 I I -05 I I I -05 IV-05
Desocu
pad
os
11.600
11.900
12.200
12.500
12.800
13.100
13.400
13.700
14.000
14.300
Ocu
pad
os
Desocupados Ocupados

Reduction of the rate of non registered workers
45,5
48,9
49,5
47,9
44
45
46
47
48
49
50
I -03 I I -03 I I I -03 IV-03 I -04 I I -04 I I I -04 IV-04 I -05 I I -05 I I I -05 IV-05
IV-05 / IV-04: - 7%
IV-04 / IV-03: - 1,2%

Restitution of the minimum wage
Evolución del Salario Mínimo Real Deflactado por I PC
189,6
100,0
60,0
80,0
100,0
120,0
140,0
160,0
180,0
200,0
Dic
-01
Feb
-02
Abr-
02
Jun
-02
Ago-0
2
Oct-
02
Dic
-02
Feb
-03
Abr-
03
Jun
-03
Ago-0
3
Oct-
03
Dic
-03
Feb
-04
Abr-
04
Jun
-04
Ago-0
4
Oct-
04
Dic
-04
Feb
-05
Abr-
05
Jun
-05
Dic-01 / J ul-05+ 89,8 %

Employment growth
3,5%
5,6%
10,4%
0%
2%
4%
6%
8%
10%
12%
Ocupados Ocupados excluyendo beneficiarios Asalariados registrados

There is no better social and economic policy than full employment …
Nor better work than decent work …
That is why there is willingness and decision to place employment in the
center of economic policies.