RETOS Y OPORTUNIDADES DE LA INDUSTRIA EN … · Contribución al crecimiento NPC NRI Var% 2015 vs....
41
RETOS Y OPORTUNIDADES DE LA INDUSTRIA EN MÉXICO Héctor Granados Octubre, 2016
-
Upload
dangnguyet -
Category
Documents
-
view
216 -
download
0
Transcript of RETOS Y OPORTUNIDADES DE LA INDUSTRIA EN … · Contribución al crecimiento NPC NRI Var% 2015 vs....

RETOS Y OPORTUNIDADESDE LA INDUSTRIA EN MÉXICO
Héctor GranadosOctubre, 2016

OUTLOOK ECONOMÍA LATAM 2015 Y PERSPECTIVAS 2016
CONSUMO DESACELERADOCrecimiento promedio en últimos 10 años de 4.2%, en 2015 se ubicó en -0.1%
MENOR INVERSIÓNCrecimiento promedio en últimos 10 años de 5.3%, en 2015 se ubicó en -4.3%
DISMINUYE EXPORTACIONESCrecimiento promedio en últimos 10 años de 7.5%, en 2015 se ubicó en -13.1%
+30%
DEVALUACIÓN
17.0%
INFLACIÓN
Fuente: Latin Focus Agosto ‘16

Co
pyr
igh
t ©
2016
Th
e N
iels
en C
om
pan
y. C
on
fid
enti
al a
nd
pro
pri
etar
y.
3Fuente: Latin Focus Agosto ‘16
LA REDUCCIÓN DEL PIB ES INFLUENCIADA POR LAS ECONOMÍAS IMPORTANTES DE LA REGIÓNLa expectativa regional continúa por debajo de las cifras globales.
7.0
3.3
0.0
3.12.5 2.1
0.32.4
-0.6
-3.8
-5.7
5.63.7 3.0
2.3 2.3 1.8
-3.2-1.2
-1.3-3.3
-9.2R. DOM PE CAM +
CARIBCO MX CHI ECU ARG P.RICO BRA
VZLA
2015
2016 P
RANKING ECONOMÍAS LATAM(% GDP 2015)
BRASIL 34%
MÉXICO 22%
VENEZUELA 4%
ARGENTINA 12%
CHILE 5%
PERÚ 4%
REP. DOMINICANA 1%
PUERTO RICO 1%
ECUADOR 2%
CAM Y CARIBE 8%
VARIACIÓN % ANUAL DEL PIB
2.6 3.0 2.6 3,0 2.8
1,0
2,8
-0,1
3,1
-0,3
GLOBAL LATAM
2012 2013 2014 2015 2016 P
COLOMBIA 6%

Co
pyr
igh
t ©
2016
Th
e N
iels
en C
om
pan
y. C
on
fid
enti
al a
nd
pro
pri
etar
y.
4
FACTORES QUE AFECTAN LA ECONOMÍA MEXICANA
Fuente: Petróleo - Banco de México | Dólar – Banamex (Histórico dólar americano) Agosto, 2016 | Corrupción - * Transparencia Internacional (FMI)
Precio promedio en dólarespor Barril:2014: 96.3 2015: 49.5
PRECIO DEL PETRÓLEO
Depreciación del Peso Mexicano 25%
Campeche; Tabasco; Tamaulipas; Chiapas;
Veracruz; San Luis Potosí; Puebla;
Nuevo León y Coahuila
ESTADOS MÁS AFECTADOS POR EL PETROLEO
13.2
18.8Ju
l'14
Sep
t'1
4
No
v'1
4
Ene'
15
Mar
'15
May
'15
Jul'1
5
Sep
t'1
5
No
v'1
5
Ene'
16
Mar
'16
May
'16
Jul'1
6
Tipo de CambioPeso Mexicano vs. USD
DEPRECIACIÓN DEL PESO
PIB sería 2% mayorsi baja la Corrupción*
CORRUPCIÓNPOLÍTICA
Co
pyr
igh
t ©
2016
Th
e N
iels
en C
om
pan
y. C
on
fid
enti
al a
nd
pro
pri
etar
y.
5
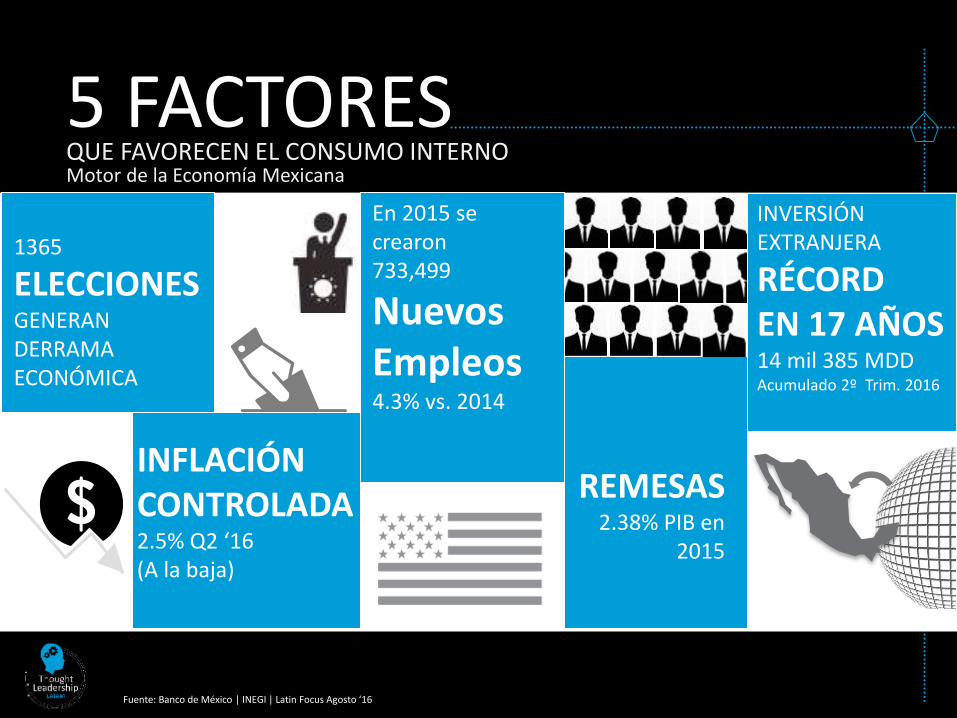
QUE FAVORECEN EL CONSUMO INTERNO5 FACTORESMotor de la Economía Mexicana
INFLACIÓN CONTROLADA2.5% Q2 ‘16 (A la baja)
1365
ELECCIONESGENERANDERRAMA ECONÓMICA
REMESAS2.38% PIB en
2015
Fuente: Banco de México | INEGI | Latin Focus Agosto ‘16
INVERSIÓNEXTRANJERA
RÉCORD EN 17 AÑOS14 mil 385 MDD Acumulado 2º Trim. 2016
En 2015 se crearon 733,499
Nuevos Empleos4.3% vs. 2014

Co
pyr
igh
t ©
2016
Th
e N
iels
en C
om
pan
y. C
on
fid
enti
al a
nd
pro
pri
etar
y.
6
EL 90% DE LAS REMESAS SE DESTINAN AL CONSUMOLas remesas superaron el ingreso por petróleo y turismo
Fuente: Banxico
% Var Remesas
-0.1%vs. Jul’15
1.3 millones de hogares reciben
remesas
2233.7
00 01 02 03 04 05 06 07 08 09 10 11 12 13 14 15 16
Remesas – Millones de USD – Julio Año 2000 a 2016
24,77123,432
17,186
Remesas Petróleo Turismo
Millones de dólaresAño 2015
JULIO

Co
pyr
igh
t ©
2016
Th
e N
iels
en C
om
pan
y. C
on
fid
enti
al a
nd
pro
pri
etar
y.
7
EL TIPO DE CAMBIO HIZO QUE LAS REMESAS FUERAN AÚN MÁS BENEFICIOSAS
Hogares que reciben remesas: 1.3MM
Source: Banxico - INEGI
Remesas por Hogar (MMUSD)
Julio 2016Julio 2015Julio 2014
Var% remesas USD(Base=Jul14)
Tipo de cambio
Remesas por Hogar (MM MXN)
Var% remesas MXN(Base=Jul14)
Var% Salario Mínimo (Base=Jun14)
Var% Inflación (Base=Jul14)
1,998 2,235 2,234
+11.8% -0.1%
13.2 16.1 18.8
20,322 27,617 32,220
+35.9% +16.7%
+4.2% +8.5%
-32.7% +16.8%
Co
pyr
igh
t ©
2016
Th
e N
iels
en C
om
pan
y. C
on
fid
enti
al a
nd
pro
pri
etar
y.
8
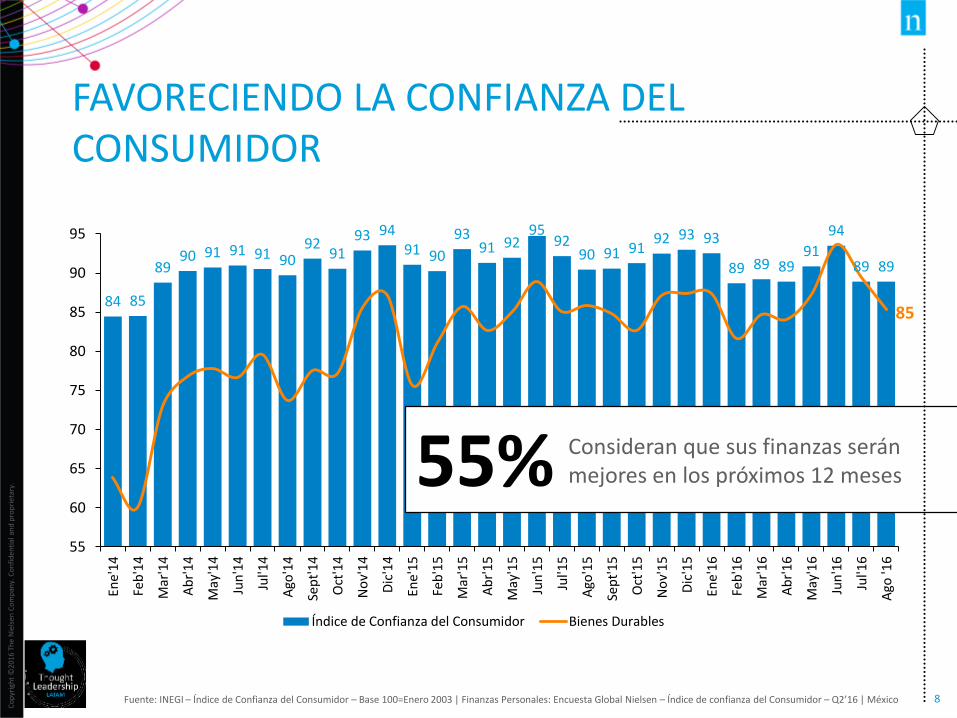
FAVORECIENDO LA CONFIANZA DEL CONSUMIDOR
Fuente: INEGI – Índice de Confianza del Consumidor – Base 100=Enero 2003 | Finanzas Personales: Encuesta Global Nielsen – Índice de confianza del Consumidor – Q2’16 | México
84 85
8990 91 91 91 90
9291
93 9491 90
9391 92
9592
90 91 9192 93 93
89 89 8991
94
89 89
55
60
65
70
75
80
85
90
95
Ene'
14
Feb
'14
Mar
'14
Ab
r'1
4
May
'14
Jun
'14
Jul'1
4
Ago
'14
Sep
t'14
Oct
'14
No
v'1
4
Dic
'14
Ene'
15
Feb
'15
Mar
'15
Ab
r'1
5
May
'15
Jun
'15
Jul'1
5
Ago
'15
Sep
t'15
Oct
'15
No
v'1
5
Dic
'15
Ene'
16
Feb
'16
Mar
'16
Ab
r'1
6
May
'16
Jun
'16
Jul'1
6
Ago
'16
Índice de Confianza del Consumidor Bienes Durables
85
55% Consideran que sus finanzas serán mejores en los próximos 12 meses

Co
pyr
igh
t ©
2016
Th
e N
iels
en C
om
pan
y. C
on
fid
enti
al a
nd
pro
pri
etar
y.
9
3.5
6.9
3.6
-1.0
-
1.0
2.0
3.0
4.0
5.0
6.0
7.0
8.0
9.0
-1.0
-
1.0
2.0
3.0
4.0
5.0
6.0
7.0
8.0
9.0
2009 2010 2011 2012 2013 2014 2015
TOTAL CANASTOS NIELSEN MÉXICOPORCENTAJE DE VARIACIÓN ANUAL (AÑOS MÓVILES)
REFORMA HACENDARIA
Ventas Volumen Ventas Valor Precio Ponderado
TT: +11.5%TI: +7.8%Agosto 2016
2016
LO CUAL SE VE REFLEJADO EN EL CANASTO NIELSEN
Fuente: Nielsen Retail Index | Canastos Nielsen | Total México | Variación porcentual Año Móvil vs. Año Móvil previo | Periodos hasta AMJ ‘16

Co
pyr
igh
t ©
2016
Th
e N
iels
en C
om
pan
y. C
on
fid
enti
al a
nd
pro
pri
etar
y.
10
+8.4%
+10.8%
+5.1%
+3.1%
-28.0%
+6.9%
EL ÁREA 3 NIELSEN FUE LA QUE MAYOR CONTRIBUCIÓN TUVO AL CRECIMIENTO DEL CANASTO NIELSEN, AL IGUAL QUE DE LAS REMESAS
• Fuente: Banco de México | Var % 2015 vs. 2014, último período disponible en la fuente
13.7%
30.6%
18.1%
8.2%
4.4%
24.9%
Contribución al crecimiento NPC NRIVar% 2015 vs. 2014
+5.7%
REMESAS 24,771mdd+8.4%
+28.1%
+8.5%+10.7%
+18.8%
+25.6%
Contribución a remesas
Variación vs. 2014
2015 CANASTO NIELSEN + 5.5%
Co
pyr
igh
t ©
2016
Th
e N
iels
en C
om
pan
y. C
on
fid
enti
al a
nd
pro
pri
etar
y.
11
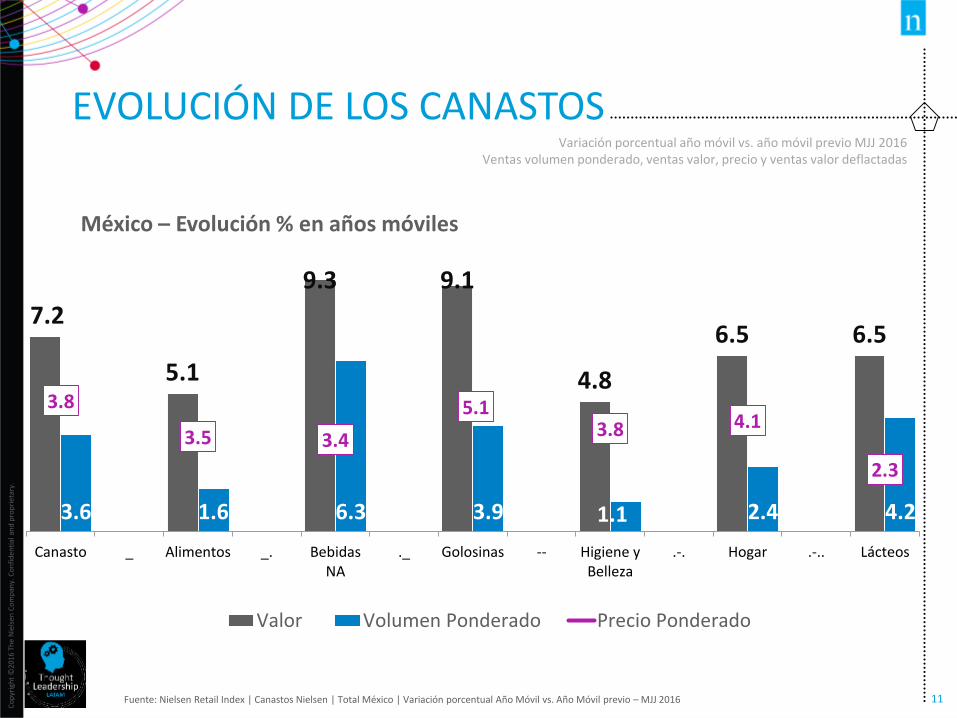
EVOLUCIÓN DE LOS CANASTOSVariación porcentual año móvil vs. año móvil previo MJJ 2016
Ventas volumen ponderado, ventas valor, precio y ventas valor deflactadas
Fuente: Nielsen Retail Index | Canastos Nielsen | Total México | Variación porcentual Año Móvil vs. Año Móvil previo – MJJ 2016
México – Evolución % en años móviles
7.2
5.1
9.3 9.1
4.8
6.5 6.5
3.6 1.6 6.3 3.9 1.1 2.4 4.2
3.8
3.5 3.4
5.13.8 4.1
2.3
Canasto _ Alimentos _. BebidasNA
._ Golosinas -- Higiene yBelleza
.-. Hogar .-.. Lácteos
Valor Volumen Ponderado Precio Ponderado

Co
pyr
igh
t ©
2016
Th
e N
iels
en C
om
pan
y. C
on
fid
enti
al a
nd
pro
pri
etar
y.
12
EL CANASTO DE ALIMENTOS…
Fuente: Nielsen Retail Index| Fabricantes exitosos | Canasto de Alimentos| Año Móvil Enero ‘16
21%% Ventas Valor proviene de las Marcas Exitosas
55%Contribución al Crecimiento delCanasto de Alimentos
+9%vs. el 4.2% del canasto
Las Marcas exitosas de alimentos, crecen
De las 2,419 Marcas de alimentos solo 35 logran crecer en ventas volumen y en ventas valor por arriba de la inflación

¿QUÉ HACEN LAS MARCAS EXITOSAS PARA CRECER?

Co
pyr
igh
t ©
2016
Th
e N
iels
en C
om
pan
y. C
on
fid
enti
al a
nd
pro
pri
etar
y.
14
7%
9%
11%
18%
19%Affordability
% Variación de Ventas Valor por tipo de estrategia
Affordability + Innovación
Innovación
Valor por su Dinero
Puntos de Precio
23%14%
6%
8%
20%
14%
14%
11%
37%
52%
% Marcas % Contribución al crecimiento
Fuente: Nielsen Retail Index | Canasto de Alimentos | Affordability: Impulsan las presentaciones más pequeñas de su portafolio | Valor por su Dinero: Impulsa presentaciones grandes dentro de su portafolio | Price Points: Utiliza estrategias diferenciadas de precio y tamaño

Co
pyr
igh
t ©
2016
Th
e N
iels
en C
om
pan
y. C
on
fid
enti
al a
nd
pro
pri
etar
y.
15
LA ESPECIALIZACIÓN Y SEGMENTO SALUDABLE, JUEGAN UN PAPEL CLAVE EN LA INNOVACIÓN
Fuente: Nielsen Índice de Confianza del Consumidor (Q1 2016)2
23% INTOLERANTES A LA LACTOSA
19% VEGETARIANOS
9% VEGANOS
51% CONSUMEN
SÚPER ALIMENTOS
42% GUSTAN DE
ENDULZANTES NATURALES
DE LAS MARCAS EXITOSAS,JUEGAN EN UN SEGMENTO SALUDABLE
39%

Co
pyr
igh
t ©
2016
Th
e N
iels
en C
om
pan
y. C
on
fid
enti
al a
nd
pro
pri
etar
y.
16
DEBIDO A LOS NIVELES DE OBESIDAD QUE HEMOS ALCANZADO EN EL PAÍS
Fuente: Nielsen Índice de Confianza del Consumidor (Q1 2016) | México
-
50,000,000
100,000,000
150,000,000
200,000,000
250,000,000
300,000,000
350,000,000
400,000,000
450,000,000
500,000,000
Ch
ina
Ind
ia
U.S
.
Bra
zil
Ru
ssia
Mex
ico
Ind
on
esia
Nig
eria
Egyp
t
Turk
ey
Iran
Pak
ista
n
Ger
man
y
U.K
.
Fran
ce
Ital
y
Jap
an
Sou
th A
fric
a
Ban
glad
esh
Spai
n
Co
lom
bia
Arg
enti
na
TOP 22 PAÍSES EN SOBREPESO
34%% vs. Total Population
22% 67% 54% 59% 64% 24% 33% 62% 66% 62% 23% 55% 63% 61% 59% 24% 54% 18% 61% 57% 62%
47% Diagnosticados con Presión Arterial9.2% Diagnosticados con Diabetes

Co
pyr
igh
t ©
2016
Th
e N
iels
en C
om
pan
y. C
on
fid
enti
al a
nd
pro
pri
etar
y.
17
¿CÓMO REACCIONA EL CONSUMIDOR?
Fuente; Global Survey 2014 Health Wellness and Nutrition, Flexitariano: (comen principalmente plantas con inclusión ocasional de carne, pollo o mariscos), incluyendo pescetarian, pollotarian o pollo-pescetarian
79% Hacen ejercicio de manera regular
71% Llevan una dieta para prevenir enfermedades crónicas
69% Monitorean los ingredientes que consumen para controlar su dieta
59%
38%
35%
32%
24%
20%
19%
15%
9%
5%
Bajo en Grasa
Bajo en Azúcar
Bajo en Sodio
Bajo en Carb
Deslactosado
Libre de Gluten
Vegetariano
Flexitariana
Vegano
Kosher
Sacrifican el consumo
de algunos alimentos
73% Revisan cuidadosamente en las etiquetas el contenido nutricional
72% Prestan mucha atención a los ingredientes incluidos en su comida
77% Quieren saber todo de la
procedencia de sus alimentos

Co
pyr
igh
t ©
2016
Th
e N
iels
en C
om
pan
y. C
on
fid
enti
al a
nd
pro
pri
etar
y.
18
LA CARNE ROJA ES UNO DE LOS ALIMENTOS QUE EL CONSUMIDOR EVALUA AL CUIDAR SU SALUD
Fuente: Nielsen Global Survey Ingredientes de los A,limentos 2016
Preferencia por la Carne Roja% de Respondientes On-line
Trato de Incluirla
No importa si la incluyo o no
16%Condición Médica
que la Prohíbe
67%Eligieron no consumirlapor el bien de su salud
Trato de Evitarla
20%
53%
27%
Co
pyr
igh
t ©
2016
Th
e N
iels
en C
om
pan
y. C
on
fid
enti
al a
nd
pro
pri
etar
y.
19
RES 39.6%
POLLO 42.3%
CERDO 10.4%
TIPO DE CARNE PREFERIDO POR LOS
CONSUMIDORES
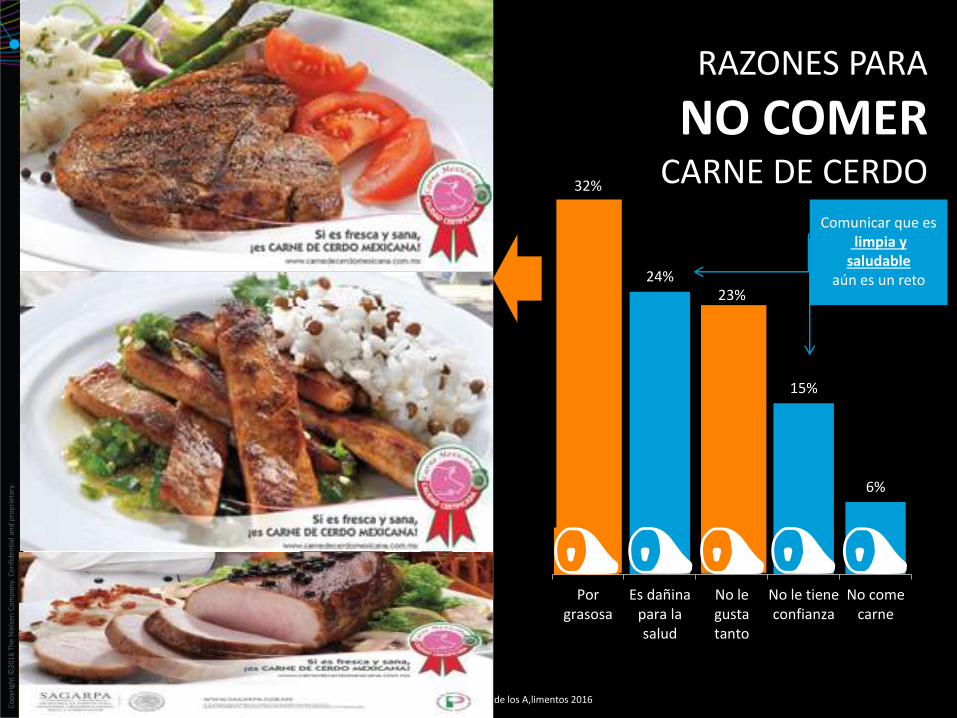
Fuente: Estudio de Consumo de Carne Berumen | Nielsen Global Survey Ingredientes de los A,limentos 2016
32%
24%23%
15%
6%
Porgrasosa
Es dañinapara lasalud
No legustatanto
No le tieneconfianza
No comecarne
RAZONES PARA
NO COMERCARNE DE CERDO
Comunicar que eslimpia y
saludable aún es un reto
Co
pyr
igh
t ©
2016
Th
e N
iels
en C
om
pan
y. C
on
fid
enti
al a
nd
pro
pri
etar
y.
20
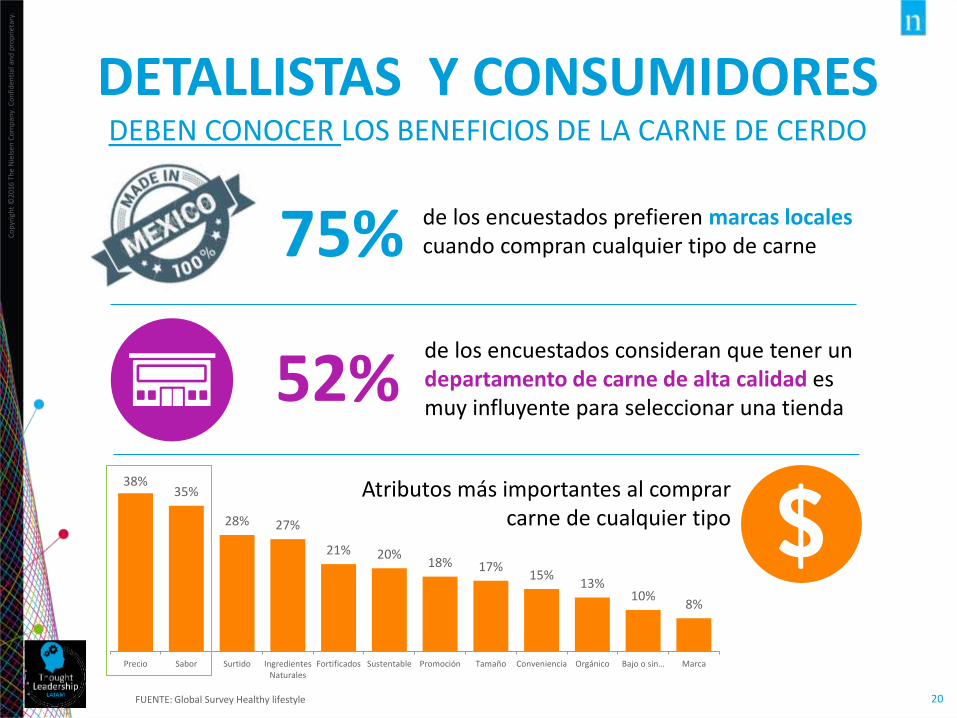
75% de los encuestados prefieren marcas locales cuando compran cualquier tipo de carne
DETALLISTAS Y CONSUMIDORESDEBEN CONOCER LOS BENEFICIOS DE LA CARNE DE CERDO
52% de los encuestados consideran que tener un departamento de carne de alta calidad es muy influyente para seleccionar una tienda
38%35%
28% 27%
21% 20%18% 17%
15%13%
10%8%
Precio Sabor Surtido IngredientesNaturales
Fortificados Sustentable Promoción Tamaño Conveniencia Orgánico Bajo o sin… Marca
FUENTE: Global Survey Healthy lifestyle
Atributos más importantes al comprar carne de cualquier tipo

Co
pyr
igh
t ©
2016
Th
e N
iels
en C
om
pan
y. C
on
fid
enti
al a
nd
pro
pri
etar
y.
21
ES IMPORTANTE BUSCAR UN BALANCE EN COMO COMUNICAMOS
EQUITYVOLUMEN
MEDIATRADE
ROI – Vehículos de marketing
Fuente: Nielsen Marketing Mix | Ejemplo real
Co
pyr
igh
t ©
2016
Th
e N
iels
en C
om
pan
y. C
on
fid
enti
al a
nd
pro
pri
etar
y.
22
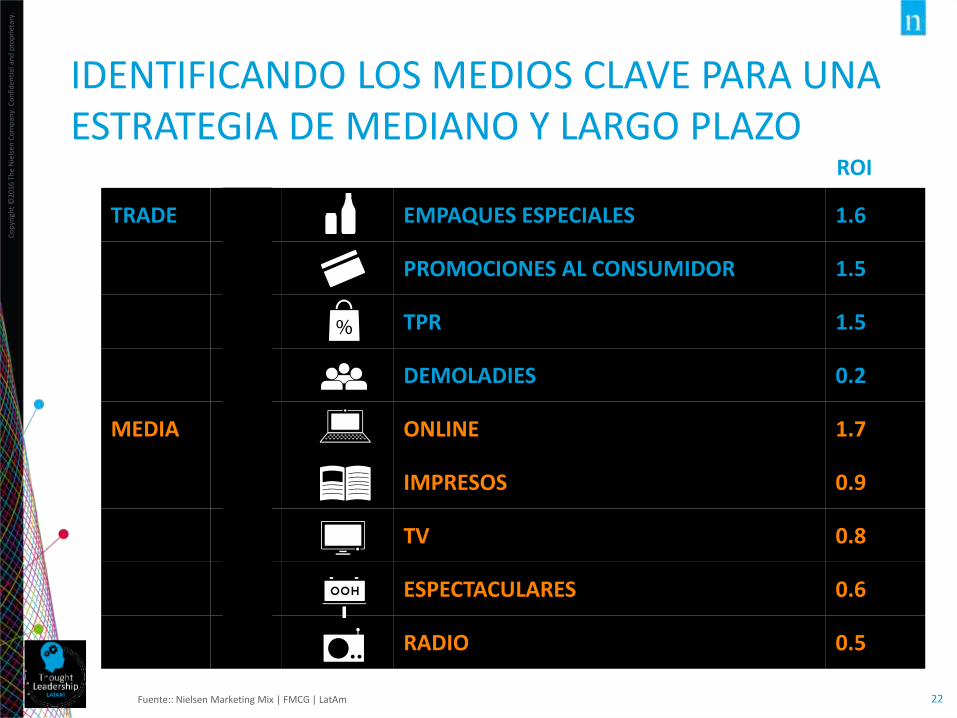
IDENTIFICANDO LOS MEDIOS CLAVE PARA UNA ESTRATEGIA DE MEDIANO Y LARGO PLAZO
Fuente:: Nielsen Marketing Mix | FMCG | LatAm
TRADE EMPAQUES ESPECIALES 1.6
PROMOCIONES AL CONSUMIDOR 1.5
TPR 1.5
DEMOLADIES 0.2
MEDIA ONLINE 1.7
IMPRESOS 0.9
TV 0.8
ESPECTACULARES 0.6
RADIO 0.5
ROI
Co
pyr
igh
t ©
2016
Th
e N
iels
en C
om
pan
y. C
on
fid
enti
al a
nd
pro
pri
etar
y.
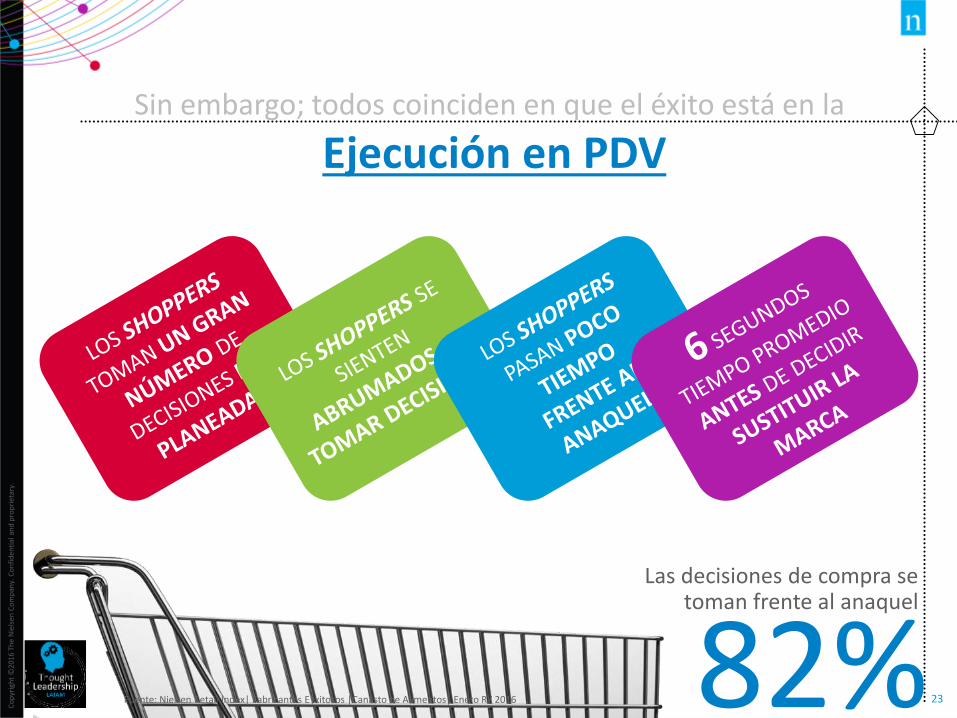
2382%Las decisiones de compra se
toman frente al anaquel
Sin embargo; todos coinciden en que el éxito está en la
Ejecución en PDV
Fuente: Nielsen Retail Index| Fabricantes E|xitosos |Canasto de Alimentos| Enero RY 2016

CAMINO AL ÉXITO
Co
pyr
igh
t ©
2016
Th
e N
iels
en C
om
pan
y. C
on
fid
enti
al a
nd
pro
pri
etar
y.
25
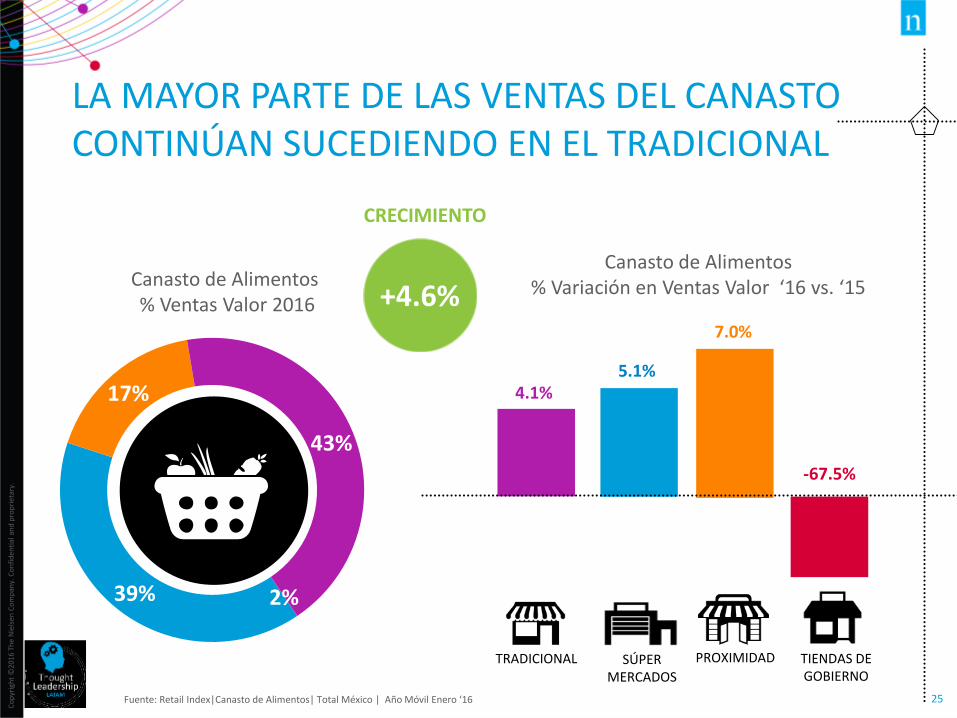
LA MAYOR PARTE DE LAS VENTAS DEL CANASTO CONTINÚAN SUCEDIENDO EN EL TRADICIONAL
Fuente: Retail Index|Canasto de Alimentos| Total México | Año Móvil Enero ‘16
Canasto de Alimentos % Ventas Valor 2016
SÚPER MERCADOS
PROXIMIDADTRADICIONAL TIENDAS DEGOBIERNO
39%
17%
43%
2%
5.1%
7.0%
4.1%
-67.5%
Canasto de Alimentos% Variación en Ventas Valor ‘16 vs. ‘15
CRECIMIENTO
+4.6%

Co
pyr
igh
t ©
2016
Th
e N
iels
en C
om
pan
y. C
on
fid
enti
al a
nd
pro
pri
etar
y.
26
QUE TAMBIÉN ES UN CANAL CLAVE PARA LOS COMPRADORES DE CARNE
Global Survey Fresh Food 2014
8% 7% 9%13%
9% 10%
39%
47%50%
18%
61%
23%
Category 1 Category 2 Category 3 Category 4
PEQUEÑOS FORMATOS
CANALES TRADICIONALES
Carne y Pollo Frutas y Verduras
Lácteos Panadería DelicatesenPescados y Mariscos
Dónde compran más los consumidores…
Co
pyr
igh
t ©
2016
Th
e N
iels
en C
om
pan
y. C
on
fid
enti
al a
nd
pro
pri
etar
y.
27
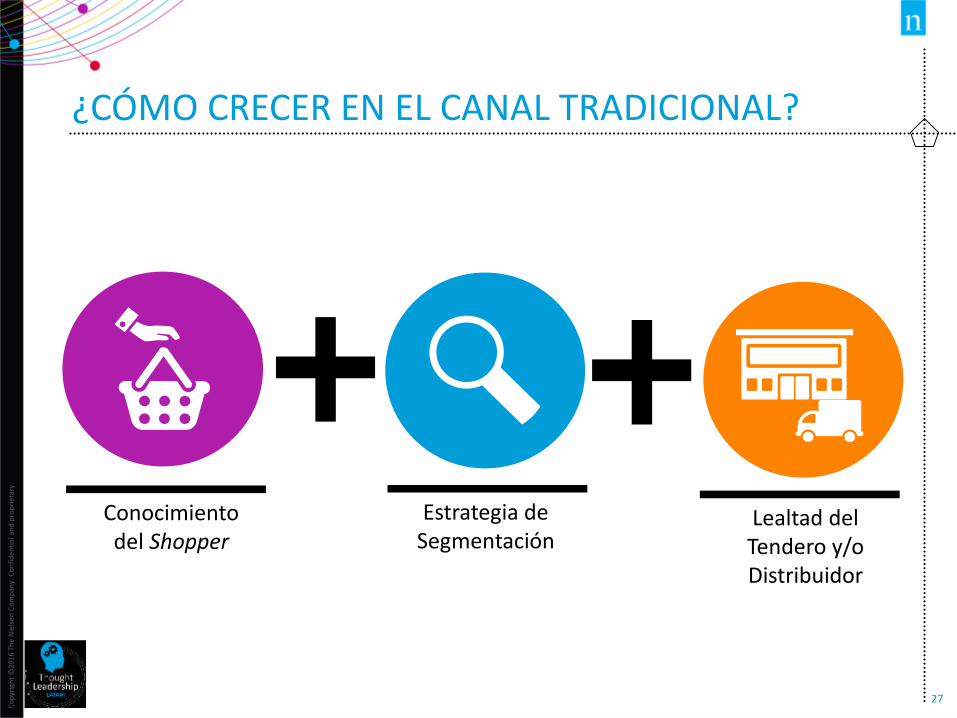
¿CÓMO CRECER EN EL CANAL TRADICIONAL?
Estrategia de Segmentación
Lealtad del Tendero y/o Distribuidor
Conocimiento del Shopper

Co
pyr
igh
t ©
2016
Th
e N
iels
en C
om
pan
y. C
on
fid
enti
al a
nd
pro
pri
etar
y.
28
ENTENDIENDO AL SHOPPER
25%
48% 9%
9%
9%
Compra Diaria
Fuera deCasa Ítem
Urgente
NoComestibles
Otros
% Shoppers por misión en el Canal Tradicionalvs. 48% en LatAm
HOMBRES51%
Y ESTÁN
3 minutos por visita
Shoppers hacen al menos
37 VISITAS AL MES
Fuente: Nielsen Shopper Trends en México

Co
pyr
igh
t ©
2016
Th
e N
iels
en C
om
pan
y. C
on
fid
enti
al a
nd
pro
pri
etar
y.
29
MOMENTOS DE CONSUMO QUE AYUDEN A INCREMENTAR NUESTRAS OPORTUNIDADES
33%
22%
16%
16%
13%
Compra diaria
Consumo fuera decasa
Abastecimiento
Remplazos oProductos…
Otros
MODERN TRADE TRADITIONAL TRADE
38%
34%
17%
11%
2%
Consumo fuera decasa
Compra diaria
Remplazos oProductos Urgentes
Otros
Abastecimiento
Co
pyr
igh
t ©
2016
Th
e N
iels
en C
om
pan
y. C
on
fid
enti
al a
nd
pro
pri
etar
y.
30
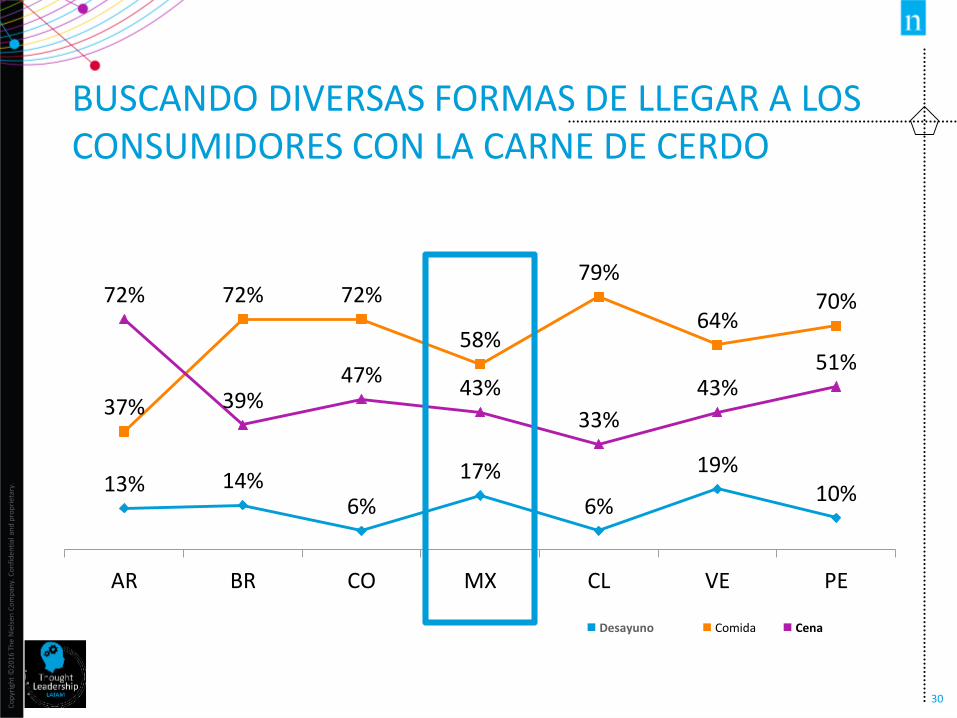
BUSCANDO DIVERSAS FORMAS DE LLEGAR A LOS CONSUMIDORES CON LA CARNE DE CERDO
13% 14%6%
17%
6%
19%10%
37%
72% 72%
58%
79%
64%70%72%
39%47%
43%
33%
43%51%
AR BR CO MX CL VE PE
Desayuno Comida Cena

Co
pyr
igh
t ©
2016
Th
e N
iels
en C
om
pan
y. C
on
fid
enti
al a
nd
pro
pri
etar
y.
31
OFRECIENDO EL PRODUCTO LISTO PARA COMER
Fuente: Global Survey
Es muy influyente para elegir la tienda que cuente con una amplia variedad de comida fresca y ya preparada
Prefiero visitar algún tipo de tienda si proporciona servicios como…
Co
pyr
igh
t ©
2016
Th
e N
iels
en C
om
pan
y. C
on
fid
enti
al a
nd
pro
pri
etar
y.
32
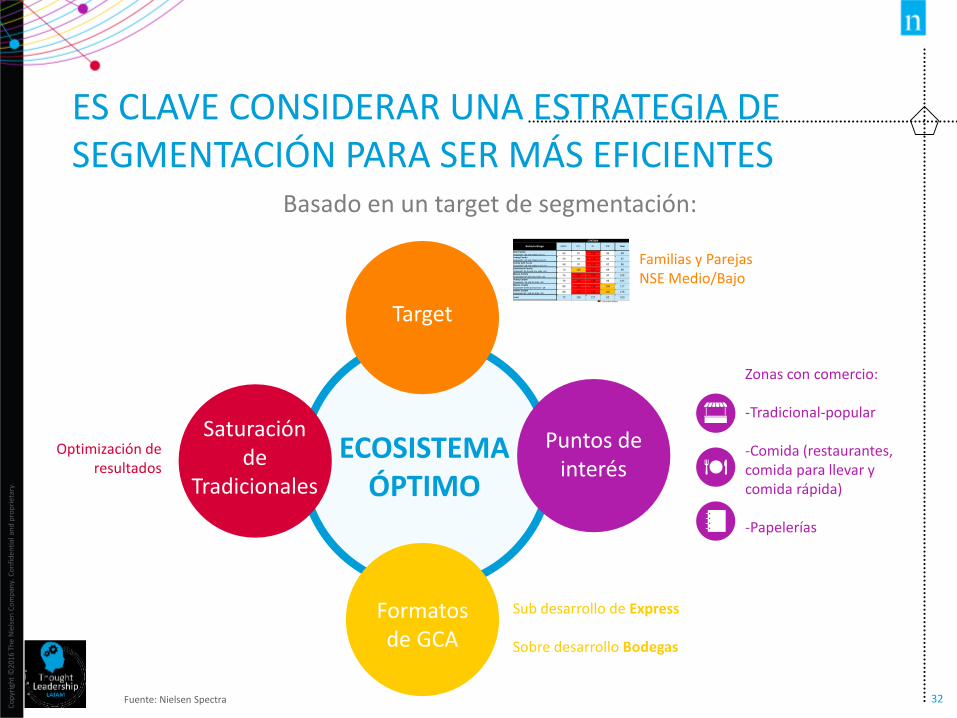
ES CLAVE CONSIDERAR UNA ESTRATEGIA DE SEGMENTACIÓN PARA SER MÁS EFICIENTES
Fuente: Nielsen Spectra
Basado en un target de segmentación:
Target
Puntos de interés
Formatos de GCA
Saturación de
Tradicionales
Consumidor Objetivo
89
112 94
127
Family with Teens
Housewife <40 and Oldest Kid 12-17
Young Family
Housewife <40 and Oldest Kid 6-11
New Family
Housewife <40 and Oldest Kid <6
TotalD/ED+C/C-A/B/C+
85
82
Total
Senior Couple
Housewife 60+ and No Kids <18
Mature Couple
Housewife 45-59 and No Kids <18
Young Couple
Housewife <45 and No Kids <18
Mature Family
Housewife 50+ with Any Kids <18
Established Family
Housewife 40-49 with Any Kids <18
115
10073 105 127 92
87
86
99
105
104
117
98
85 148 106
88 124 143 106
70
76 133
76 111 132
105 127
59 89 112
58 87 112
LifeStyle
BehaviorStage
62 87 111 86 88
Familias y Parejas NSE Medio/Bajo
Zonas con comercio:
-Tradicional-popular
-Comida (restaurantes, comida para llevar y comida rápida)
-Papelerías
Sub desarrollo de Express
Sobre desarrollo Bodegas
Optimización de resultados
ECOSISTEMA ÓPTIMO
Co
pyr
igh
t ©
2014
Th
e N
iels
en C
om
pan
y. C
on
fid
enti
al a
nd
pro
pri
etar
y.
33
Municipios Oriente TARGET POISFORMATO
GCA
TRADICIO-
NALES
Atlautla (MEX) Potencial Potencial
Chimalhuacán (MEX) Potencial Potencial Potencial Potencial
Valle de Chalco Solidaridad (MEX) Potencial Potencial Potencial
Juchitepec (MEX) Potencial Potencial
Tepetlixpa (MEX) Potencial Potencial
Chalco (MEX) Potencial Potencial Potencial Potencial
Temamatla (MEX) Potencial Potencial
Ayapango (MEX) Potencial
Ozumba (MEX) Potencial Potencial
La Paz (MEX) Potencial Potencial
Amecameca (MEX) Potencial Potencial
Tenango del Aire (MEX) Potencial Potencial
Chicoloapan (MEX) Potencial Potencial Potencial
Tlalmanalco (MEX) Potencial Potencial
Cocotitlán (MEX) Potencial Potencial
Ixtapaluca (MEX) Potencial Potencial Potencial Potencial
Tláhuac (DF) Potencial Potencial Potencial
Milpa Alta (DF) Potencial Potencial Potencial
Iztapalapa (DF) Potencial Potencial Potencial Potencial
Nezahualcóyotl (MEX) Potencial Potencial Potencial
Iztacalco (DF) Potencial Potencial Potencial
Xochimilco (DF) Potencial Potencial Potencial Potencial
La Magdalena Contreras (DF) Potencial Potencial
Venustiano Carranza (DF) Potencial Potencial Potencial
Naucalpan de Juárez (MEX) Potencial Potencial Potencial Potencial
Gustavo A. Madero (DF) Potencial Potencial Potencial
Cuajimalpa de Morelos (DF) Potencial Potencial
Cuauhtémoc (DF) Potencial Potencial Potencial
Álvaro Obregón (DF) Potencial Potencial
Tlalpan (DF) Potencial Potencial
Huixquilucan (MEX) Potencial Potencial
Miguel Hidalgo (DF) Potencial
Coyoacán (DF) Potencial Potencial
Benito Juárez (DF) Potencial
P1
P1
P1
P1
P1
P1
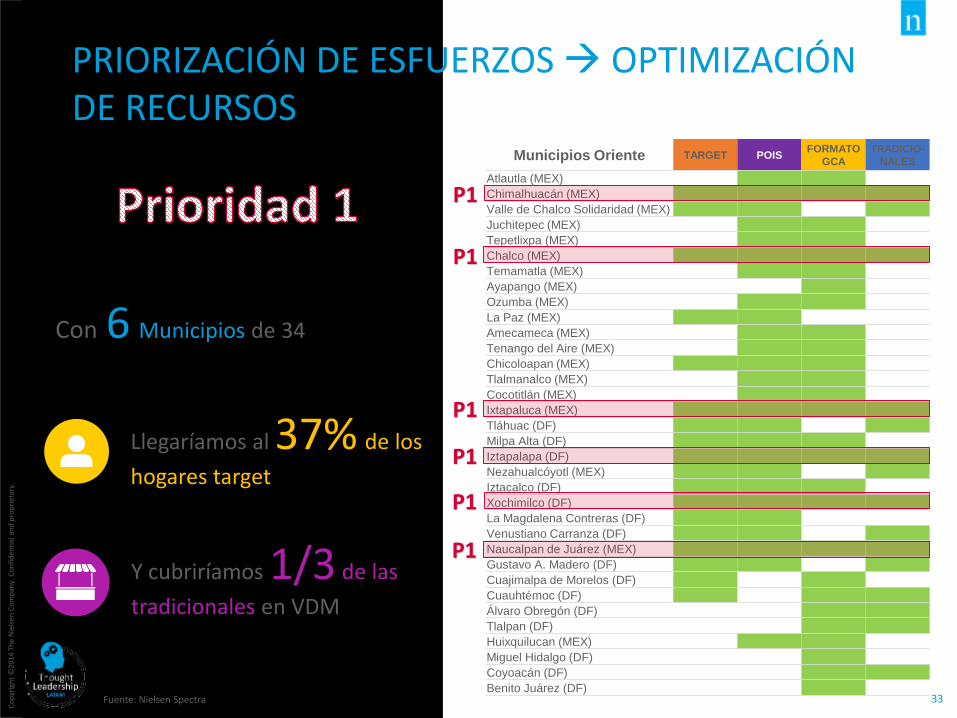
PRIORIZACIÓN DE ESFUERZOS OPTIMIZACIÓN DE RECURSOS
Con 6 Municipios de 34
Llegaríamos al 37% de los
hogares target
Y cubriríamos 1/3 de las
tradicionales en VDM
Fuente: Nielsen Spectra

Co
pyr
igh
t ©
2016
Th
e N
iels
en C
om
pan
y. C
on
fid
enti
al a
nd
pro
pri
etar
y.
34
CON ESTA SEGMENTACIÓN PODEMOS REDUCIR EL SCOPE Y ATERRIZAR DE FORMA EFICIENTE A NIVEL RUTA O MAYORISTA LAS ESTRATEGIAS
En base a estas prioridades podemos aterrizar los esfuerzos a rutas
Prioridad 1
Prioridad 2
Prioridad 3
Y de esta manera priorizar la inversión y el “go to market” de nuestras marcas
Distribución Indirecta / Mayoristas
Distribución Directa / Rutas
Fuente: Nielsen Spectra

DECLARA QUE EL TENDERO TIENE ALGUNA INFLUENCIA EN SU DESICIÓN DE COMPRA
DE LOS MEXICANOS ENCUESTADOS
Fuente: Nielsen Shopper Solutions 2015

Co
pyr
igh
t ©
2016
Th
e N
iels
en C
om
pan
y. C
on
fid
enti
al a
nd
pro
pri
etar
y.
36
TENDERO Y DISTRIBUIDOR
PARA LOS TENDEROS MEXICANOS:¿Qué consideras que los fabricantes deben hacer para ayudarte en tu negocio?
Fuente: Encuesta a Dueños de Tiendas 2015
LA VOZ DE LOS TENDEROS NECESITA
SER ESCUCHADA
8%
8%
15%
27%
25%
Beneficios extras para minegocio (Pintar Paredes)
Visitas más frecuentes
Paquetes Promocionales
Más producto por Volumende Compra
Más Crédito
Mencionada como la más importante
Co
pyr
igh
t ©
2016
Th
e N
iels
en C
om
pan
y. C
on
fid
enti
al a
nd
pro
pri
etar
y.
37
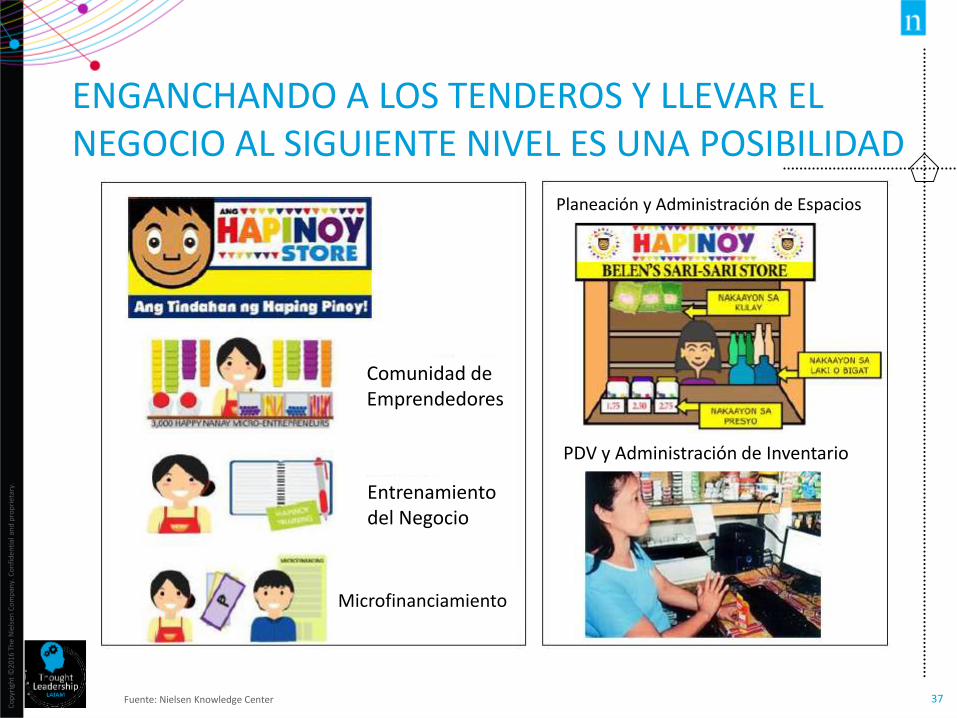
ENGANCHANDO A LOS TENDEROS Y LLEVAR EL NEGOCIO AL SIGUIENTE NIVEL ES UNA POSIBILIDAD
Comunidad de Emprendedores
Entrenamiento del Negocio
Microfinanciamiento
PDV y Administración de Inventario
Planeación y Administración de Espacios
Fuente: Nielsen Knowledge Center
Co
pyr
igh
t ©
2016
Th
e N
iels
en C
om
pan
y. C
on
fid
enti
al a
nd
pro
pri
etar
y.
38
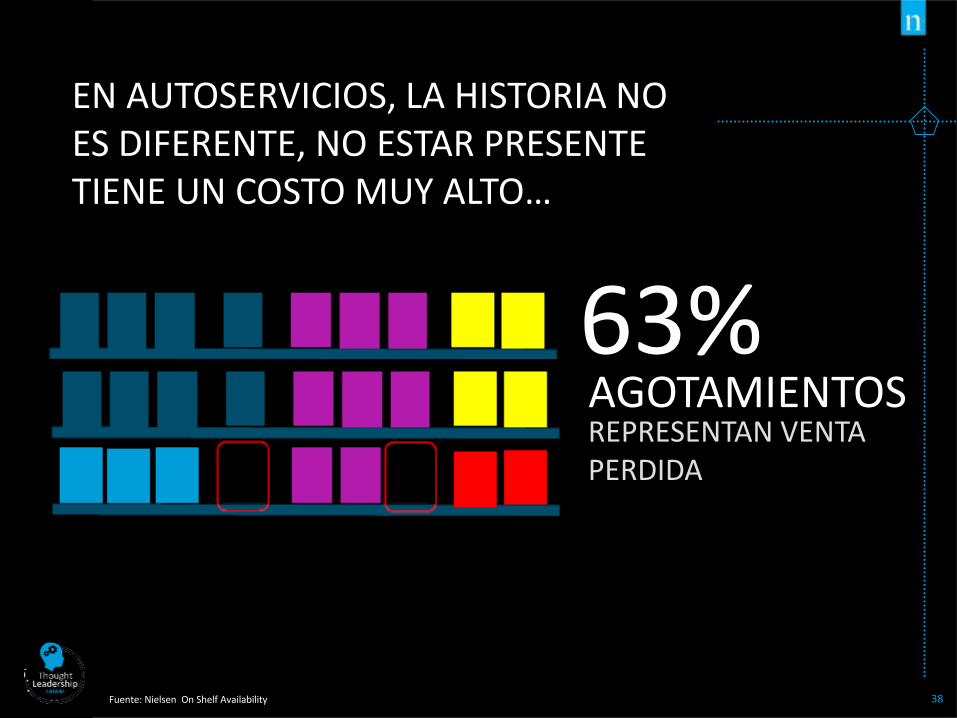
EN AUTOSERVICIOS, LA HISTORIA NO ES DIFERENTE, NO ESTAR PRESENTE TIENE UN COSTO MUY ALTO…
Fuente: Nielsen On Shelf Availability
63%REPRESENTAN VENTA PERDIDA
AGOTAMIENTOS
Co
pyr
igh
t ©
2016
Th
e N
iels
en C
om
pan
y. C
on
fid
enti
al a
nd
pro
pri
etar
y.
39
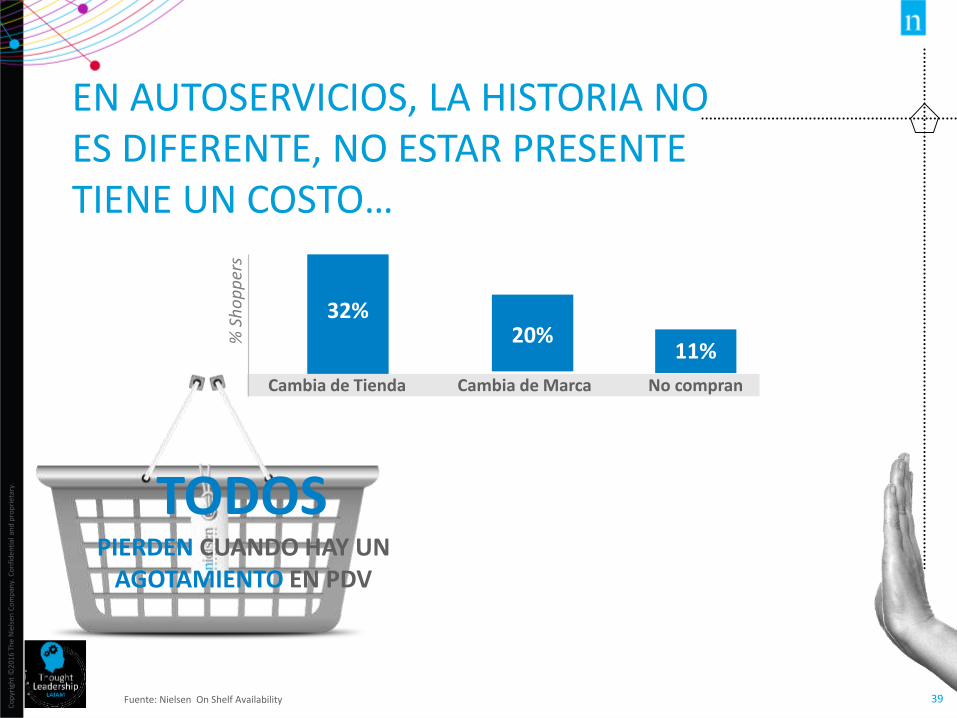
EN AUTOSERVICIOS, LA HISTORIA NO ES DIFERENTE, NO ESTAR PRESENTE TIENE UN COSTO…
Fuente: Nielsen On Shelf Availability
Cambia de Tienda Cambia de Marca No compran
PIERDEN CUANDO HAY UN AGOTAMIENTO EN PDV
TODOS
32%20%
11%
% S
ho
pp
ers

Co
pyr
igh
t ©
2016
Th
e N
iels
en C
om
pan
y. C
on
fid
enti
al a
nd
pro
pri
etar
y.
40
HAY QUE RECORDAR QUE PARA INCREMENTAR DEMANDA EN EL PDV NO TODO ES PRECIOIMPACTO PROMEDIO POR TIENDAÍTEM AL EJECUTAR SOBRE UN SKU REGULAR
Fuente: Nielsen Analytic Consulting *Price & Promo° 140 ítems analizados y 200,000 observaciones promedio por ítem
10% de Descuento 21% 16%
20% de Descuento 51% 36%
30% 39%Exhibiciones en Punto de Venta
37% 22%POP
64% 43%Empaques Promocionales
TOTAL ALIMENTOS