PyData NYC 2015 Presentation
35
Building Interactive Visualizations with VTK, Matplotlib and Enaml Pawel Potocki PyData NYC 2015 PyData NYC 2015
Transcript of PyData NYC 2015 Presentation
Building Interactive Visualizations with VTK,
Matplotlib and Enaml
Pawel PotockiPyData NYC 2015
PyData NYC 2015
Introduction• Pawel Potocki
• JPMorgan Commodities EMM Technology
• Data Visualization and Analysis in late 1990 and early 2000 at JPMorgan with C++ and Java
• Last few years of heavy Python development
• Data Visualization important part of work
PyData NYC 2015

Tutorial Content• Visualization tools in Python - overview
• UI Toolkits in Python - looking for best choice
• Enaml - UI toolkit explained
• Enaml - features overview - examples
• VTK visualization pipeline explained
• VTK - building with Enaml - examples
• Matplotlib charting overview
• Matplotlib - building with Enaml - examples
• VTK and Matplotlib interaction with Enaml - examples
• Closing notes
• Resources
PyData NYC 2015
Why building interactive visualizations
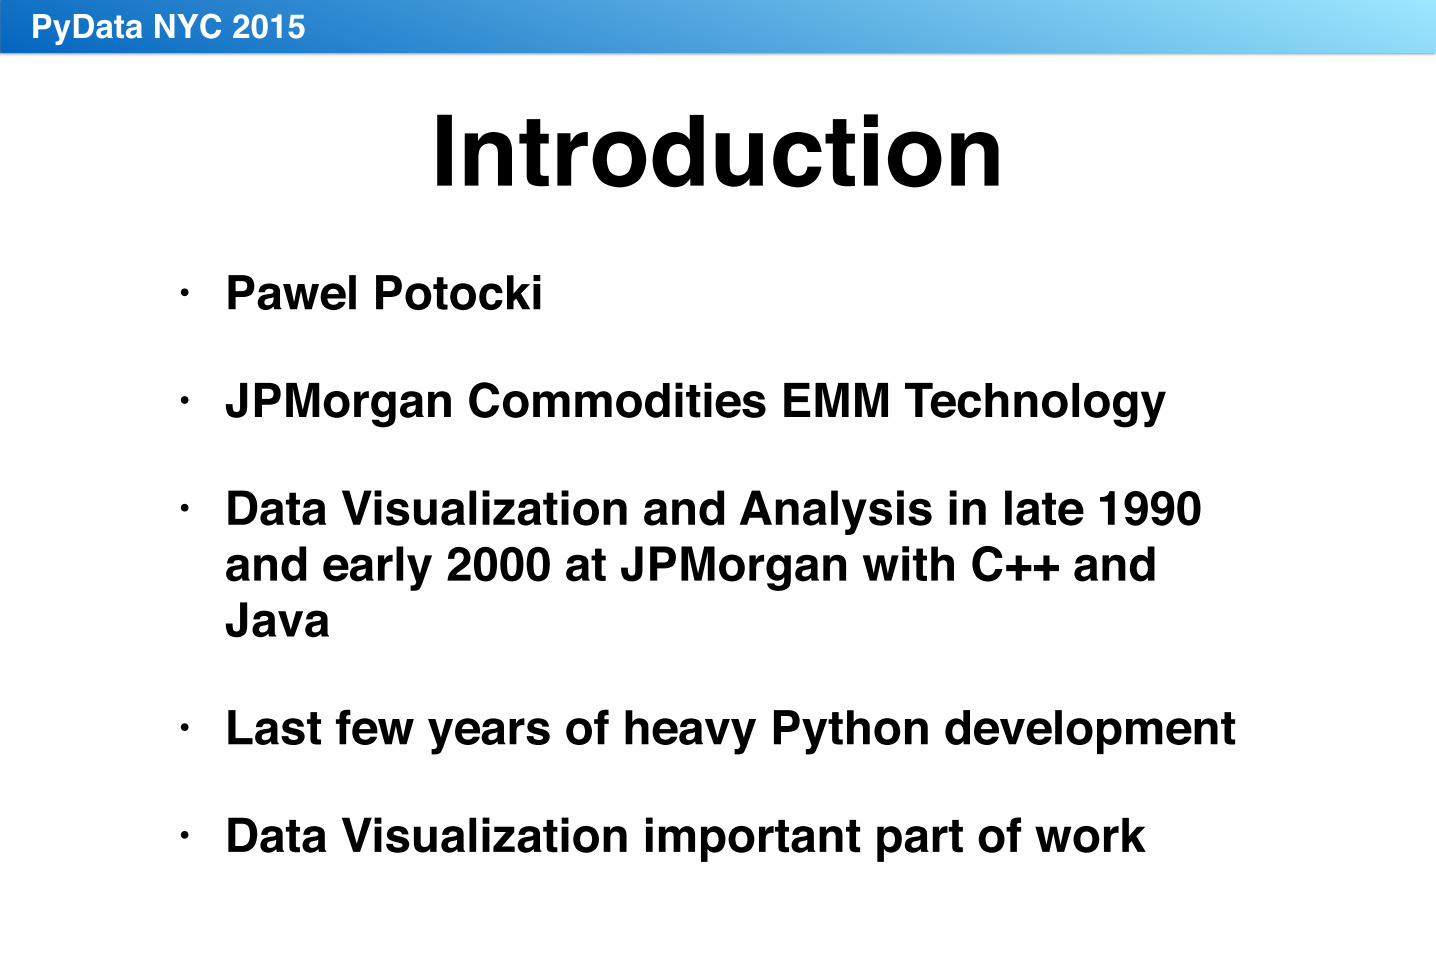
• There are many UI Web frameworks based on HTML5 and Canvas - like Bokeh
• Using Jupiter notebook (ipython)
• Desktop apps still offer advantages over web apps
• In many cases we need to inspect data by visualization
• Building interactive apps quickly in business environment is crucial to help making right decision
• Quality and easy of operation is important
PyData NYC 2015
Python for Data Analysis and Visualization
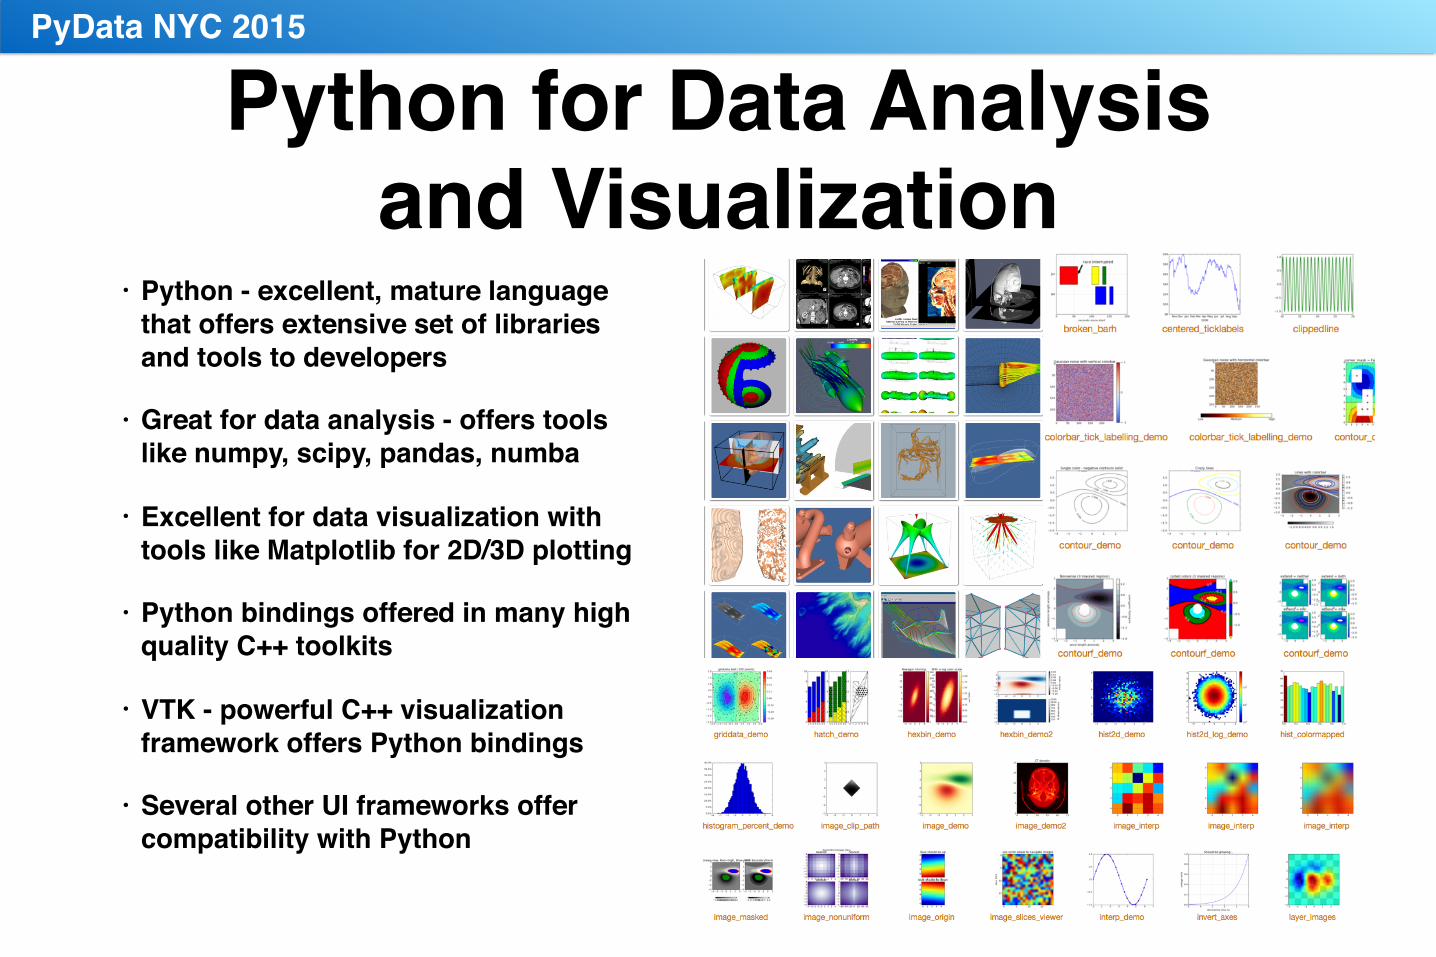
• Python - excellent, mature language that offers extensive set of libraries and tools to developers
• Great for data analysis - offers tools like numpy, scipy, pandas, numba
• Excellent for data visualization with tools like Matplotlib for 2D/3D plotting
• Python bindings offered in many high quality C++ toolkits
• VTK - powerful C++ visualization framework offers Python bindings
• Several other UI frameworks offer compatibility with Python
PyData NYC 2015
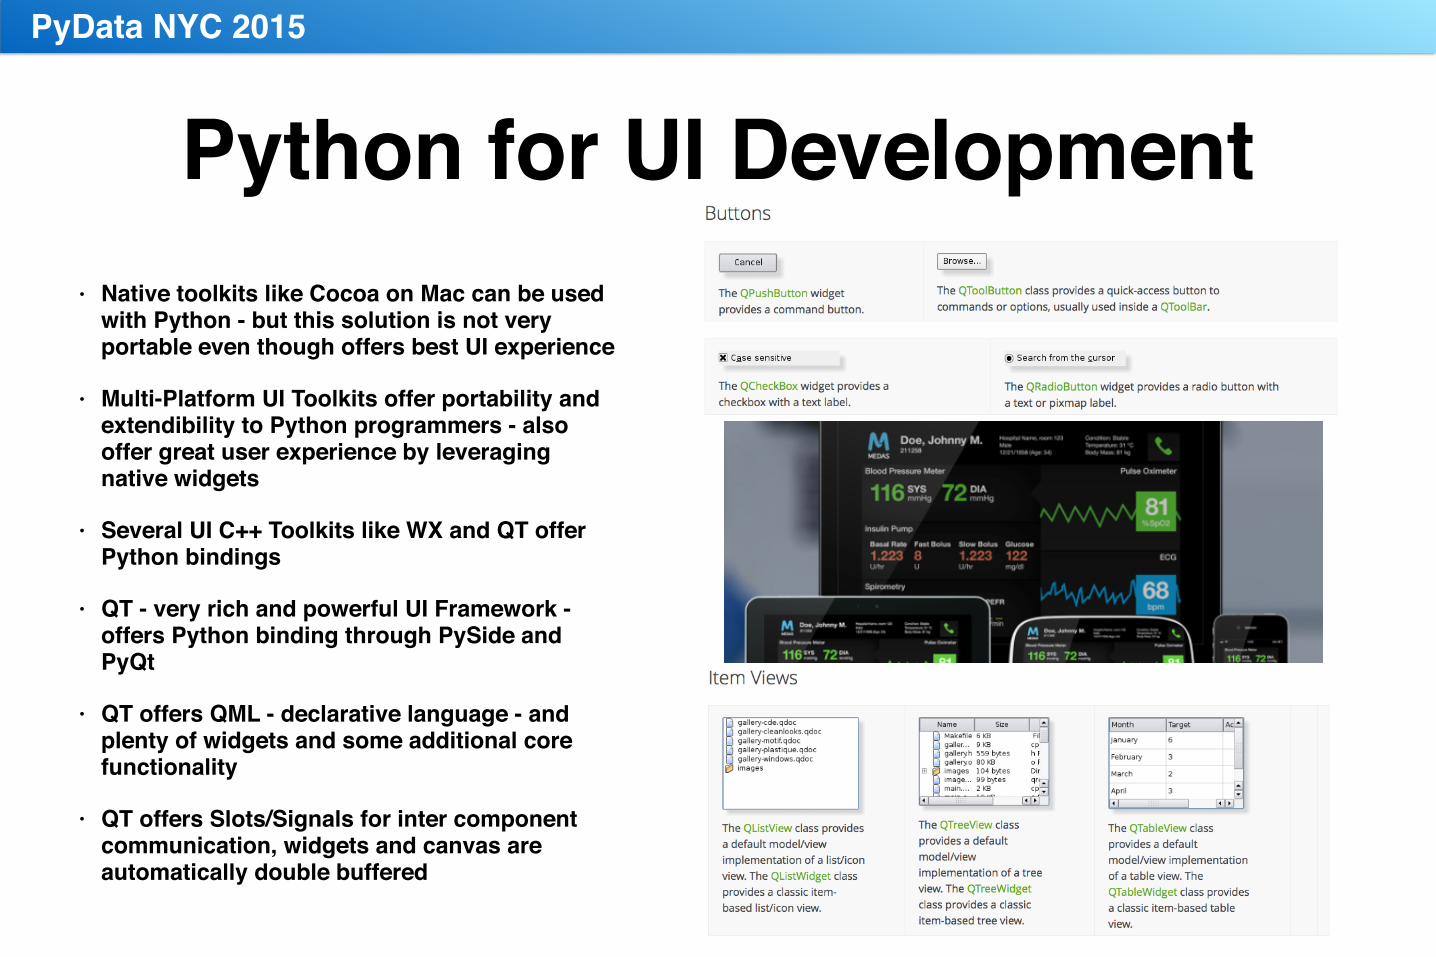
Python for UI Development • Native toolkits like Cocoa on Mac can be used
with Python - but this solution is not very portable even though offers best UI experience
• Multi-Platform UI Toolkits offer portability and extendibility to Python programmers - also offer great user experience by leveraging native widgets
• Several UI C++ Toolkits like WX and QT offer Python bindings
• QT - very rich and powerful UI Framework - offers Python binding through PySide and PyQt
• QT offers QML - declarative language - and plenty of widgets and some additional core functionality
• QT offers Slots/Signals for inter component communication, widgets and canvas are automatically double buffered
PyData NYC 2015
Enaml - Python Native UI Language and Framework
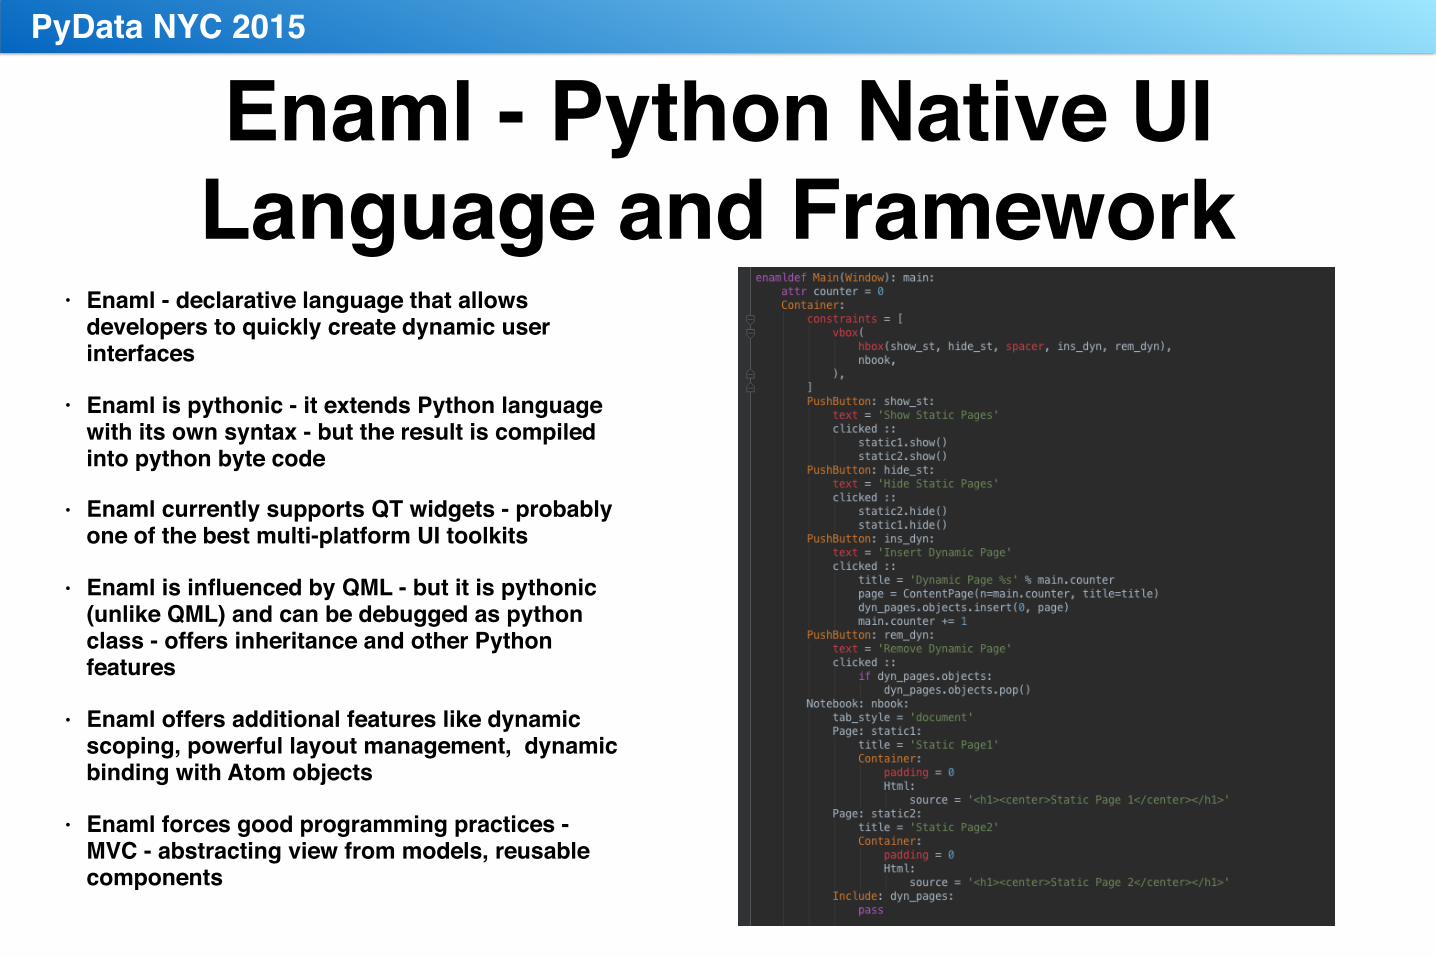
• Enaml - declarative language that allows developers to quickly create dynamic user interfaces
• Enaml is pythonic - it extends Python language with its own syntax - but the result is compiled into python byte code
• Enaml currently supports QT widgets - probably one of the best multi-platform UI toolkits
• Enaml is influenced by QML - but it is pythonic (unlike QML) and can be debugged as python class - offers inheritance and other Python features
• Enaml offers additional features like dynamic scoping, powerful layout management, dynamic binding with Atom objects
• Enaml forces good programming practices - MVC - abstracting view from models, reusable components
PyData NYC 2015
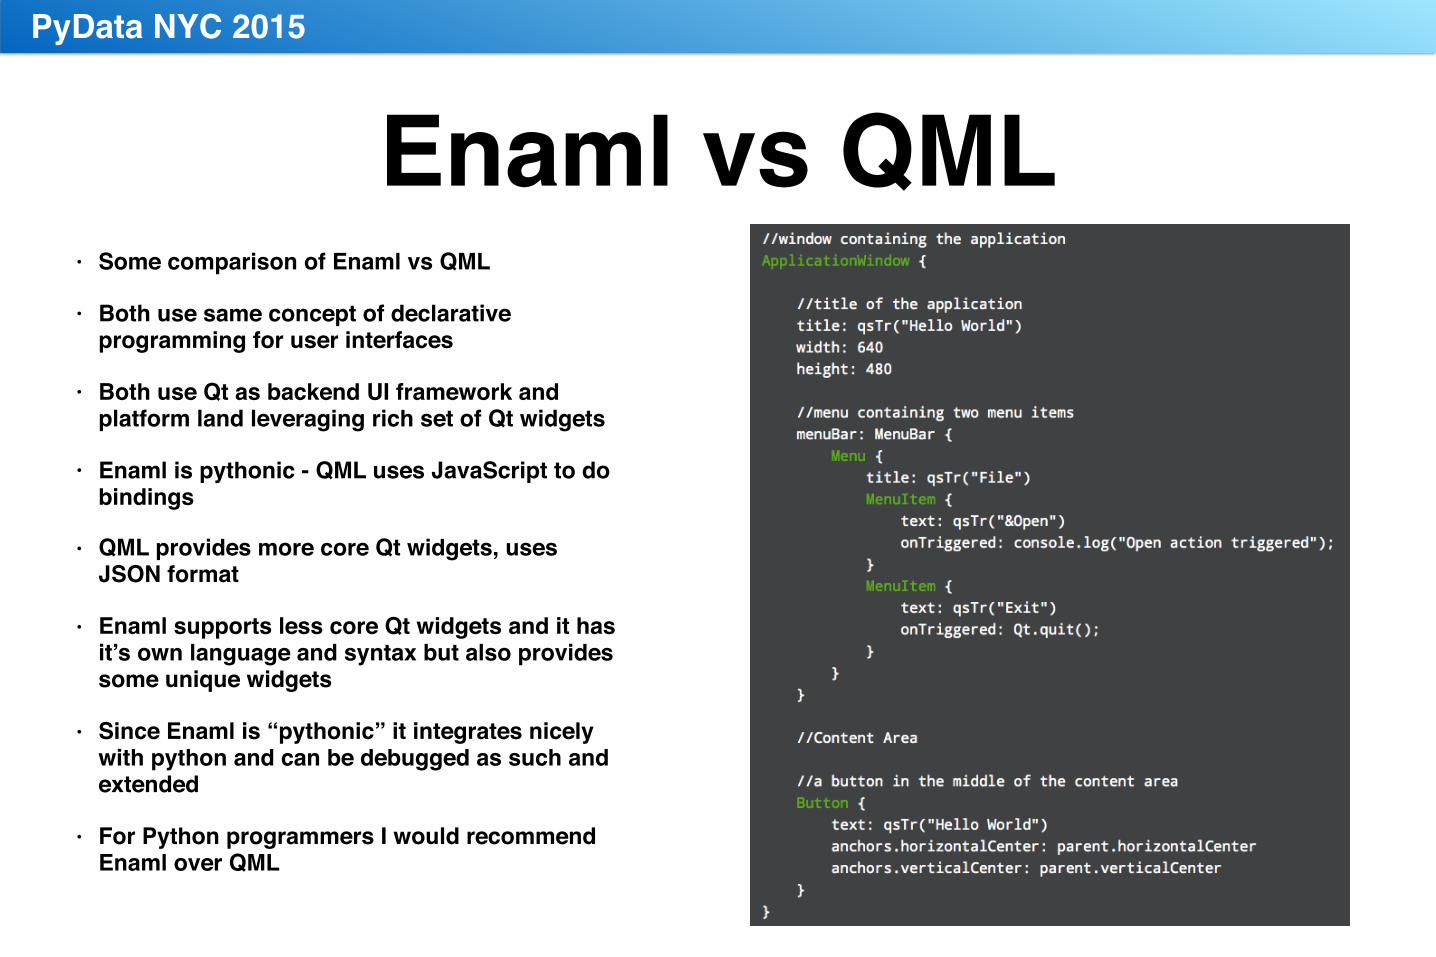
Enaml vs QML• Some comparison of Enaml vs QML
• Both use same concept of declarative programming for user interfaces
• Both use Qt as backend UI framework and platform land leveraging rich set of Qt widgets
• Enaml is pythonic - QML uses JavaScript to do bindings
• QML provides more core Qt widgets, uses JSON format
• Enaml supports less core Qt widgets and it has it’s own language and syntax but also provides some unique widgets
• Since Enaml is “pythonic” it integrates nicely with python and can be debugged as such and extended
• For Python programmers I would recommend Enaml over QML
PyData NYC 2015
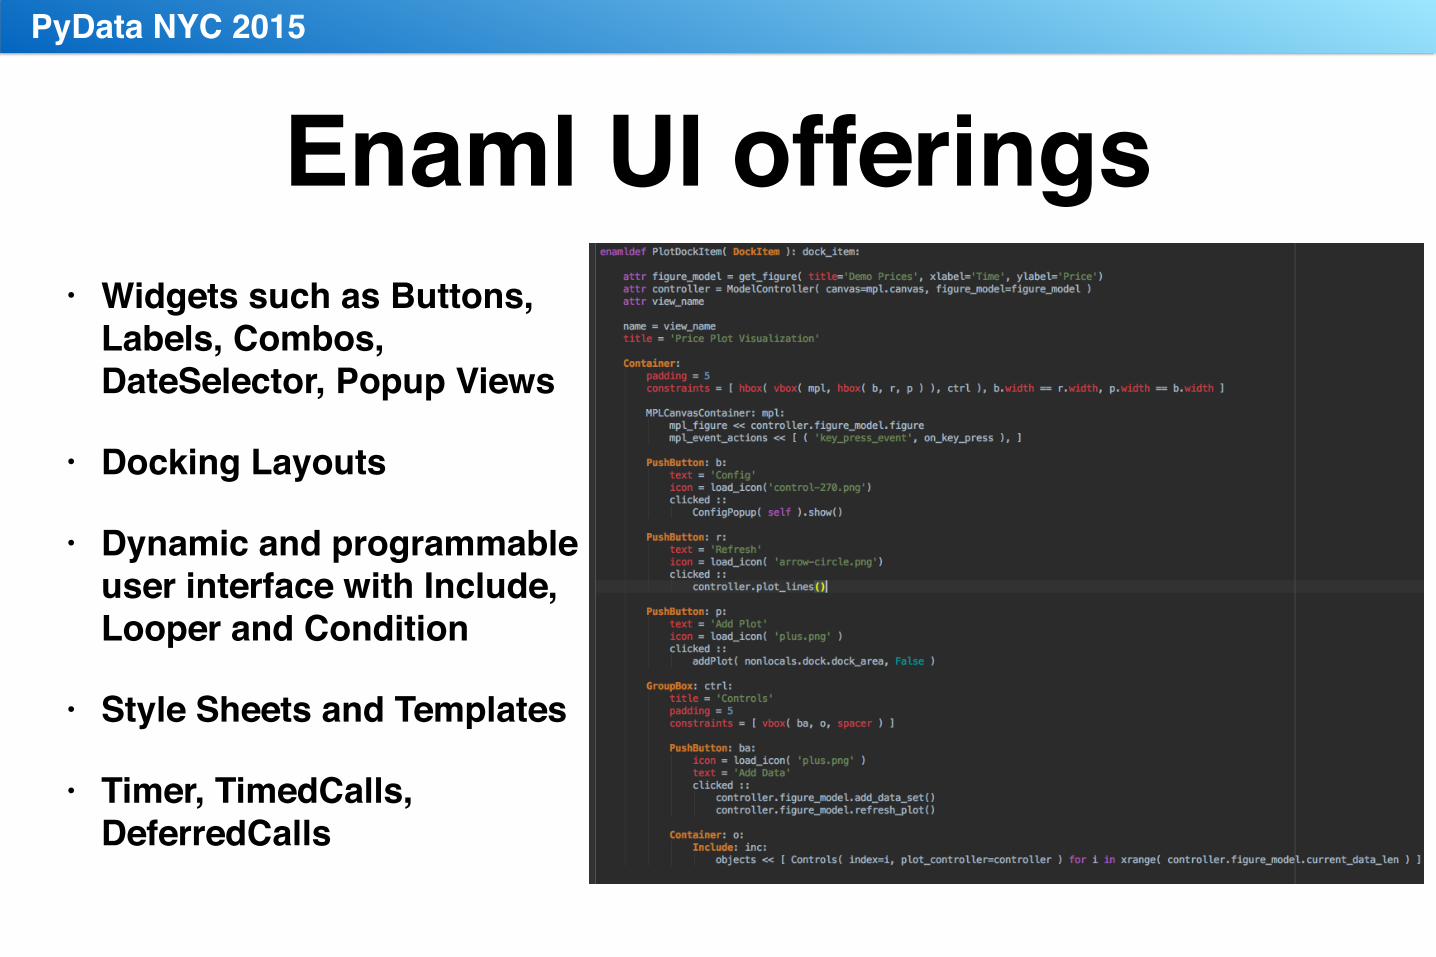
Enaml UI offerings• Widgets such as Buttons,
Labels, Combos, DateSelector, Popup Views
• Docking Layouts
• Dynamic and programmable user interface with Include, Looper and Condition
• Style Sheets and Templates
• Timer, TimedCalls, DeferredCalls
PyData NYC 2015
VTK for immersive 3D and 4D data visualizations
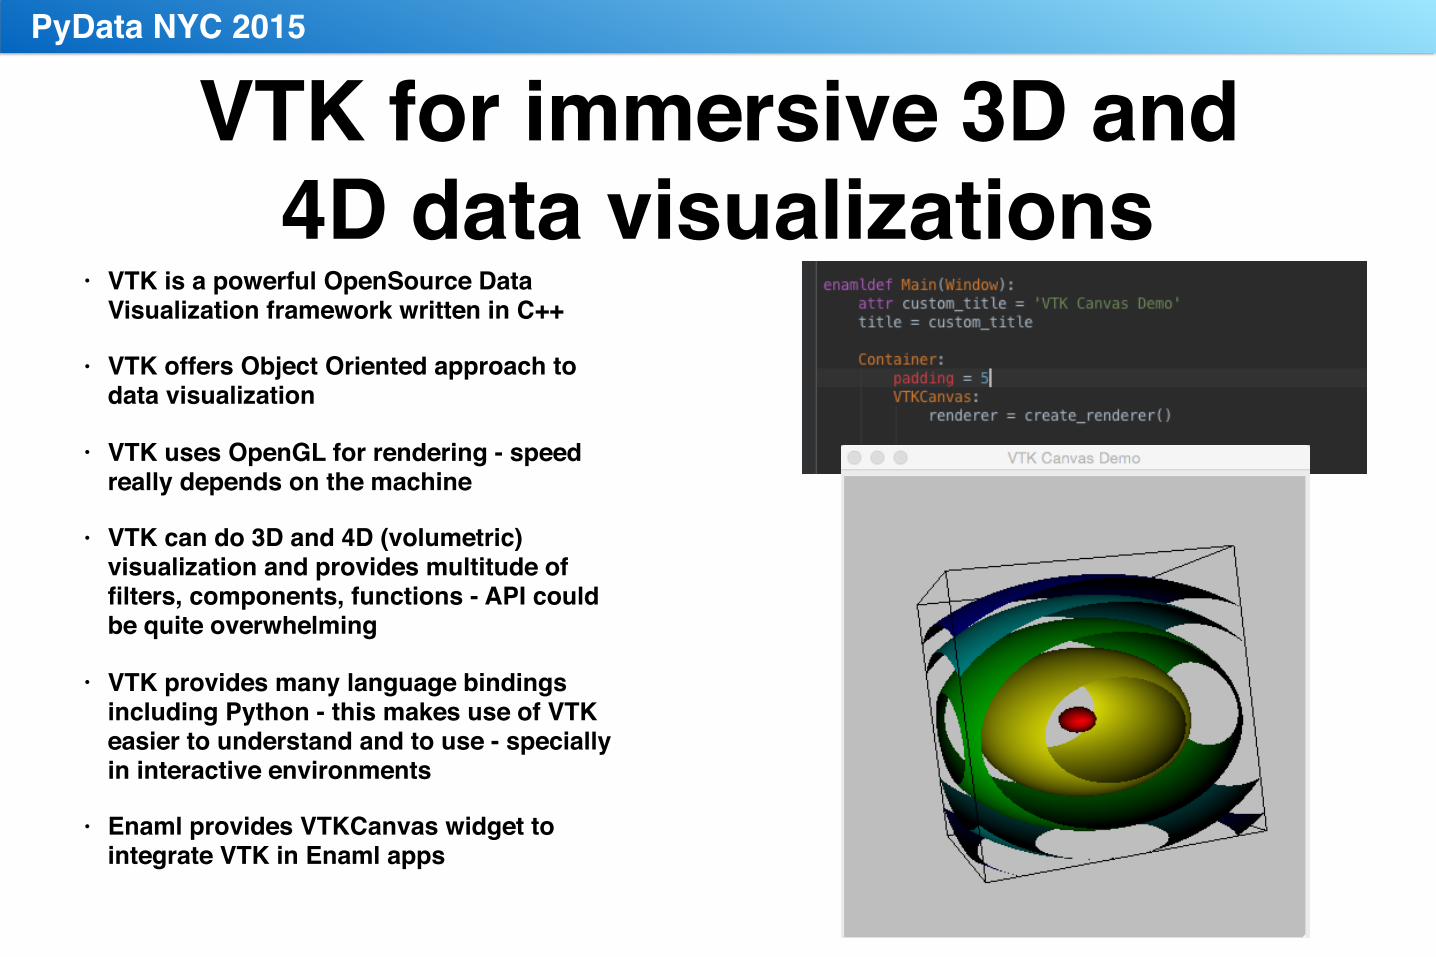
• VTK is a powerful OpenSource Data Visualization framework written in C++
• VTK offers Object Oriented approach to data visualization
• VTK uses OpenGL for rendering - speed really depends on the machine
• VTK can do 3D and 4D (volumetric) visualization and provides multitude of filters, components, functions - API could be quite overwhelming
• VTK provides many language bindings including Python - this makes use of VTK easier to understand and to use - specially in interactive environments
• Enaml provides VTKCanvas widget to integrate VTK in Enaml apps
PyData NYC 2015
Matplotlib for 2D plotting and Realtime charting
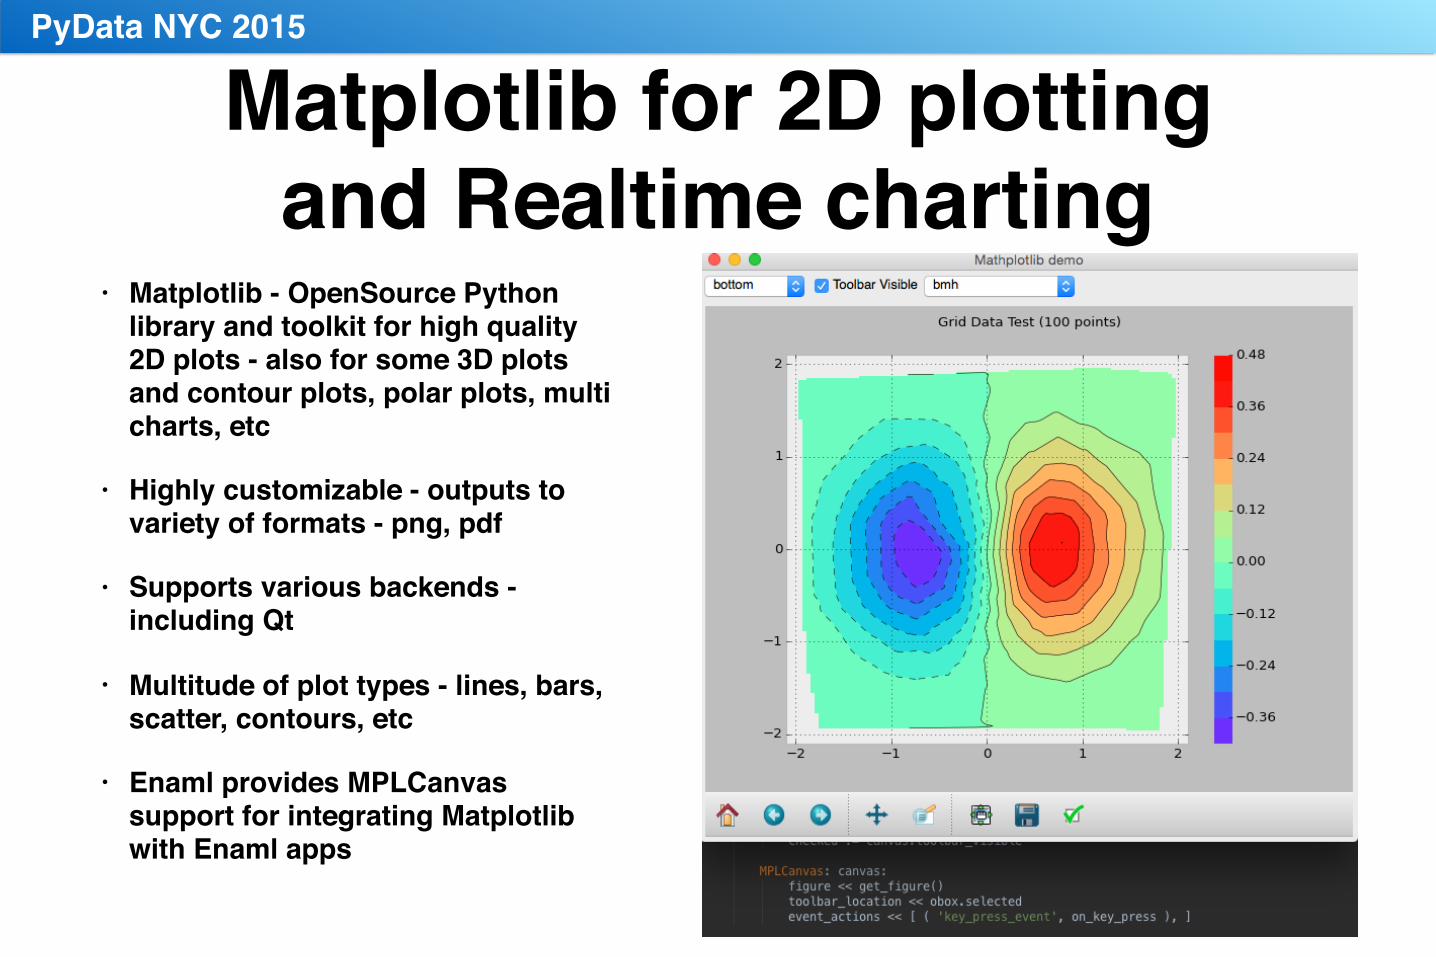
• Matplotlib - OpenSource Python library and toolkit for high quality 2D plots - also for some 3D plots and contour plots, polar plots, multi charts, etc
• Highly customizable - outputs to variety of formats - png, pdf
• Supports various backends - including Qt
• Multitude of plot types - lines, bars, scatter, contours, etc
• Enaml provides MPLCanvas support for integrating Matplotlib with Enaml apps
PyData NYC 2015

Putting things together:Frameworks for interactive Data
Visualization• All tools discussed here are offered in Open Source Anaconda Python
distribution 2.3.0 for Python 2.7 - update using conda if need it
• Matplotlib version 1.4.3
• Pandas version 0.17
• Numpy version 1.10.1
• Enaml version 0.9.8
• Atom version 0.3.9
• VTK - version 6.3
• QT - version 4.8
PyData NYC 2015

Enaml dynamic binding concepts explained
• Enaml provides dynamic binding with use of Atom based classes - powerful feature that allows quick and easy development of interactive UI’s
• Atom is C++/Python framework that provides memory saving, speed, and dynamic bi-directional bindings between models and UI components
• Atom provides state notifications - when member is notified of change - actions can be performed
PyData NYC 2015

Enaml is Python - create new components as you would new classes
in Python• Enaml offers good range
of widgets ( Qt based )
• Sometimes you need to create new widgets or extend existing one by adding new functionality
• Creating new Slider widget by encapsulating and extending existing one
• Expose new attributes to the outside world
PyData NYC 2015
How Enaml binds with your model using Atom
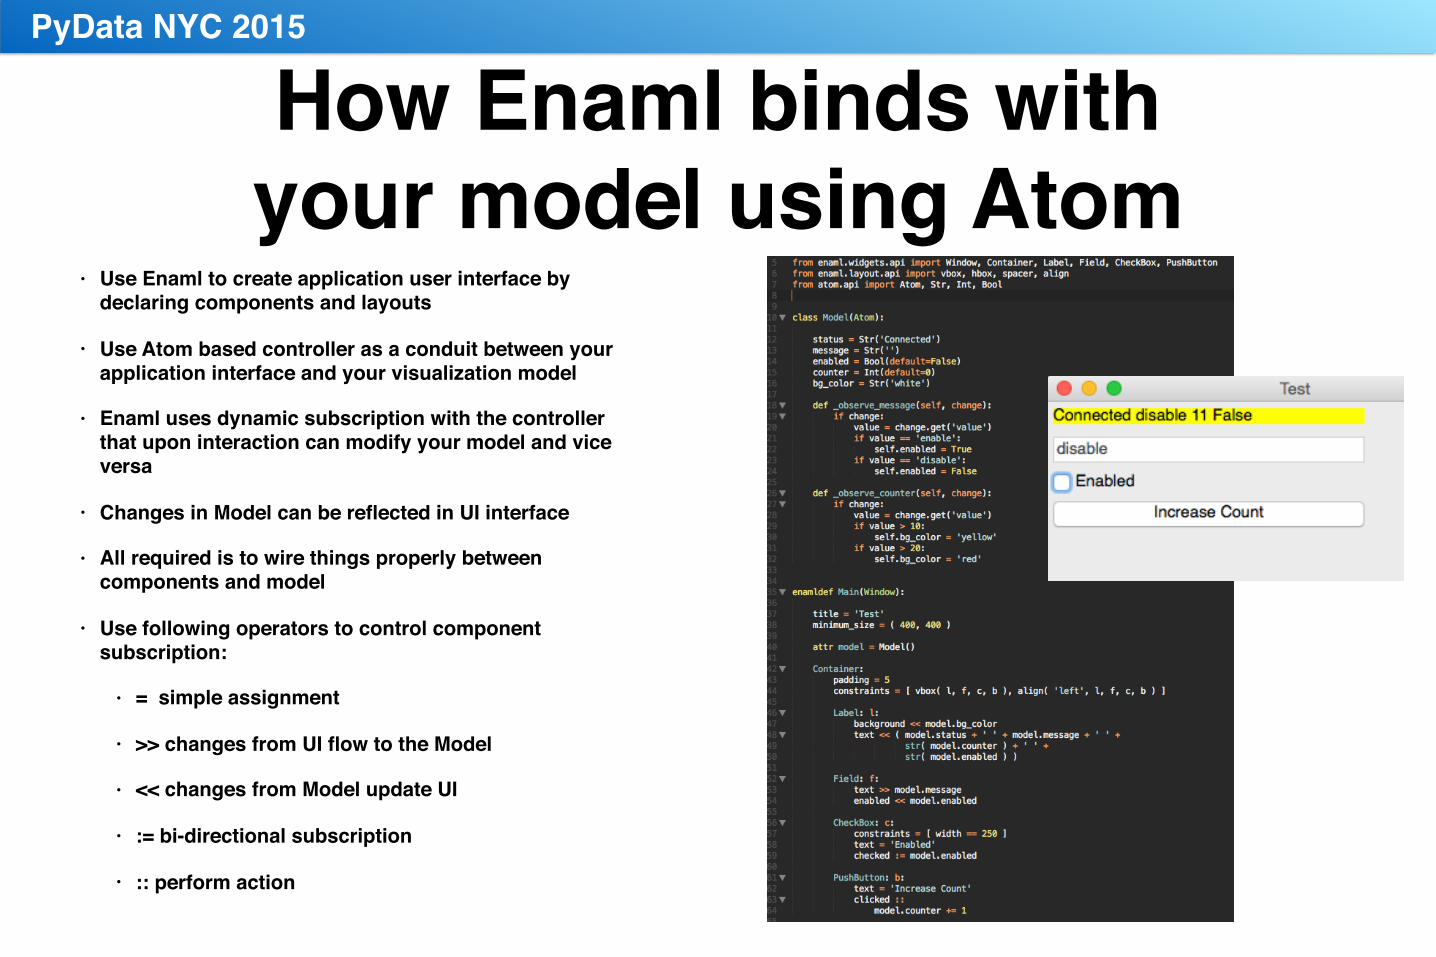
• Use Enaml to create application user interface by declaring components and layouts
• Use Atom based controller as a conduit between your application interface and your visualization model
• Enaml uses dynamic subscription with the controller that upon interaction can modify your model and vice versa
• Changes in Model can be reflected in UI interface
• All required is to wire things properly between components and model
• Use following operators to control component subscription:
• = simple assignment
• >> changes from UI flow to the Model
• << changes from Model update UI
• := bi-directional subscription
• :: perform action
PyData NYC 2015
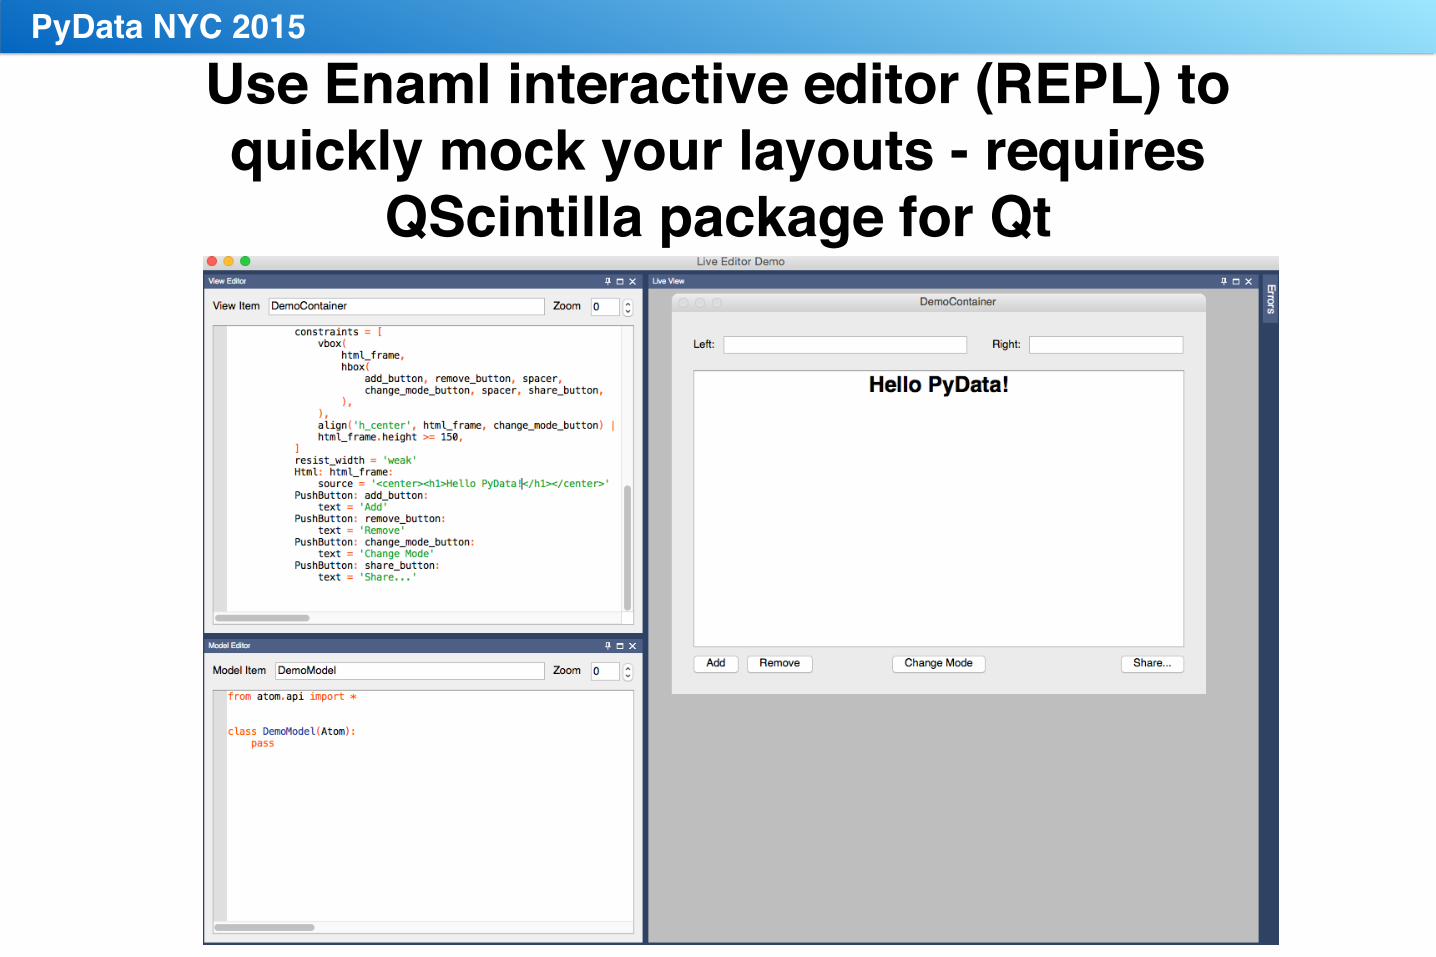
Use Enaml interactive editor (REPL) to quickly mock your layouts - requires
QScintilla package for Qt
PyData NYC 2015
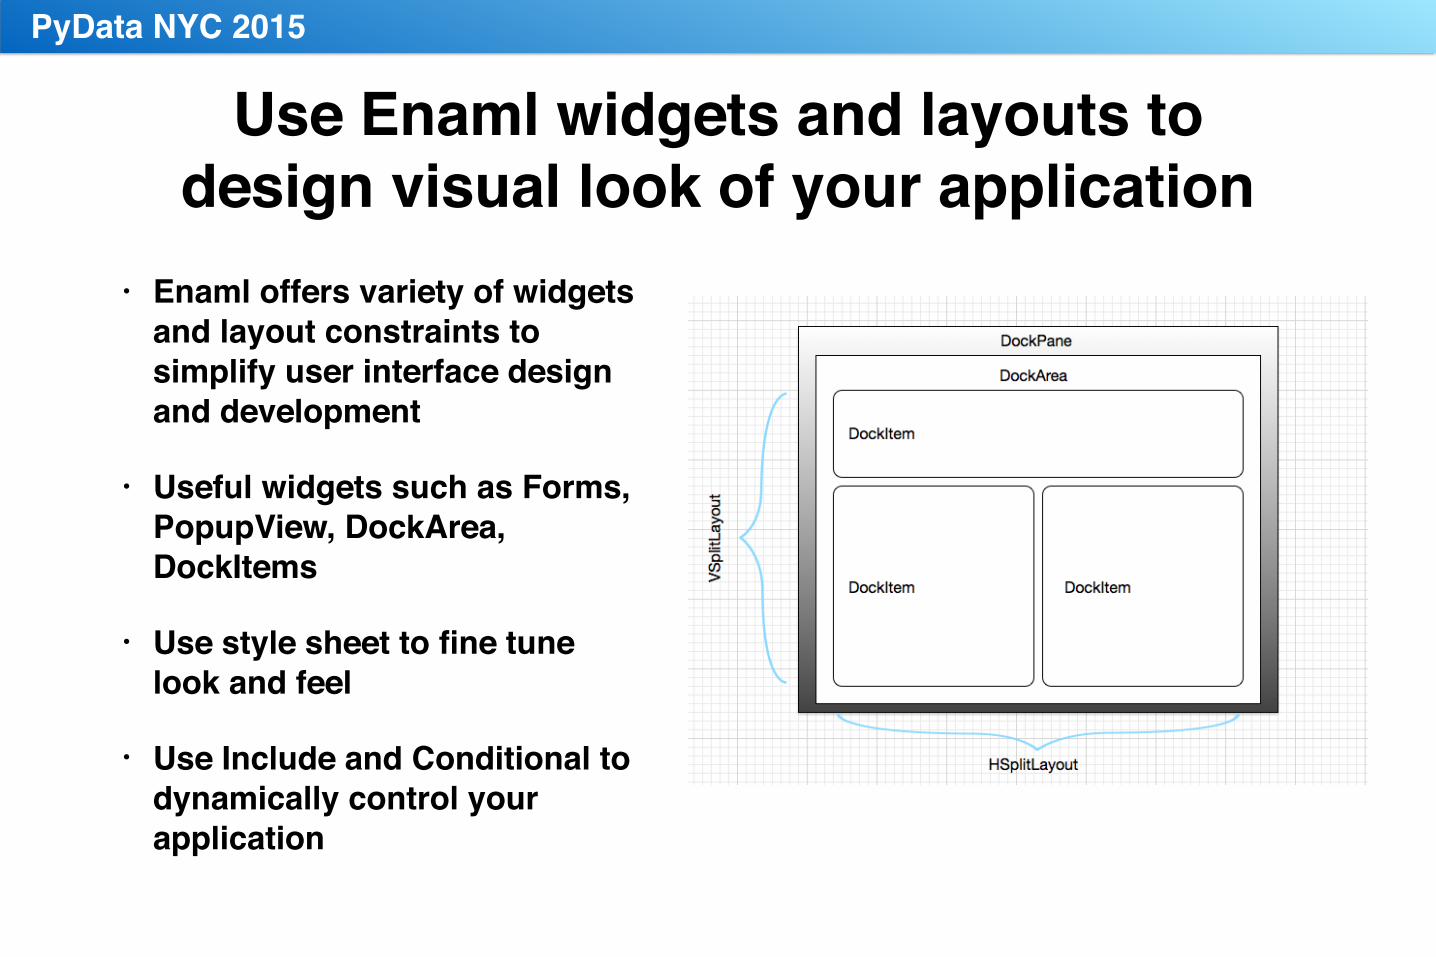
Use Enaml widgets and layouts to design visual look of your application
• Enaml offers variety of widgets and layout constraints to simplify user interface design and development
• Useful widgets such as Forms, PopupView, DockArea, DockItems
• Use style sheet to fine tune look and feel
• Use Include and Conditional to dynamically control your application
PyData NYC 2015
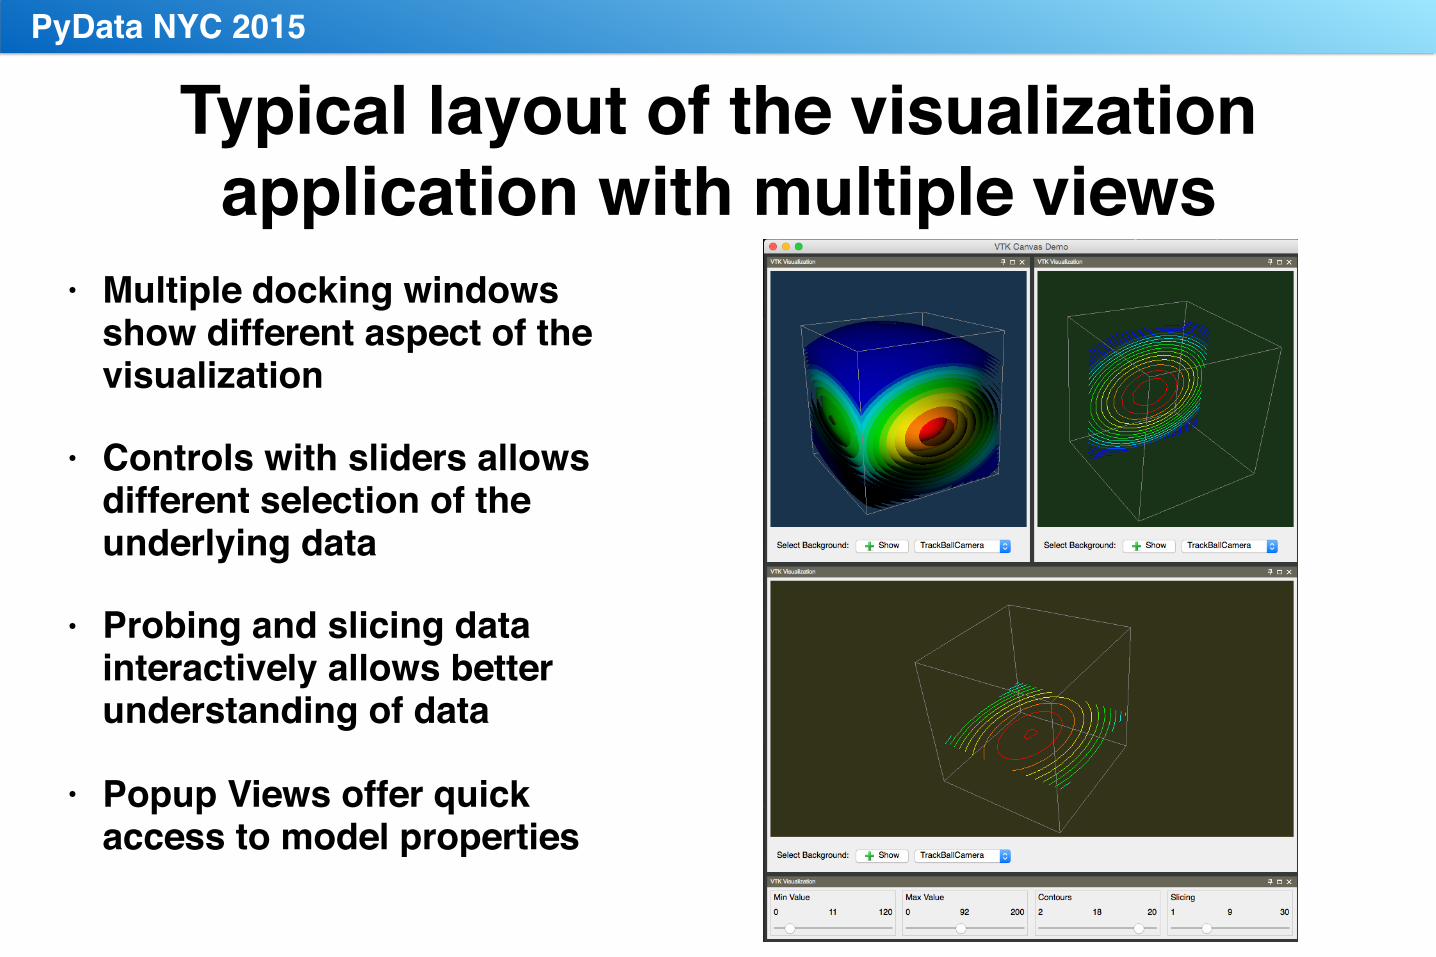
Typical layout of the visualization application with multiple views
• Multiple docking windows show different aspect of the visualization
• Controls with sliders allows different selection of the underlying data
• Probing and slicing data interactively allows better understanding of data
• Popup Views offer quick access to model properties
PyData NYC 2015

Bootstrap Enaml file in Python with QT Application
• Enaml has support in some editors like Sublime Text
• Some editors like PyCharm can be easily extended to support Enaml syntax
• You can run Enaml file from command line: enaml-run <your-file.enaml>
• Bootstrap Enaml file in the code
• With bootstrapping you can pass your arguments into Enaml file and you can also run in debug mode
PyData NYC 2015
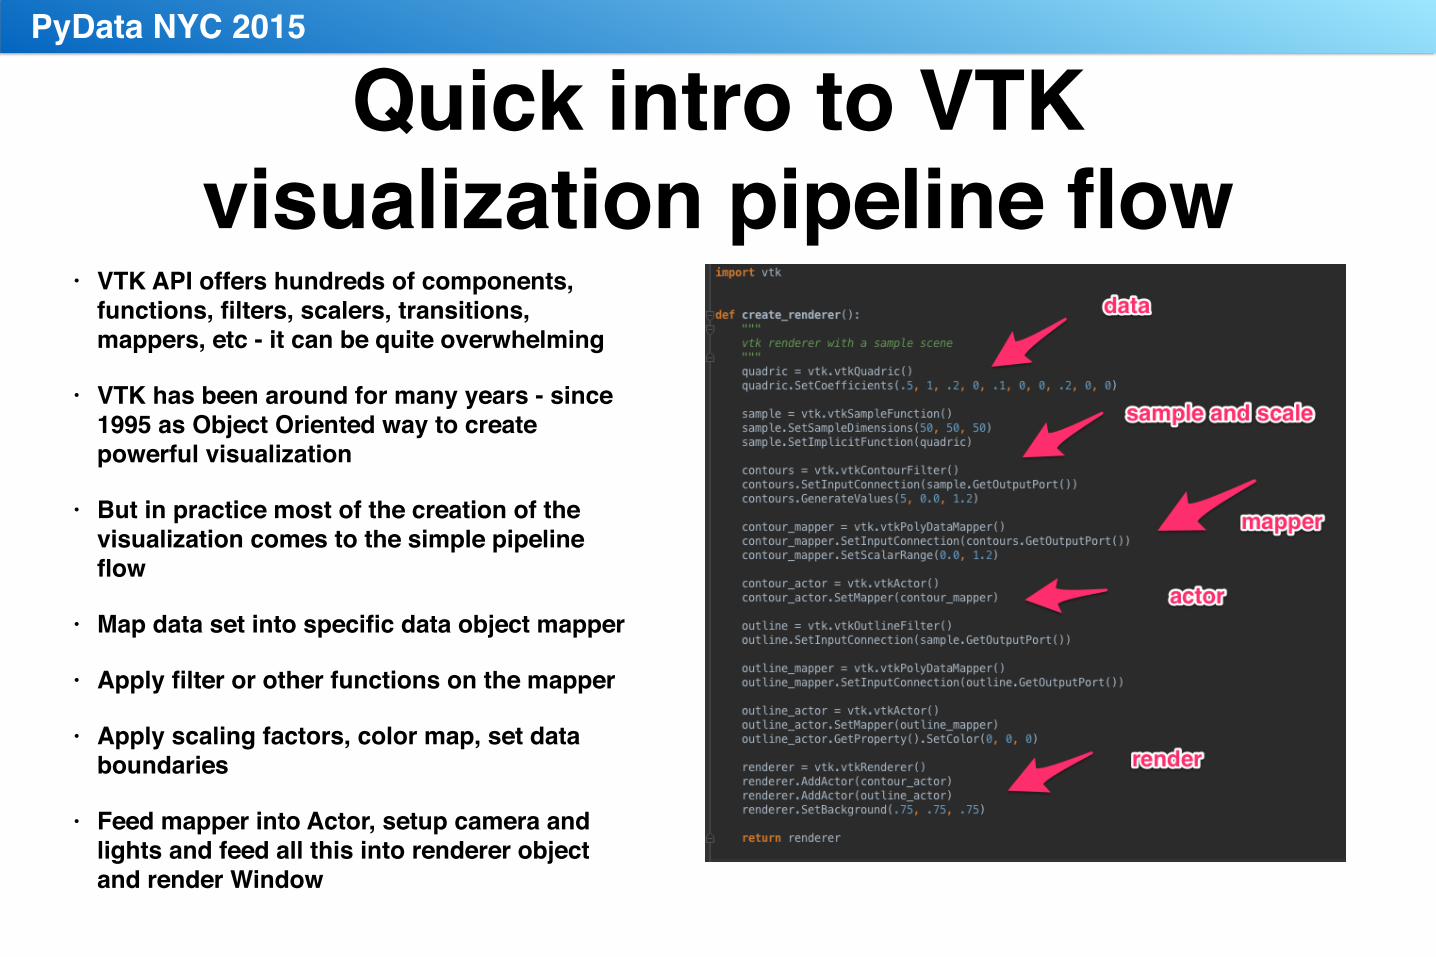
Quick intro to VTK visualization pipeline flow
• VTK API offers hundreds of components, functions, filters, scalers, transitions, mappers, etc - it can be quite overwhelming
• VTK has been around for many years - since 1995 as Object Oriented way to create powerful visualization
• But in practice most of the creation of the visualization comes to the simple pipeline flow
• Map data set into specific data object mapper
• Apply filter or other functions on the mapper
• Apply scaling factors, color map, set data boundaries
• Feed mapper into Actor, setup camera and lights and feed all this into renderer object and render Window
PyData NYC 2015
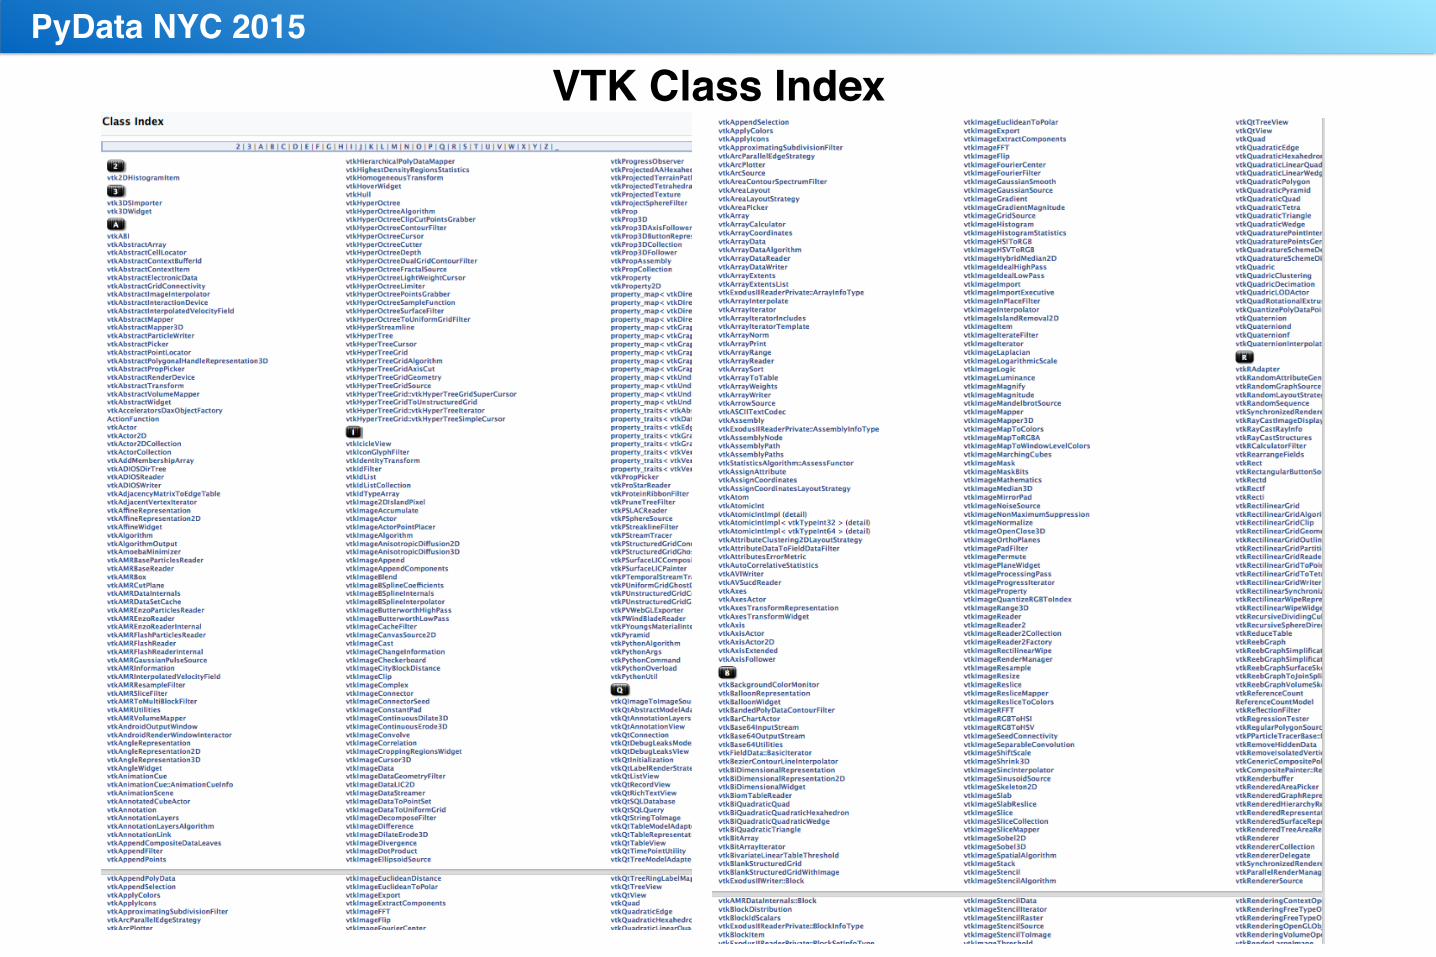
VTK Class IndexPyData NYC 2015
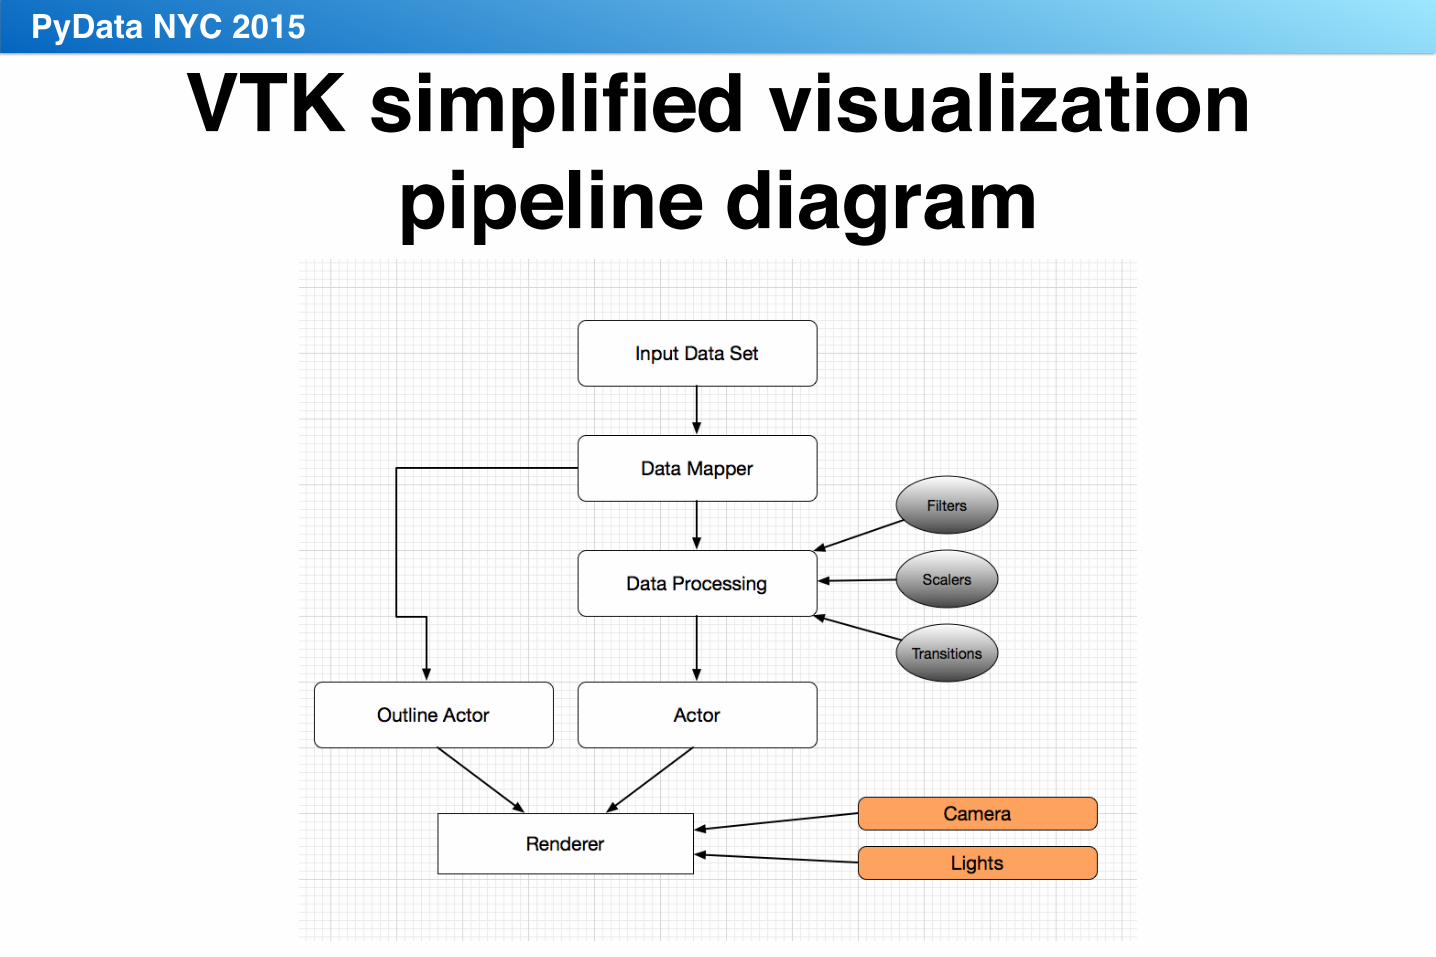
VTK simplified visualization pipeline diagram
PyData NYC 2015
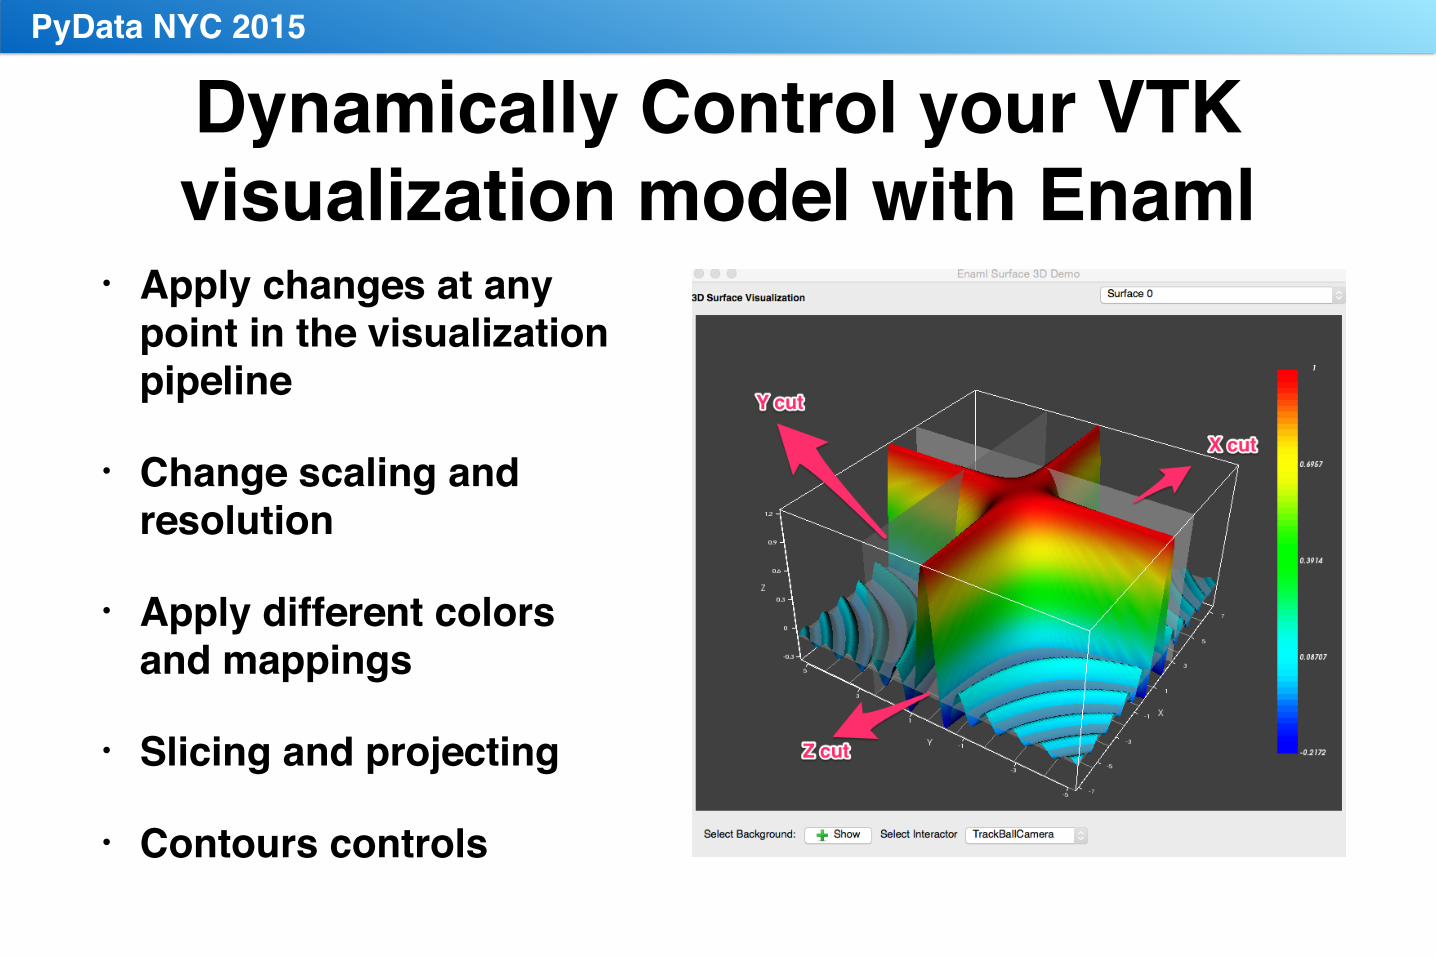
Dynamically Control your VTK visualization model with Enaml
• Apply changes at any point in the visualization pipeline
• Change scaling and resolution
• Apply different colors and mappings
• Slicing and projecting
• Contours controls
PyData NYC 2015
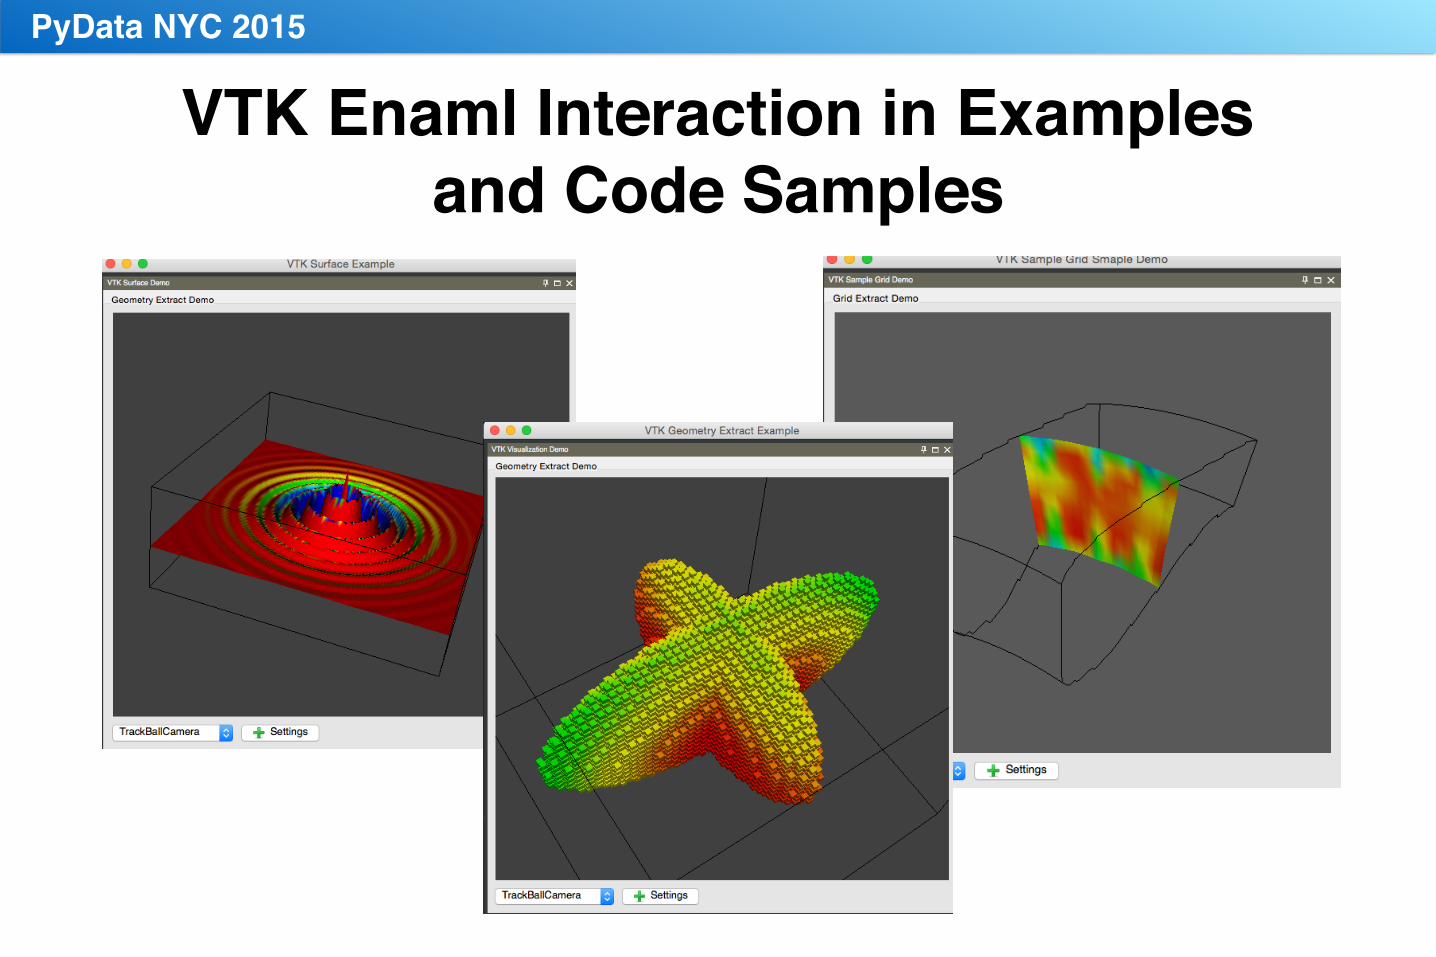
VTK Enaml Interaction in Examplesand Code Samples
PyData NYC 2015
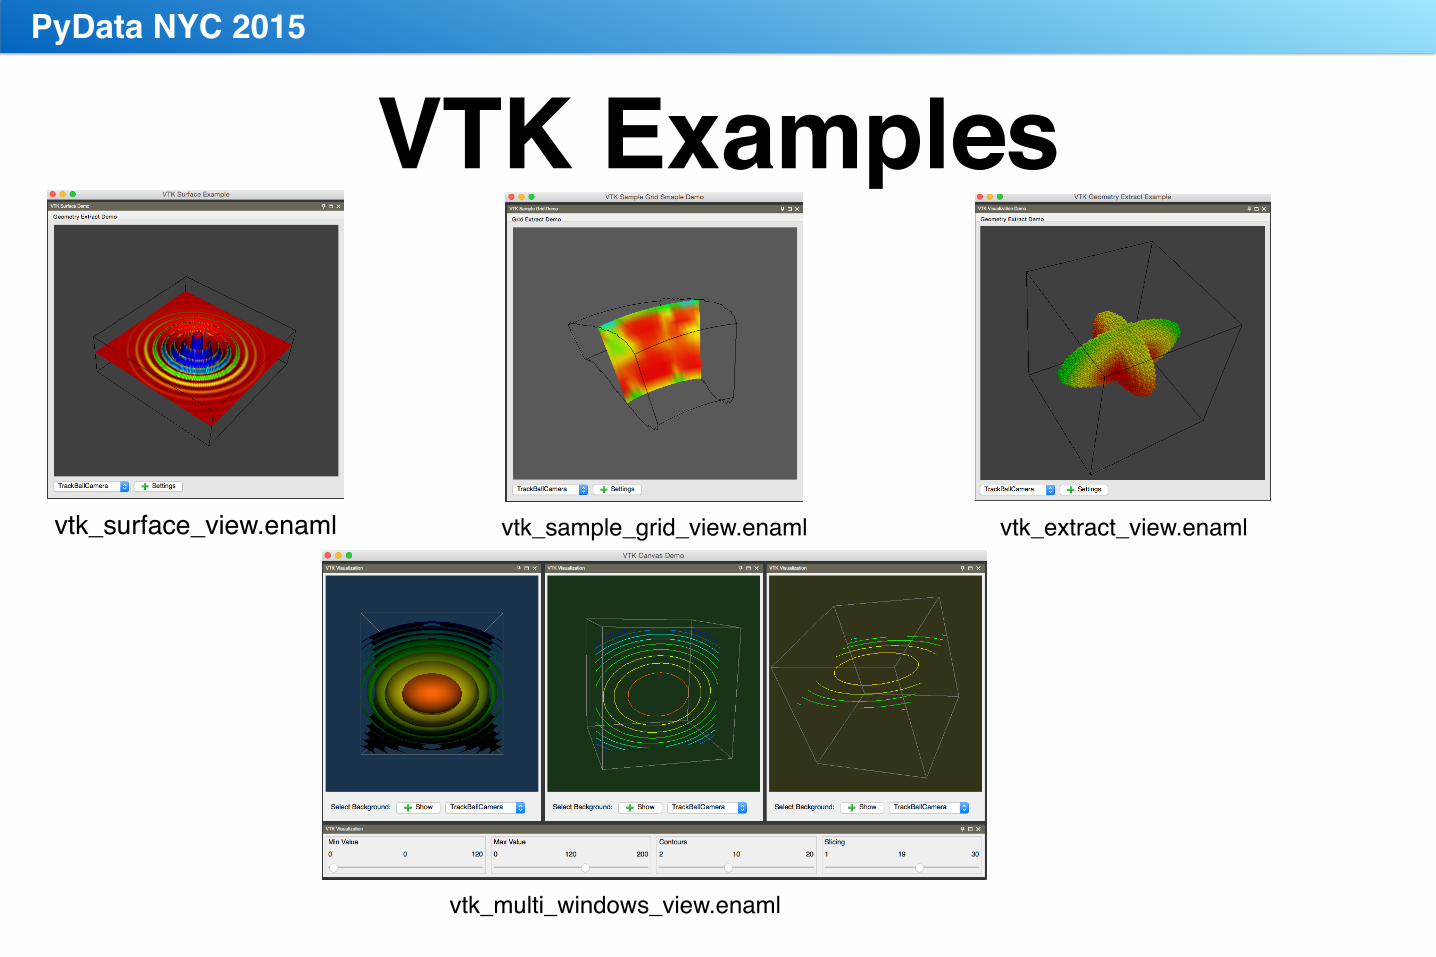
VTK Examples
vtk_surface_view.enaml
PyData NYC 2015
vtk_sample_grid_view.enaml
vtk_multi_windows_view.enaml
vtk_extract_view.enaml
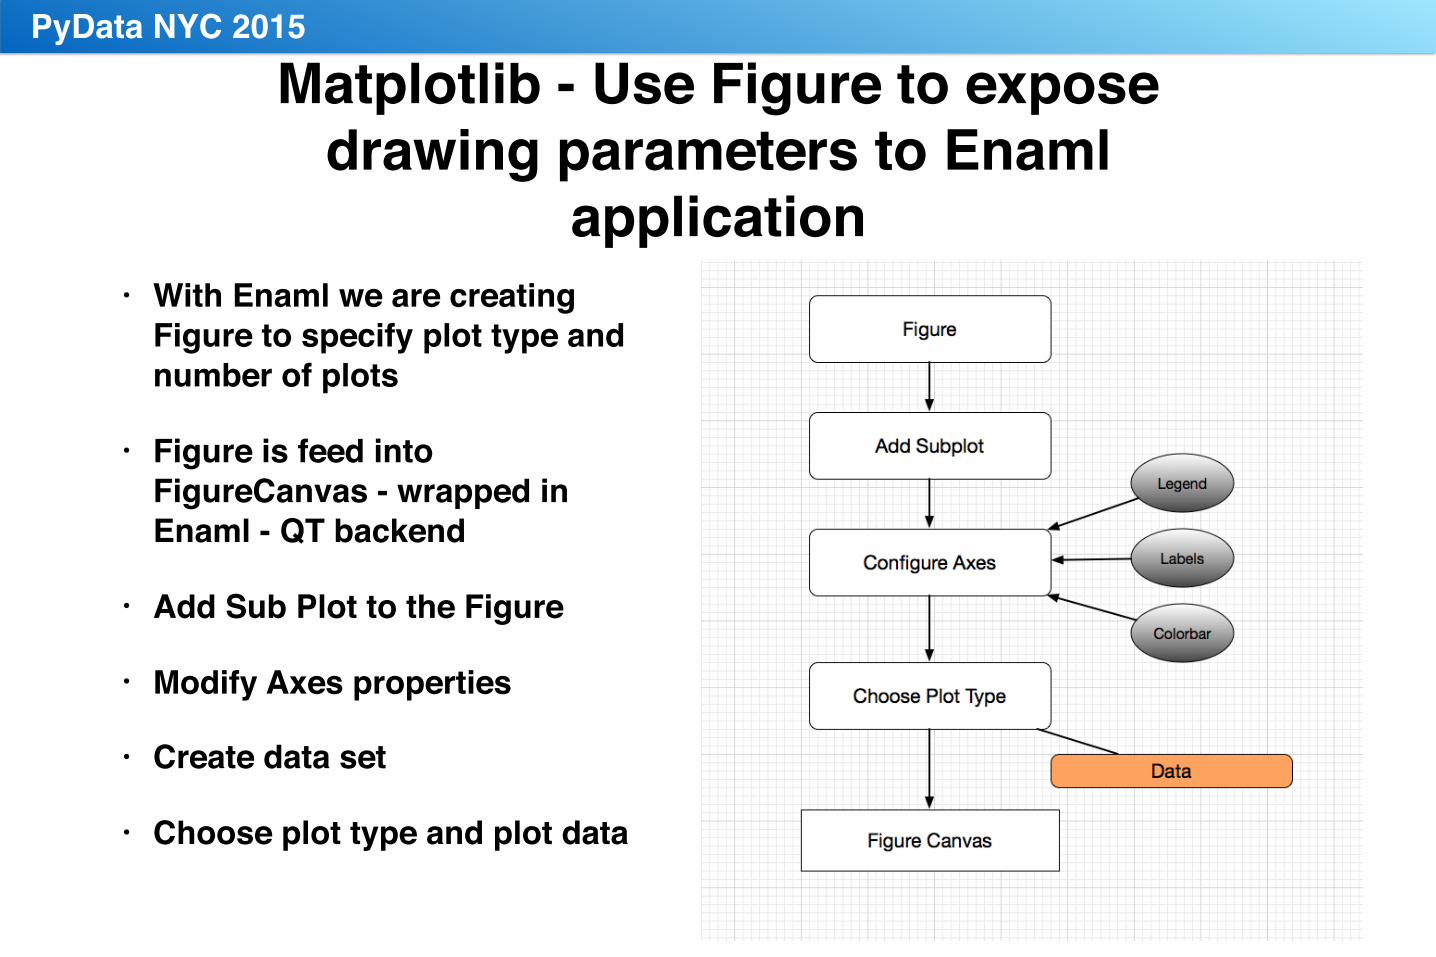
Matplotlib - Use Figure to expose drawing parameters to Enaml
application• With Enaml we are creating
Figure to specify plot type and number of plots
• Figure is feed into FigureCanvas - wrapped in Enaml - QT backend
• Add Sub Plot to the Figure
• Modify Axes properties
• Create data set
• Choose plot type and plot data
PyData NYC 2015
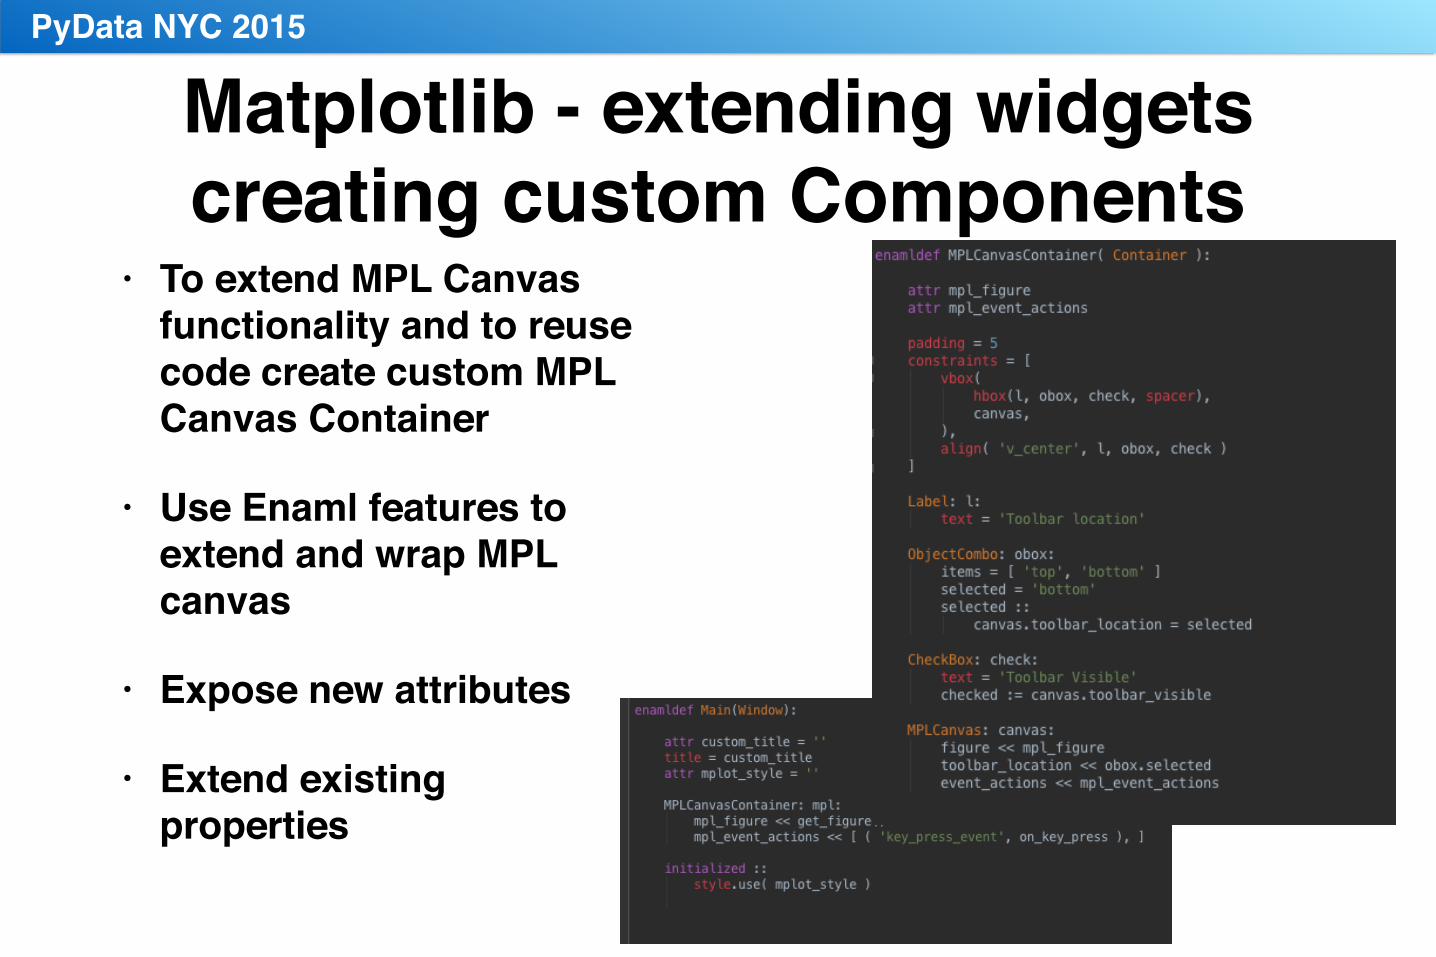
Matplotlib - extending widgets creating custom Components
• To extend MPL Canvas functionality and to reuse code create custom MPL Canvas Container
• Use Enaml features to extend and wrap MPL canvas
• Expose new attributes
• Extend existing properties
PyData NYC 2015
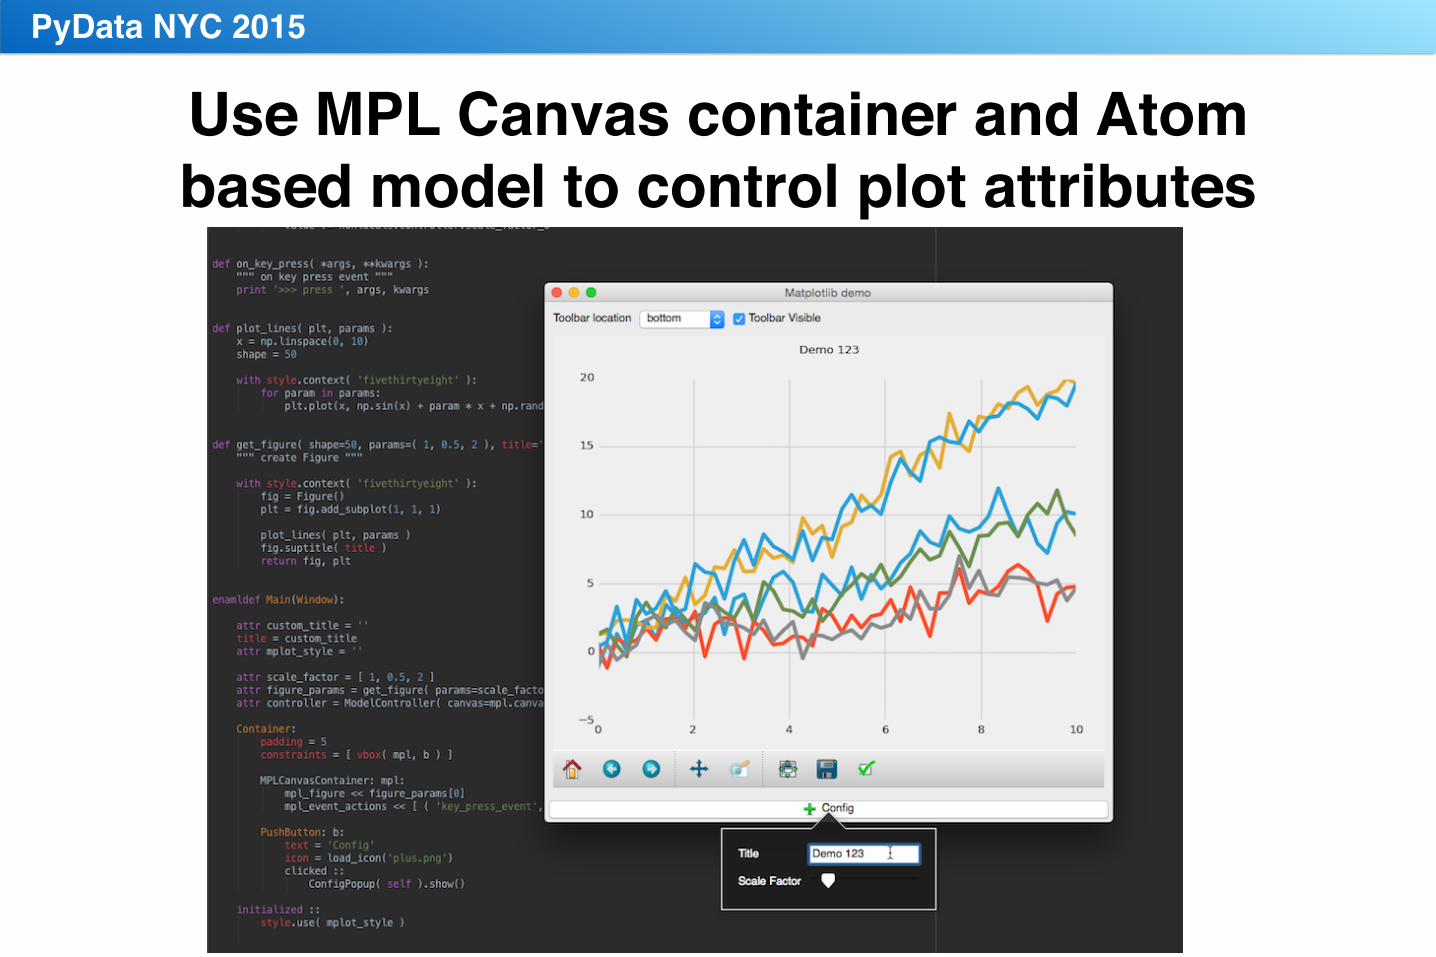
Use MPL Canvas container and Atom based model to control plot attributes
PyData NYC 2015
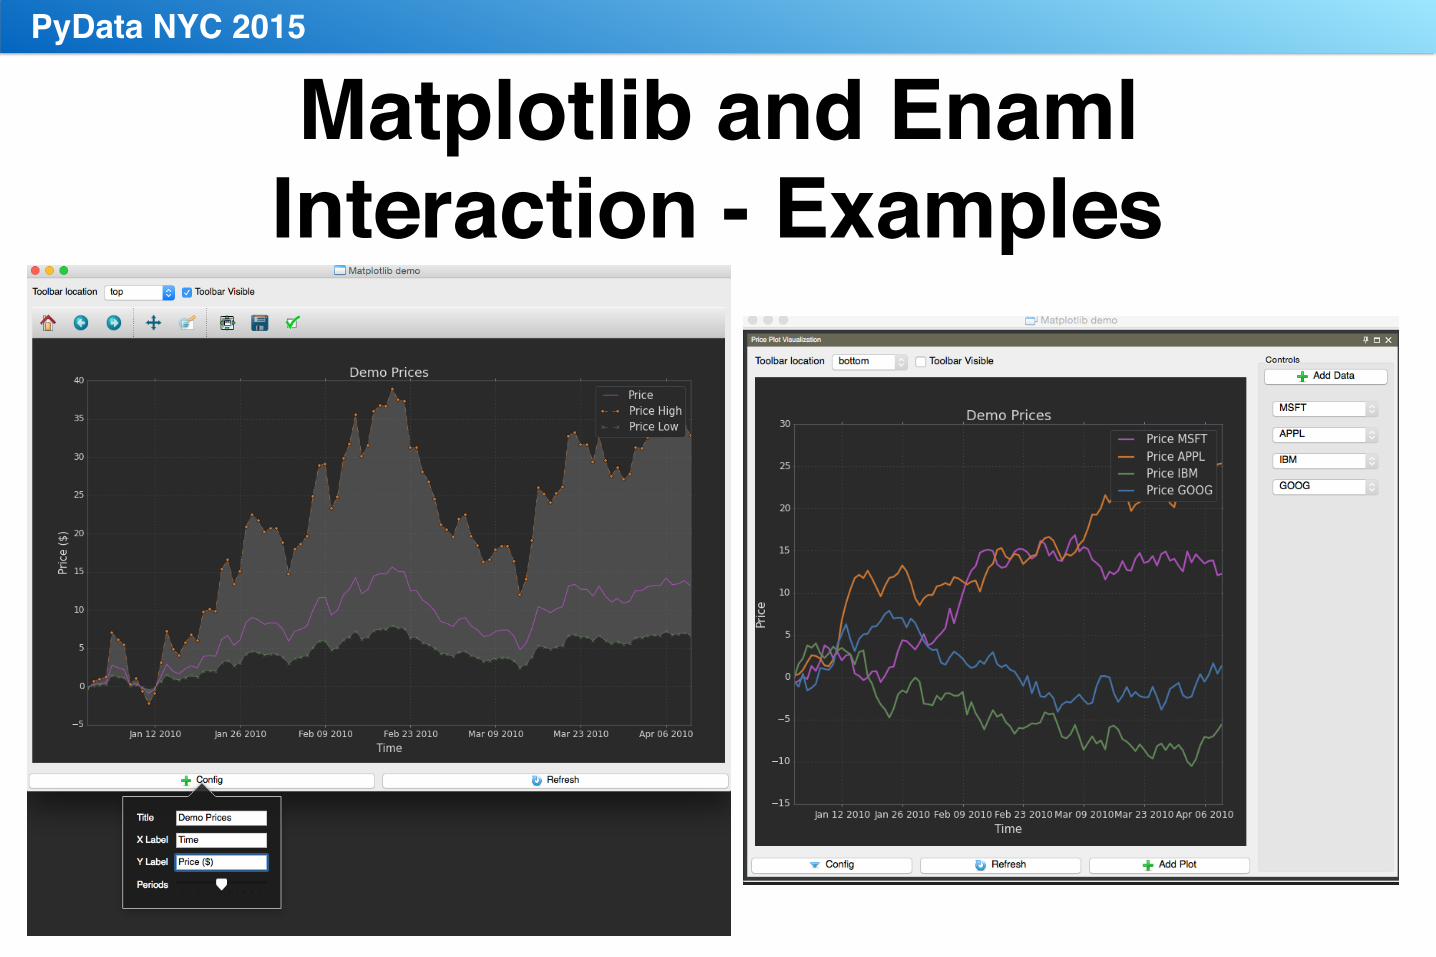
Matplotlib and Enaml Interaction - Examples
PyData NYC 2015
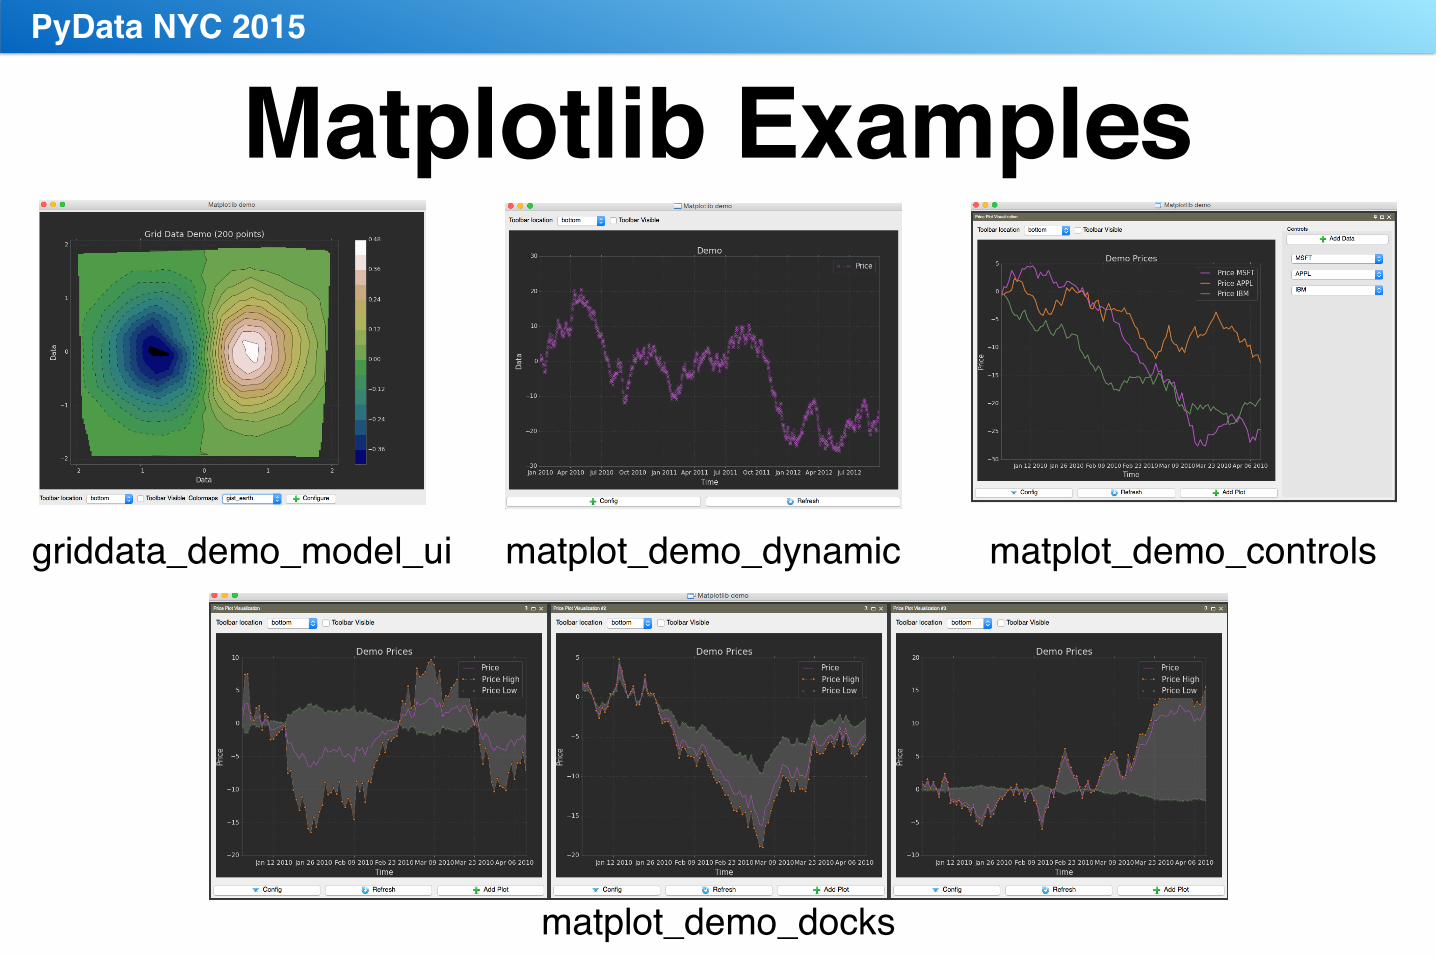
Matplotlib ExamplesPyData NYC 2015
matplot_demo_dynamicgriddata_demo_model_ui
matplot_demo_docks
matplot_demo_controls
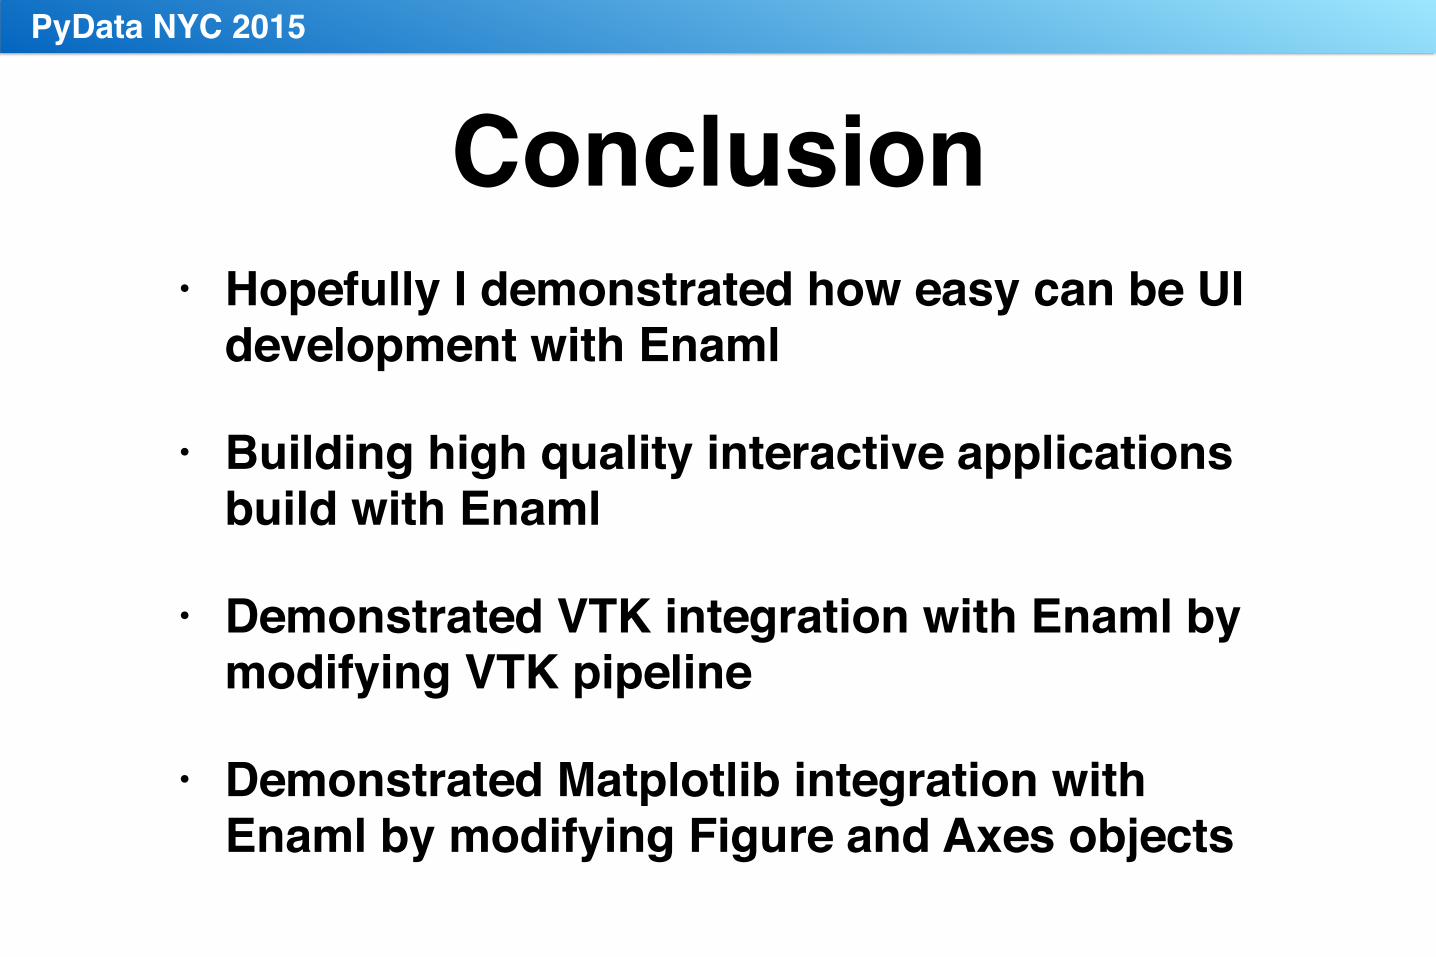
Conclusion• Hopefully I demonstrated how easy can be UI
development with Enaml
• Building high quality interactive applications build with Enaml
• Demonstrated VTK integration with Enaml by modifying VTK pipeline
• Demonstrated Matplotlib integration with Enaml by modifying Figure and Axes objects
PyData NYC 2015

Future• Implement more of core
QT widgets in Enaml
• Add real support for various IDE’s like PyCharm
• Extend Enaml for other backends (web)
• VTK - extend Enaml to provide declarative way of creating visualizations
PyData NYC 2015
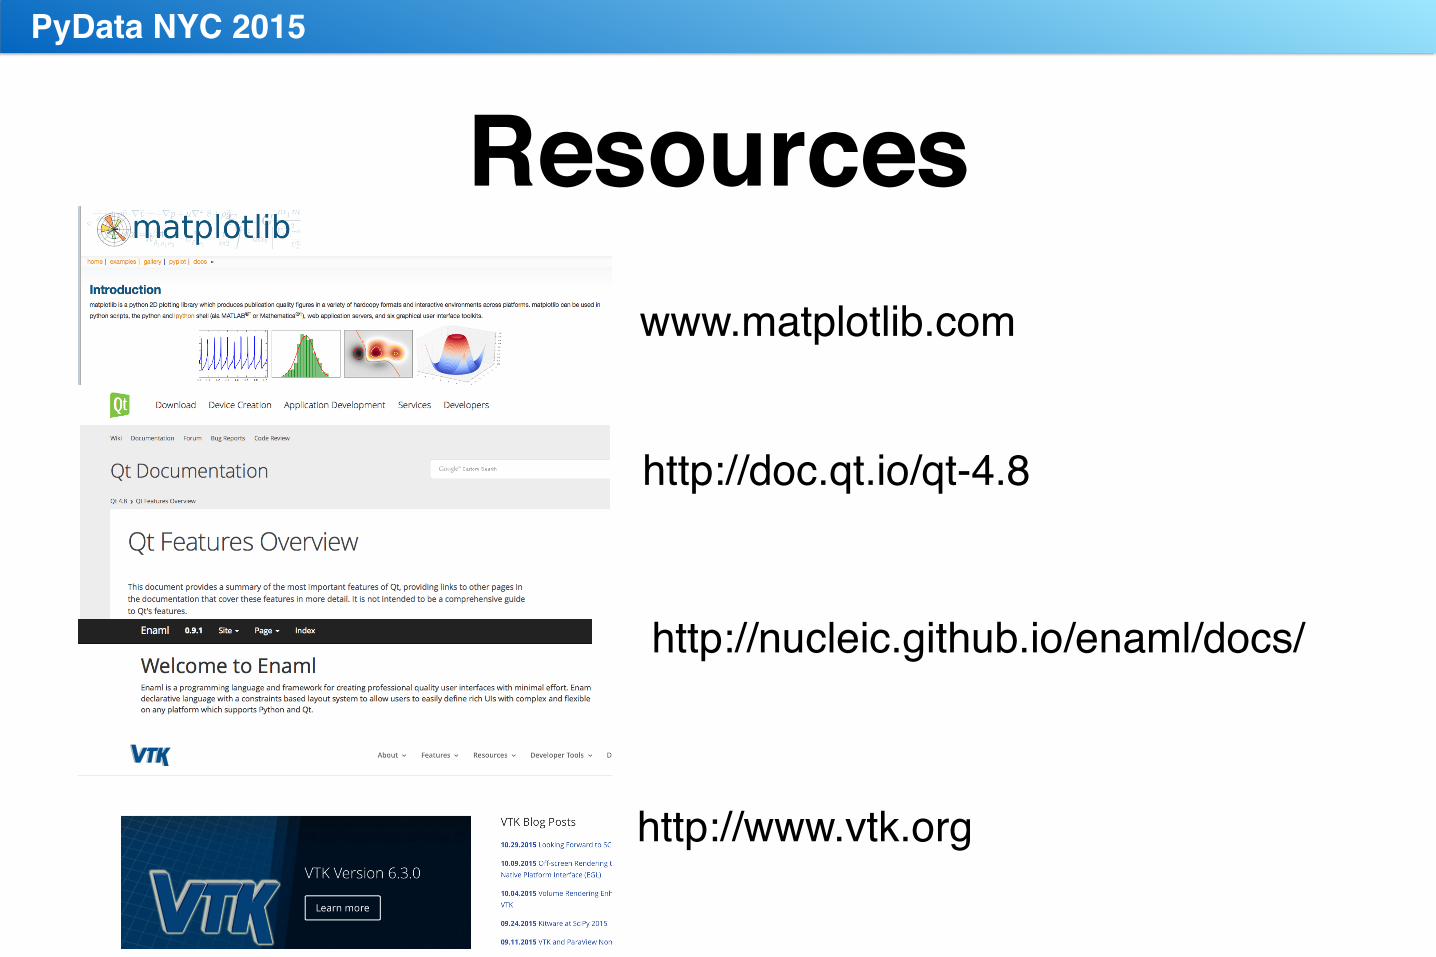
Resourceswww.matplotlib.com
http://doc.qt.io/qt-4.8
http://nucleic.github.io/enaml/docs/
http://www.vtk.org
PyData NYC 2015
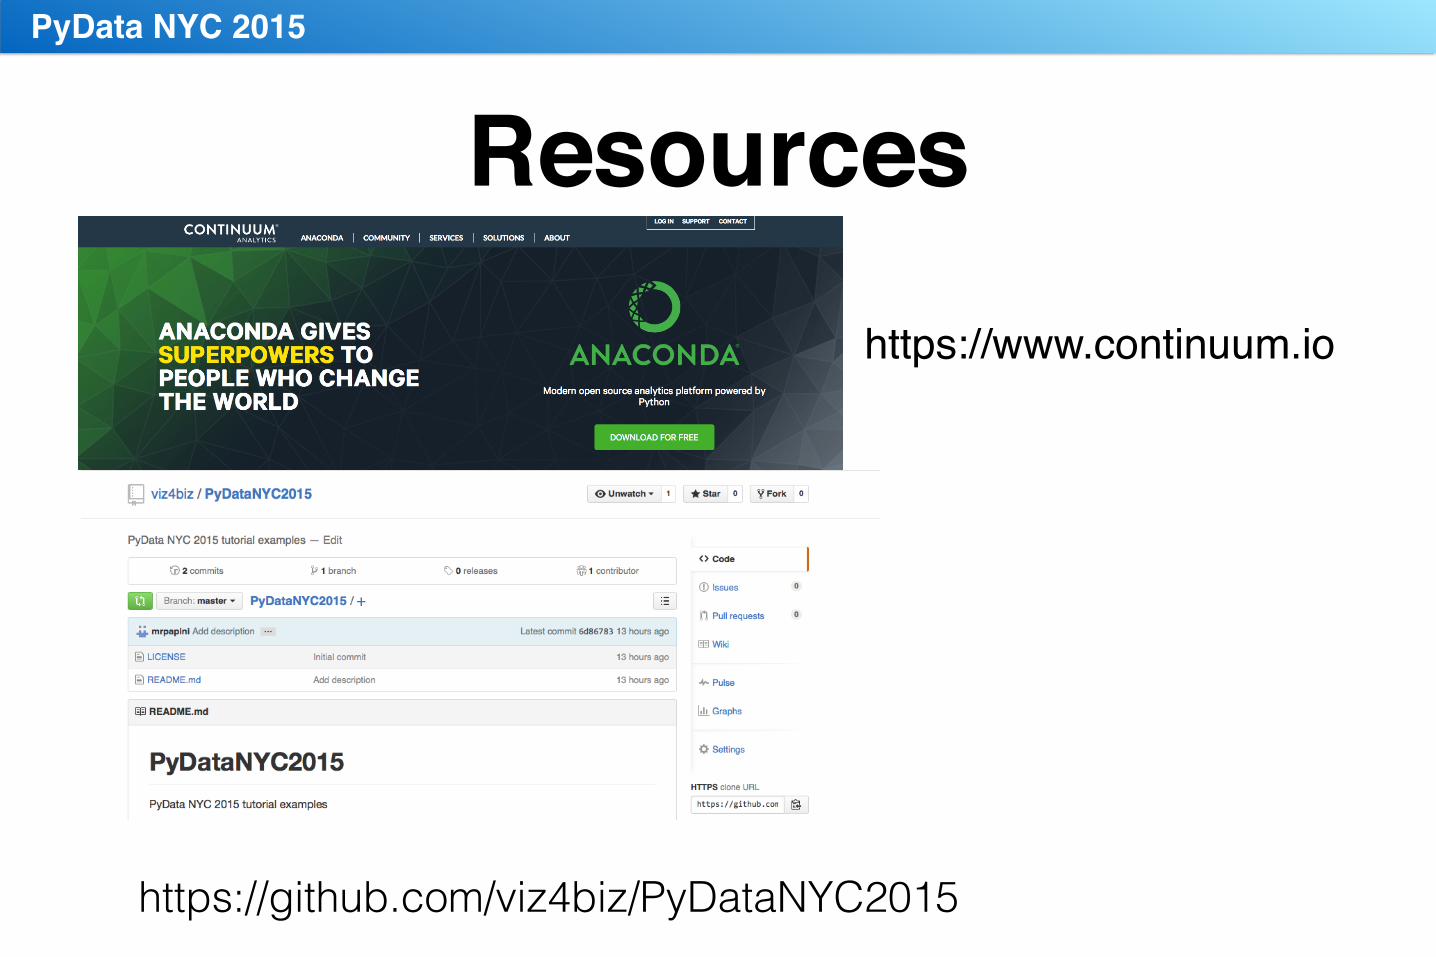
Resourceshttps://www.continuum.io
https://github.com/viz4biz/PyDataNYC2015
PyData NYC 2015
DisclaimerThe views expressed herein do not necessarily represent the views and opinions of JPMorgan Chase & Co. This material is provided for information only and is not intended as a recommendation or an offer or solicitation for the purchase or sale of any security or other financial instrument. In no event shall JPMorgan be liable for any use by any party of, for any decision made or action taken by any party in reliance upon, or for any inaccuracies or errors in, or omissions from, the information contained herein and such information may not be relied upon by you in evaluating the merits of participating in any transaction. JPMorgan and its affiliates may have positions (long or short), effect transactions or make markets in securities or financial instruments mentioned herein, or provide advice or loans to, or participate in the underwriting or restructuring of the obligations of, issuers mentioned herein. Nothing in these materials constitutes a commitment by JPMorgan or any of its affiliates to enter into any transaction. Clients should contact their salesperson at, and execute transactions through, a JPMorgan entity qualified in their home jurisdiction unless governing law permits otherwise. JPMorgan is the marketing name for the investment banking activities of JPMorgan Chase & Co. and its subsidiaries and affiliates worldwide. J.P. Morgan Securities LLC is a member of FINRA, NYSE and SIPC.
Copyright 2015 JPMorgan Chase & Co. All rights reserved.
PyData NYC 2015