PV Loop Presentation
25
1 Cardiac Pressure – Volume Relationship Scisense Inc. (Canada) The Theory and Significance of PV Loop Measurements
-
Upload
ashish-pandey -
Category
Documents
-
view
51 -
download
3
Transcript of PV Loop Presentation

1
Cardiac Pressure – Volume Relationship
Scisense Inc. (Canada)
The Theory and Significance of PV Loop Measurements
The Theory and Significance of PV Loop Measurements
2
OVERVIEW
1. Background on Pressure-Volume (PV) Loops
2. Critical Analyses that can be performed
3. Application examples
4. Conductance technique as a method of measuring volume

3
Background on Scisense
• Founded in 2002 to develop high fidelity pressure and pressure-volume sensors
• Products are manufactured in Canada and sold worldwide
• Minimally invasive tools for hemodynamic research:
– catheters for ventricular pressure, volume and ECG
– amplifiers & acquisition systems– analysis software
4
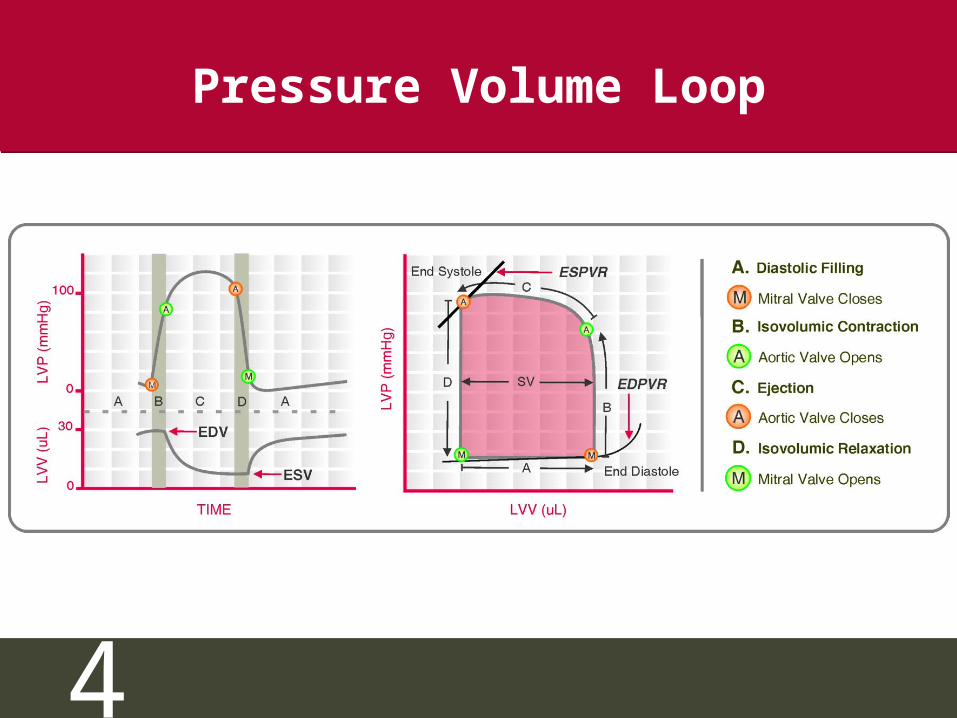
Pressure Volume Loop

5
What the Reviewers Say:
“When perusing the literature….if the ESPVR was not measured, I would personally ignore the article”
Source: William J. Mazzei, M.D. Lecture notes,Cardiac Physiology and Monitoring, July 18, 1999 (www.imhotep.net/lecture3.html)
Source: William J. Mazzei, M.D. Lecture notes,Cardiac Physiology and Monitoring, July 18, 1999 (www.imhotep.net/lecture3.html)
6
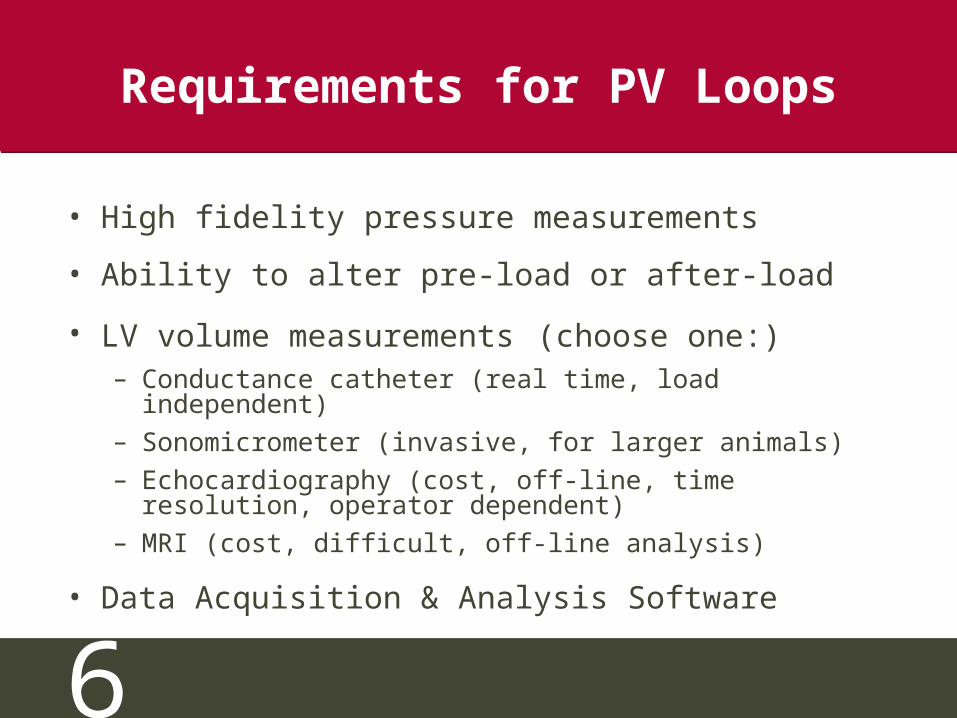
Requirements for PV Loops
• High fidelity pressure measurements
• Ability to alter pre-load or after-load
• LV volume measurements (choose one:)– Conductance catheter (real time, load independent)– Sonomicrometer (invasive, for larger animals)– Echocardiography (cost, off-line, time resolution,
operator dependent)– MRI (cost, difficult, off-line analysis)
• Data Acquisition & Analysis Software

7
Typical PV Catheter
Scisense1.2F
Millar1.4F
Photo Courtesy of: Dr. Marc Feldman, M.D., University of Texas at San Antonio
8
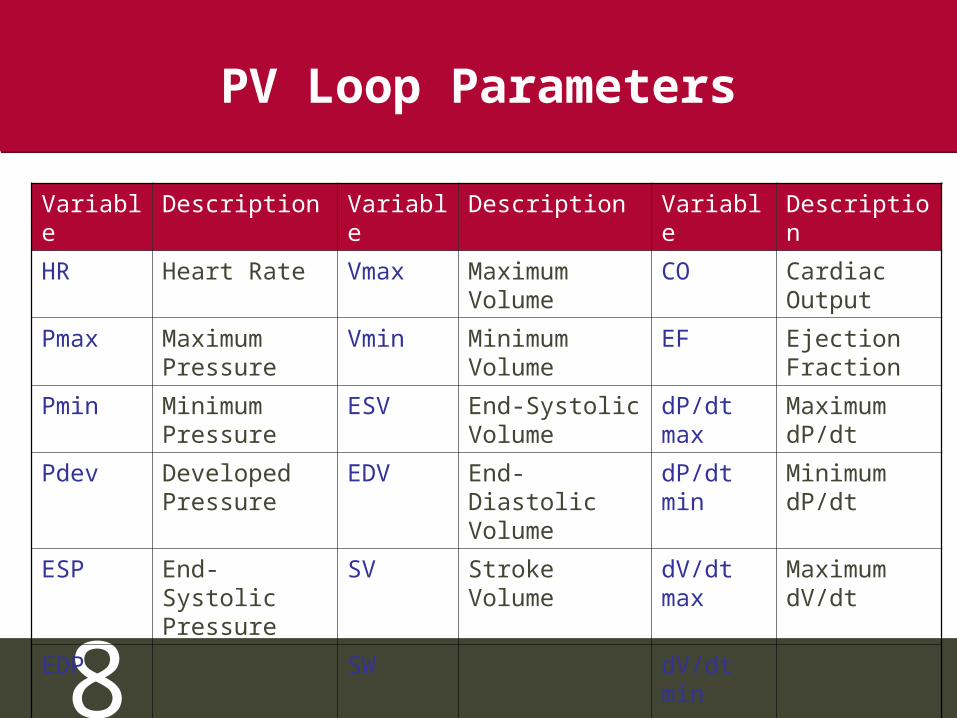
PV Loop Parameters
Variable Description Variable Description Variable Description
HR Heart Rate Vmax Maximum Volume
CO Cardiac Output
Pmax Maximum Pressure
Vmin Minimum Volume
EF Ejection Fraction
Pmin Minimum Pressure
ESV End-Systolic Volume
dP/dt max
Maximum dP/dt
Pdev Developed Pressure
EDV End-Diastolic Volume
dP/dt min
Minimum dP/dt
ESP End-Systolic Pressure
SV Stroke Volume
dV/dt max
Maximum dV/dt
EDP End-Diastolic Pressure
SW Stroke Work dV/dt min
Minimum dV/dt
9
PV Loop Parameters
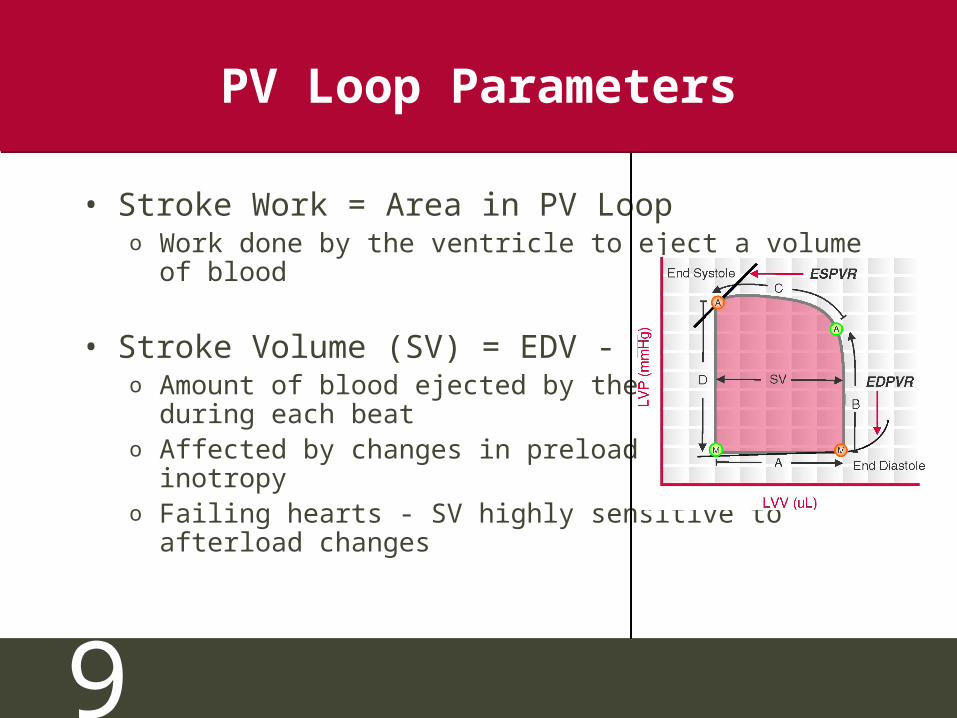
• Stroke Work = Area in PV Loopo Work done by the ventricle to eject a volume of
blood
• Stroke Volume (SV) = EDV - ESVo Amount of blood ejected by the ventricle during each
beato Affected by changes in preload, afterload, inotropyo Failing hearts - SV highly sensitive to afterload
changes
10
PV Loop Parameters
• Cardiac Output (CO) = SV x heart rateo Amount of blood pumped out by the LV in unit time
• Ejection Fraction (EF) = (SV/EDV) x100o Fraction of the End Diastolic Volume that is ejectedo Used as a clinical indicator of cardiac contractilityo Normal EF > 60%o Severe heart failure - EF < 20%o Low EF usually indicates systolic dysfunction
11
PV Loop Parameters
• dP/dtmin & dP/dtmax
o Min and max rate of pressure change in LVo Requires high fidelity LV pressure measurementso Increase in contractility - increased dP/dtmax during
isovolumic contractiono dP/dtmin used in the calculation of Tau
• Isovolumic Relaxation Constant (Τau)o Index of diastolic function that is relatively load
independento Used in evaluation of heart failureo Requires high fidelity LV pressure measurements
12
Types of PV Loop Analysis
•ESPVR – End Systolic Pressure-Volume Relationship
•EDPVR – End Diastolic Pressure-Volume Relationship
•Frank Starling Curve
•PRSW – Preload Recruitable Stroke Work
•Pressure-Volume Area (PVA) Analysis
•Effective Arterial Elastance (Ea)
•ESPVR – End Systolic Pressure-Volume Relationship
•EDPVR – End Diastolic Pressure-Volume Relationship
•Frank Starling Curve
•PRSW – Preload Recruitable Stroke Work
•Pressure-Volume Area (PVA) Analysis
•Effective Arterial Elastance (Ea)
13
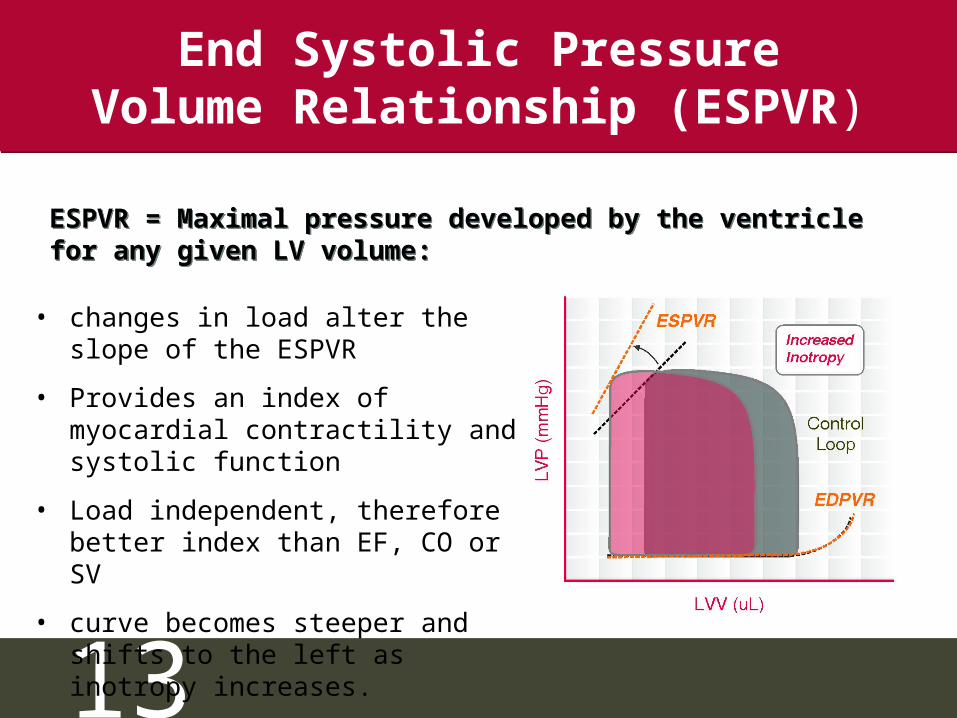
End Systolic Pressure Volume Relationship (ESPVR)
• changes in load alter the slope of the ESPVR
• Provides an index of myocardial contractility and systolic function
• Load independent, therefore better index than EF, CO or SV
• curve becomes steeper and shifts to the left as inotropy increases.
ESPVR = Maximal pressure developed by the ventricle for any given LV volume:ESPVR = Maximal pressure developed by the ventricle for any given LV volume:
14
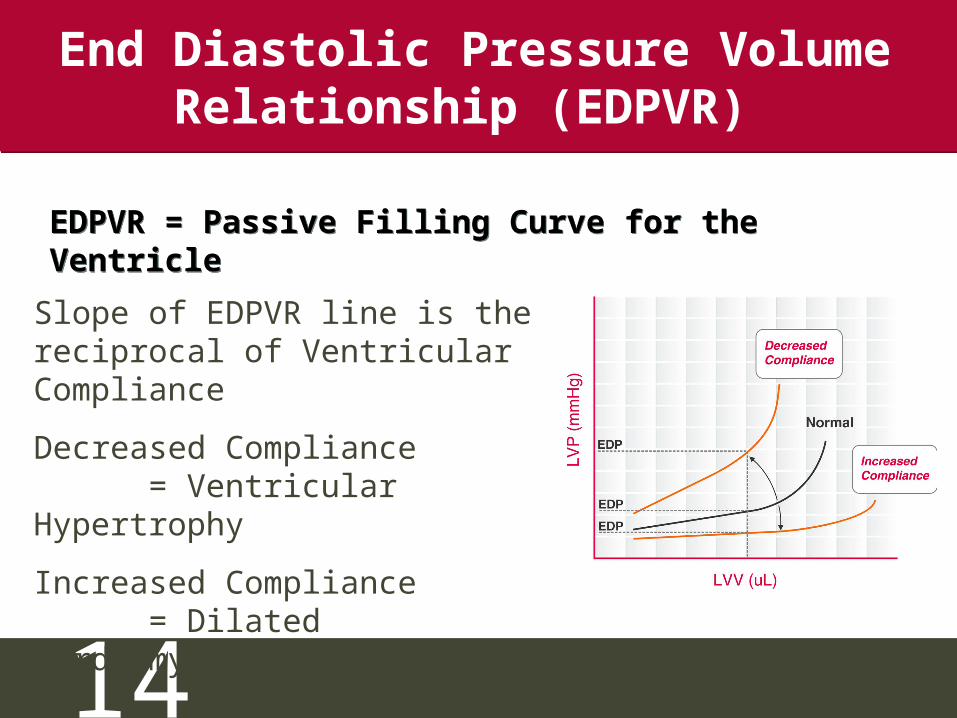
End Diastolic Pressure Volume Relationship (EDPVR)
Slope of EDPVR line is the reciprocal of Ventricular Compliance
Decreased Compliance = Ventricular Hypertrophy
Increased Compliance = Dilated Cardiomyopathy
EDPVR = Passive Filling Curve for the VentricleEDPVR = Passive Filling Curve for the Ventricle
15
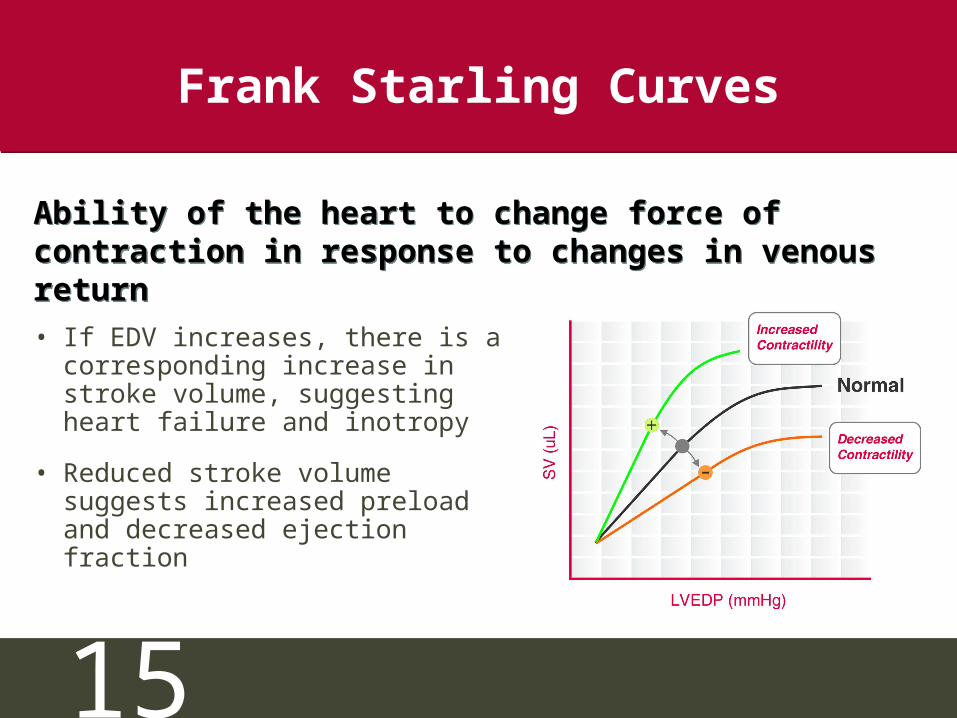
Frank Starling Curves
• If EDV increases, there is a corresponding increase in stroke volume, suggesting heart failure and inotropy
• Reduced stroke volume suggests increased preload and decreased ejection fraction
Ability of the heart to change force of contraction in response to changes in venous return
Ability of the heart to change force of contraction in response to changes in venous return
16
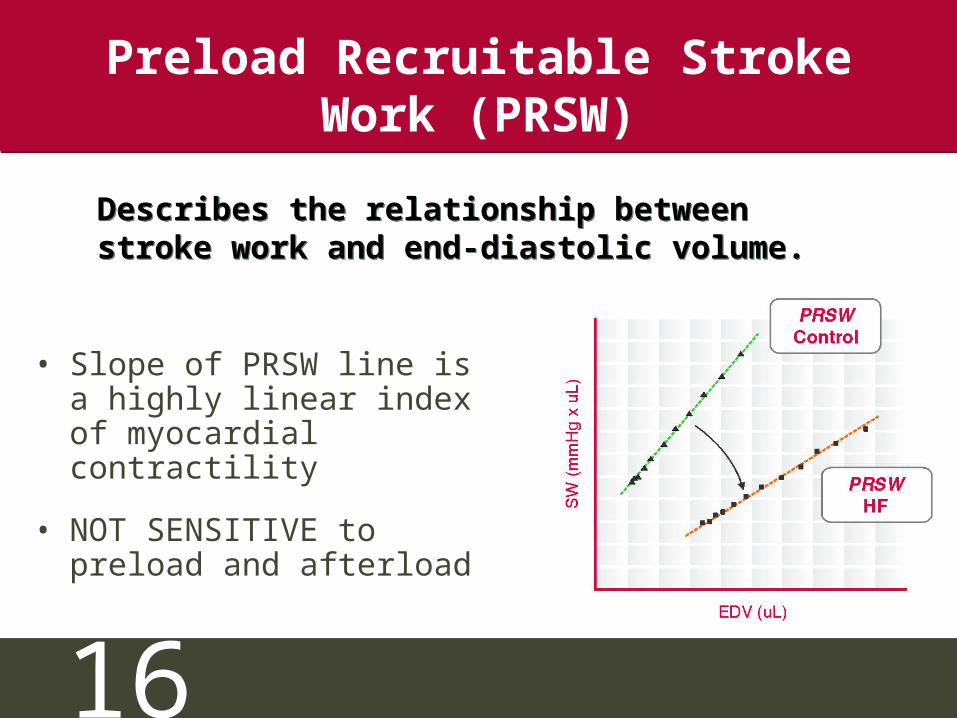
Preload Recruitable Stroke Work (PRSW)
• Slope of PRSW line is a highly linear index of myocardial contractility
• NOT SENSITIVE to preload and afterload
Describes the relationship between stroke work and end-diastolic volume. Describes the relationship between stroke work and end-diastolic volume.
17
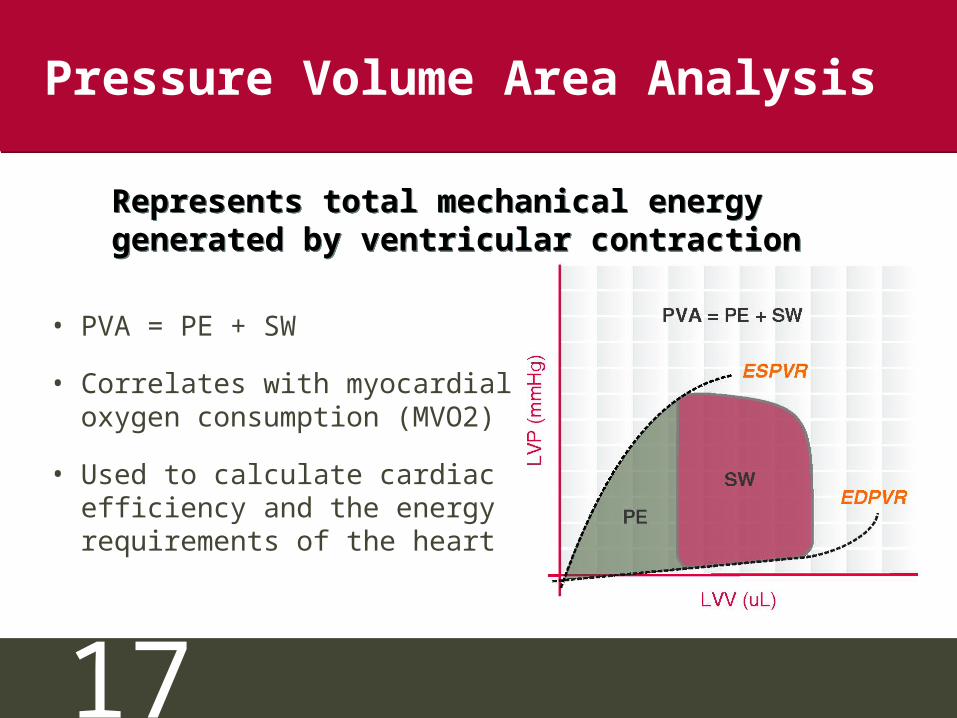
Pressure Volume Area Analysis
• PVA = PE + SW
• Correlates with myocardial oxygen consumption (MVO2)
• Used to calculate cardiac efficiency and the energy requirements of the heart
Represents total mechanical energy generated by ventricular contractionRepresents total mechanical energy generated by ventricular contraction
18
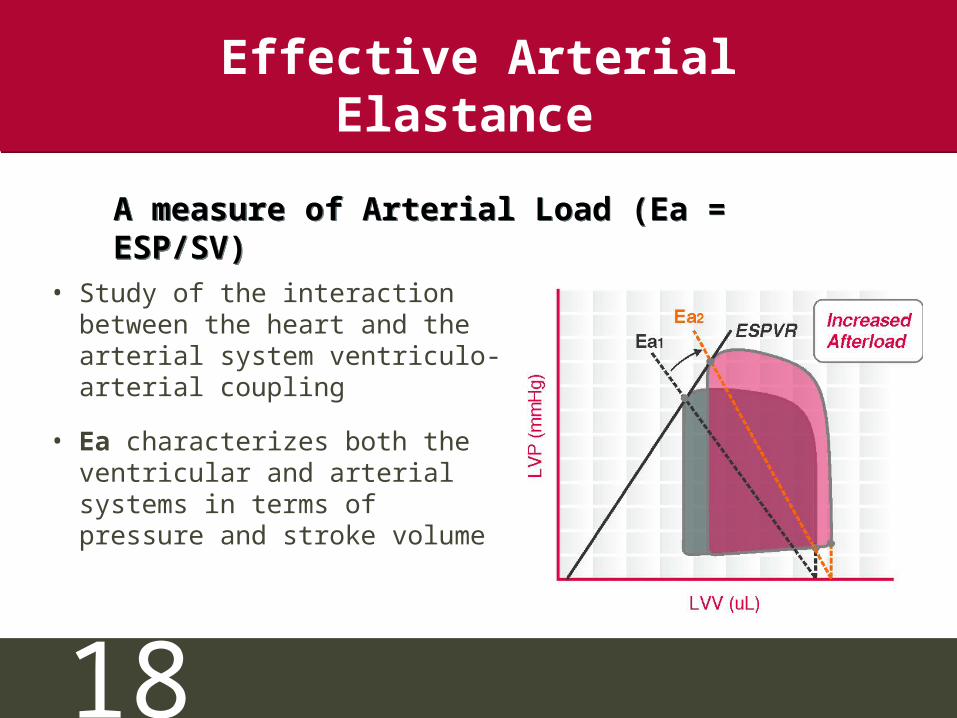
Effective Arterial Elastance
• Study of the interaction between the heart and the arterial system ventriculo-arterial coupling
• Ea characterizes both the ventricular and arterial systems in terms of pressure and stroke volume
A measure of Arterial Load (Ea = ESP/SV)A measure of Arterial Load (Ea = ESP/SV)

19
Application Example Cardiomyopathies
LVP
(mm
Hg)
LVV (uL)
EDPVR:
ESPVR: Slope maintainedRightward Shift
Increased SlopeSW
Decreased
Restrictive
LVP
(mm
Hg)
LVV (uL)
EDPVR:
ESPVR: Decreased SlopeRightward Shift
Rightward Shift
SWDecreased/
Normal
Dilated
LVP
(mm
Hg)
LVV (uL)
EDPVR:
ESPVR: Increased SlopeLeftward Shift
Leftward Shift
SWDecreased
Hypertrophic
20
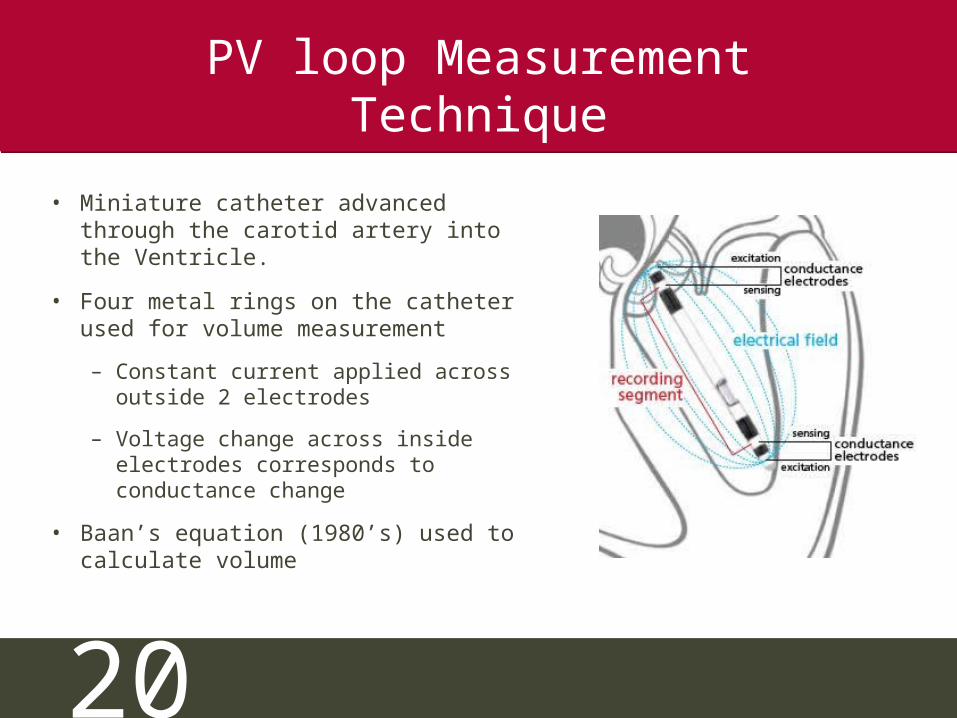
PV loop Measurement Technique
• Miniature catheter advanced through the carotid artery into the Ventricle.
• Four metal rings on the catheter used for volume measurement
– Constant current applied acrossoutside 2 electrodes
– Voltage change across inside electrodes corresponds to conductance change
• Baan’s equation (1980’s) used to calculate volume
21
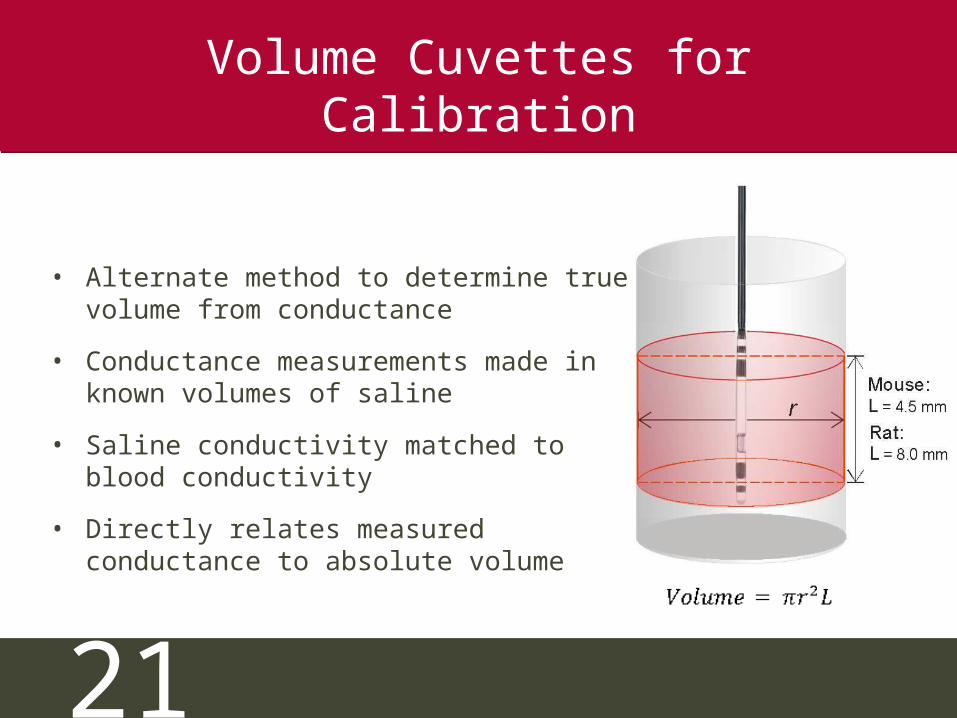
Volume Cuvettes for Calibration
• Alternate method to determine true volume from conductance
• Conductance measurements made in known volumes of saline
• Saline conductivity matched to blood conductivity
• Directly relates measured conductance to absolute volume
22
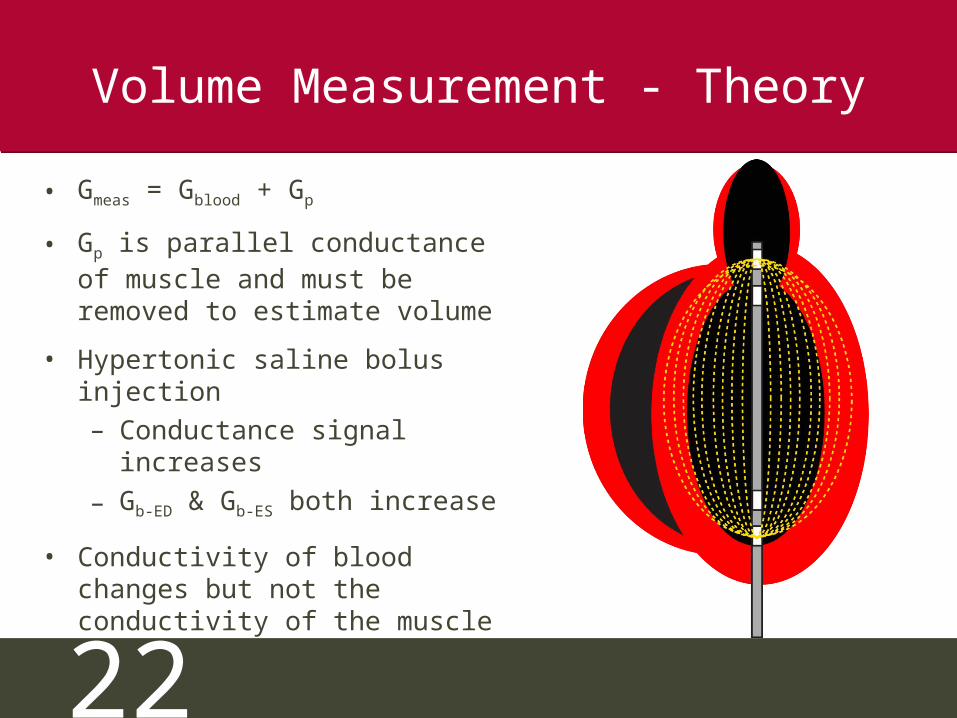
Volume Measurement - Theory
• Gmeas = Gblood + Gp
• Gp is parallel conductance of muscle and must be removed to estimate volume
• Hypertonic saline bolus injection– Conductance signal increases
– Gb-ED & Gb-ES both increase
• Conductivity of blood changes but not the conductivity of the muscle
23GEDV
GES
V
Gp
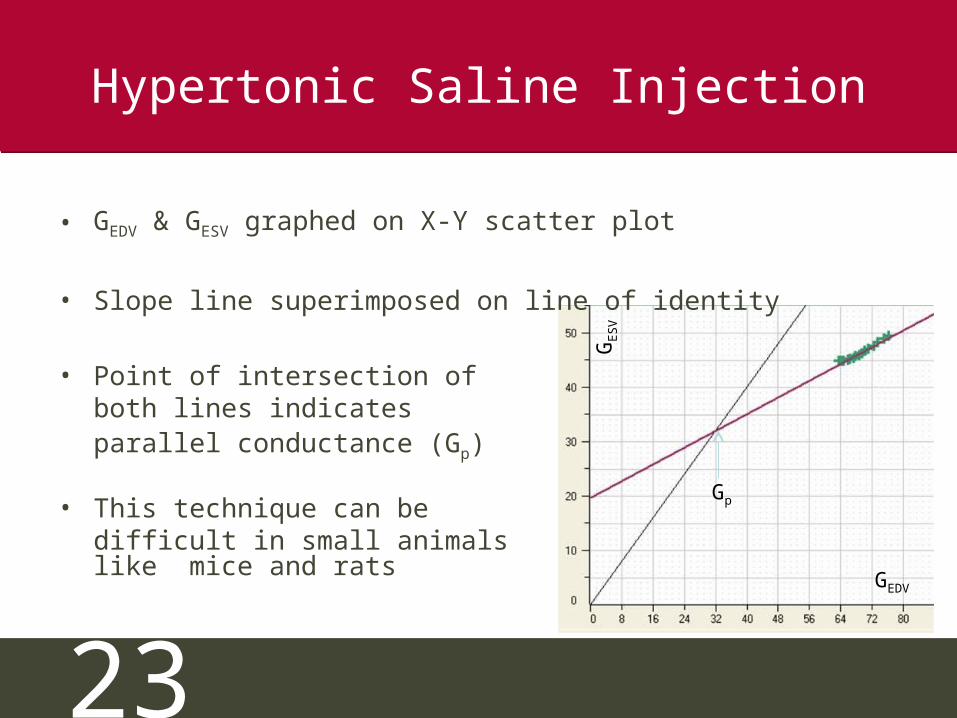
Hypertonic Saline Injection
• GEDV & GESV graphed on X-Y scatter plot
• Slope line superimposed on line of identity
• Point of intersection ofboth lines indicates parallel conductance (Gp)
• This technique can bedifficult in small animals like mice and rats

24
NEW!! ADVantageTM System(only from Scisense Inc.)
• No more saline bolus
• No volume cuvette calibration
• Real time feedback on catheterposition in the LV
• Parallel conductance is subtracted in real time for more accurate volumes
• Absolute blood volumes are obtained– Lower standard deviation– Fewer animals required– Saves time and money
25
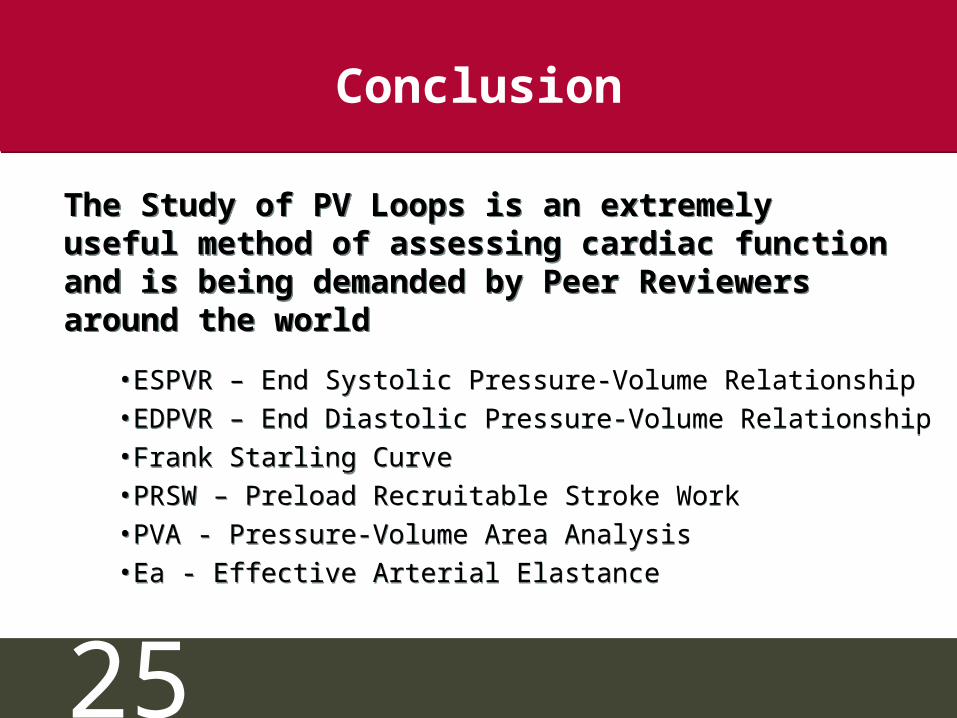
Conclusion
•ESPVR – End Systolic Pressure-Volume Relationship•EDPVR – End Diastolic Pressure-Volume Relationship•Frank Starling Curve•PRSW – Preload Recruitable Stroke Work•PVA - Pressure-Volume Area Analysis•Ea - Effective Arterial Elastance
•ESPVR – End Systolic Pressure-Volume Relationship•EDPVR – End Diastolic Pressure-Volume Relationship•Frank Starling Curve•PRSW – Preload Recruitable Stroke Work•PVA - Pressure-Volume Area Analysis•Ea - Effective Arterial Elastance
The Study of PV Loops is an extremely useful method of assessing cardiac function and is being demanded by Peer Reviewers around the world
The Study of PV Loops is an extremely useful method of assessing cardiac function and is being demanded by Peer Reviewers around the world