
Presentation ppt
27
The Impact of Early Childhood Education on Children's Non-Cognitive Outcomes Jiarui Zhang, Uyen (Sophie) Nguyen, Zijian Huang Capstone Project Advisor: Professor Weinstein Steinhardt School of Culture, Education, and Human Development 12/14/2015
-
Upload
zijian-huang -
Category
Documents
-
view
41 -
download
0
Transcript of Presentation ppt

The Impact of Early Childhood Education on Children's Non-Cognitive Outcomes
Jiarui Zhang, Uyen (Sophie) Nguyen, Zijian HuangCapstone Project Advisor: Professor Weinstein
Steinhardt School of Culture, Education, and Human Development12/14/2015

I. Background
II. Research Questions
III. Research Design & Method
IV. Main Findings
V. Limitations & Policy Implications
Presentation Overview
2

● Landscape of Pre-K Education○ In 1960, 10% of 3- and 4-year-olds enrolled○ In 2005, 69% of all 4 year-olds nationwide○ In 2013-2014, state-funded pre-K served 1,347,272 children○ In 2013-2014, the total state funding increased to $5.6 billion
I. Background
3

● Head Start○ Founded in 1965, a federally-funded early childhood education
program for low-income children under 5○ Designed to help break the cycle of poverty○ A comprehensive program to meet children’s emotional, social,
health, nutritional and psychological needs● Non-cognitive Skills
○ Definition○ Measurement ○ Importance
I. Background
4

● Existing Studies on Head Start’s Impact○ Cognitive outcomes: clear○ Non-cognitive outcomes: mixed and not much
● Fade-out Effects○ Children’s cognitive outcomes will fade out around grade 3 or 4 in
elementary school.
I. Background
5

● What is the impact of attending pre-school on students' non-cognitive outcomes?○ Specifically, Head Start vs other pre-k programs vs no pre-k
attendance● Do non-cognitive outcomes fade out as in the case of cognitive
outcomes? If so, when?
II. Research Questions
6

● Data○ Early Childhood Longitudinal Study (ECLS-K: 98/99)○ Total number of observations: 21,409
● Sample○ Sampling frame: all U.S. public and private school students ○ Target sample: children from grade 3 to grade 8 who report their
pre-K education status and non-cognitive outcomes○ Sample restriction: pre-K education quality○ Final sample size: 13,117
III. Research Design & Method
7

● Measure and Procedure○ For students: one-on-one assessments & questionnaires in
grade 3, 5, and 8○ For parents: computer-assisted telephone interviews &
questionnaires in kindergarten to grade 8○ For school administrators: self-administered paper
questionnaires in grade 5 to 8
III. Research Design & Method
8
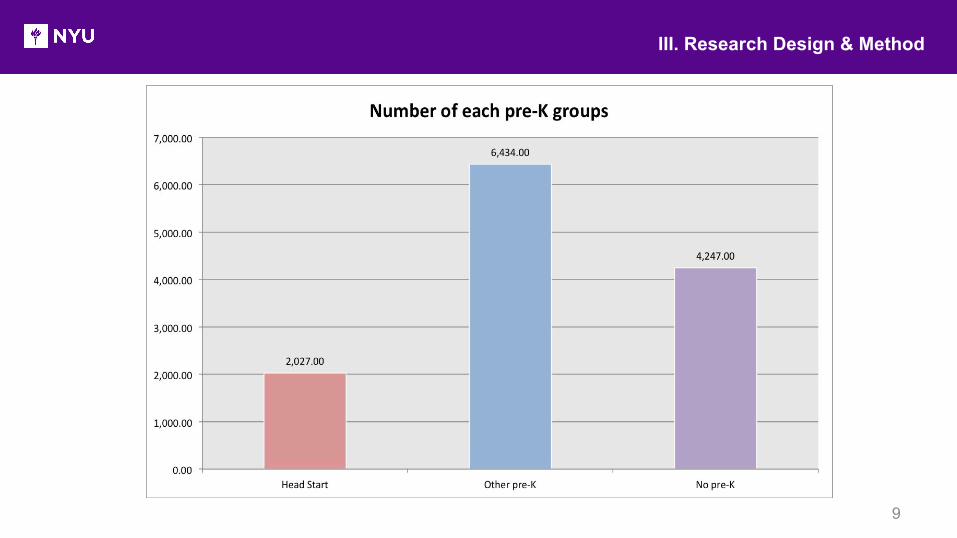
III. Research Design & Method
9

● Treatment Group vs. Comparison Groups○ Children attended Head Start vs. children attended other pre-K
programs■ Other pre-K programs include day-care centers, preschool
centers, and nursery programs○ Children attended Head Start vs. children didn’t attend any pre-
K programs
III. Research Design & Method
10

● Linear regression model○ Dependent variables (standardized)
■ Children’s internal scores in grade 3, 5, and 8■ Children’s external scores in grade 3 and 5
○ Key independent variable■ Head Start treatment
○ Covariates■ Individual characteristics■ Family characteristics■ Neighborhood characteristics
III. Research Design & Method
11

Children’s internal scores in grades 3, 5, and 8
III. Research Design & Method
12
original score Standardized score
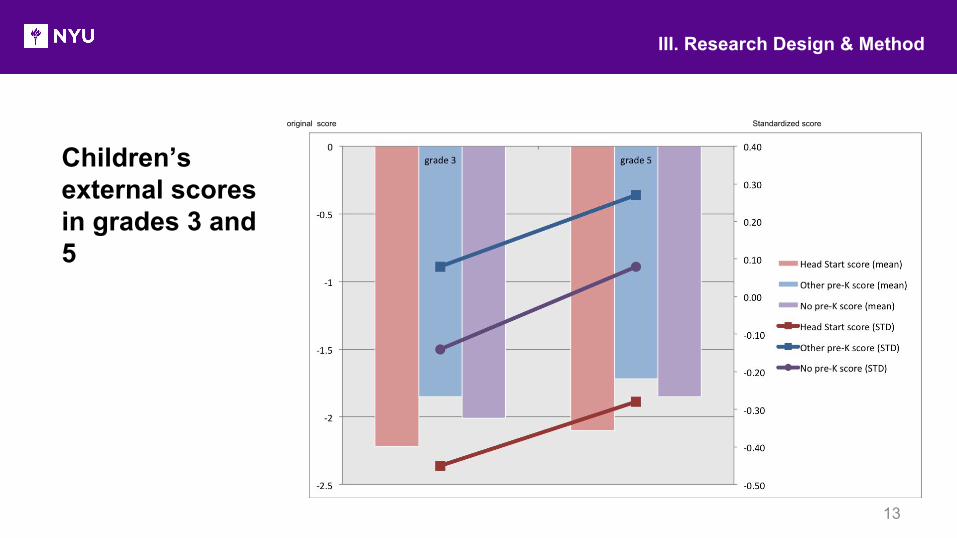
Children’s external scores in grades 3 and 5
III. Research Design & Method
13
original score Standardized score

Part of the descriptive statistics for the study
III. Research Design & Method
14

Linear regression model:
Z represents Head Start treatmentT represents time dummy variables representing change of gradesX represents all other covariates
defines the Head Start children’s change from grade 3 to time point Tdefines the comparison group children’s change from grade 3 to T
So is the difference in difference
III. Research Design & Method
15

Controlling for individual, family, and neighborhood characteristicsRobust standard errors in parentheses *** p<0.01, ** p<0.05, * p<0.1
IV. Main Findings: Internalizing Behavior Problems
16
Regression Results Internal Scores
Variables Head Start vs. Other Pre-K Head Start vs. No Pre-K
Head Start -0.320*** (0.073) -0.213*** (0.082)
Grade 5 0.193*** (0.043) 0.246*** (0.057)
Grade 8 0.131*** (0.042) 0.298*** (0.055)
Head Start Grade 5 0.121 (0.092) 0.037 (0.104)
Head Start Grade 8 0.494*** (0.089) 0.309*** (0.100)
Constant -0.322 (0.205) -1.003*** (0.252)
N 11,538 7,008
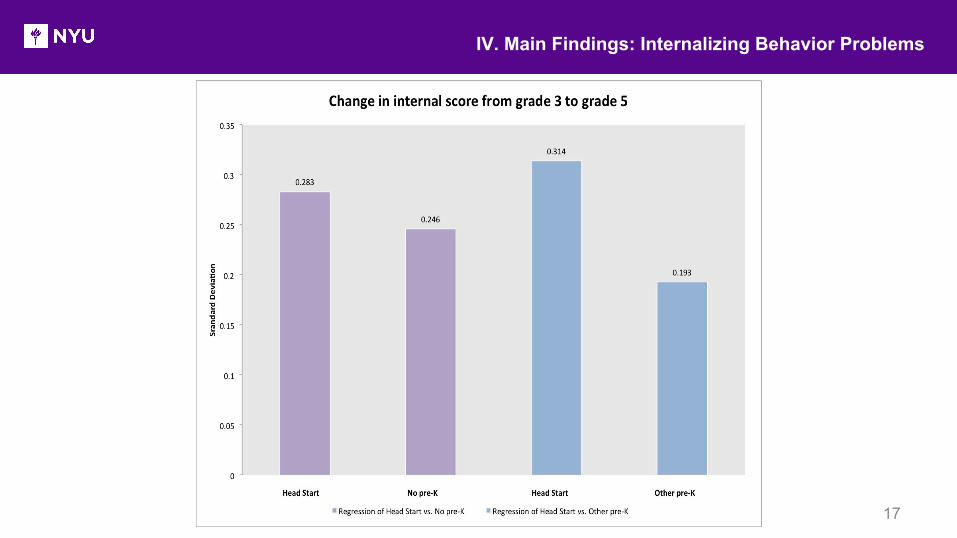
IV. Main Findings: Internalizing Behavior Problems
17

IV. Main Findings: Internalizing Behavior Problems
18

IV. Main Findings: Externalizing Behavior Problems
19
FINAL MODEL External Scores
Variables Head Start vs. Other Pre-K Head Start vs. No Pre-K
Head Start -0.128 (0.078) -0.092 (0.080)
Grade 5 0.198*** (0.045) 0.223*** (0.055)
Head Start Grade 5 -0.045 (0.096) -0.061 (0.104)
Constant -0.403* (0.231) -1.257*** (0.315)
N 7,713 4,679
Controlling for individual, family, and neighborhood characteristicsRobust standard errors in parentheses *** p<0.01, ** p<0.05, * p<0.1

IV. Main Findings: Externalizing Behavior Problems
20
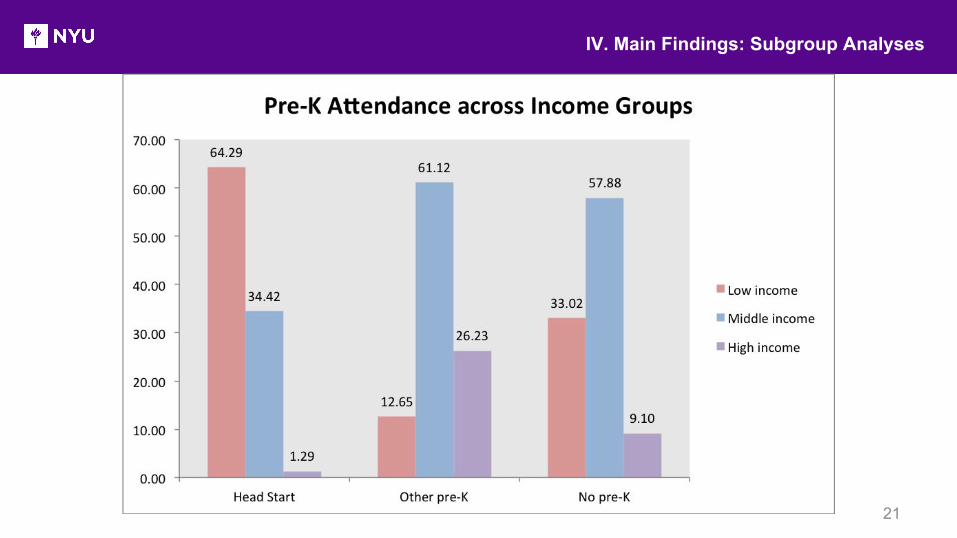
IV. Main Findings: Subgroup Analyses
21

IV. Main Findings: Subgroup Analyses
22
LOW-INCOME GROUP Internal Scores
Variables Head Start vs. Other Pre-K Head Start vs. No Pre-K
Head Start -0.133 (0.138) -0.338** (0.135)
Grade 5 0.297** (0.129) 0.181* (0.107)
Grade 8 0.416*** (0.141) 0.370*** (0.114)
Head Start Grade 5 0.078 (0.168) 0.147 (0.163)
Head Start Grade 8 0.190 (0.179) 0.260 (0.166)
Constant -0.621 (0.484) -1.234*** (0.581)
N 2,092 2,239
Controlling for individual, family, and neighborhood characteristicsRobust standard errors in parentheses *** p<0.01, ** p<0.05, * p<0.1

IV. Main Findings: Subgroup Analyses
23
LOW-INCOME GROUP External Scores
Variables Head Start vs. Other Pre-K Head Start vs. No Pre-K
Head Start 0.004 (0.138) -0.195 (0.128)
Grade 5 0.315** (0.130) 0.171 (0.110)
Head Start Grade 5 -0.097 (0.175) 0.052 (0.163)
Constant -1.500** (0.700) -0.733 (0.773)
N 1,488 1,580
Controlling for individual, family, and neighborhood characteristicsRobust standard errors in parentheses *** p<0.01, ** p<0.05, * p<0.1

● Limitations○ Restriction of variables
■ Dependent variables■ Covariates
○ Assumptions of models■ Assumption for baseline covariates■ Assumption for other interventions
V. Limitations & Policy Implications
24

● Policy Implications○ Revamping Head Start: more academic?
■ Non-cognitive skills as a mediator for cognitive outcomes○ Quality: practices that promote non-cognitive outcomes
V. Limitations & Policy Implications
25

Questions?
26
Q&A

Thank you for listening!
Contacts: Zijian Huang: [email protected]
Uyen (Sophie) Nguyen: [email protected] Zhang: [email protected]
27


![Presentation [ppt]](https://static.fdocuments.ec/doc/165x107/58f190831a28ab2d428b461d/presentation-ppt-58f8c256a27cc.jpg)
