Presentación de PowerPoint · segÚn perimetro abdominal (escolares, adulto y adulto mayor ......
27
SIEN VALORES LIMITE DE CLASIFICACION DEL ESTADO NUTRICIONAL ANTROPOMETRICO POR ETAPAS DE VIDA VALORES LIMITE PARA LA CLASIFICACION DEL RIESGO CARDIOVASCULAR SEGÚN PERIMETRO ABDOMINAL (ESCOLARES, ADULTO Y ADULTO MAYOR VALORES LIMITE PARA LA CLASIFICACION DE NIVELES DE SEVERIDAD DE ANEMIA VALORES LIMITE PARA LA CLASIFICACION DEL NIVEL DE SEVERIDAD DEL PROBLEMA NUTRICIONAL EN SALUD PUBLICA
Transcript of Presentación de PowerPoint · segÚn perimetro abdominal (escolares, adulto y adulto mayor ......

SIEN
VALORES LIMITE DE CLASIFICACION DEL ESTADO NUTRICIONAL
ANTROPOMETRICO POR ETAPAS DE VIDA
VALORES LIMITE PARA LA CLASIFICACION DEL RIESGO CARDIOVASCULAR
SEGÚN PERIMETRO ABDOMINAL (ESCOLARES, ADULTO Y ADULTO MAYOR
VALORES LIMITE PARA LA CLASIFICACION DE NIVELES DE SEVERIDAD DE
ANEMIA
VALORES LIMITE PARA LA CLASIFICACION DEL NIVEL DE SEVERIDAD DEL
PROBLEMA NUTRICIONAL EN SALUD PUBLICA

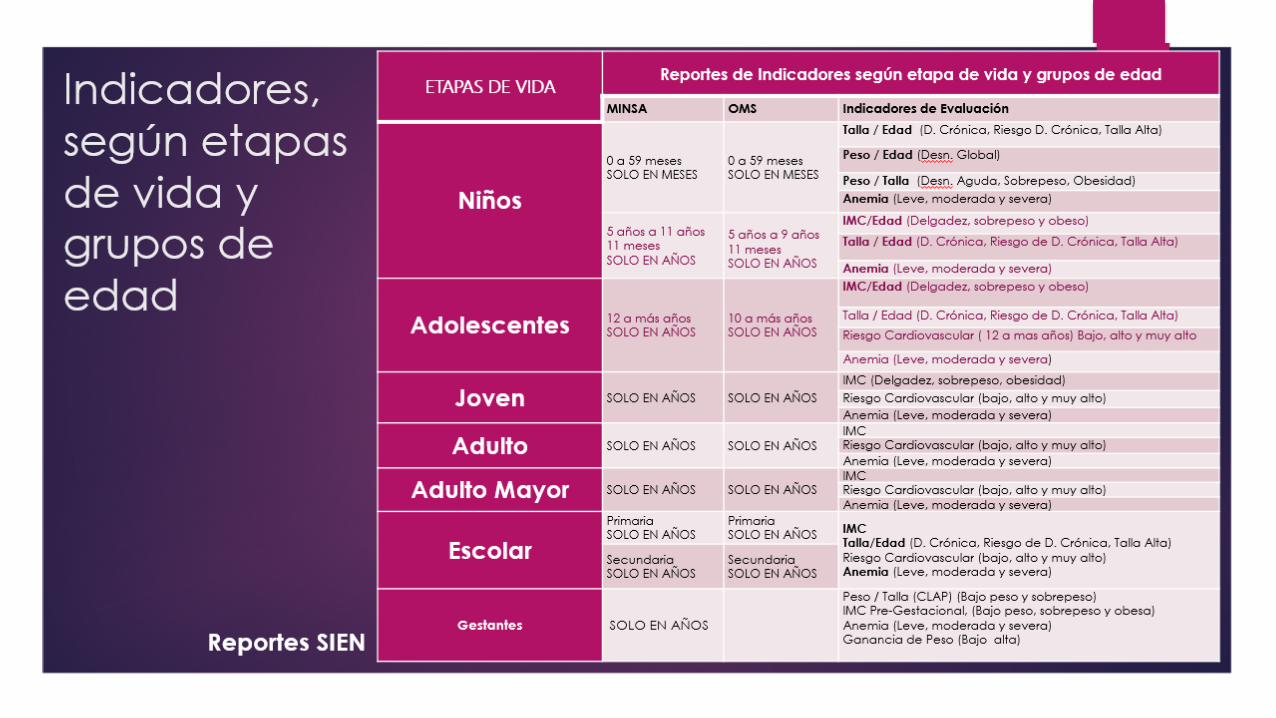
RECIEN NACIDO
VALORES LIMITE DE CLASIFICACION NUTRICIONAL
INDICADORExcluidos
Extremadam
ente bajo
Muy Bajo
PesoBajo peso Normal
Macrosomi
coExcluidos
Peso al
nacer (g) <= 325 < 10001000 a
14991500 a
2499
2500 a
4000 > 4,000 >= 4153

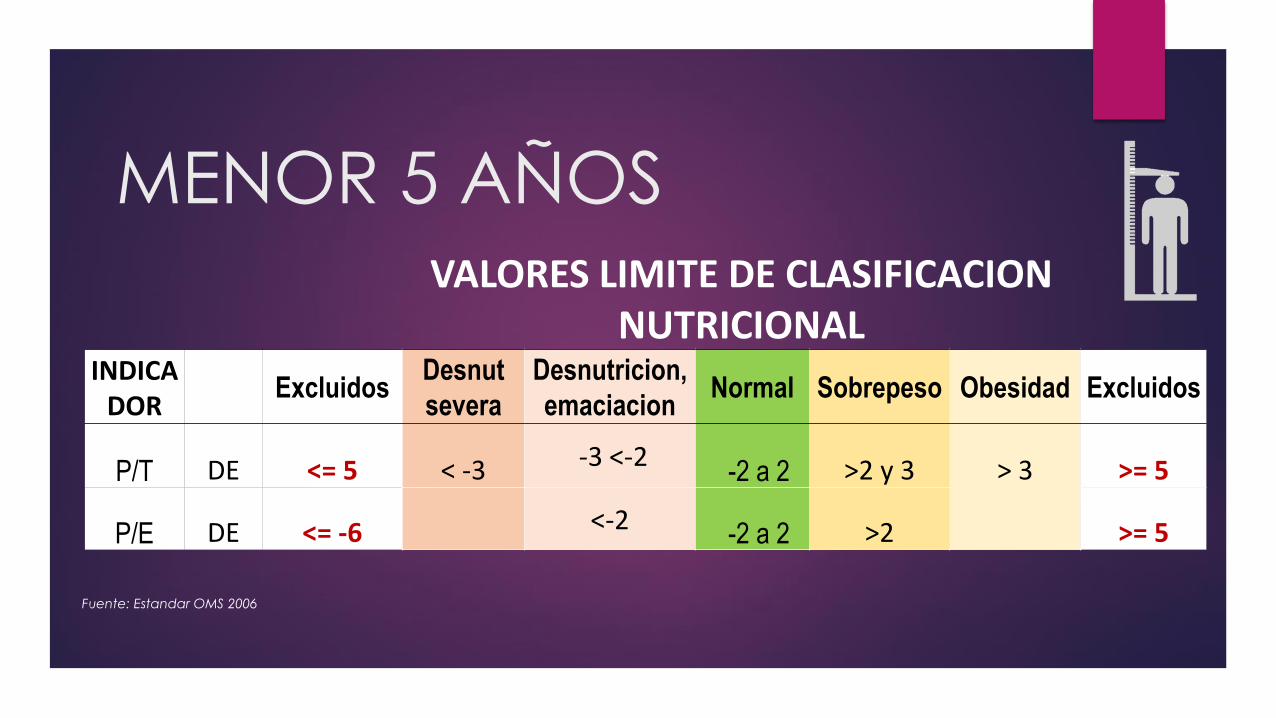
MENOR 5 AÑOSVALORES LIMITE DE CLASIFICACION
NUTRICIONAL
ExcluidosTalla baja
severaTalla baja Normal
Talla AltaExcluidos
T/E DE <= -6 < -3-3 <-2
-2 a 2 >2 >= 6
Fuente: Estandar OMS 2006
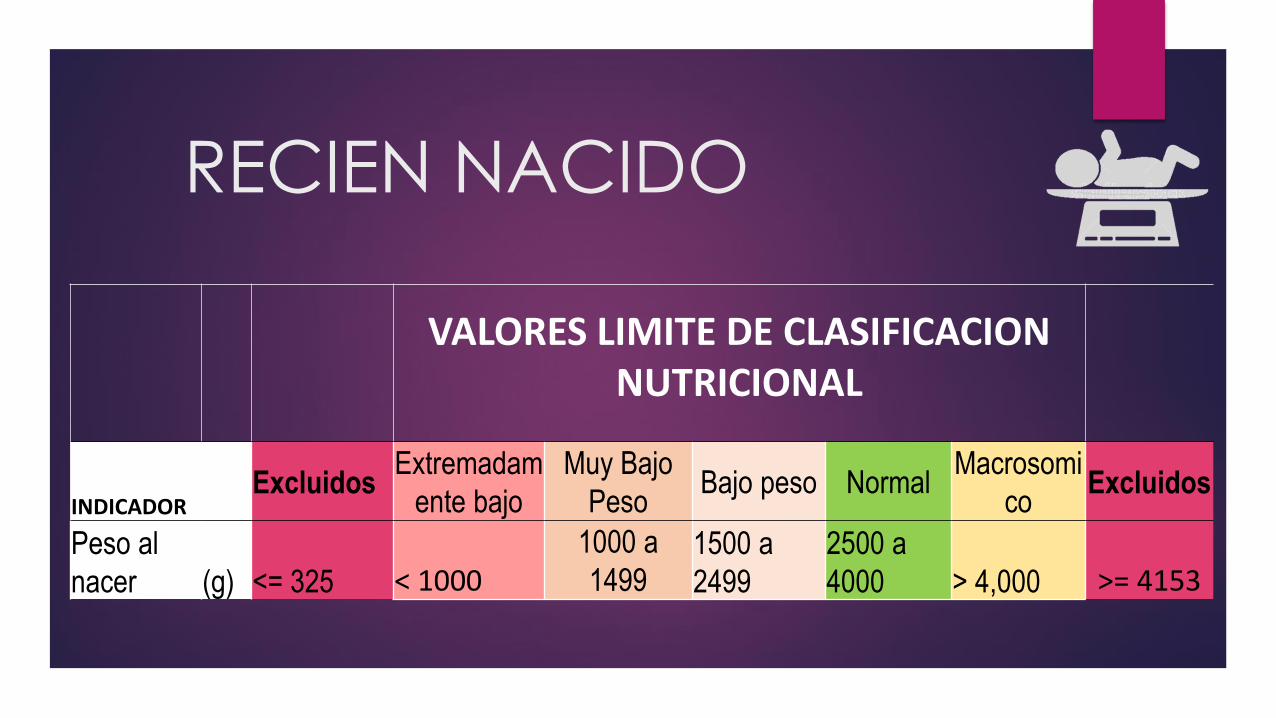
MENOR 5 AÑOSVALORES LIMITE DE CLASIFICACION
NUTRICIONALINDICA
DORExcluidos
Desnut
severa
Desnutricion,
emaciacionNormal Sobrepeso Obesidad Excluidos
P/T DE <= 5 < -3 -3 <-2-2 a 2 >2 y 3 > 3 >= 5
P/E DE <= -6 <-2-2 a 2 >2 >= 5
Fuente: Estandar OMS 2006
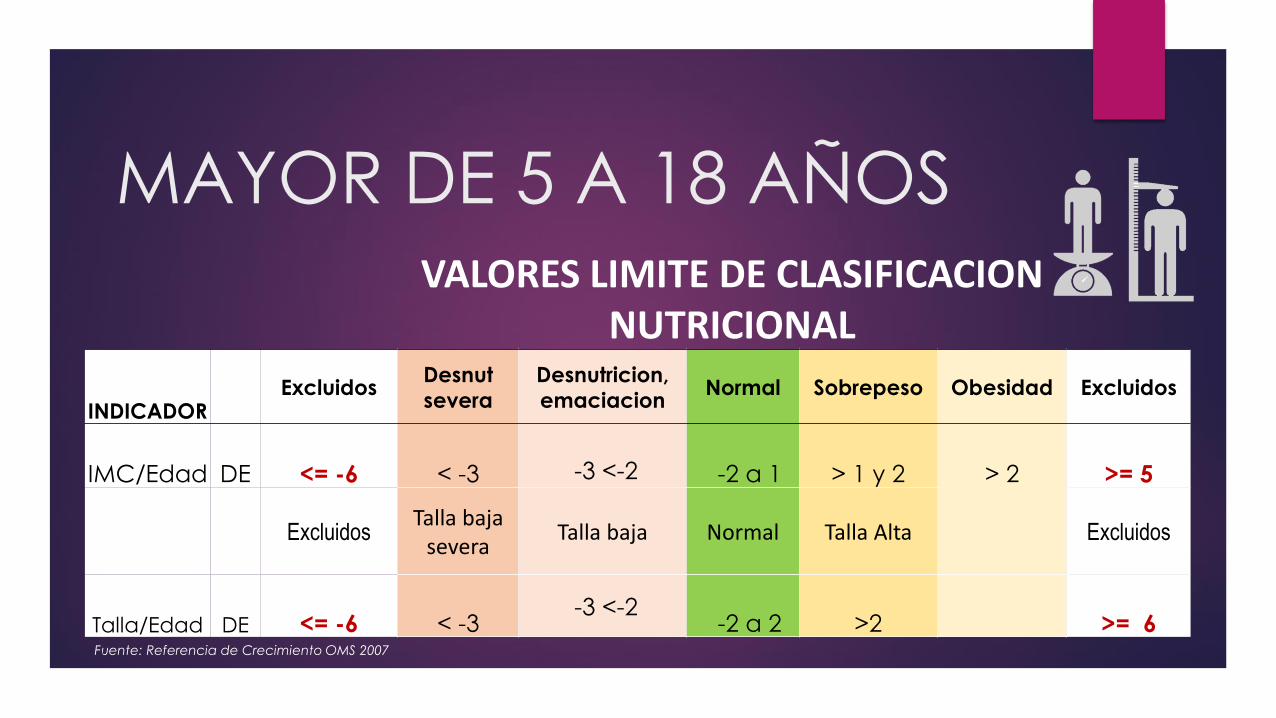
MAYOR DE 5 A 18 AÑOSVALORES LIMITE DE CLASIFICACION
NUTRICIONAL
INDICADORExcluidos
Desnut
severa
Desnutricion,
emaciacionNormal Sobrepeso Obesidad Excluidos
IMC/Edad DE <= -6 < -3 -3 <-2 -2 a 1 > 1 y 2 > 2 >= 5
ExcluidosTalla baja
severaTalla baja Normal Talla Alta Excluidos
Talla/Edad DE <= -6 < -3-3 <-2
-2 a 2 >2 >= 6Fuente: Referencia de Crecimiento OMS 2007
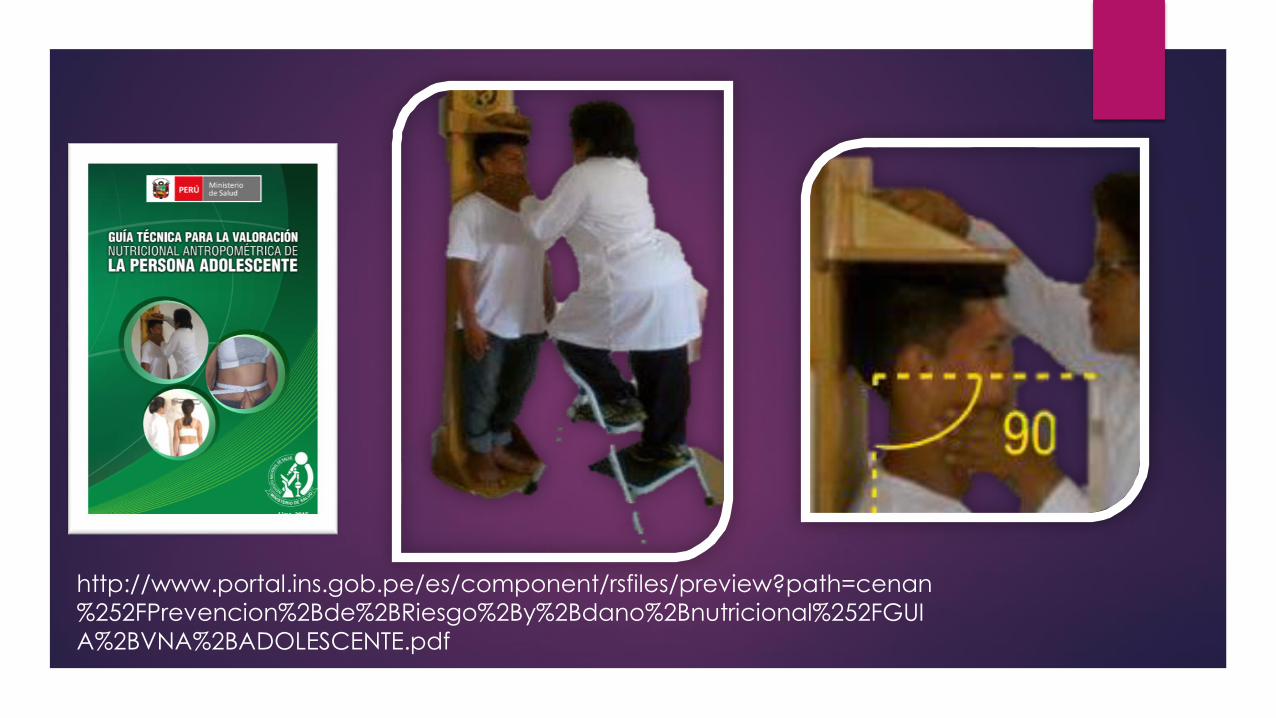
http://www.portal.ins.gob.pe/es/component/rsfiles/preview?path=cenan
%252FPrevencion%2Bde%2BRiesgo%2By%2Bdano%2Bnutricional%252FGUI
A%2BVNA%2BADOLESCENTE.pdf

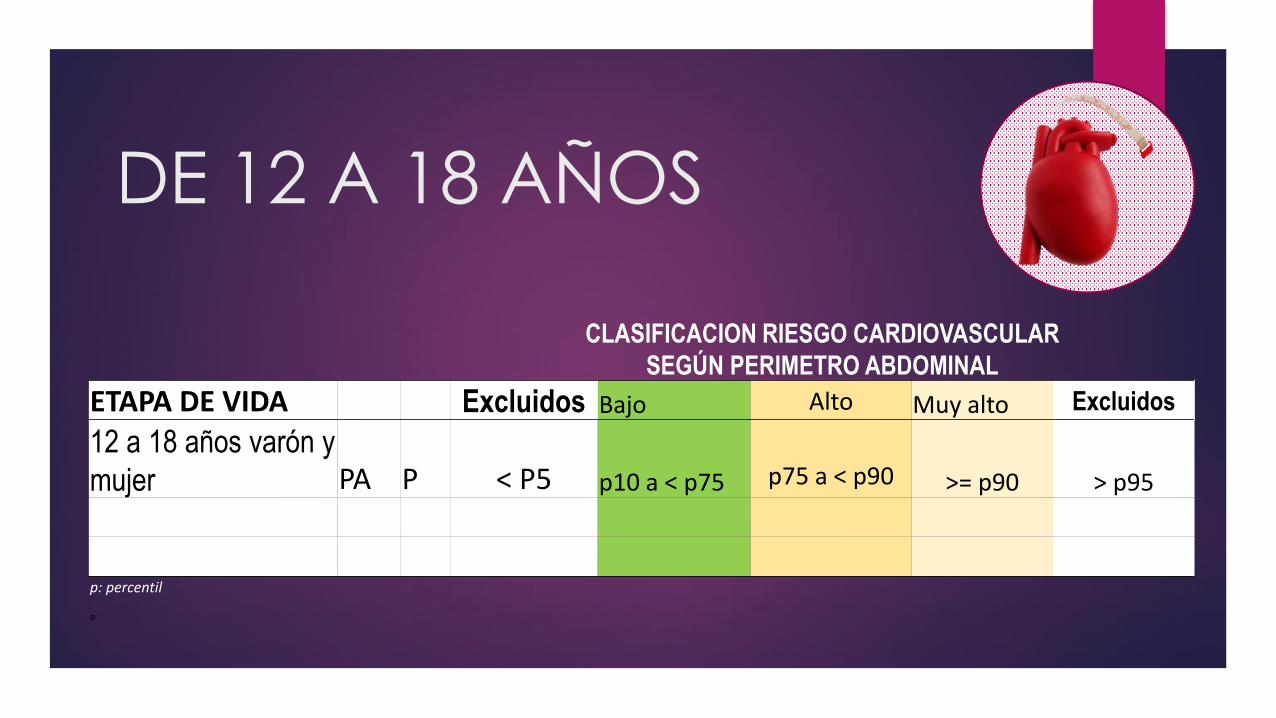
CLASIFICACION RIESGO CARDIOVASCULAR
SEGÚN PERIMETRO ABDOMINAL
ETAPA DE VIDA Excluidos Bajo Alto Muy alto Excluidos
12 a 18 años varón y
mujer PA P < P5 p10 a < p75 p75 a < p90 >= p90 > p95
p: percentil
o
DE 12 A 18 AÑOS


ADULTO
VALORES LIMITE DE CLASIFICACION NUTRICIONAL
INDICADOR Excluidos Delgadez
III
Delgadez
II
Delgadez
I
Normal Sobre-
peso
Ob I Ob II Ob III Excluidos
IMCkg/m
2 < 15 < 16 < 17 < 18,5 18,5 a 24,9 25 a 29,9 >= 30 >=35 >=40 >= 45
Fuentes: adaptado de OMS, 1995. El estado físico: uso e interpretación de la antropometría. Informe del Comité de Expertos de la OMS, Serie de Informes técnicos 854,
Ginebra, Suiza.
WHO, 2000. Obesity: Preventing and Managing the Global Epidemic. Report of a WHO Consultation on Obesity. Technical Report Series 894, Geneva, Switzerland.
WHO/FAO, 2003. Diet, Nutrition and the Prevention of Chronic Diseases. Report of a Joint WHO/FAO Expert Consultation, Technical Report Series 916, Geneva, Switzerland.
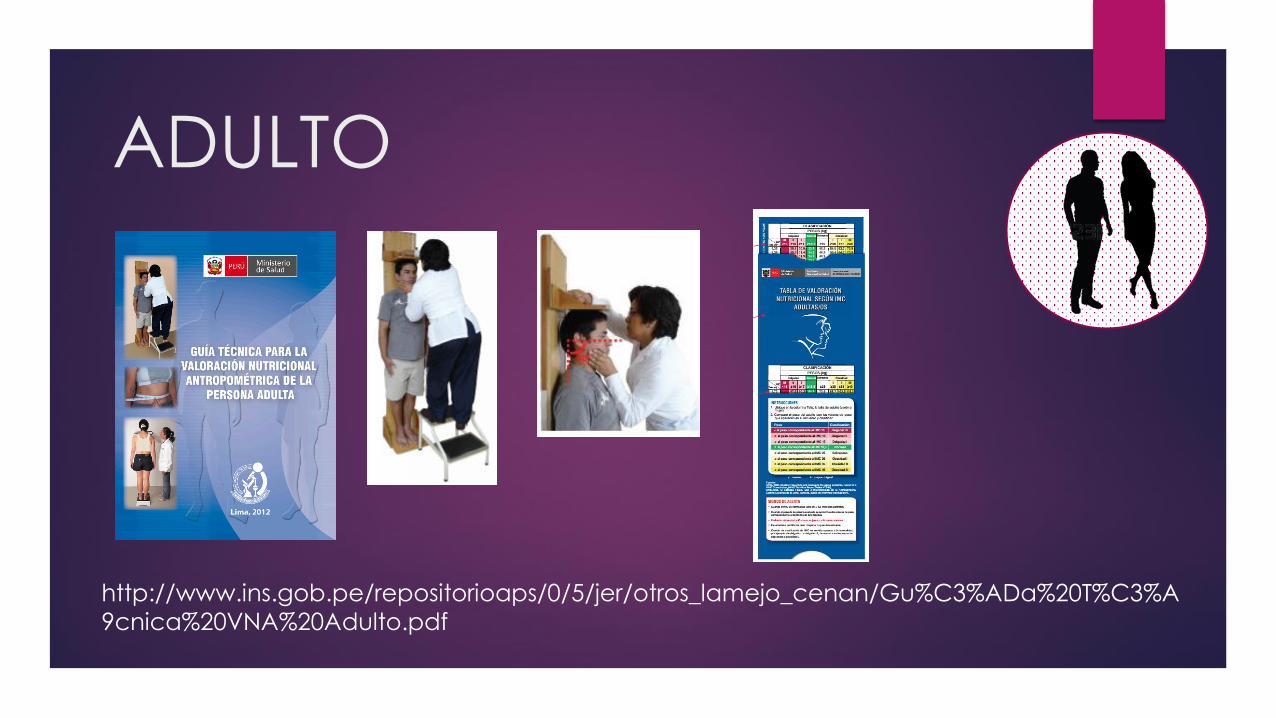
ADULTO
http://www.ins.gob.pe/repositorioaps/0/5/jer/otros_lamejo_cenan/Gu%C3%ADa%20T%C3%A
9cnica%20VNA%20Adulto.pdf

ADULTO
http://www.ins.gob.pe/repositorioaps/0/5/jer/otros_lamejo_cenan/Gu%C3%ADa%20T%C3%A
9cnica%20VNA%20Adulto.pdf

ADULTO
http://www.ins.gob.pe/repositorioaps/0/5/jer/otros_lamejo_cenan/Gu%C3%ADa%20T%C3%A
9cnica%20VNA%20Adulto.pdf
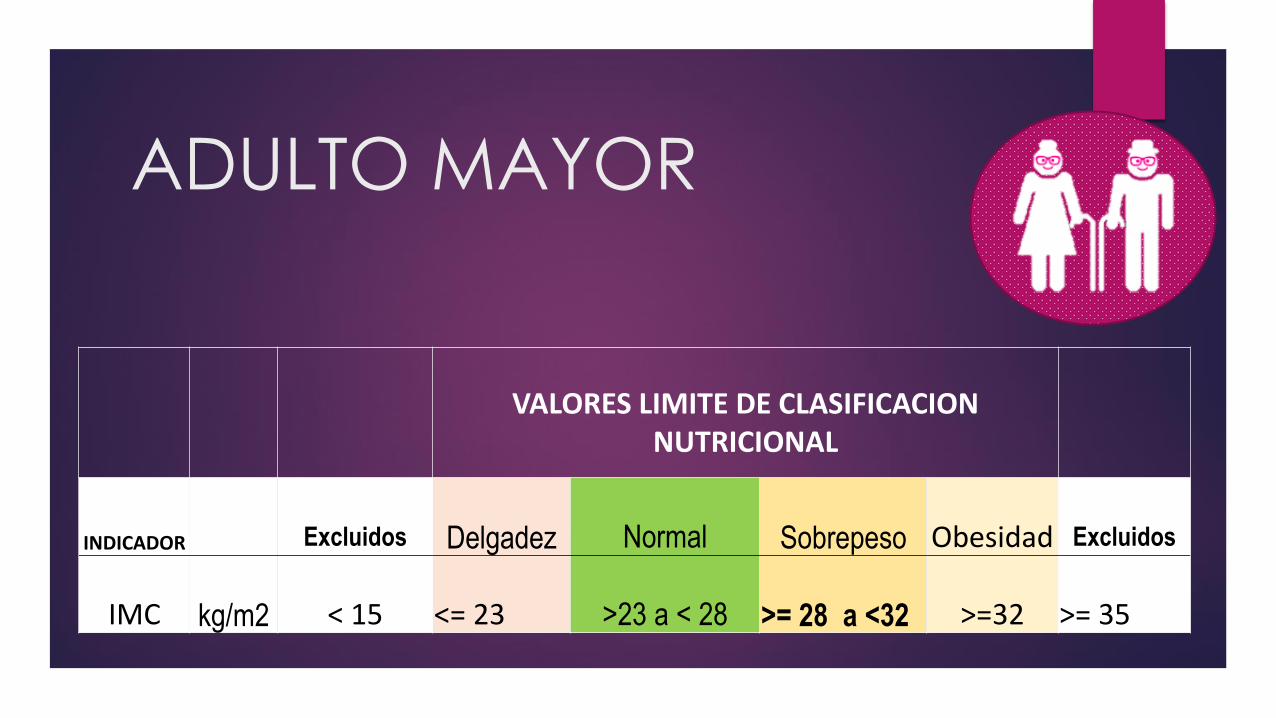
ADULTO MAYOR
VALORES LIMITE DE CLASIFICACION NUTRICIONAL
INDICADOR Excluidos Delgadez Normal Sobrepeso Obesidad Excluidos
IMC kg/m2 < 15 <= 23 >23 a < 28 >= 28 a <32 >=32 >= 35

ADULTO MAYOR
http://www.ins.gob.pe/repositorioaps/0/5/jer/otros_lamejo_cenan/Gu%C3%ADa%20T%C3%A
9cnica%20VNA%20Adulto%20Mayor.pdf
Estimación estatura

ADULTO MAYOR
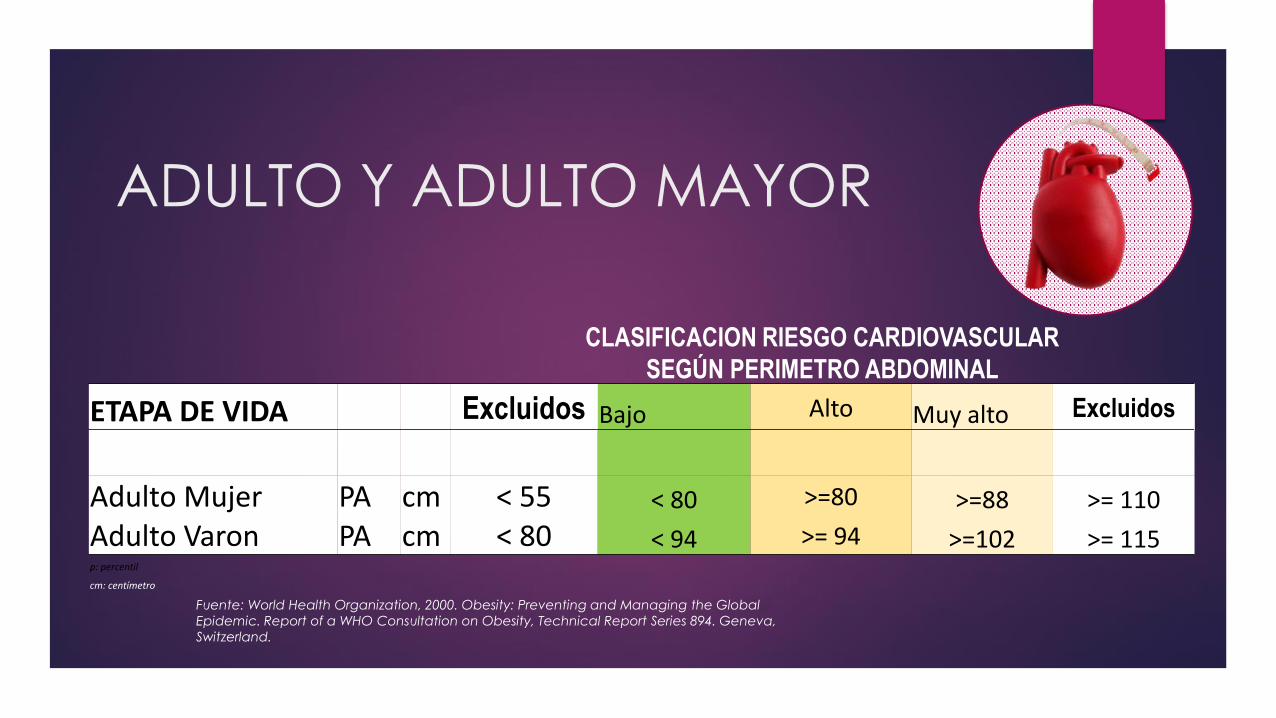
CLASIFICACION RIESGO CARDIOVASCULAR
SEGÚN PERIMETRO ABDOMINAL
ETAPA DE VIDA Excluidos Bajo Alto Muy alto Excluidos
Adulto Mujer PA cm < 55 < 80 >=80 >=88 >= 110
Adulto Varon PA cm < 80 < 94 >= 94 >=102 >= 115p: percentil
cm: centímetro
ADULTO Y ADULTO MAYOR
Fuente: World Health Organization, 2000. Obesity: Preventing and Managing the Global
Epidemic. Report of a WHO Consultation on Obesity, Technical Report Series 894. Geneva,
Switzerland.

ADULTO Y ADULTO MAYOR

http://www.ins.gob.pe/repositorioaps/0/0/jer/CENAN/DEPRYDAN/Guia_Gestante_final
-ISBN.pdf
GESTANTE
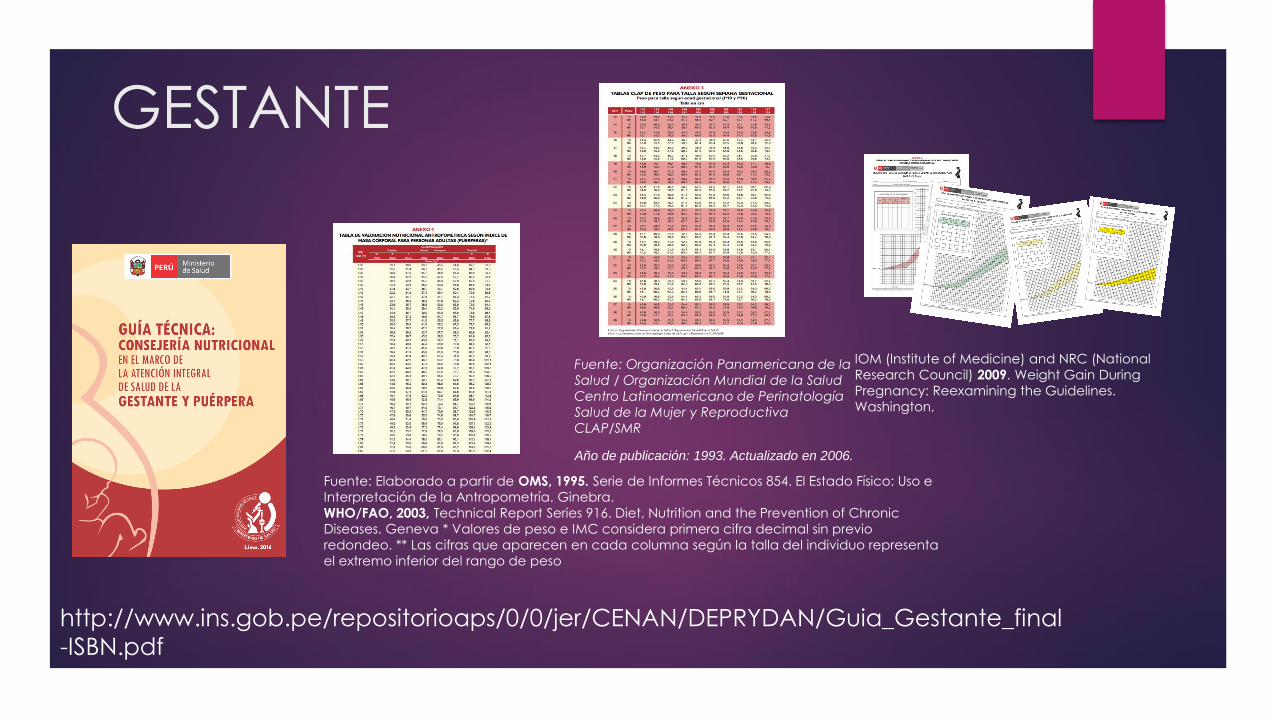
http://www.ins.gob.pe/repositorioaps/0/0/jer/CENAN/DEPRYDAN/Guia_Gestante_final
-ISBN.pdf
GESTANTE
Fuente: Elaborado a partir de OMS, 1995. Serie de Informes Técnicos 854. El Estado Físico: Uso e
Interpretación de la Antropometría. Ginebra.
WHO/FAO, 2003, Technical Report Series 916. Diet, Nutrition and the Prevention of Chronic
Diseases. Geneva * Valores de peso e IMC considera primera cifra decimal sin previo
redondeo. ** Las cifras que aparecen en cada columna según la talla del individuo representa
el extremo inferior del rango de peso
Fuente: Organización Panamericana de la
Salud / Organización Mundial de la Salud
Centro Latinoamericano de Perinatología
Salud de la Mujer y Reproductiva
CLAP/SMR
IOM (Institute of Medicine) and NRC (National
Research Council) 2009. Weight Gain During
Pregnancy: Reexamining the Guidelines.
Washington,
Año de publicación: 1993. Actualizado en 2006.

ANEMIA
CLASIFICACION ANEMIA
INDICADORExcluidos
Severa Moderada LeveExcluidos
TODAS ETAPAS DE VIDA Hb g/dl < 5 < 7 7,0 a 9,9 10 a 10,9 >23

CLASIFICACION SEGÚN SEVERIDAD DEL
PROBLEMA EN SALUD PUBLICA
Casos de anemia por Regiones

VALORES LIMITE DE PREVALENCIA DE
SIGNIFICANCIA EN SALUD PUBLICA
VALORES LIMITE DE PREVALENCIA DE SIGNIFICANCIA EN SALUD PUBLICA
SEGÚN INDICADORES (%)
BAJA
PREVALENCIA
MEDIANA
PREVALENCIA
ALTA
PREVALENCIA
MUYA ALTA
PREVALENCIA
Menores 5 años P/T DES. AGUDA < 5 5 a 9 10 a 14 >= 15 Referencia: WHO 1995
Menores 5 años T/E TALLA BAJA < 20 20 a 29 30 a 39 >= 40 Referencia: WHO 1995
Adulto varon, mujer IMC < 18,5BAJO PESO
DELGADEZ < 10 10 a 19 20 a 29 >= 30 Referencia: WHO 1995
SOBREPESO < 10 10 a 19 20 a 39 >= 40
Adulto mayor varon/mujer IMC < 23
BAJO PESO
DELGADEZ < 10 10 a 19 20 a 39 >= 40 Referencia: WHO 1995
Todos Hb < 11 ANEMIA <= 4,9 5 a 19,9 20 a 39,9 >= 40 Reference: WHO, 2008.