PREDICCIÓN DEL RENDIMIENTO MADERABLE DE …PREDICCIÓN DEL RENDIMIENTO MADERABLE DE Pinus patula...
15
87 RESUMEN La región de Zacualtipán, Hidalgo, México, se caracteriza por la presencia de rodales coetáneos de Pinus patula Schl. et Cham., una especie maderable de crecimiento rápido con valor económico y ecológico alto. Contar con herramientas silvícolas para predecir su crecimiento y rendimiento es un requisito fundamental para planificar su manejo sostenible. El objetivo de este estudio fue presentar dos sistemas de pre- dicción del rendimiento maderable para P. patula con el en- foque de modelos de distribución en clases diamétricas. En su construcción se usaron datos dasométricos de 126 distri- buciones diamétricas, derivadas de 42 parcelas permanentes de muestreo de 400 m 2 , localizadas en el ejido La Mojonera, Municipio de Zacualtipán, Hidalgo. La distribución diamé- trica del rodal se estimó mediante la función de densidad de probabilidad (fdp) Weibull (1951) con predicción de percen- tiles y con el método de distribución libre basado en per- centiles. La comparación de medias con la prueba de Tukey (p0.05) para las predicciones de volumen total obtenidas con los dos sistemas de distribuciones diamétricas, indica que no hay diferencias significativas entre el volumen total predi- cho por ambos sistemas. Sin embargo, el sistema basado en la función de densidad de probabilidad Weibull es más sencillo de usar porque sus parámetros son dependientes del diámetro mínimo y del diámetro cuadrático del rodal, y requiere sólo la predicción de dos percentiles. Los modelos de distribución diamétrica presentados permiten estimar la estructura diamé- trica de un rodal a medida que cambia su edad. Por tanto, ABSTRACT The region of Zacualtipán, Hidalgo, Mexico, is characterized by the presence of even-aged stands of Pinus patula Schl. et Cham., a fast-growing timber species with high economic and ecological value. Having forestry tools to predict its growth and yield is a fundamental requisite to plan its sustainable management. The objective of this study was to present two prediction systems for timber yield of P. patula stands with the diameter distribution models approach. In their construction, dasometric data from 126 diameter distributions were used, which were obtained from 42 permanent sampling plots of 400 m 2 , located in the Ejido La Mojonera, municipality of Zacualtipán, Hidalgo. Stand diameter distribution was estimated through Weibull’s probability density function (pdf) (1951) with percentile prediction and the free distribution method based on percentiles. The means comparison with Tukey test (p0.05), for total volume predictions obtained with the two diameter distribution systems, shows that there are no significant statistical differences between the total volume predicted by both systems. However, the system based on Weibull’s probability density function is easier to use because its parameters are dependent on the stand’s minimum diameter and quadratic mean diameter, and it requires the prediction of only two percentiles. The diameter distribution models presented allow estimating the diameter structure of a stand as it changes with stand age. Therefore, their use is recommended as a support tool for management plans of P. patula stands. Keywords: diameter distribution, Weibull distribution, percentiles, implicit prediction. PREDICCIÓN DEL RENDIMIENTO MADERABLE DE Pinus patula Schl. et Cham. A TRAVÉS DE MODELOS DE DISTRIBUCIÓN DIAMÉTRICA PREDICTION OF Pinus patula Schl. et Cham. TIMBER YIELD THROUGH DIAMETER DISTRIBUTION MODELS Wenceslao Santiago-García 1* , Héctor M. De los Santos-Posadas 1 , Gregorio Ángeles-Pérez 1 , José J. Corral-Rivas 2 , José R. Valdez-Lazalde 1 , David H. Del Valle-Paniagua 3 1 Postgrado Forestal, 3 Postgrado en Cómputo Aplicado, Campus Montecillo, Colegio de Postgraduados. Carretera México-Texcoco km 36.5. 56230, Montecillo, Texcoco, Estado de México. 2 Facultad de Ciencias Forestales, Universidad Juárez del Estado de Durango. Río Papaloapan y Boulevard Durango s/n, Colonia Valle del Sur. 34120. Durango, México. ([email protected]). *Autor responsable v Author for correspondence. Recibido: abril, 2013. Aprobado: diciembre, 2013. Publicado como ARTÍCULO en Agrociencia 48: 87-101. 2014.
Transcript of PREDICCIÓN DEL RENDIMIENTO MADERABLE DE …PREDICCIÓN DEL RENDIMIENTO MADERABLE DE Pinus patula...
87
Resumen
La región de Zacualtipán, Hidalgo, México, se caracteriza por la presencia de rodales coetáneos de Pinus patula Schl. et Cham., una especie maderable de crecimiento rápido con valor económico y ecológico alto. Contar con herramientas silvícolas para predecir su crecimiento y rendimiento es un requisito fundamental para planificar su manejo sostenible. El objetivo de este estudio fue presentar dos sistemas de pre-dicción del rendimiento maderable para P. patula con el en-foque de modelos de distribución en clases diamétricas. En su construcción se usaron datos dasométricos de 126 distri-buciones diamétricas, derivadas de 42 parcelas permanentes de muestreo de 400 m2, localizadas en el ejido La Mojonera, Municipio de Zacualtipán, Hidalgo. La distribución diamé-trica del rodal se estimó mediante la función de densidad de probabilidad (fdp) Weibull (1951) con predicción de percen-tiles y con el método de distribución libre basado en per-centiles. La comparación de medias con la prueba de Tukey (p0.05) para las predicciones de volumen total obtenidas con los dos sistemas de distribuciones diamétricas, indica que no hay diferencias significativas entre el volumen total predi-cho por ambos sistemas. Sin embargo, el sistema basado en la función de densidad de probabilidad Weibull es más sencillo de usar porque sus parámetros son dependientes del diámetro mínimo y del diámetro cuadrático del rodal, y requiere sólo la predicción de dos percentiles. Los modelos de distribución diamétrica presentados permiten estimar la estructura diamé-trica de un rodal a medida que cambia su edad. Por tanto,
AbstRAct
The region of Zacualtipán, Hidalgo, Mexico, is characterized by the presence of even-aged stands of Pinus patula Schl. et Cham., a fast-growing timber species with high economic and ecological value. Having forestry tools to predict its growth and yield is a fundamental requisite to plan its sustainable management. The objective of this study was to present two prediction systems for timber yield of P. patula stands with the diameter distribution models approach. In their construction, dasometric data from 126 diameter distributions were used, which were obtained from 42 permanent sampling plots of 400 m2, located in the Ejido La Mojonera, municipality of Zacualtipán, Hidalgo. Stand diameter distribution was estimated through Weibull’s probability density function (pdf ) (1951) with percentile prediction and the free distribution method based on percentiles. The means comparison with Tukey test (p0.05), for total volume predictions obtained with the two diameter distribution systems, shows that there are no significant statistical differences between the total volume predicted by both systems. However, the system based on Weibull’s probability density function is easier to use because its parameters are dependent on the stand’s minimum diameter and quadratic mean diameter, and it requires the prediction of only two percentiles. The diameter distribution models presented allow estimating the diameter structure of a stand as it changes with stand age. Therefore, their use is recommended as a support tool for management plans of P. patula stands.
Keywords: diameter distribution, Weibull distribution, percentiles, implicit prediction.
PREDICCIÓN DEL RENDIMIENTO MADERABLE DE Pinus patula Schl. et Cham. A TRAVÉS DE MODELOS
DE DISTRIBUCIÓN DIAMÉTRICA
PREDICTION OF Pinus patula Schl. et Cham. TIMBER YIELD THROUGH DIAMETER DISTRIBUTION MODELS
Wenceslao Santiago-García1*, Héctor M. De los Santos-Posadas1, Gregorio Ángeles-Pérez1, José J. Corral-Rivas2, José R. Valdez-Lazalde1, David H. Del Valle-Paniagua3
1Postgrado Forestal, 3Postgrado en Cómputo Aplicado, Campus Montecillo, Colegio de Postgraduados. Carretera México-Texcoco km 36.5. 56230, Montecillo, Texcoco, Estado de México. 2Facultad de Ciencias Forestales, Universidad Juárez del Estado de Durango. Río Papaloapan y Boulevard Durango s/n, Colonia Valle del Sur. 34120. Durango, México. ([email protected]).
*Autor responsable v Author for correspondence.Recibido: abril, 2013. Aprobado: diciembre, 2013.Publicado como ARTÍCULO en Agrociencia 48: 87-101. 2014.
88
AGROCIENCIA, 1 de enero - 15 de febrero, 2014
VOLUMEN 48, NÚMERO 1
se recomienda su uso como una herramienta de apoyo para planificar el manejo de los rodales de P. patula.
Palabras clave: distribución diamétrica, distribución Weibull, percentiles, predicción implícita.
IntRoduccIón
Predecir el crecimiento y el rendimiento de las masas forestales es un requisito fundamental para planificar su manejo a cualquier nivel. Por
ello, los responsables del manejo sostenible de bos-ques deben contar con herramientas cuantitativas sil-vícolas que les permitan conducir satisfactoriamente la evolución de un rodal hacia cierta estructura meta y lograr un rendimiento sostenido de los productos forestales deseados (García, 1988; De la Fuente et al., 1998). Los sistemas de rendimiento que proveen es-timaciones del volumen maderable por clase diamé-trica (predicción implícita) son una herramienta de alto valor para la planificación del manejo forestal. Al revelar la estructura del rodal por clase diamétri-ca, permiten definir los tratamientos silvícolas que se pueden aplicar porque el tamaño de los diámetros determina el uso industrial de la madera, así como el precio de los diferentes productos. Además, la distri-bución diamétrica es un factor importante en la pla-neación de la cosecha de madera, porque influye en el tipo de maquinaria de extracción y de transporte a utilizar (Gorgoso et al., 2007). Como modelos de distribución diamétrica se usan funciones de densidad probabilística como la función de Charlier, la ecuación de Pearl-Reed, SB de Johnson, Gamma, Normal, Lognormal, Beta, logit-logistic, Burr XII y Weibull (Álvarez y Ruiz, 1998; Cao, 2004; Fidalgo et al., 2009). La función de den-sidad de probabilidades (fdp) Weibull es la más usada desde su introducción al campo forestal por Bailey y Dell (1973), y debido a su eficiencia y relativa fa-cilidad de aplicación es una herramienta clásica de manejo en rodales puros coetáneos (Vanclay, 1994; Magaña et al., 2008). Su forma cerrada y gran flexibi-lidad es una ventaja porque puede adoptar diferentes formas desde una J invertida hasta distribuciones en forma de campana, con diferentes grados de sesgo; su desventaja principal es su unimodalidad (Bailey y Dell, 1973; Maldonado y Návar, 2002). Borders et al. (1987) generaron un método para caracterizar estructuras diamétricas de rodales que no requieren
IntRoductIon
Predicting the growth and yield of forests is a fundamental requisite to plan their management at any level. Therefore, those
responsible for the sustainable management of forests should have quantitative forestry tools that allow them to successfully lead the evolution of a stand towards a specific goal structure and achieve a sustained yield of the desired forest products (García, 1988; De la Fuente et al., 1998). The systems that provide estimations of the timber-yielding volume per diameter class (implicit prediction) are a tool of high value for planning forest management. By revealing the stand structure per diameter class, they allow defining the silvicultural treatments that can be applied, since the diameter size determines the industrial use of the wood, as well as the price for the different products. In addition, the diameter distribution is an important factor in planning wood harvesting, because it influences the type of machinery for extraction and transport that should be used (Gorgoso et al., 2007). Probability density functions such as the Charlier function, the Pearl-Reed equation, Johnson’s SB, gamma, normal, lognormal, beta, logit-logistic, Burr XII and Weibull (Álvarez and Ruiz, 1998; Cao, 2004; Fidalgo et al., 2009) are used as models for diameter distribution. Weibull’s probability density function (pdf ) is the most used since its introduction into the forestry field by Bailey and Dell (1973), and due to its efficiency and relative ease in application, it is a classic tool for even-aged pure stands management (Vanclay, 1994; Magaña et al., 2008). Its closed shape and great flexibility is an advantage because it can adopt different shapes, from an inverted J to bell-shaped distributions, with different degrees of skewness; its main disadvantage is its unimodality (Bailey and Dell, 1973; Maldonado and Návar, 2002). Borders et al. (1987) generated a method to characterize diameter structures in stands that do not require a probabilistic distribution a priori. The method is based on a uniform distribution of frequencies of trees among adjacent percentiles and the number of trees per hectare is estimated within each diameter class, using a prediction system for percentiles. In Mexico, models based on the Weibull pdf have been generated to estimate diameter distributions
PREDICCIÓN DEL RENDIMIENTO MADERABLE DE Pinus patula Schl. et Cham. A TRAVÉS DE MODELOS DE DISTRIBUCIÓN DIAMÉTRICA
89SANTIAGO-GARCÍA et al.
una distribución probabilística a priori. El método se basa en una distribución uniforme de frecuencias de árboles entre percentiles adyacentes y el número de árboles por unidad de superficie se estima dentro de cada clase diamétrica, usando un sistema de predic-ción de percentiles. En México se han generado modelos basados en la fdp Weibull para estimar distribuciones dia-métricas en rodales coetáneos y plantaciones de co-níferas principalmente, y destacan: Pinus rudis, P. caribaea var. hondurensis, P. duranguensis, P. cooperi, P. engelmannii, y P. arizonica (De la Fuente et al., 1998; Montero y Fierros, 2000; Maldonado y Navar, 2002). Sin embargo, el método de distribución libre basado en percentiles aún no ha sido probado. Los objetivos de este estudio fueron: 1) desarro-llar un sistema de predicción del rendimiento ma-derable con distribución en clases diamétricas basa-do en la fdp Weibull para Pinus patula Schiede ex Schlechtendal & Chamisso; 2) generar un sistema implícito utilizando el método de distribución libre basado en percentiles; y 3) comparar las estimaciones del rendimiento maderable de ambos sistemas.
mAteRIAles y métodos
Área de estudio y datos dasométricos
Los datos de este estudio corresponden a 126 distribucio-nes diamétricas, de tres mediciones realizadas cronológica-mente en 42 parcelas permanentes de muestreo de 400 m2, localizadas en rodales coetáneos de P. patula en el ejido La Mojonera, al sureste del municipio de Zacualtipán, Hidalgo, México (20° 36’ 44’’ y 20° 37’ 49’’ N, y 98° 35’ 30’’ y 98° 37’ 46’’ O; 2060 m de altitud promedio). Se usó la altura total (A) y el diámetro normal (Dn) de todos los árboles vivos den-tro de cada parcela. Las variables de estado del rodal fueron: altura promedio del total del arbolado (A, m), área basal (AB, m2 ha1), número de árboles (NA ha1), diámetro cuadrático (Dq, cm), diámetro mínimo (Dmin, cm) y volumen (V, m3 ha1). El diámetro cuadrático corresponde al diámetro del ár-
bol de área basal media: DqABNA
= ×40000π
. La altura se
obtuvo con una curva altura-diámetro ajustada para tal fin:
A Dn= × −( )35 3469 14 8599. exp . . El volumen del fuste total
para cada árbol se calculó con una función generada por Ca-
rrillo et al. (2004): V D An= −( )× ×( )exp ..
9 7688 2 0 9451.
mainly in even-aged stands and forest plantations of conifers, from which the following could be pointed out: Pinus rudis, P. caribaea var. hondurensis, P. duranguensis, P. cooperi, P. engelmannii, and P. arizonica (De la Fuente et al., 1998; Montero and Fierros, 2000; Maldonado and Navar, 2002). However, the free distribution method based on percentiles has still not been tested. The objectives of this study were: 1) to develop a prediction system for timber yield with diameter class distributions based on the Weibull pdf for Pinus patula Schiede ex Schlechtendal & Chamisso; 2) to generate an implicit system using the free distribution method based on percentiles; and 3) to compare the estimations of timber yield in both systems.
mAteRIAls And methods
Study area and dasometric data
The data used in this study correspond to 126 diameter distributions, from three measurements made chronologically in 42 permanent sampling plots of 400 m2, located in even-aged stands of P. patula in Ejido La Mojonera, southeast of the municipality of Zacualtipán, Hidalgo, Mexico (20° 36’ 44’’ and 20° 37’ 49’’ N, and 98° 35’ 30’’ and 98° 37’ 46’’ W; 2060 m mean altitude). The total height (A) and the diameter at breast height (Dn) of all the live trees within each plot were used. The stand state variables were: mean height of all the trees (A, m), basal area (AB, m2 ha1), number of trees (NA ha1), quadratic mean diameter (Dq, cm), minimum diameter (Dmin, cm) and volume (V, m3 ha1). The quadratic mean diameter corresponds to the
diameter of the tree’s mean basal area: DqABNA
= ×40000π
. The
height was obtained with a height-diameter curve fitted for that
purpose: A Dn= × −( )35 3469 14 8599. exp . . The total bole
volume for each tree was calculated with a function proposed by
Carrillo et al. (2004): V D An= −( )× ×( )exp ..
9 7688 2 0 9451.
Diameter distribution based on the Weibull probability density function
To generate diameter distribution estimations with the Weibull pdf, at least two percentiles of the diameter distribution of the stand are required. Percentiles 50 and 90 turned out to be efficient, and were fitted as a function of the quadratic mean diameter of the stand (Dq). Thus, the prediction equations for those percentiles are the following:
90
AGROCIENCIA, 1 de enero - 15 de febrero, 2014
VOLUMEN 48, NÚMERO 1
Distribución diamétrica basada en la función de densidad de probabilidades Weibull
Para generar estimaciones de distribución diamétrica con la fdp Weibull se requieren al menos dos percentiles de la distri-bución diamétrica del rodal. Los percentiles 50 y 90 resultaron eficientes, y se ajustaron como funciones del diámetro cuadrático del rodal (Dq). Así, las ecuaciones de predicción de percentiles son las siguientes:
p Dq50= ×α β (1)
p Dq90= ×α β (2)
donde p50 y p90 corresponden a los percentiles 50 y 90 de la distribución diamétrica del rodal, Dq es el diámetro cuadrático del rodal, y son los parámetros a ser estimados.
Para la predicción implícita del rendimiento maderable se utilizó el enfoque de distribución sugerido por Clutter et al. (1983). La distribución Weibull tri-paramétrica está definida por la siguiente función de densidad probabilística:
f xcb
x ab
x ab
a x
c c( )=
−
−
−
≤ <∞( )
−1exp
(3)0, de otra forma.
donde a es el parámetro de localización, b corresponde al pará-metro de escala, c es el parámetro de forma.
Los parámetros b y c siempre son positivos. Aunque a puede ser positivo, cero o negativo, en aplicaciones de la distribución diamétrica no debe ser negativo (Clutter et al., 1983). Esta función define el valor de la densidad de probabilidad asociada con cada posible valor de la variable aleatoria x (el diá-metro). La distribución acumulada de forma cerrada de la fun-ción es:
f xx a
b
a x
c( )= − −
−
≤ <∞( )
1 exp
(4)0, de otra forma.
Conociendo los parámetros de esta función la proporción de la población comprendida dentro de un cierto intervalo está dada por:
p Dq50= ×α β (1)
p Dq90= ×α β (2)
where p50 and p90 correspond to the percentiles 50th and 90th from the stand’s diameter distribution, Dq is the stand’s quadratic mean diameter, and are the parameters to be estimated.
The distribution approach suggested by Clutter et al. (1983) was used for the implicit prediction of the timber yield. The Weibull three-parameter distribution is defined by the following probability density function:
f xcb
x ab
x ab
a x
c c( )=
−
−
−
≤ <∞( )
−1exp
(3)0, otherwise.
where a is the location parameter, b corresponds to the scale parameter, c is the shape parameter.
The b and c parameters are always positive. Although a can be positive, zero or negative, in applications of the diameter distribution it must be nonnegative (Clutter et al., 1983). This function defines the value of the probability density associated with each possible value of the random variable x (the diameter). The cumulative distribution in a closed-form of the function is:
f xx a
b
a x
c( )= − −
−
≤ <∞( )
1 exp
(4)0, otherwise.
Understanding the parameters of this function, the proportion of the population within a specific interval is given by:
P L X U
L ab
U ab
c c< <( )= −
−
− −
−
exp exp
(5)
where P is the proportion of trees in the corresponding diameter class, L is the lower bound of the diameter class, U is the upper bound of the diameter class, X is the diameter
PREDICCIÓN DEL RENDIMIENTO MADERABLE DE Pinus patula Schl. et Cham. A TRAVÉS DE MODELOS DE DISTRIBUCIÓN DIAMÉTRICA
91SANTIAGO-GARCÍA et al.
P L X U
L ab
U ab
c c< <( )= −
−
− −
−
exp exp
(5)
donde P es la proporción de árboles en la categoría diamétrica correspondiente, L es el límite inferior de la categoría diamétrica, U es el límite superior de la categoría diamétrica, X es la catego-ría diamétrica, exp es la función exponencial; lo demás ya fue definido.
Los parámetros de la distribución Weibull fueron estimados por el método de momentos, según Pienaar y Rheney (1993). Las expresiones usadas fueron las siguientes:
Para el parámetro de localización:
aD min, y
aD
D= <min
, min2
5 si cm (6)
Con el parámetro de localización se estimó el parámetro de for-ma (c) y de escala (b):
c p a p a= − ( ) − ( )[ ] −( ) −( ) ln ln . / ln . / ln /0 10 0 50 90 50
(7)
b a
a Dq=− × +
× −( )+
Γ
Γ ΓΓ Γ
Γ1
2 2
2
12
2
2
2
12
(8)
donde Γ Γ1 11
= +
c, Γ2 1
2= +
c, Γ .( ) es la función
Gamma, Dmin es el diámetro mínimo del rodal (cm), ln es el logaritmo natural; lo demás ya se definió previamente.
Distribución diamétrica basada en percentiles
El método de distribución libre para caracterizar estructu-ras diamétricas se probó con la metodología de Borders et al. (1987). Para ajustar el sistema, éste se formuló a partir de un percentil guía:
pgi f ( pg , atributos del rodal)
donde pg es el percentil guía en el sistema; pgi son otros percen-tiles del sistema relacionados a pg, cuando existen j percentiles menores que pg y k percentiles mayores que pg .
class, exp is the exponential function; the rest has already been defined.
The Weibull distribution parameters were estimated by the method of moments, based on Pienaar and Rheney (1993). The expressions used were the following:
For the location parameter:
aD min, and
aD
D= <min
, min2
5 if cm (6)
With the location parameter, the shape (c) and scale (b) parameters were estimated:
c p a p a= − ( ) − ( )[ ] −( ) −( ) ln ln . / ln . / ln /0 10 0 50 90 50
(7)
b a
a Dq=− × +
× −( )+
Γ
Γ ΓΓ Γ
Γ1
2 2
2
12
2
2
2
12
(8)
where Γ Γ1 11
= +
c, Γ2 1
2= +
c, Γ .( ) is the Gamma
function, Dmin is the stand’s minimum diameter (cm), ln is the natural logarithm; the rest has already been defined.
Diameter distribution based on percentiles
The method of free distribution used to characterize diameter structures was tested with the methodology proposed by Borders et al. (1987). To adjust the system, it was formulated from a driver percentile:
pgi f ( pg , stand attributes)
where pg is the driver percentile in the system; pgi are other percentiles in the system related to pg when there are j percentiles less than pg and k percentiles greater than pg.
With this methodology, the number of percentiles depends on the broadness of the distributions to be modelled. In this case, eight percentiles were centered on the quadratic mean diameter of the stand. The percentile 50 was fitted better to the Dq, which is why it was used as the driver percentile from which the following system of percentile predictions was generated:
92
AGROCIENCIA, 1 de enero - 15 de febrero, 2014
VOLUMEN 48, NÚMERO 1
Con esta metodología el número de percentiles depende de la amplitud de las distribuciones a modelar. En este caso ocho percentiles fueron centrados en el diámetro cuadrático del rodal. El percentil 50 se ajustó mejor al Dq y se usó como percentil guía desde el cual se generó el siguiente sistema de predicción de percentiles:
p b b Dq b E b Hd50 1 2 31
4= + × + × + ×−
p p b Dq70 50 5= + ×
p p b Dq90 70 6= + ×
p p b Dq100 90 7= + × (9)
p p b Dq30 50 8= + ×
p p b Dq20 30 9= + ×
p p b Dq10 20 10= + ×
p p b Dq0 10 11= + ×
donde pn es el percentil enésimo del rodal, bi son los parámetros a ser estimados, E corresponde a la edad del rodal, Hd es la altura dominante.
La proporción de árboles para cada categoría diamétrica en el rodal se estimó con la siguiente ecuación (Borders et al., 1987):
Pi1 Di Pi
Pj Ds Pj1 (10)
donde Nx es el número de árboles por hectárea en la i-ésima ca-tegoría diamétrica; Di es el límite inferior de la i-ésima categoría diamétrica; Ds es el límite superior de la i-ésima categoría dia-métrica; NA es la densidad del rodal en número de árboles por hectárea, Pi , Pi1, Pj , Pj1 son los percentiles adyacentes en el sistema (Pi Pi1 y Pj Pj1), ti , ti1, tj , tj1 son las proporcio-nes de árboles asociadas a los percentiles adyacentes.
Estimación del número de árboles
La predicción del rendimiento maderable con distribuciones diamétricas requiere estimar el número de árboles sobrevivientes por hectárea en el tiempo, y se usó la siguiente función de mor-talidad (Santiago-García et al., 2013):
NA NA E E2 1 2 10 03378= × − −( ) exp . (11)
donde NA2 es el número de árboles sobrevivientes en E2, NA1 es el número de árboles en E1, E1 y E2 es la edad (años) inicial del rodal y de proyección, respectivamente.
p b b Dq b E b Hd50 1 2 31
4= + × + × + ×−
p p b Dq70 50 5= + ×
p p b Dq90 70 6= + ×
p p b Dq100 90 7= + × (9)
p p b Dq30 50 8= + ×
p p b Dq20 30 9= + ×
p p b Dq10 20 10= + ×
p p b Dq0 10 11= + ×
where pn is the n-th percentile in the stand, bi are the parameters to be estimated, E corresponds to the age of the stand, Hd is the dominant height.
The proportion of trees for each diameter size class in the stand was estimated with the following equation (Borders et al., 1987):
Pi1 Di Pi
Pj Ds Pj1 (10)
where Nx is the number of trees per hectare in the i-th diameter class, Di is the inferior limit of the i-th diameter class, Ds is the upper limit of the i-th diameter class, NA is the stand density in number of trees per hectare, Pi , Pi1, Pj , Pj1 are the adjacent percentiles in the system (Pi Pi1 y Pj Pj1), ti , ti1, tj , tj1 are the proportions of trees associated to the adjacent percentiles.
Estimation of the number of trees
The prediction for timber yield with diameter distributions requires estimating the number of surviving trees per hectare in time, and the following mortality function was used (Santiago-García et al., 2013):
NA NA E E2 1 2 10 03378= × − −( ) exp . (11)
where NA2 is the number of surviving trees in E2, NA1 is the number of trees in E1, E1 and E2 is the initial and projection age (years), respectively, of the stand.
Minimum diameter and quadratic diameter
The minimum diameter (percentile zero “p0”) is a stand state variable that is basic for estimating the diameter distribution with the system based on the Weibull pdf, due to its close relationship
NP D
P Pt t t t t t
D P
P Pxi i
i ii i j i j j
s j
j j=
−
−× −( )+ −( )+ −( )×
−
−
−− +
+11 1
1
NA
NP D
P Pt t t t t t
D P
P Pxi i
i ii i j i j j
s j
j j=
−
−× −( )+ −( )+ −( )×
−
−
−− +
+11 1
1
NA
PREDICCIÓN DEL RENDIMIENTO MADERABLE DE Pinus patula Schl. et Cham. A TRAVÉS DE MODELOS DE DISTRIBUCIÓN DIAMÉTRICA
93SANTIAGO-GARCÍA et al.
Diámetro mínimo y diámetro cuadrático
El diámetro mínimo del rodal (percentil cero “p0”) es una variable de estado básica para estimar distribución diamétrica con el sistema basado en la fdp Weibull debido a su estrecha relación con el parámetro de localización (a). Para ésto se ajustó una ecuación de proyección basada en el modelo de Chapman-Richards (Montero y Fierros, 2000):
DD E E
minmin ln exp /ln exp
2 01
0
1 11 2 1 1= ×
− − ×( )( ) − − ×( )( )(β
β
β β ))
(12)
donde D min2 es el diámetro mínimo del rodal a la edad de pro-yección E2, D min1 es el diámetro mínimo del rodal en la edad inicial E1, i son los parámetros a estimar.
El diámetro cuadrático del rodal es otra variable esencial en la predicción del rendimiento maderable a través de siste-mas implícitos, para lo cual se generó un modelo compatible para predecir y proyectar el crecimiento de dicha variable en el tiempo:
Dq bbE
NA b Hd1 01
11 2 1= + × + ×
exp (13)
Dq Dq b
NAE
NAE
b Hd Hd2 1 12
2
1
12 2 1= × −
+ −( )
exp
(14)
donde Dq1 es el diámetro cuadrático del rodal en la edad inicial E1, Dq2 es el diámetro cuadrático del rodal a la edad de pro-yección E2, Hd1 es la altura dominante en E1, Hd2 es la altura dominante en E2; lo demás ya se definió.
Prueba de bondad de ajuste de la distribución Weibull
Para conocer la bondad de ajuste de la fdp Weibull a las estructuras diamétricas de los rodales se usó la prueba de Kolmogorov-Smirnov (KS), que permite detectar la máxima diferencia entre la distribución muestral (real) y la estimada (teórica), es decir, es válida sólo si los parámetros de la fdp Weibull son conocidos para cada distribución diamétrica (Torres-Rojo et al., 1992). En la prueba de KS se usaron los niveles de significancia 0.05, 0.10 y 0.20 para contrastar el número de parcelas no ajustadas a la fdp Weibull de acuerdo con cada criterio.
with the location parameter (a). For this, a projection equation was fitted, based on the Chapman-Richards model (Montero and Fierros, 2000):
DD E E
minmin ln exp /ln exp
2 01
0
1 11 2 1 1= ×
− − ×( )( ) − − ×( )( )(β
β
β β ))
(12)
where D min2 is the minimum diameter of the stand at the age of projection E2, D min1 is the minimum diameter of the stand at the initial age E1, i are the parameters to be estimated.
The quadratic diameter of the stand is another essential variable in the prediction of timber yield through implicit systems, for which a compatible model was generated to predict and project the growth of that variable in time:
Dq bbE
NA b Hd1 01
11 2 1= + × + ×
exp (13)
Dq Dq b
NAE
NAE
b Hd Hd2 1 12
2
1
12 2 1= × −
+ −( )
exp
(14)
where Dq1 is the quadratic diameter of the stand at the initial age E1, Dq2 is the quadratic diameter of the stand at the age of projection E2, Hd1 is the dominant height in E1, Hd2 is the dominant height in E2; the rest has already been defined.
Goodness of fit test for the Weibull distribution
In order to understand the goodness of fit of the Weibull pdf to the diameter distributions of the stands, the Kolmogorov-Smirnov (KS) test was used, which allows detecting the maximum difference between the sample (real) and the estimated (theoretic) distribution; that is, it is valid only if the parameters of the Weibull pdf are known for each diameter distribution (Torres-Rojo et al., 1992). In the KS test, the levels of significance 0.05, 0.10 and 0.20 were used to compare the number of plots not fitted to the Weibull pdf according to each criterion.
Means comparison test
The predictions of the total volume obtained with the two systems of diameter distributions built were compared with the Tukey test (p0.05), with the null hypothesis of mean equality (Montgomery, 2011).
94
AGROCIENCIA, 1 de enero - 15 de febrero, 2014
VOLUMEN 48, NÚMERO 1
Prueba de comparación de medias
Las predicciones de volumen total obtenidas con los dos sis-temas de distribuciones diamétricas construidos se compararon con la prueba de Tukey (p0.05), con la hipótesis nula de igual-dad de promedios (Montgomery, 2011).
Ajuste de los sistemas
Los parámetros de las ecuaciones que predicen los per-centiles 50 y 90 de la distribución diamétrica del rodal en el sistema implícito basado en la fdp Weibull, y en la ecua-ción que proyecta el diámetro mínimo del rodal, se ajustaron con el método de mínimos cuadrados no lineales. El modelo compatible de crecimiento para el diámetro cuadrático, y el sistema implícito basado en percentiles, fueron ajustados si-multáneamente a través de regresión aparentemente no rela-cionada (SUR), con el procedimiento MODEL de SAS/ETS (SAS Institute Inc., 2008). La técnica de estimación de pará-metros SUR produce estimadores consistentes y eficientes en presencia de correlaciones contemporáneas en un sistema de ecuaciones (Borders et al., 1987; Borders y Patterson, 1990; Galán et al., 2008).
ResultAdos y dIscusIón
Sistema implícito basado en la fdp Weibull
Los resultados de la prueba de KS (Cuadro 1) permitieron conocer la bondad de ajuste de la fdp Weibull a las estructuras diamétricas de los rodales de P. patula estudiados. En la prueba normalmente se emplea 0.05, aunque Pece et al. (2000), García et al. (2002) y Gor-goso et al. (2007) usaron 0.20, dando un mayor nivel de exigencia al contraste. Al respecto, Pece et al. (2000) mencionan que este nivel reduce las desvia-ciones mínimas permitidas para el no rechazo de la concordancia. Considerando el criterio más exigente (0.20), la fdp Weibull se ajustó exitosamente en más del 90 % de los casos a la distribución diamétri-ca observada. Los criterios estadísticos de bondad de ajuste y los parámetros estimados de las ecuaciones que predicen percentiles de la distribución diamétri-ca de los rodales de P. patula, se presentan en los Cua-dros 2 y 3, respectivamente. Los parámetros de la fdp Weibull son dependientes de las variables de estado: diámetro mínimo y diámetro cuadrático del rodal; por tanto, al proyectarse dichas variables en el tiempo
Systems fitting
The parameters for the equations that predict the percentiles 50th and 90th of the diameter distribution of the stand in the implicit system based on the Weibull pdf, and on the equation that projects the minimum diameter of the stand, were fitted with the non-linear least squares method. The compatible growth model for the quadratic diameter, and the implicit system based on percentiles, were fitted simultaneously through seemingly unrelated regressions (SUR), with the MODEL procedure from SAS/ETS (SAS Institute Inc., 2008). The technique for estimating SUR parameters produces consistent and efficient estimators in the presence of contemporaneous correlations in an equation system (Borders et al., 1987; Borders and Patterson, 1990; Galán et al., 2008).
Results And dIscussIon
Implicit system based on the Weibull pdf
The results from the KS test (Table 1) allowed understanding the goodness of fit of the Weibull pdf to the diameter structures of the P. patula stands studied. In the test, 0.05 is normally used, although Pece et al. (2000), García et al. (2002) and Gorgoso et al. (2007) used 0.20, giving a higher level of thoroughness to the comparison. In this regard, Pece et al. (2000) mentioned that this level reduces the minimum deviations allowed for the non-rejection of concordance. Considering the most thorough criterion (0.20), the Weibull pdf was successfully fitted in more than 90 % of the cases to the diameter distribution observed. The statistical criteria of goodness of fit and the parameters estimated from the equations that predict percentiles of the diameter
Cuadro 1. Parcelas rechazadas por su falta de ajuste a la fdp Weibull.
Table 1. Plots rejected from their lack of adjustment to the Weibull pdf.
Número de distribuciones
rechazadasProporción †
(%)
0.05 2 1.580.10 5 3.960.20 10 7.93
† Proporción calculada a partir de 126 distribuciones diamétricas v Proportion calculated from 126 diameter distributions.
PREDICCIÓN DEL RENDIMIENTO MADERABLE DE Pinus patula Schl. et Cham. A TRAVÉS DE MODELOS DE DISTRIBUCIÓN DIAMÉTRICA
95SANTIAGO-GARCÍA et al.
se “recupera” o conoce el valor de estos parámetros a una edad de interés. La eficiencia de los percentiles 50 y 90 de la dis-tribución diamétrica del rodal reflejada en su bondad de ajuste, se consideró como un factor para su selec-ción en el cálculo del parámetro de forma (c) de la fdp Weibull. La elección de los percentiles depende de la muestra, por lo que una pareja de percentiles al estar más centrada ayuda a reducir el sesgo en la predicción. Pienaar y Rheney (1993) y Montero y
distribution of the P. patula stands are presented in Tables 2 and 3, respectively. The parameters of the Weibull pdf are dependent on the stand state variables: minimum diameter, and quadratic diameter of the stand; therefore, when those variables are projected in time, the value of those parameters are “recovered” or known for an age of interest. The efficiency of percentiles 50th and 90th of the stand’s diameter distribution reflected in its goodness of fit was considered as a factor for their selection in the calculation of the shape parameter (c) of the Weibull pdf. The choice of the percentiles depends on the sample, which is why a couple of percentiles that is more centered helps reduce the bias in the prediction. Pienaar and Rheney (1993) and Montero and Fierros (2000) used percentiles 24th and 93rd to calculate parameter c, while García et al. (2002) point out that with the couple of percentiles 40th and 82nd, rather effective fittings can be obtained. The prediction for timber yield through the Weibull pdf implies determining the frequencies of trees per diameter class (Figure 1).
Implicit system based on percentiles
To obtain the implicit system based on percentiles, the best fitting to Dq was with percentile 50, so it was used as the driver percentile from which the percentile prediction system was generated. The
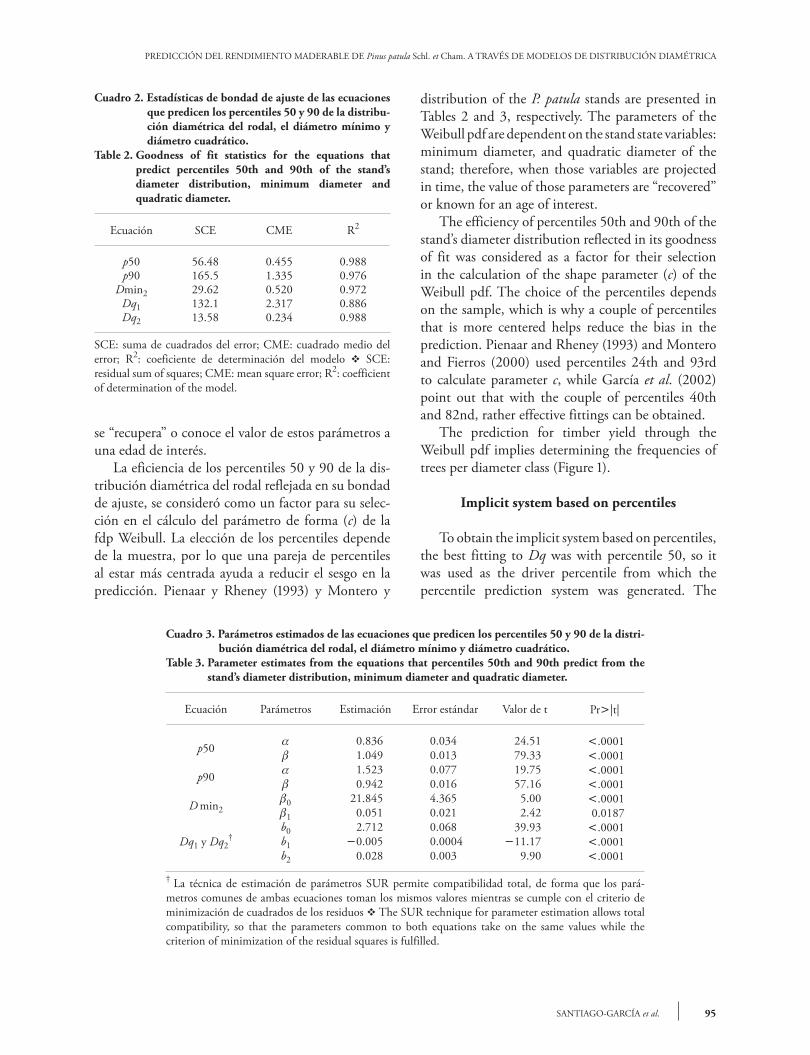
Cuadro 2. Estadísticas de bondad de ajuste de las ecuaciones que predicen los percentiles 50 y 90 de la distribu-ción diamétrica del rodal, el diámetro mínimo y diámetro cuadrático.
Table 2. Goodness of fit statistics for the equations that predict percentiles 50th and 90th of the stand’s diameter distribution, minimum diameter and quadratic diameter.
Ecuación SCE CME R2
p50 56.48 0.455 0.988p90 165.5 1.335 0.976
Dmin2 29.62 0.520 0.972Dq1 132.1 2.317 0.886Dq2 13.58 0.234 0.988
SCE: suma de cuadrados del error; CME: cuadrado medio del error; R2: coeficiente de determinación del modelo v SCE: residual sum of squares; CME: mean square error; R2: coefficient of determination of the model.
Cuadro 3. Parámetros estimados de las ecuaciones que predicen los percentiles 50 y 90 de la distri-bución diamétrica del rodal, el diámetro mínimo y diámetro cuadrático.
Table 3. Parameter estimates from the equations that percentiles 50th and 90th predict from the stand’s diameter distribution, minimum diameter and quadratic diameter.
Ecuación Parámetros Estimación Error estándar Valor de t Pr|t|
p50
0.8361.049
0.0340.013
24.5179.33
.0001.0001
p90
1.5230.942
0.0770.016
19.7557.16
.0001.0001
D min201
21.8450.051
4.3650.021
5.002.42
.00010.0187
Dq1 y Dq2†
b0b1b2
2.7120.005
0.028
0.0680.00040.003
39.9311.17
9.90
.0001.0001.0001
† La técnica de estimación de parámetros SUR permite compatibilidad total, de forma que los pará-metros comunes de ambas ecuaciones toman los mismos valores mientras se cumple con el criterio de minimización de cuadrados de los residuos v The SUR technique for parameter estimation allows total compatibility, so that the parameters common to both equations take on the same values while the criterion of minimization of the residual squares is fulfilled.
96
AGROCIENCIA, 1 de enero - 15 de febrero, 2014
VOLUMEN 48, NÚMERO 1
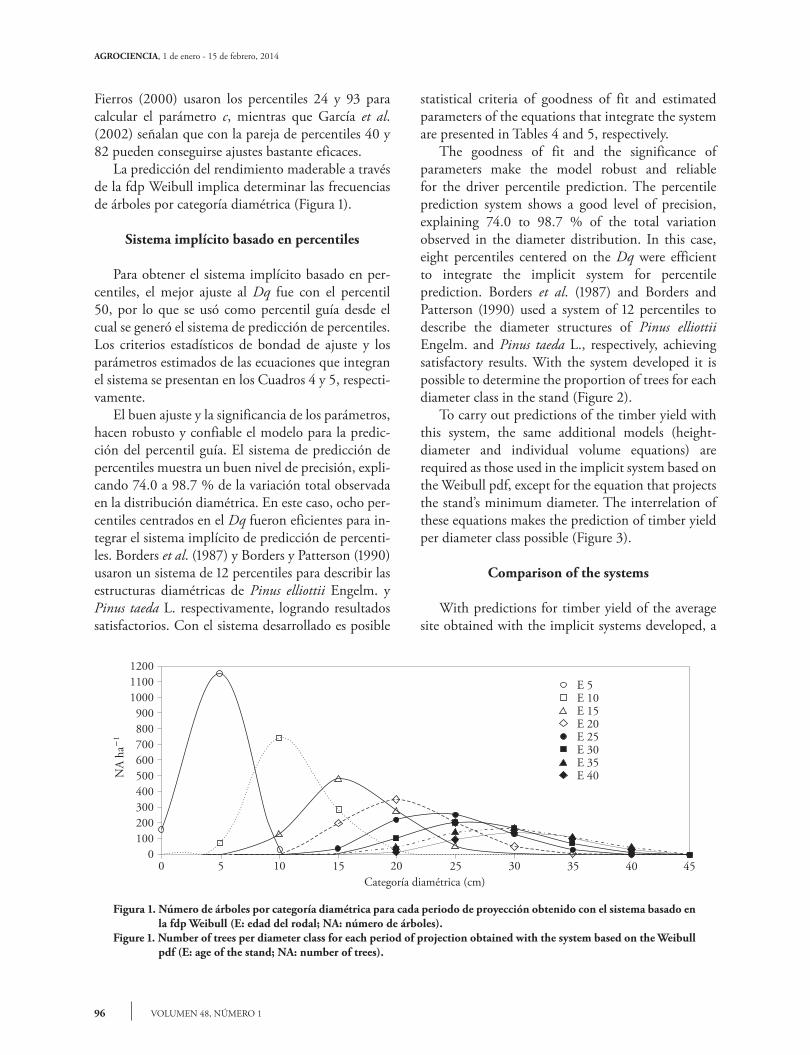
Fierros (2000) usaron los percentiles 24 y 93 para calcular el parámetro c, mientras que García et al. (2002) señalan que con la pareja de percentiles 40 y 82 pueden conseguirse ajustes bastante eficaces. La predicción del rendimiento maderable a través de la fdp Weibull implica determinar las frecuencias de árboles por categoría diamétrica (Figura 1).
Sistema implícito basado en percentiles
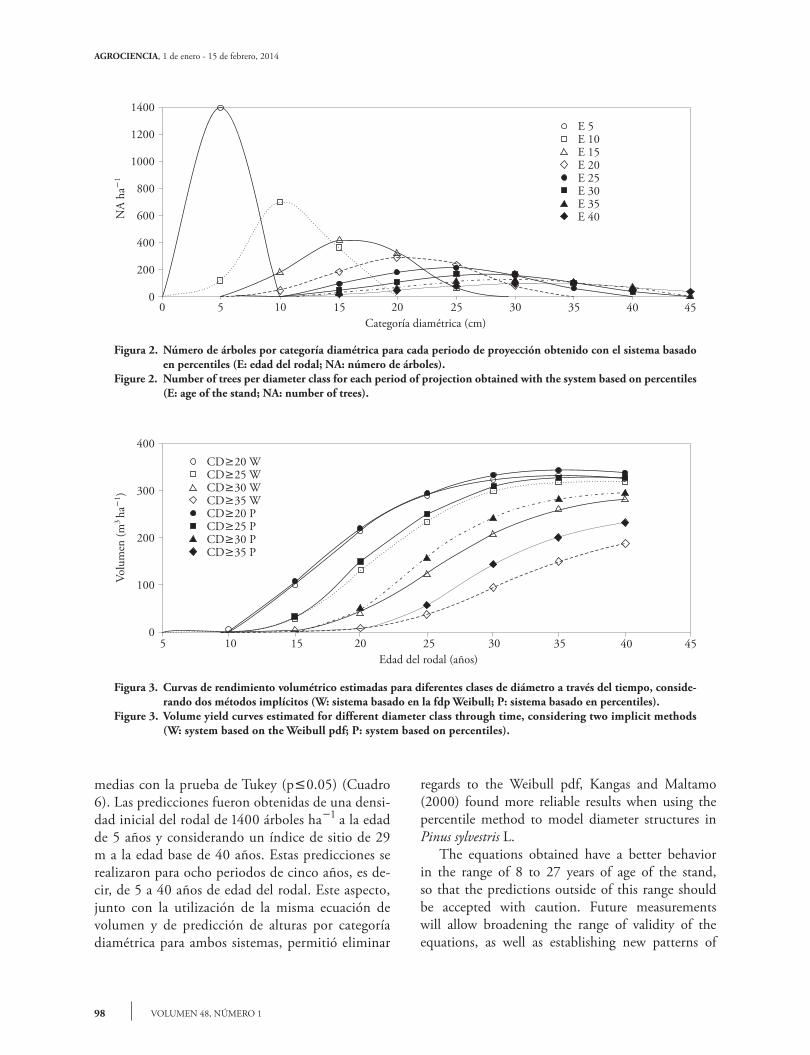
Para obtener el sistema implícito basado en per-centiles, el mejor ajuste al Dq fue con el percentil 50, por lo que se usó como percentil guía desde el cual se generó el sistema de predicción de percentiles. Los criterios estadísticos de bondad de ajuste y los parámetros estimados de las ecuaciones que integran el sistema se presentan en los Cuadros 4 y 5, respecti-vamente. El buen ajuste y la significancia de los parámetros, hacen robusto y confiable el modelo para la predic-ción del percentil guía. El sistema de predicción de percentiles muestra un buen nivel de precisión, expli-cando 74.0 a 98.7 % de la variación total observada en la distribución diamétrica. En este caso, ocho per-centiles centrados en el Dq fueron eficientes para in-tegrar el sistema implícito de predicción de percenti-les. Borders et al. (1987) y Borders y Patterson (1990) usaron un sistema de 12 percentiles para describir las estructuras diamétricas de Pinus elliottii Engelm. y Pinus taeda L. respectivamente, logrando resultados satisfactorios. Con el sistema desarrollado es posible
statistical criteria of goodness of fit and estimated parameters of the equations that integrate the system are presented in Tables 4 and 5, respectively. The goodness of fit and the significance of parameters make the model robust and reliable for the driver percentile prediction. The percentile prediction system shows a good level of precision, explaining 74.0 to 98.7 % of the total variation observed in the diameter distribution. In this case, eight percentiles centered on the Dq were efficient to integrate the implicit system for percentile prediction. Borders et al. (1987) and Borders and Patterson (1990) used a system of 12 percentiles to describe the diameter structures of Pinus elliottii Engelm. and Pinus taeda L., respectively, achieving satisfactory results. With the system developed it is possible to determine the proportion of trees for each diameter class in the stand (Figure 2). To carry out predictions of the timber yield with this system, the same additional models (height-diameter and individual volume equations) are required as those used in the implicit system based on the Weibull pdf, except for the equation that projects the stand’s minimum diameter. The interrelation of these equations makes the prediction of timber yield per diameter class possible (Figure 3).
Comparison of the systems
With predictions for timber yield of the average site obtained with the implicit systems developed, a
Figura 1. Número de árboles por categoría diamétrica para cada periodo de proyección obtenido con el sistema basado en la fdp Weibull (E: edad del rodal; NA: número de árboles).
Figure 1. Number of trees per diameter class for each period of projection obtained with the system based on the Weibull pdf (E: age of the stand; NA: number of trees).
PREDICCIÓN DEL RENDIMIENTO MADERABLE DE Pinus patula Schl. et Cham. A TRAVÉS DE MODELOS DE DISTRIBUCIÓN DIAMÉTRICA
97SANTIAGO-GARCÍA et al.
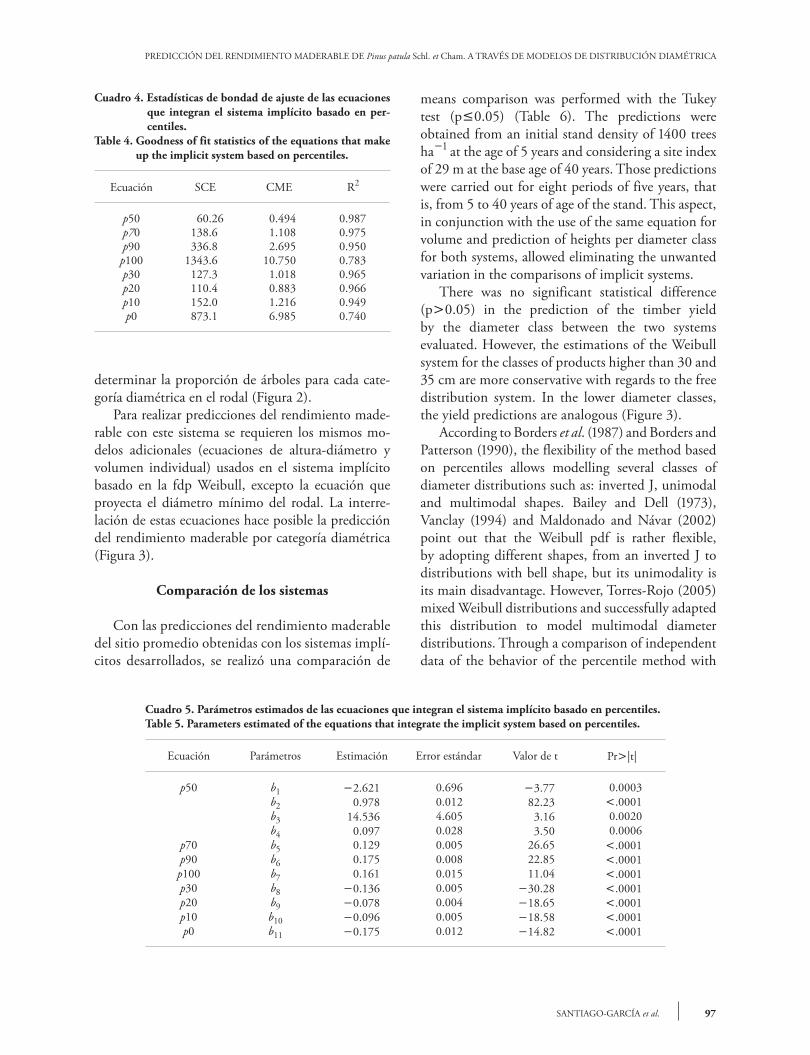
Cuadro 4. Estadísticas de bondad de ajuste de las ecuaciones que integran el sistema implícito basado en per-centiles.
Table 4. Goodness of fit statistics of the equations that make up the implicit system based on percentiles.
Ecuación SCE CME R2
p50 60.26 0.494 0.987p70 138.6 1.108 0.975p90 336.8 2.695 0.950p100 1343.6 10.750 0.783p30 127.3 1.018 0.965p20 110.4 0.883 0.966p10 152.0 1.216 0.949p0 873.1 6.985 0.740
Cuadro 5. Parámetros estimados de las ecuaciones que integran el sistema implícito basado en percentiles.Table 5. Parameters estimated of the equations that integrate the implicit system based on percentiles.
Ecuación Parámetros Estimación Error estándar Valor de t Pr|t|
p50 b1b2b3b4
2.6210.978
14.5360.097
0.6960.0124.6050.028
3.7782.233.163.50
0.0003.00010.00200.0006
p70 b5 0.129 0.005 26.65 .0001p90 b6 0.175 0.008 22.85 .0001p100 b7 0.161 0.015 11.04 .0001p30 b8 0.136 0.005 30.28 .0001p20 b9 0.078 0.004 18.65 .0001p10 b10 0.096 0.005 18.58 .0001p0 b11 0.175 0.012 14.82 .0001
determinar la proporción de árboles para cada cate-goría diamétrica en el rodal (Figura 2). Para realizar predicciones del rendimiento made-rable con este sistema se requieren los mismos mo-delos adicionales (ecuaciones de altura-diámetro y volumen individual) usados en el sistema implícito basado en la fdp Weibull, excepto la ecuación que proyecta el diámetro mínimo del rodal. La interre-lación de estas ecuaciones hace posible la predicción del rendimiento maderable por categoría diamétrica (Figura 3).
Comparación de los sistemas
Con las predicciones del rendimiento maderable del sitio promedio obtenidas con los sistemas implí-citos desarrollados, se realizó una comparación de
means comparison was performed with the Tukey test (p0.05) (Table 6). The predictions were obtained from an initial stand density of 1400 trees ha1 at the age of 5 years and considering a site index of 29 m at the base age of 40 years. Those predictions were carried out for eight periods of five years, that is, from 5 to 40 years of age of the stand. This aspect, in conjunction with the use of the same equation for volume and prediction of heights per diameter class for both systems, allowed eliminating the unwanted variation in the comparisons of implicit systems. There was no significant statistical difference (p0.05) in the prediction of the timber yield by the diameter class between the two systems evaluated. However, the estimations of the Weibull system for the classes of products higher than 30 and 35 cm are more conservative with regards to the free distribution system. In the lower diameter classes, the yield predictions are analogous (Figure 3). According to Borders et al. (1987) and Borders and Patterson (1990), the flexibility of the method based on percentiles allows modelling several classes of diameter distributions such as: inverted J, unimodal and multimodal shapes. Bailey and Dell (1973), Vanclay (1994) and Maldonado and Návar (2002) point out that the Weibull pdf is rather flexible, by adopting different shapes, from an inverted J to distributions with bell shape, but its unimodality is its main disadvantage. However, Torres-Rojo (2005) mixed Weibull distributions and successfully adapted this distribution to model multimodal diameter distributions. Through a comparison of independent data of the behavior of the percentile method with
98
AGROCIENCIA, 1 de enero - 15 de febrero, 2014
VOLUMEN 48, NÚMERO 1
Figura 2. Número de árboles por categoría diamétrica para cada periodo de proyección obtenido con el sistema basado en percentiles (E: edad del rodal; NA: número de árboles).
Figure 2. Number of trees per diameter class for each period of projection obtained with the system based on percentiles (E: age of the stand; NA: number of trees).
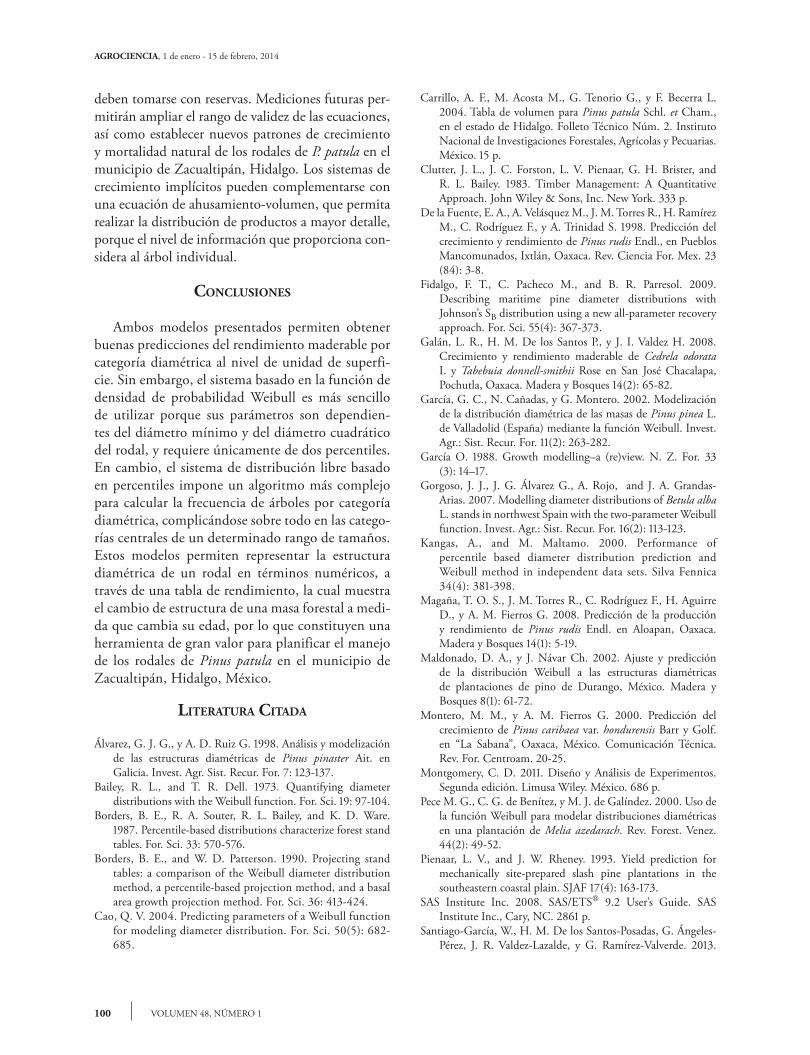
Figura 3. Curvas de rendimiento volumétrico estimadas para diferentes clases de diámetro a través del tiempo, conside-rando dos métodos implícitos (W: sistema basado en la fdp Weibull; P: sistema basado en percentiles).
Figure 3. Volume yield curves estimated for different diameter class through time, considering two implicit methods (W: system based on the Weibull pdf; P: system based on percentiles).
medias con la prueba de Tukey (p0.05) (Cuadro 6). Las predicciones fueron obtenidas de una densi-dad inicial del rodal de 1400 árboles ha1 a la edad de 5 años y considerando un índice de sitio de 29 m a la edad base de 40 años. Estas predicciones se realizaron para ocho periodos de cinco años, es de-cir, de 5 a 40 años de edad del rodal. Este aspecto, junto con la utilización de la misma ecuación de volumen y de predicción de alturas por categoría diamétrica para ambos sistemas, permitió eliminar
regards to the Weibull pdf, Kangas and Maltamo (2000) found more reliable results when using the percentile method to model diameter structures in Pinus sylvestris L. The equations obtained have a better behavior in the range of 8 to 27 years of age of the stand, so that the predictions outside of this range should be accepted with caution. Future measurements will allow broadening the range of validity of the equations, as well as establishing new patterns of

PREDICCIÓN DEL RENDIMIENTO MADERABLE DE Pinus patula Schl. et Cham. A TRAVÉS DE MODELOS DE DISTRIBUCIÓN DIAMÉTRICA
99SANTIAGO-GARCÍA et al.
Cuadro 6. Resultados de la prueba de comparación de medias de Tukey, para el volumen total predicho por los sistemas implícitos.
Table 6. Results from the Tukey means comparison test, for the total volume predicted by the implicit systems.
Fuente de variación Grados de libertad Valor de F Pr > F
S¶ 1 0.08 0.776Edad 1 106.48 0.001
Agrupamiento Tukey† Media (m3 ha1) N S¶
a 224.32 8 0a 217.77 8 1
†Medias no son significativamente diferentes (Tukey; p0.05). ¶Indica dos niveles de clase, 1 para el sistema Weibull, 0 para el sistema de percentiles v †Means are not significantly different (Tukey; p0.05). ¶Indicates two levels of class, 1 for the Weibull system, 0 for the percentile system.
variación no deseada en las comparaciones de los sistemas implícitos. No hubo diferencia estadística significativa (p0.05) en la predicción del rendimiento made-rable por categoría diamétrica entre los dos sistemas evaluados. Sin embargo, las estimaciones del sistema Weibull para las clases de productos mayores a 30 y 35 cm son más conservadoras respecto al sistema de distribución libre. En las categorías diamétricas infe-riores, los pronósticos de rendimiento son análogos (Figura 3). De acuerdo con Borders et al. (1987) y Borders y Patterson (1990), la flexibilidad del método basado en percentiles permite modelar varias clases de dis-tribuciones diamétricas como: J invertida, unimodal y multimodal. Bailey y Dell (1973), Vanclay (1994) y Maldonado y Návar (2002), mencionan que la fdp Weibull es bastante flexible, al adoptar diferentes formas, desde una J invertida hasta distribuciones en forma de campana, pero su unimodalidad es la des-ventaja principal. No obstante, Torres-Rojo (2005) mezcló distribuciones Weibull y adaptó con éxito esta distribución para modelar distribuciones diamétricas multimodales. Mediante una comparación en datos independientes del comportamiento del método de percentiles con respecto a la fdp Weibull, Kangas y Maltamo (2000) encontraron resultados más fiables al usar el método de percentiles para modelar estruc-turas diamétricas en Pinus sylvestris L. Las ecuaciones obtenidas tienen su mejor com-portamiento en el rango de 8 a 27 años de edad del rodal, por lo que pronósticos fuera de este rango
natural growth and mortality of the P. patula stands in the municipality of Zacualtipán, Hidalgo. The implicit growth systems can be complemented with an equation of taper-volume, which would allow carrying out the distribution of products in greater detail, because the level of information that it provides considers the individual tree.
conclusIons
Both models presented allow obtaining good predictions of the timber yield per diameter class at the hectare level. However, the system based on the Weibull probability density function is easier to use because its parameters are dependent on the stand’s minimum diameter and quadratic diameter, and it requires only two percentiles. Instead, the free distribution system based on percentiles imposes a more complex algorithm for the calculation of the frequency of trees per diameter class, becoming complicated mostly in the central classes of a specific range of sizes. These models allow representing the diameter structure of a stand in numerical terms, through a yield table, which shows the change in structure of a forest stand as it changes in age, therefore constituting a tool of great value to plan the management of Pinus patula stands in the municipality of Zacualtipán, Hidalgo, Mexico.
—End of the English version—
pppvPPP
100
AGROCIENCIA, 1 de enero - 15 de febrero, 2014
VOLUMEN 48, NÚMERO 1
deben tomarse con reservas. Mediciones futuras per-mitirán ampliar el rango de validez de las ecuaciones, así como establecer nuevos patrones de crecimiento y mortalidad natural de los rodales de P. patula en el municipio de Zacualtipán, Hidalgo. Los sistemas de crecimiento implícitos pueden complementarse con una ecuación de ahusamiento-volumen, que permita realizar la distribución de productos a mayor detalle, porque el nivel de información que proporciona con-sidera al árbol individual.
conclusIones
Ambos modelos presentados permiten obtener buenas predicciones del rendimiento maderable por categoría diamétrica al nivel de unidad de superfi-cie. Sin embargo, el sistema basado en la función de densidad de probabilidad Weibull es más sencillo de utilizar porque sus parámetros son dependien-tes del diámetro mínimo y del diámetro cuadrático del rodal, y requiere únicamente de dos percentiles. En cambio, el sistema de distribución libre basado en percentiles impone un algoritmo más complejo para calcular la frecuencia de árboles por categoría diamétrica, complicándose sobre todo en las catego-rías centrales de un determinado rango de tamaños. Estos modelos permiten representar la estructura diamétrica de un rodal en términos numéricos, a través de una tabla de rendimiento, la cual muestra el cambio de estructura de una masa forestal a medi-da que cambia su edad, por lo que constituyen una herramienta de gran valor para planificar el manejo de los rodales de Pinus patula en el municipio de Zacualtipán, Hidalgo, México.
lIteRAtuRA cItAdA
Álvarez, G. J. G., y A. D. Ruiz G. 1998. Análisis y modelización de las estructuras diamétricas de Pinus pinaster Ait. en Galicia. Invest. Agr. Sist. Recur. For. 7: 123-137.
Bailey, R. L., and T. R. Dell. 1973. Quantifying diameter distributions with the Weibull function. For. Sci. 19: 97-104.
Borders, B. E., R. A. Souter, R. L. Bailey, and K. D. Ware. 1987. Percentile-based distributions characterize forest stand tables. For. Sci. 33: 570-576.
Borders, B. E., and W. D. Patterson. 1990. Projecting stand tables: a comparison of the Weibull diameter distribution method, a percentile-based projection method, and a basal area growth projection method. For. Sci. 36: 413-424.
Cao, Q. V. 2004. Predicting parameters of a Weibull function for modeling diameter distribution. For. Sci. 50(5): 682-685.
Carrillo, A. F., M. Acosta M., G. Tenorio G., y F. Becerra L. 2004. Tabla de volumen para Pinus patula Schl. et Cham., en el estado de Hidalgo. Folleto Técnico Núm. 2. Instituto Nacional de Investigaciones Forestales, Agrícolas y Pecuarias. México. 15 p.
Clutter, J. L., J. C. Forston, L. V. Pienaar, G. H. Brister, and R. L. Bailey. 1983. Timber Management: A Quantitative Approach. John Wiley & Sons, Inc. New York. 333 p.
De la Fuente, E. A., A. Velásquez M., J. M. Torres R., H. Ramírez M., C. Rodríguez F., y A. Trinidad S. 1998. Predicción del crecimiento y rendimiento de Pinus rudis Endl., en Pueblos Mancomunados, Ixtlán, Oaxaca. Rev. Ciencia For. Mex. 23 (84): 3-8.
Fidalgo, F. T., C. Pacheco M., and B. R. Parresol. 2009. Describing maritime pine diameter distributions with Johnson’s SB distribution using a new all-parameter recovery approach. For. Sci. 55(4): 367-373.
Galán, L. R., H. M. De los Santos P., y J. I. Valdez H. 2008. Crecimiento y rendimiento maderable de Cedrela odorata I. y Tabebuia donnell-smithii Rose en San José Chacalapa, Pochutla, Oaxaca. Madera y Bosques 14(2): 65-82.
García, G. C., N. Cañadas, y G. Montero. 2002. Modelización de la distribución diamétrica de las masas de Pinus pinea L. de Valladolid (España) mediante la función Weibull. Invest. Agr.: Sist. Recur. For. 11(2): 263-282.
García O. 1988. Growth modelling–a (re)view. N. Z. For. 33 (3): 14–17.
Gorgoso, J. J., J. G. Álvarez G., A. Rojo, and J. A. Grandas-Arias. 2007. Modelling diameter distributions of Betula alba L. stands in northwest Spain with the two-parameter Weibull function. Invest. Agr.: Sist. Recur. For. 16(2): 113-123.
Kangas, A., and M. Maltamo. 2000. Performance of percentile based diameter distribution prediction and Weibull method in independent data sets. Silva Fennica 34(4): 381-398.
Magaña, T. O. S., J. M. Torres R., C. Rodríguez F., H. Aguirre D., y A. M. Fierros G. 2008. Predicción de la producción y rendimiento de Pinus rudis Endl. en Aloapan, Oaxaca. Madera y Bosques 14(1): 5-19.
Maldonado, D. A., y J. Návar Ch. 2002. Ajuste y predicción de la distribución Weibull a las estructuras diamétricas de plantaciones de pino de Durango, México. Madera y Bosques 8(1): 61-72.
Montero, M. M., y A. M. Fierros G. 2000. Predicción del crecimiento de Pinus caribaea var. hondurensis Barr y Golf. en “La Sabana”, Oaxaca, México. Comunicación Técnica. Rev. For. Centroam. 20-25.
Montgomery, C. D. 2011. Diseño y Análisis de Experimentos. Segunda edición. Limusa Wiley. México. 686 p.
Pece M. G., C. G. de Benítez, y M. J. de Galíndez. 2000. Uso de la función Weibull para modelar distribuciones diamétricas en una plantación de Melia azedarach. Rev. Forest. Venez. 44(2): 49-52.
Pienaar, L. V., and J. W. Rheney. 1993. Yield prediction for mechanically site-prepared slash pine plantations in the southeastern coastal plain. SJAF 17(4): 163-173.
SAS Institute Inc. 2008. SAS/ETS 9.2 User’s Guide. SAS Institute Inc., Cary, NC. 2861 p.
Santiago-García, W., H. M. De los Santos-Posadas, G. Ángeles-Pérez, J. R. Valdez-Lazalde, y G. Ramírez-Valverde. 2013.
PREDICCIÓN DEL RENDIMIENTO MADERABLE DE Pinus patula Schl. et Cham. A TRAVÉS DE MODELOS DE DISTRIBUCIÓN DIAMÉTRICA
101SANTIAGO-GARCÍA et al.
Sistema compatible de crecimiento y rendimiento para rodales coetáneos de Pinus patula. Rev. Fitotec. Mex. 36(2): 163-172.
Torres-Rojo, J. M., M. Acosta M., y O. S. Magaña T. 1992. Métodos para estimar los parámetros de la función Weibull y su potencial para ser predichos a través de atributos del rodal. Agrociencia Serie Recursos Naturales Renovables 2: 57-76.
Torres-Rojo, J. M. 2005. Predicción de distribuciones diamétricas multimodales a través de mezclas de distribuciones Weibull. Agrociencia 39: 211-220.
Vanclay, J. K. 1994. Modelling Forest Growth and Yield: Applications to Mixed Tropical Forests. CAB International. Denmark. 312 p.
Weibull, W. 1951. A statistical distribution function of wide applicability. J. Appl. Mech. 18: 293-297.