
PowerPoint Presentation · 2018. 7. 10. · Title: PowerPoint Presentation Author: Raghav Tomar...
44
Gujarat Narmada Valley Fertilizers & Chemicals Limited CIN : L24110GJ1976PLC002903 PO. Narmadanagar - 392 015, Dist. Bharuch, Gujarat. India Ph (02642) 247001,247002 Website www.gnfc.in FAX : 02642 - 247084 E-Mail: [email protected] The Manager Listing Department National Stock Exchange of India Ltd. Exchange Plaza, C-1, Block - "G", Bandra-Kurla Complex, Bandra (E) Mumbai - 400 051 Co. Code: NSE- "GNFC EQ" Sub: Submission of Presentation made to Analysts/Investors Meet - FY 2018 Dear Sir, In furtherance to our letter dated 30th June 2018, please find enclosed herewith a copy of the Presentation made to Analysts/Investors Meet held on Monday, July 9, 2018 at Mumbai. A copy of the same is also uploaded on the Company's website www.gnfc.in This presentation is being submitted in compliance with Regulation 30(6) of the SEBI (Listing Obligations and Disclosure Requirements) Regulations, 2015. We request you to kindly take note of the above. Thanking you, Your/fe faithfully, For GUJARAT NARMADA VALLEY FERTILIZERS & CHEMICALS LTD \ \ EQARAd & P O .EC/BD/
Transcript of PowerPoint Presentation · 2018. 7. 10. · Title: PowerPoint Presentation Author: Raghav Tomar...

Investors’ Meet Presentation9 July 2018
1

About GNFC
Gujarat Narmada Valley Fertilizers &
Chemicals Limited (GNFC) est. 1976, is
a Government of Gujarat promoted
company, listed on BSE & NSE
Headquarters- Bharuch, Gujarat
Revenue Contribution- 70% Chemicals
and around 30% fertilizers
Business Segments – Chemicals &
Fertilizers
2

Urea Ammonium Nitro-Phosphate(Complex Fertilizer)
Business Segments - Fertilizers
637
142
Installed Capacity in Thousand MT’s
118%
151%
Utilization % in 2017-18
3

Weak NitricAcid
(2 plants)
ConcentratedNitric Acid(3 plants)
AmmoniumNitrate (AN)
Melt
Acetic acid Formic acid Toluene Di-Isocyanate(2 plants)
Aniline Methanol Ethyl acetate
Business Segments - Chemicals
121%
106%
150%
156%
220%93%
119%
68%
125%
Utilization % in 2017-18
Installed Capacity in Thousand MT’s347
116
53
100
10
6435
269
50
4

Strengths
Strong technical team with deep
experience and innovative culture
Robust manufacturing technologies;
absorbed and adopted from
technology experts worldwide
Record capacity utilization in all
plants, through indigenously
innovative maintenance
measures
Consistent profit from first
year of operation
PAN India distribution network
with reliable dealers
Multi-product basket which helps to increase turnover &
sustain profitability even in adverse conditions
5

Uniqueness
Never lost a single man-day on account of labourdiscord
Largest producer of Neem oil in the world. Only company to develop niche segment ofNeem-based FMCG products
Largest producer of Formic Acid in India. One of the top producers of Aniline, AN Melt, WNA & CNA
India’s only manufacturer ofGlacial Acetic acid through the cutting-edge Methanol Carbonylation route
Absorbed state-of-the art complex technologies from leading technology providers across the globe.
Only manufacturer of Toluene Di-isocyanate (TDI) in South East Asia & Indian Sub Continent
6
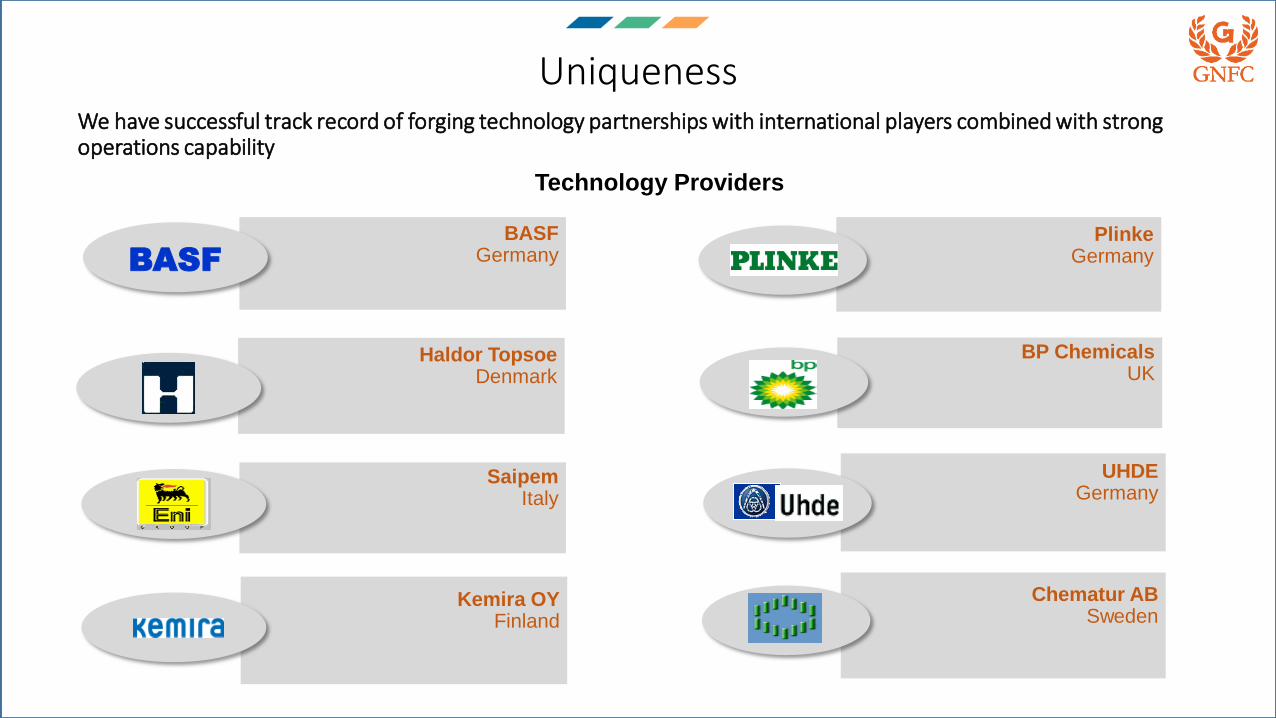
Uniqueness
BASFGermany
For Ammonium Nitro phosphate
Haldor Topsoe Denmark
For Ammonia
SaipemItaly
For Urea
Kemira OYFinland
For Formic Acid
BASFPlinke
Germany
For Concentrated-Nitric Acid
BP ChemicalsUK
For Acetic Acid
UHDEGermany
For Weak Nitric Acid
Chematur ABSweden
For Toluene Di-isocynate
Technology Providers
We have successful track record of forging technology partnerships with international players combined with strong operations capability
7

GNFC in Everyday Life
Lets talk about Chemicals…..
There is some GNFC in your everyday life…..
24*7
Adhesives
Furniture Mattress
Clothes
Medicines
Perfumes
8

Toluene Di-IsocyanateMajor Brands Using TDI from GNFC
GNFC65%
IMPORT35%
Market Share of TDI in India
TECHNOLOGY PROVIDER
9

AnilineMajor Brands Using Aniline from GNFC
IMPORT40%
GNFC60%
Market Share of Aniline in India
TECHNOLOGY PROVIDER
10
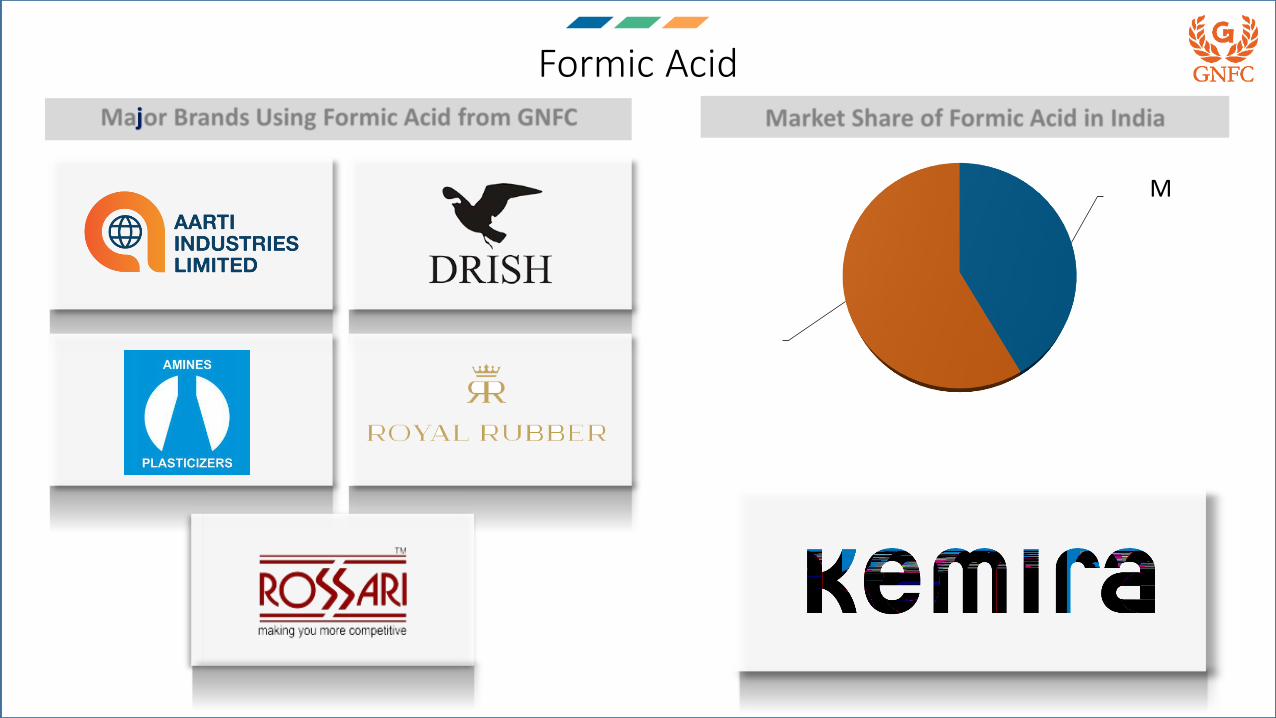
Formic AcidMajor Brands Using Formic Acid from GNFC
IMPORT42%
GNFC58%
Market Share of Formic Acid in India
TECHNOLOGY PROVIDER
11
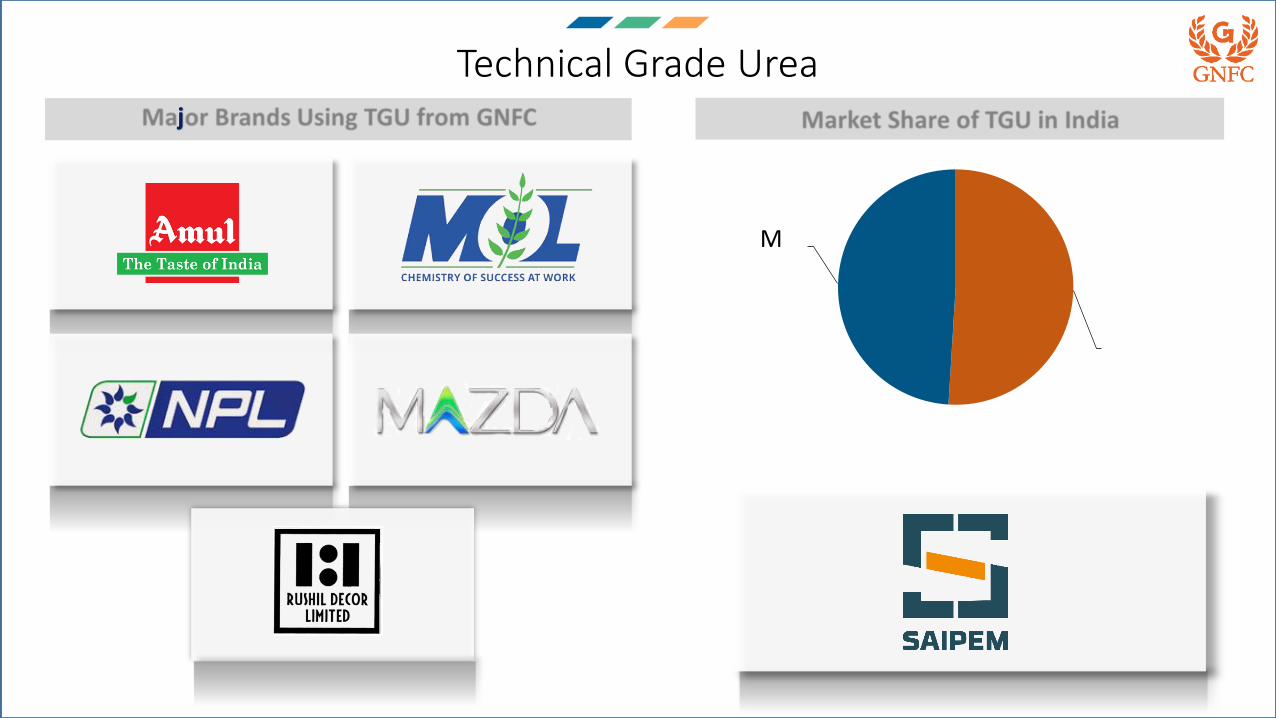
Technical Grade UreaMajor Brands Using TGU from GNFC
GNFC51%
IMPORT49%
Market Share of TGU in India
TECHNOLOGY PROVIDER
12

Acetic AcidMajor Brands Using Acetic Acid from GNFC
IMPORT84%
GNFC16%
Market Share of Acetic Acid in India
TECHNOLOGY PROVIDER
&
13

Ethyl AcetateMajor Brands Using Ethyl Acetate from GNFC
Jubiliant , 26%,
Somaiya/ Godavari,
17%, Laxmi Organics, 14%,
GNFC, 20%,
IOLCP, 7%,
Pentokey Organy (Goda), 5%,
JR Argo, 5%, Ashok Alco Chem, 3%,
Dhampur, 2%,
Others, 1%,
Market Share of Ethyl Acetate in India
TECHNOLOGY PROVIDER
14
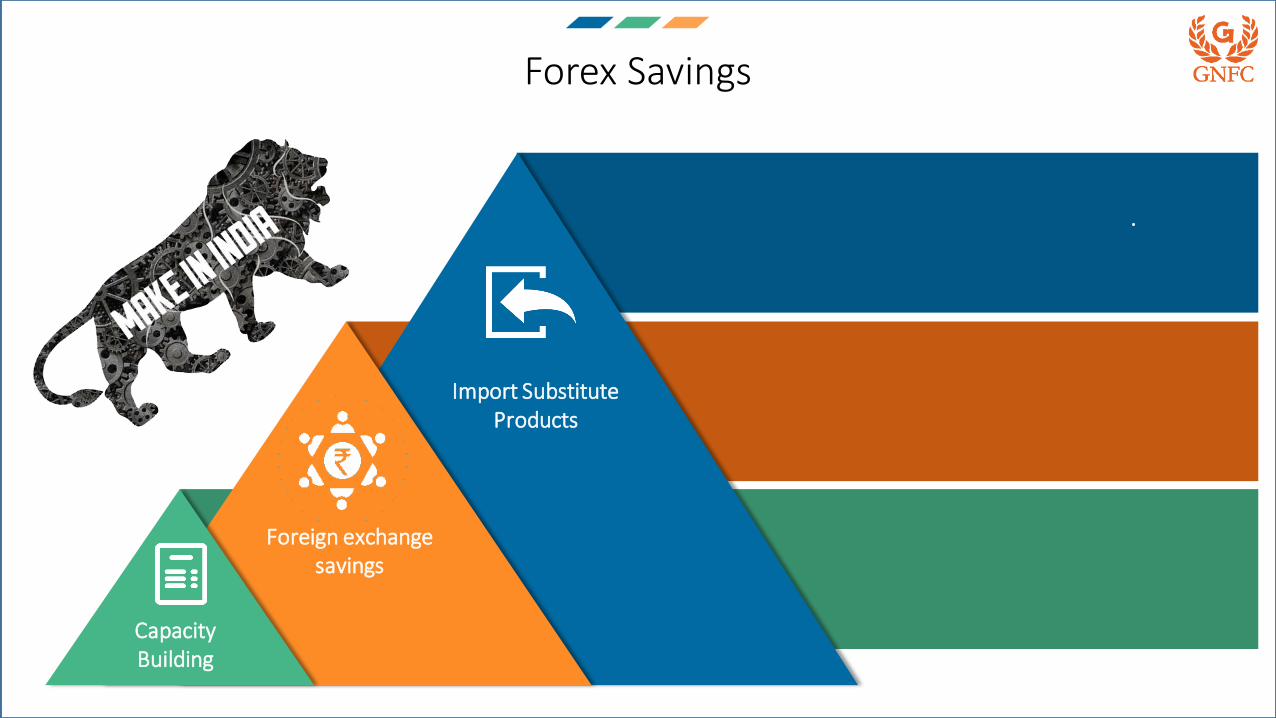
Forex Savings
Capacity Building
Import Substitute Products
Foreign exchange savings
GNFC is involved in the manufacturing of key chemicalswhich are otherwise largely imported by India. Thus,GNFC has been contributing significantly to HonorablePM’s vision of Make in India
Capacity expansion in Di-calciumPhosphate, Acetic Acid, ConcentratedNitric Acid and Formic Acid will furtheradd to forex savings
In 2017,18:Sales of Industrial Products = 11.12 lakh MTsSales of Fertilizers = 9.58 lakh MTSResultant Forex Savings = $1 Billion
15

Export to 67 Countries Worldwide

Marketing & Distribution Network
Bhopal
Indore
Pune
Jaipur Lucknow
Jalgaon
Udaipur Amethi
Mumbai
New Delhi
Bharuch
Dahej Surat
Ahmedabad
Liaison Offices
Regional Offices
Area Offices
Manufacturing Locations
IP Marketing Offices
Vadodara
Bhavnagar
Mehsana
Rajkot
Narmada Khedut Sahay Kendras(68 Kendras)
17

Key Financials
40624527
51964988 5098 5170
6058
FY12 FY13 FY14 FY15 FY16 FY17 FY18
Revenue Trend
Figures in ₹ Crore
16%
18

Key Financials
2180 2198
1670
888
0
FY14 FY15 FY16 FY17 FY18
Long-term Debt
Only public sector company to have prepaid
its long-term debt
Figures in ₹ Crore 19

Key Financials
1675 1645
1422
1070
228
0
FY14 FY15 FY16 FY17 FY18 As on date
Working Capital
Figures in ₹ Crore 20

Key Financials
12685
212
361
629
FY14 FY15 FY16 FY17 FY18
Export Growth
49%
CAGR
Figures in ₹ Crore 21

Key Financials
662
31
815
1170
1532
FY14 FY15 FY16 FY17 FY18
EBITDA
23%
CAGR
Figures in ₹ Crore 22

Key Financials
424
-452
268
715
1162
PBT
FY14 FY15 FY16 FY17 FY18
29%
CAGR
Figures in ₹ Crore23

Key Financials
292
-452
173
521
790
PAT
FY14 FY15 FY16 FY17 FY18
28%
CAGR
Figures in ₹ Crore24

Key Financials
19
-29
11
34
51
EPS
FY14 FY15 FY16 FY17 FY18
28%
CAGR
Figures in ₹25

Market Performance
FY15 FY16 FY17 FY18
Market Cap 1054 1269 4468 8524
0
2000
4000
6000
8000
10000
INR
CR
OR
ES
Growth comparison: Sensex , Nifty &
GNFCMarket Capitalization
2014-15 2015-16 2016-17 2017-18
BSE Sensex 25% 13% 32% 51%
Nifty 27% 15% 37% 55%
GNFC -13% 4% 267% 444%
-100%
0%
100%
200%
300%
400%
500%
*Growth calculated keeping 2013-14 as the base year
26

Peer Comparison
27% 26%
13%
19%22%
13%
8%
4%
10% 10%
YoY Growth OPBDITA PAT RoE RoCE
COMPARISON OF KEY METRICS FY-18GNFC Vs Industry Avg.
GNFC Industry Average
Source: ICRA - June 18
Major peers compared
Company Name Initials
Chambal Fertilisers& Chemicals Limited CFCL
Coromandel International Limited CIL
Deepak Fertilisers& Petrochemicals Corporation Limited
Deepak
Gujarat State Fertilisers Corporation GSFC
Madras Fertilisers Limited MFL
Mangalore Chemicals &Fertilisers Limited MCFL
National Fertilisers Limited NFL
Nagarjuna Fertilisers & Chemical Limited NFCL
ZuariAgro Chemicals Limited ZACL
Rashtriya Chemicals &Fertilisers Limited RCF
27

Peer ComparisonOPBITDA/OI
PAT/OI
25.60%
10.50%
5.60%
11.20% 9.40% 8.90%4.40%
9% 9.10%7.10%
3.20%
13.21%
6.44%
2.38%
6.07%
-0.54%
0.89% 1.07%
7.56%
2.78% 2.25%
-2.69%
GNFC CFCL NFL CIL NFCL ZACL RCF GSFC Deepak MCFL MFL
GNFC CFCL NFL CIL NFCL ZACL RCF GSFC Deepak MCFL MFL
Source: ICRA - June 1828

Peer ComparisonROCE
Interest Coverage
22%
10% 11% 10%
21%
9%11%
4%7% 6%
10%
5%
15.4
4.16.2
3.1
7.2
1.2 1.3
5.2
12.9
3.62.2
0.7
GNFC CFCL NFCLCILNFL ZACL RCF GSFC Deepak MCFL MFL
Source: CRISIL - June 18
IFFCO
GNFC CFCL NFCLCILNFL ZACL RCF GSFC Deepak MCFL MFLIFFCO
29

Peer ComparisonNet Cash Accruals/Total Debt
Gearing Ratio
464%
13% 10% 10% 28% 5% 6% 17% 57%9% 7%
-2%
0.051.21
1.90 1.520.88 1.37
4.60
0.43 0.140.80
2.79
-3.06
GNFC CFCL NFCLCILNFL ZACL RCF GSFC Deepak MCFL MFL
Source: CRISIL - June 18
IFFCO
GNFC CFCL NFCLCILNFL ZACL RCF GSFC Deepak MCFL MFLIFFCO
30

Highest Ever PBT recorded by any GoG Company
11621113
1011
904
750
641
354272
167
GNFC GSFC GSPL GMDC GACL GGL GIPCL GSECL GUVNL
Profit Before Tax (PBT)FY
18
FY1
2
FY1
8
FY1
3
FY1
8
FY1
5
FY1
3
FY1
7
FY1
7
31

Foreign Portfolio Investors - Countrywise

Major Foreign Institutional Investors
USA
•World Bank Pension Fund
•Florida Retirement System - Acadian Asset Management, Inc
•Fidelity Puritan Trust
•Dimensional Emerging Markets Value Fund
•City Of New York Group Trust
•Citibank N.A.
•Washington State Investment Board
•Public Employees Retirement System Of Ohio
•Virginia Retirement System
•John Hancock Variable Insurance Trust Emerging Markets Value Trust
•Los Angeles City Employees Retirement System
•City Of Los Angeles Fire And Police Pension Plan
Mauritius
• Ishares Emsc Mauritius CO.
•Morgan Stanley Mauritius Company Limited.
• Ishares Core Emerging Markets Mauritius Co.
•Kuber India Fund.
•Elara India Opportunities Fund Limited
China
•People’s bank of China
Singapore
•Goldman Sachs (Singapore) Pte
•Merrill Lynch Markets Singapore Pte. Ltd
•Credit Suisse (Singapore) Limited
As on 16-06-201833

Major Foreign Institutional Investors
Netherlands Luxemborg
•Wellington Management Funds (Luxembourg) Ii Sicav Wellington Alta Fund
•Wmc Gem Systematic Equity Fund
•Ram (lux) systematic funds - emerging markets equities
South Korea
• Samsung India Small And Mid Cap Focus Securities Master Investment Trust(equity)
• Stichting Shell Pensioenfonds
• Blue Sky Passive Equity Emerging Markets
Global Fund
• Stichting Depositary Apg Emerging Markets
Equity Pool
Australia
• Australiansuper
• Dfa Australia Limited As Responsible Entity
For Dimensional Emerging Markets Trust
• Queensland Investment Trust
• Sunsuper Superannuation Fund
Ireland
•Emerging Markets Value Fund.
• Ishares Core Msci Em Imi Ucits ETF.
•SSGA SPDR Etfs Europe I Public Limited
As on 16-06-201834

Increase in FPIs
56
144
0
20
40
60
80
100
120
140
160
As on 30-09-2016 As on 16-06-2018
Foreign Portfolio InvestorsN
um
be
r o
f FP
I’s
35

Business Restructuring in last few years
Initiated bold, quick & effective measures for Safety, Operational Stability and Increase inThroughput for TDI-II Greenfield plant. As at FY18, the capacity utilization for the TDI-II plantstood at 93% as against 80% of average operating rates across the globe.
Established export footprint in 67 countries; Exports grew 1750 % to INR 629 crores in FY 18from an average of INR 34 crores from FY 01 – FY 14.
Introduced dynamic marketing strategy for better realizations resulting into highest everrealizations in Acetic Acid, Formic Acid and Ethyl Acetate.
Argued successfully for anti-dumping duties on TDI and AN Melt, protecting margins onthese two products.
Ensured strategic volume tie-ups with key strategic vendors and customers.
36

Business Restructuring in last few years
Facilitated the approval for production of Technical Grade Urea; adding one moreprofitable product to the chemical portfolio.
Started Methanol trading after establishing ties with Iran
Facilitated Major negotiations for ensuring savings of more than INR 750 Crores overlast 4 years.
Facilitated fuel supply arrangement of coal from 4.27 lacs MT per annum to 9.12 lacsMT per annum.
Enhanced domestic market share to 65% for TDI from around 32%.
37

Expansion and Growth Plans
Focusing on the core capabilities & existing strengths, the board has already approved expansion plans for these major chemicals
Acetic Acid Di-Calcium Phosphate
Concentrated Nitric Acid
Formic Acid AmmoniaTDI Revamp
38

39
In 2015, the Government of India made it mandatory to Neem coat
100% of Urea to prevent
diversion
BACKGROUND
Shri Narendra Modi, Prime Minister of India, announced this vision on
August 15, 2015.
The NEEM Project

The ‘NEEM’ Project
GNFC created a transformative model of shared value creation through the ‘Neem Project’
The Neem Project
Trigger for change
•Mandatory 100% Neem coating of Urea directive from Government of India
• Prominence of unorganized players in the Neem oil market
• Solution - Backward integration in the Neem oil segment through shared value creation
Approach adopted
•Development of integrated value chain–
– Mobilization of rural women for Neem seed collection and procurement through 5,000+ VLCCs1
– Neem Oil expeller Unit set up to produce high quality Neem oil
• Forward integration to be launched for upskilling laborers in end-to-end soap making
Impact generated
• > Rs. 45 crore income generated for 450 thousand women in 53 districts across six states
• > 250 thousand people benefitted by indirect employment
• 700% increase in Neem seeds prices due to fair collection process
•Highly favorable socio-economic impact on rural women and landless laborers
GNFC is the only company which has taken decision well in advance to produce 100% Neem Urea since Jan-2015 in the larger interest of farmers and nation
http://gnfcneem.in/
40

Cashless Initiative
# Organizational Transactions PM
~ 9000
# Non-Organizational
Transactions PM ~ 40,000
# Farmers Benefitted3,50,000
Fertilizer Bags Purchased37.39 lakh
Transaction Worth
INR 128.24 Crore
PoSInstalled
8000+
No. of Talukas Covered In Gujarat
243
41


THANK YOU
Gujarat Narmada Valley Fertilizers & Chemicals LimitedP.O.: Narmadanagar – 392 015.
District: Bharuch, Gujarat, INDIA.
Phone: +91 - 2642 - 247001, 247002
43