Microzonificación Sísmica de Bangalore, India.
21
Seismic microzonation of Bangalore, India P Anbazhagan ∗ and T G Sitharam Civil Engineering Department, Indian Institute of Science, Bangalore 560 012, India. ∗ e-mail: [email protected] [email protected] In the present study, an attempt has been made to evaluate the seismic hazard considering local site effects by carrying out detailed geotechnical and geophysical site characterization in Bangalore, India to develop microzonation maps. An area of 220 km 2 , encompassing Bangalore Mahanagara Palike (BMP) has been chosen as the study area. Seismic hazard analysis and microzonation of Bangalore are addressed in three parts: in the first part, estimation of seismic hazard is done using seismotectonic and geological information. Second part deals with site characterization using geotechnical and shallow geophysical techniques. In the last part, local site effects are assessed by carrying out one-dimensional (1-D) ground response analysis (using the program SHAKE2000) using both standard penetration test (SPT) data and shear wave velocity data from multichannel analysis of surface wave (MASW) survey. Further, field experiments using microtremor studies have also been carried out for evaluation of predominant frequency of the soil columns. The same has been assessed using 1-D ground response analysis and compared with microtremor results. Further, the Seed and Idriss simplified approach has been adopted to evaluate the soil liquefaction susceptibility and liquefaction resistance assessment. Microzonation maps have been prepared with a scale of 1:20,000. The detailed methodology, along with experimental details, collated data, results and maps are presented in this paper. 1. Introduction Evaluation of seismic hazards and microzonation of cities enable us to characterize the potential seismic areas which have similar exposures to haz- ards of earthquakes, and these results can be used for designing new structures or retrofitting the existing ones. Study of seismic hazard and preparation of microzonation maps will provide an effective solution for city planning and earth- quake resistant design of structures in an area. Seismic hazard is the study of expected earth- quake ground motions at any point on the earth. Microzonation is the process of subdivision of a region into a number of zones based on the earth- quake effects in a local scale. Seismic microzona- tion is the process of estimating response of soil layers under earthquake excitation and thus the variation of ground motion characteristics on the ground surface. Geotechnical site characterization and assessment of site response during earthquakes is one of the crucial phases of seismic micro- zonation, which includes ground shaking inten- sity, amplification and liquefaction susceptibility. Microzonation mapping of seismic hazards can be expressed in relative or absolute terms, on an urban block-by-block scale, based on local soil conditions (such as soil types) that affect ground shaking levels or vulnerability to soil liquefac- tion (Sitharam et al 2001 and Govinda Raju et al 2004). These maps would provide general guidelines for integrated planning of cities and design of new structures that are most suited to an area, along with information on the relative damage potential of the existing structures in a region. Earthquake damage is commonly controlled by three interacting factors – source and path Keywords. Seismic hazard; site characterization; SPT; MASW; ground response analysis; liquefactions; Microzonation. J. Earth Syst. Sci. 117, S2, November 2008, pp. 833–852 © Printed in India. 833
-
Upload
felipe-arturo-reyez-marquez -
Category
Documents
-
view
10 -
download
0
Transcript of Microzonificación Sísmica de Bangalore, India.

Seismic microzonation of Bangalore, India
P Anbazhagan∗ and T G Sitharam
Civil Engineering Department, Indian Institute of Science, Bangalore 560 012, India.∗e-mail: [email protected] [email protected]
In the present study, an attempt has been made to evaluate the seismic hazard considering localsite effects by carrying out detailed geotechnical and geophysical site characterization in Bangalore,India to develop microzonation maps. An area of 220 km2, encompassing Bangalore MahanagaraPalike (BMP) has been chosen as the study area. Seismic hazard analysis and microzonation ofBangalore are addressed in three parts: in the first part, estimation of seismic hazard is doneusing seismotectonic and geological information. Second part deals with site characterization usinggeotechnical and shallow geophysical techniques. In the last part, local site effects are assessedby carrying out one-dimensional (1-D) ground response analysis (using the program SHAKE2000)using both standard penetration test (SPT) data and shear wave velocity data from multichannelanalysis of surface wave (MASW) survey. Further, field experiments using microtremor studieshave also been carried out for evaluation of predominant frequency of the soil columns. The samehas been assessed using 1-D ground response analysis and compared with microtremor results.Further, the Seed and Idriss simplified approach has been adopted to evaluate the soil liquefactionsusceptibility and liquefaction resistance assessment. Microzonation maps have been prepared witha scale of 1:20,000. The detailed methodology, along with experimental details, collated data, resultsand maps are presented in this paper.
1. Introduction
Evaluation of seismic hazards and microzonationof cities enable us to characterize the potentialseismic areas which have similar exposures to haz-ards of earthquakes, and these results can beused for designing new structures or retrofittingthe existing ones. Study of seismic hazard andpreparation of microzonation maps will providean effective solution for city planning and earth-quake resistant design of structures in an area.Seismic hazard is the study of expected earth-quake ground motions at any point on the earth.Microzonation is the process of subdivision of aregion into a number of zones based on the earth-quake effects in a local scale. Seismic microzona-tion is the process of estimating response of soillayers under earthquake excitation and thus thevariation of ground motion characteristics on the
ground surface. Geotechnical site characterizationand assessment of site response during earthquakesis one of the crucial phases of seismic micro-zonation, which includes ground shaking inten-sity, amplification and liquefaction susceptibility.Microzonation mapping of seismic hazards can beexpressed in relative or absolute terms, on anurban block-by-block scale, based on local soilconditions (such as soil types) that affect groundshaking levels or vulnerability to soil liquefac-tion (Sitharam et al 2001 and Govinda Rajuet al 2004). These maps would provide generalguidelines for integrated planning of cities anddesign of new structures that are most suited toan area, along with information on the relativedamage potential of the existing structures in aregion.
Earthquake damage is commonly controlledby three interacting factors – source and path
Keywords. Seismic hazard; site characterization; SPT; MASW; ground response analysis; liquefactions; Microzonation.
J. Earth Syst. Sci. 117, S2, November 2008, pp. 833–852© Printed in India. 833

834 P Anbazhagan and T G Sitharam
characteristics, local geological and geotechnicalconditions and type of structures. Obviously, allof this would require analysis and presentationof a large amount of geological, seismologicaland geotechnical data. History of earthquakes,faults/sources in the region, attenuation relation-ships, site characteristics, soil physical and engi-neering properties are few of the important inputsrequired. Microzonation has generally been recog-nized as the most accepted tool in seismic haz-ard assessment and risk evaluation and it isdefined as the zonation with respect to groundmotion characteristics taking into account sourceand site conditions (TC4-ISSMGE 1999). Micro-zonation of a region gives detailed informationof seismic hazard of the study area in a largerscale to improve the conventional macrozonationmaps and regional seismic zonation maps. Dam-age patterns of many recent earthquakes aroundthe world, including the 1999 Chamoli and 2001Bhuj earthquakes in India, have demonstrated thatthe soil conditions at a site can have a majoreffect on the level of ground shaking. For exam-ple, in the Chamoli earthquake, epicenter locatedat more than 250 km away from Delhi caused mod-erate damage to some of the buildings built onfilled-up soil or on soft alluvium. The Bhuj earth-quake caused severe damage not only in the epi-central region, but even in Ahmedabad, about250 km away, which attributed to increased groundshaking of the soft alluvium. Department of Sci-ence and Technology on a mission mode has takenup 63 cities microzonation of urban centers andBangalore is one of them (Bansal and Vandana2007). Bangalore is also vulnerable against aver-age earthquakes, because of the density of popu-lation, mushrooming of buildings of all kinds frommud buildings to RCC framed structures and steelconstruction with improper and low quality con-struction practice and erected structures on thefilled up soil (Sitharam et al 2006; Sitharam andAnbazhagan 2007). Hence it is necessary to under-stand the effects of local site conditions on earth-quake hazards and in this study it is attemptedto carry out microzonation of Bangalore urbancentre.
2. General setting of the study area
Bangalore city covers an area of approximately696.17 km2 (Greater Bangalore). The study area islimited to Bangalore Metropolis area (BangaloreMahanagara Palike, BMP) covering an area ofabout 220 km2. Bangalore is situated at a latitudeof 12◦58′ north and longitude of 77◦36′ east withan average altitude of about 910 m above meansea level (MSL). It is the principal administrative,
Figure 1. Study area with India map.
industrial, commercial, educational and culturalcapital of Karnataka state and lies in the south-western part of India (see figure 1). Bangalore cityis the fastest growing city and fifth biggest city inIndia. Besides political activities, Bangalore pos-sesses many national laboratories, defence esta-blishments, small and large-scale industries andInformation Technology Companies. It experiencestemperate, salubrious climate and an annual rain-fall of around 940 mm. There were over 150 tanks,though most of them have dried up due to silt-ing up and encroachments leaving only 64 tanks atpresent in an area of 220 km2. These tanks once dis-tributed water throughout the city for better watersupply but are presently in a dried-up conditionand have been encroached for construction of res-idential/industrial buildings. The tank beds havesilty clay and silty sand with filled-up soil above,over which buildings/structures have been built(Sitharam et al 2006; Sitharam and Anbazhagan2007).
3. Geology and geomorphology
Bangalore city lies over a hard and moderatelydense gneissic basement dated back to the Archeanera (2500–3500 mya). A large granitic intrusion inthe south central part of the city extends fromthe Golf Course in the north central to Vasantpur(VV Nagar) in the south of the city (almost 13 kmin length) and on an average 4 km from east towest along the way. A magmatite intrusion formedwithin the granitic one extends for approximately7.3 km running parallel with Krishna Rajendra

Seismic microzonation of Bangalore, India 835
Figure 2. Geomorphology of Bangalore area.
road/Kanakpura road from Puttanna Chetty roadin Chamrajpet till Bikaspura road in the south.These basic intrusions which mark the close of theArchean era (Lower Proterozoic; 1600–2500 mya)mainly constitute hard massive rocks such asGabbro, Dolerite, Norite and Pyroxenite.
Bangalore city lies within the south pennarbasin. The Vrishabhavathi, a minor tributary of theArkavati leaves the city almost diagonally from thesouthwest (Kengeri). On entering, it branches offgiving rise to the Nagarbhavi Thorai at the inter-section of the Mysore Road and the Bangalore Uni-versity Road. The river Arkavati branches northfrom Cauvery, most probably due to some struc-tural control imposed by presently active faults andother north-south trending lineaments in its course.The river Ponnaiyar enters the city from the south-east and branches into two, one stream terminatesin the Bellandur Lake, whereas the other contin-ues towards northwest. The basic geomorphologyof the city comprises of a central denudationalplateau and pediment (towards the west) with flatvalleys that are formed by the present drainagepatterns (see figure 2). The central denudationalplateau is almost void of any topology and the ero-sion and transportation of sediments carried outby the drainage network gives rise to the lateriticclayey alluvium seen throughout the central area
of the city. The pediment/pediplain is a low reliefarea that abruptly joins the plateau. The areamight have uplifted along active lineaments andmay have been eroded by the river Arkavati and itssubtributaries. The resulting alluvial fan depositshave been deposited or transported along thewaterways.
4. Seismotectonic map of the area
A critical part of seismic hazard analysis is thedetermination of Peak Ground Acceleration (PGA)and response acceleration (spectral acceleration)for an area/site. Seismic hazard analysis and deter-mination of PGA are very important steps forassessing the earthquake force to the design andmicrozonation. To evaluate seismic hazards for aparticular site or region, all possible sources of seis-mic activity must be identified and their potentialfor generating future strong ground motion shouldbe evaluated. Analysis of lineaments and faultshelps in understanding the regional seismotectonicactivity of the area. For seismic hazard assessmentof the study area, seismotectonic details have beencollected covering 350 km radius around the cityand this is called as the seismic study area (seefigure 1) as per the Regulatory Guide 1.165 (1997).
836 P Anbazhagan and T G Sitharam
Figure 3. A comparison of moment magnitude with othermagnitude scales (after Heaton et al 1986).
The seismic study area having the center point asBangalore city (with latitude of 12◦58′′N and lon-gitude of 77◦36′′E) has a radius of 350 km (whichcovers the latitude 9.8◦N to 16.2◦N and longitudeof 74.5◦E to 80.7◦E). Study area covers major
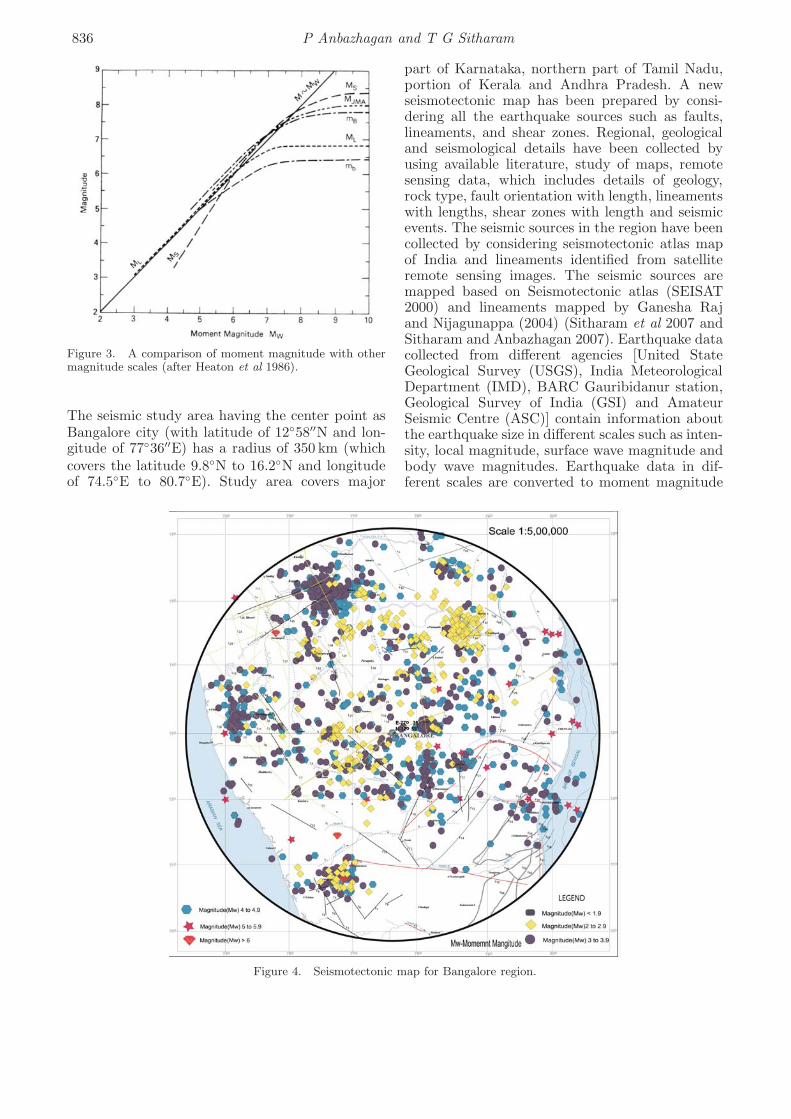
Figure 4. Seismotectonic map for Bangalore region.
part of Karnataka, northern part of Tamil Nadu,portion of Kerala and Andhra Pradesh. A newseismotectonic map has been prepared by consi-dering all the earthquake sources such as faults,lineaments, and shear zones. Regional, geologicaland seismological details have been collected byusing available literature, study of maps, remotesensing data, which includes details of geology,rock type, fault orientation with length, lineamentswith lengths, shear zones with length and seismicevents. The seismic sources in the region have beencollected by considering seismotectonic atlas mapof India and lineaments identified from satelliteremote sensing images. The seismic sources aremapped based on Seismotectonic atlas (SEISAT2000) and lineaments mapped by Ganesha Rajand Nijagunappa (2004) (Sitharam et al 2007 andSitharam and Anbazhagan 2007). Earthquake datacollected from different agencies [United StateGeological Survey (USGS), India MeteorologicalDepartment (IMD), BARC Gauribidanur station,Geological Survey of India (GSI) and AmateurSeismic Centre (ASC)] contain information aboutthe earthquake size in different scales such as inten-sity, local magnitude, surface wave magnitude andbody wave magnitudes. Earthquake data in dif-ferent scales are converted to moment magnitude

Seismic microzonation of Bangalore, India 837
(Mw) to achieve the status of the uniform magni-tude by using magnitude relations given by Heatonet al (1986) (see figure 3). These sources andearthquake data were coupled with Adobe Illus-trator version 9.0 to prepare a new seismotectonicmap for Bangalore region. Seismotectonic map forBangalore is shown in figure 4, which consists of 65numbers of faults with length varying from 9.73 kmto 323.5 km, 34 lineaments and 14 shear zones. Theearthquake events mapped consist of 1421 eventswith minimum moment magnitude of 1.0 and amaximum of 6.2. The spatial distribution of earth-quake magnitudes of the study area is shown infigure 4. The dataset contains 394 events which areless than moment magnitude 3, 790 events from 3to 3.9, 212 events from 4 to 4.9, 22 events from5 to 5.9 and three events which are more thanmoment magnitude 6. The recent seismic activityof Bangalore has been studied based on the seismicsources and earthquake events in the area.
5. Methodology
Methodology for complete seismic microzonationof the study area is formulated by consideringthe topology, geology, geomorphology and possiblehazards during the earthquakes. The earthquakedamage basically depends on three groups offactors: earthquake source and path characteris-tics, local geological and geotechnical site condi-tions, structural design and construction features.Seismic microzonation should address the assess-ment of the first two groups of factors. In gen-eral terms, seismic microzonation is the processof estimating the response of soil layers for earth-quake excitations and thus the variation of earth-quake characteristics is represented on the groundsurface. For the present investigation the seis-mic microzonation has been subdivided into threemajor items:
• Evaluation of the expected input motion,• Local site effects and ground response analysis,• Preparation of microzonation maps.
The microzonation is graded based on the scaleof the investigation and details of the study car-ried out. The technical committee on earthquakegeotechnical engineering (TC4) of the InternationalSociety of Soil Mechanics and Foundation Engi-neering (TC4-ISSMGE 1999) highlighted that thefirst grade (Level I) map can be prepared witha scale of 1:1000,000–1:50,000 and the groundmotion was assessed based on the historical earth-quakes and existing information of geological andgeomorphological maps. If the scale of the map-ping is 1:100,000–1:10,000 and ground motion is
assessed based on the microtremor and simpli-fied geotechnical studies then it is called sec-ond grade (Level II) map. In the third grade(Level III) map ground motion has been assessedbased on the complete geotechnical investigationsand ground response analysis with a scale of1:25,000–1:5000. The present investigation was car-ried out with a scale of 1:20,000 and groundmotion is arrived based on the detailed geotechni-cal/geophysical investigations and ground responseanalysis. Hence this work can be graded asthird grade (Level III) microzonation maps forBangalore. As the study area has fairly flat groundin most of the area except in north and north-western parts of Bangalore, possibility of a land-slide is considered remote. Bangalore is situated at910 m above mean sea level, there is no possibilityof tsunami. The steps formulated for seismic haz-ard and microzonation of Bangalore in the presentinvestigation is illustrated in the form of a flowchart in figure 5. These steps can also be adoptedfor flat terrain where possibility of landslide andtsunami are remote.
6. Seismic hazard analysis
Deterministic seismic hazard analysis (DSHA) forBangalore has been carried out by consideringpast earthquakes, assumed subsurface fault rup-ture lengths and point source synthetic groundmotion model. Maximum Credible Earthquake(MCE) has been determined by considering theregional seismotectonic activity in about 350 kmradius around Bangalore. Source magnitude foreach source is chosen from the maximum reportedpast earthquake close to that source and short-est distance from each source to Bangalore isarrived from the newly prepared seismotectonicmap. Using these details and regional attenuationrelation developed for southern India by Iyengarand Raghukanth (2004), the peak ground acceler-ation (PGA) has been estimated. To estimate theexpected magnitude for seismic source, a paramet-ric study has been carried out to find subsurfacerupture length of the fault using past earthquakedata and Wells and Coppersmith (1994) relationbetween the subsurface lengths versus earthquakemagnitudes. About more than 60% of earthquakemagnitude matches with the subsurface length cor-responding to 3.8% of the total length of fault.The expected maximum magnitude for each sourcehas been evaluated by assuming that the seismicsource may rupture at subsurface level for a lengthof 3.8% of the total length of source. The PGA forBangalore has been estimated using expected mag-nitudes and regional attenuation relation. Furtherseismological model developed by Boore (1983,
838 P Anbazhagan and T G Sitharam
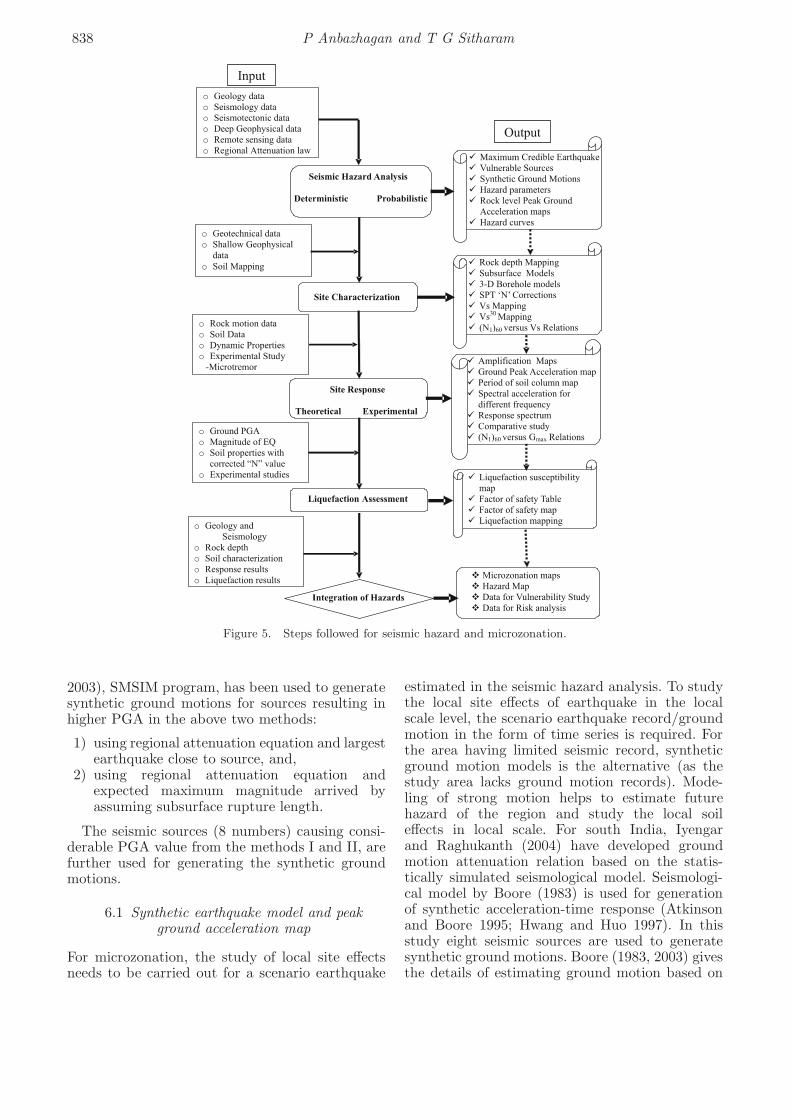
Figure 5. Steps followed for seismic hazard and microzonation.
2003), SMSIM program, has been used to generatesynthetic ground motions for sources resulting inhigher PGA in the above two methods:
1) using regional attenuation equation and largestearthquake close to source, and,
2) using regional attenuation equation andexpected maximum magnitude arrived byassuming subsurface rupture length.
The seismic sources (8 numbers) causing consi-derable PGA value from the methods I and II, arefurther used for generating the synthetic groundmotions.
6.1 Synthetic earthquake model and peakground acceleration map
For microzonation, the study of local site effectsneeds to be carried out for a scenario earthquake
estimated in the seismic hazard analysis. To studythe local site effects of earthquake in the localscale level, the scenario earthquake record/groundmotion in the form of time series is required. Forthe area having limited seismic record, syntheticground motion models is the alternative (as thestudy area lacks ground motion records). Mode-ling of strong motion helps to estimate futurehazard of the region and study the local soileffects in local scale. For south India, Iyengarand Raghukanth (2004) have developed groundmotion attenuation relation based on the statis-tically simulated seismological model. Seismologi-cal model by Boore (1983) is used for generationof synthetic acceleration-time response (Atkinsonand Boore 1995; Hwang and Huo 1997). In thisstudy eight seismic sources are used to generatesynthetic ground motions. Boore (1983, 2003) givesthe details of estimating ground motion based on

Seismic microzonation of Bangalore, India 839
Figure 6. Rock level peak ground acceleration map.
the Fourier amplitude spectrum of acceleration atbedrock and this is expressed as:
A(f) = C[S(f)]D(f)P (f), (1)
where S(f) is the source spectral function, D(f) isthe diminution function characterizing the atten-uation, and P (f) is a filter to shape accelerationamplitudes beyond a high cut-off frequency fm,
and C is a scaling factor. For south Indian region,Iyengar and Raghukanth (2004) used Q value of460f 0.83 based on strong motion records of smallmagnitude earthquakes. However, for Bangaloreregion, Tripathi and Ugalde (2004) developed Qfactor by using seismic array from the Gauribida-nur seismic recording station that is about 85 kmfrom Bangalore. They estimated and reported forthe different frequency range of 1 to 10 Hz. ForBangalore, the natural frequency is in the range of3 to 6 Hz and the corresponding Q value of 488f 0.88
(Tripathi and Ugalde 2004) is considered.The synthetic ground motion and spectral
acceleration at rock level for 8 seismic sources aredeveloped by considering expected magnitude andhypocentral distance along with the above regionalseismic hazard parameters. The PGA valuesobtained from synthetic ground motion modelusing regional seismotectonic parameters variesfrom 0.005 g to 0.136 g. The lineament L15 givesthe highest PGA value of 0.136 g by takinghypocentral distance of 15.88 km. Further, PGAobtained from the model for the L15 matcheswell with the PGA values from both the above
approaches. The generated spectral accelerationshape matches with the shape of uniform hazardspectrum. Further rock level PGA is estimatedconsidering the Mandya–Channapatna–Bangalorelineament (L15) as the source and maximum credi-ble earthquake of 5.1 in moment magnitude. Usingthese PGA values, rock level PGA map has beenprepared and is shown in figure 6. From theabove three approaches maximum PGA of about0.15 g was estimated for Bangalore. To identifyPGA/hazard values at the specific location at rocklevel, the PGA can be used.
7. Geotechnical data
For the complete microzonation and site responsestudy of the area, the subsurface soil characteriza-tion has to be carried out. This section presentsthe subsurface soil characterizations of Bangaloreusing geotechnical boreholes along with SPT ‘N ’values with depth. The geotechnical data werecollected from archives of Torsteel Research Foun-dation, Bangalore and Indian Institute of Sci-ence, Bangalore. Bangalore city (220 km2) basemap has been generated in the scale of 1:20,000with several layers of information (such as outerand administrative boundaries, contours, high-ways, major roads, minor roads, streets, rail roads,water bodies, drains, landmarks and boreholelocations) using Geographical Information System(GIS). Base map with drainage and water bodyalong with borehole information is shown in fig-ure 7. The GIS model developed currently consistsof 850 borehole locations marked on the digitized

840 P Anbazhagan and T G Sitharam
Figure 7. GIS model of borehole locations along with waterbody features.
Figure 8. GIS model of borehole locations in 3-D view.
Bangalore map (see figure 7). The 3-D subsurfacemodel with geotechnical data has been generatedwith base map. The boreholes are represented as3-dimensional objects projecting below the basemap layer up to the available borehole depth,geotechnical properties are represented as layersat 0.5 m intervals with density, SPT ‘N ’ values,index properties, etc. Each borehole in this modelis attached with a geotechnical data versus depth.
Table 1. General soil profile distribution in Bangalore.
Soil description with depth and direction
Layer Northwest Southwest Northeast Southeast
First layer Silty sand with Silty sand with Clayey sand Filled up soilclay 0–3 m gravel 0–1.7 m 0–1.5 m 0–1.5 m
Second layer Medium to dense Clayey sand Clayey sand with Silty claysilty sand 3–6 m 1.7–3.5 m gravel 1.5–4 m 1.5–4.5 m
Third layer Weathered rock Weathered rock Silty sand with Sandy clay6–17 m 3.5–8.5 m gravel 4–15.5 m 4.5–17.5 m
Fourth layer Hard rock below Hard rock Weathered rock Weathered rock17 m below 8.5 m 15.5–27.5 m 17.5–38.5 m
Fifth layer Hard rock Hard rock Hard rock Hard rockbelow 27.5 m below 38.5 m
Also scanned image files of borelogs and propertiestable are attached to the location in plan. The dataconsist of visual soil classification, standard pene-tration test results, ground water level, time duringwhich test has been carried out, and other physi-cal and engineering properties of soil. The modelprovides two options to view the data at eachborehole,
• visualize the soil characteristics as colored layerwith depth information along with properties inexcel format and
• bore logs and properties as an image file.
From this 3-D geotechnical model, geotechnicalinformation on any borehole at any depth can beobtained at every 0.5 m interval by clicking at thatlevel (donut). Figure 8 shows the view of boreholesbelow Bangalore city map. For the purpose of gen-eral identification of soil layers in the study area,a generalized classification of soils has been doneand it is presented in table 1.
7.1 SPT ‘N ’ corrections
The ‘N ’ values measured in the field using standardpenetration test procedure have been corrected forvarious corrections, such as: (a) Overburden Pres-sure (CN), (b) Hammer energy (CE), (c) Boreholediameter (CB), (d) presence or absence of liner(CS), (e) Rod length (CR) and (f) fines content(Cfines) (Seed et al 1983, 1985; Youd et al 2001;Cetin et al 2004; Pearce and Baldwin 2005). Cor-rected ‘N ’ value, i.e., (N1)60 are obtained usingthe following equation:
(N1)60 = N × (CN × CE × CB × CS × CR). (2)
The corrected ‘N ’ value (N1)60 is further correctedfor fine content based on the revised boundary
Seismic microzonation of Bangalore, India 841
curves presented by Idriss and Boulanger (2004)for cohesionless soils as described below:
(N1)60cs = (N1)60 + Δ(N1)60, (3)
Δ(N1)60
= exp
[1.63+
9.7FC+0.001
−(
15.7FC+0.001
)2]
,
(4)
FC = per cent fine content (per cent dry weightfiner than 0.074 mm).
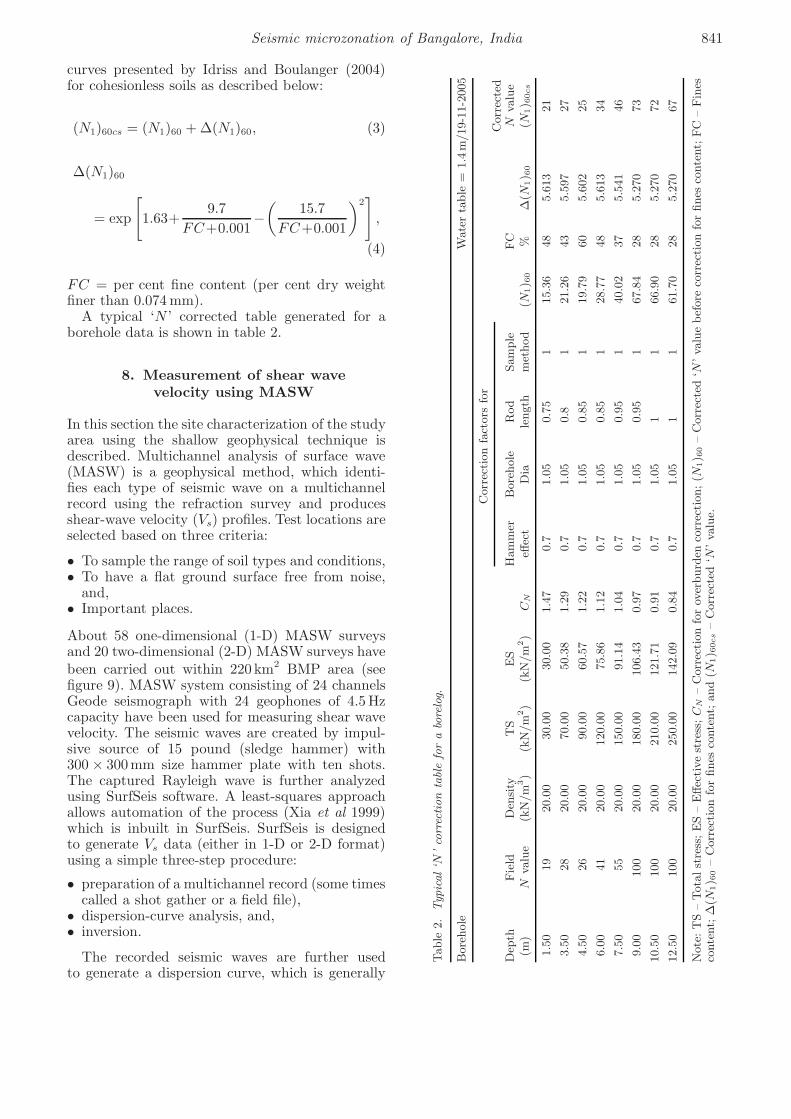
A typical ‘N ’ corrected table generated for aborehole data is shown in table 2.
8. Measurement of shear wavevelocity using MASW
In this section the site characterization of the studyarea using the shallow geophysical technique isdescribed. Multichannel analysis of surface wave(MASW) is a geophysical method, which identi-fies each type of seismic wave on a multichannelrecord using the refraction survey and producesshear-wave velocity (Vs) profiles. Test locations areselected based on three criteria:
• To sample the range of soil types and conditions,• To have a flat ground surface free from noise,
and,• Important places.
About 58 one-dimensional (1-D) MASW surveysand 20 two-dimensional (2-D) MASW surveys havebeen carried out within 220 km2 BMP area (seefigure 9). MASW system consisting of 24 channelsGeode seismograph with 24 geophones of 4.5 Hzcapacity have been used for measuring shear wavevelocity. The seismic waves are created by impul-sive source of 15 pound (sledge hammer) with300 × 300mm size hammer plate with ten shots.The captured Rayleigh wave is further analyzedusing SurfSeis software. A least-squares approachallows automation of the process (Xia et al 1999)which is inbuilt in SurfSeis. SurfSeis is designedto generate Vs data (either in 1-D or 2-D format)using a simple three-step procedure:
• preparation of a multichannel record (some timescalled a shot gather or a field file),
• dispersion-curve analysis, and,• inversion.
The recorded seismic waves are further usedto generate a dispersion curve, which is generally
Table
2.
Typ
ical‘N
’co
rrec
tion
tabl
efo
ra
bore
log.
Bore
hole
Wate
rta
ble
=1.4
m/19-1
1-2
005
Corr
ection
fact
ors
for
Corr
ecte
dD
epth
Fie
ldD
ensity
TS
ES
Ham
mer
Bore
hole
Rod
Sam
ple
FC
Nva
lue
(m)
Nva
lue
(kN
/m
3)
(kN
/m
2)
(kN
/m
2)
CN
effec
tD
iale
ngth
met
hod
(N1) 6
0%
Δ(N
1) 6
0(N
1) 6
0cs
1.5
019
20.0
030.0
030.0
01.4
70.7
1.0
50.7
51
15.3
648
5.6
13
21
3.5
028
20.0
070.0
050.3
81.2
90.7
1.0
50.8
121.2
643
5.5
97
27
4.5
026
20.0
090.0
060.5
71.2
20.7
1.0
50.8
51
19.7
960
5.6
02
25
6.0
041
20.0
0120.0
075.8
61.1
20.7
1.0
50.8
51
28.7
748
5.6
13
34
7.5
055
20.0
0150.0
091.1
41.0
40.7
1.0
50.9
51
40.0
237
5.5
41
46
9.0
0100
20.0
0180.0
0106.4
30.9
70.7
1.0
50.9
51
67.8
428
5.2
70
73
10.5
0100
20.0
0210.0
0121.7
10.9
10.7
1.0
51
166.9
028
5.2
70
72
12.5
0100
20.0
0250.0
0142.0
90.8
40.7
1.0
51
161.7
028
5.2
70
67
Note
:T
S–
Tota
lst
ress
;E
S–
Effec
tive
stre
ss;C
N–
Corr
ection
for
over
burd
enco
rrec
tion;(N
1) 6
0–
Corr
ecte
d‘N
’va
lue
bef
ore
corr
ection
for
fines
conte
nt;
FC
–Fin
esco
nte
nt;
Δ(N
1) 6
0–
Corr
ection
for
fines
conte
nt;
and
(N1) 6
0cs
–C
orr
ecte
d‘N
’va
lue.

842 P Anbazhagan and T G Sitharam
Figure 9. MASW testing locations in Bangalore.
displayed as a function of phase velocity versusfrequency. Phase velocity can be calculated fromthe linear slope of each component on the swept-frequency record. Dispersion curves and shearvelocity profiles in 1-D and 2-D have been evalu-ated using SurfSeis software.
8.1 Site classification
The seismic site characterization for calculatingseismic hazard is usually carried out based on thenear-surface shear wave velocity values. The aver-age shear wave velocity for the depth ‘d’ of soil,referred as VH , is computed as follows:
VH =∑
di∑(di/vi)
, (5)
where H =∑
di = cumulative depth in m.
Table 3. Typical average shear wave velocity calculation.
Soil AverageDepth Vs thickness Vs Average Average Average Average Average Average(m) (m/s) [di] (m) soil-7.2 m Vs-5m Vs-10m Vs-15m Vs-20m Vs-25 m Vs-30m
−1.22 316 −1.2 259 265 286 310 338 362 306
−2.74 250 −1.5
−4.64 255 −1.9
−7.02 241 −2.4
−10.00 388 −3.0
−13.71 355 −3.7
−18.36 435 −4.6
−24.17 527 −5.8
−31.43 424 −7.3
−39.29 687 −7.9
For 30 m average depth, shear wave velocity iswritten as:
V 30s =
30∑N
i=1 (di/vi), (6)
where di and vi denote the thickness (in meters)and shear-wave velocity in m/s (at a shear strainlevel of 10−5 or less) of the ith formation or layerrespectively, in a total of N layers, existing in thetop 30 m. V 30
s is accepted for site classification asper NEHRP classification and also UBC classifi-cation (Uniform Building Code in 1997) (Dobryet al 2000; Kanli et al 2006). In order to figureout the average shear-wave velocity distributionin Bangalore, the average velocity has been calcu-lated using the equation (5) for the each boreloglocation. A simple spread sheet has been generatedto carry out the calculation, as shown in table 3.The Vs average has been calculated for every 5mdepth interval up to a depth of 30 m. Usually, foramplification and site response study the 30 maverage Vs is considered. However, if the rockis found within a depth of about 30 m, averageshear-wave velocity of soil thickness (overburdenthickness) needs to be considered. Otherwise, V 30
s
obtained will be higher due to the velocity of thehard rock mass. Site characterization using SPTdata shows that, the soil overburden thickness inBangalore varies from 1m to about 40 m. Hence,average Vs has also been calculated for overburdensoil alone based on the soil thickness correspondingto that location of the borehole. Typical averageVs calculation for soil is shown in column 4 oftable 3. The average shear-wave velocities calcu-lated above are mapped for the entire BMP areaof study and Arc GIS has been used for mappingaverage Vs in the area. Figure 10 shows the typicalaverage velocity (for depth of 15 m) in BMP area.Most of the study area is having a velocity range of

Seismic microzonation of Bangalore, India 843
Fig
ure
10.
15m
aver
age
shea
rw
ave
vel
oci
tydistr
ibution
inB
MP
are
a.
844 P Anbazhagan and T G Sitharam
180 to 360 m/s. The study shows that whole studyarea has medium to dense soil with a velocity rangeof 180 to 360 m/s falling in to ‘site class D’ as perNEHRP classification.
9. Site response studies
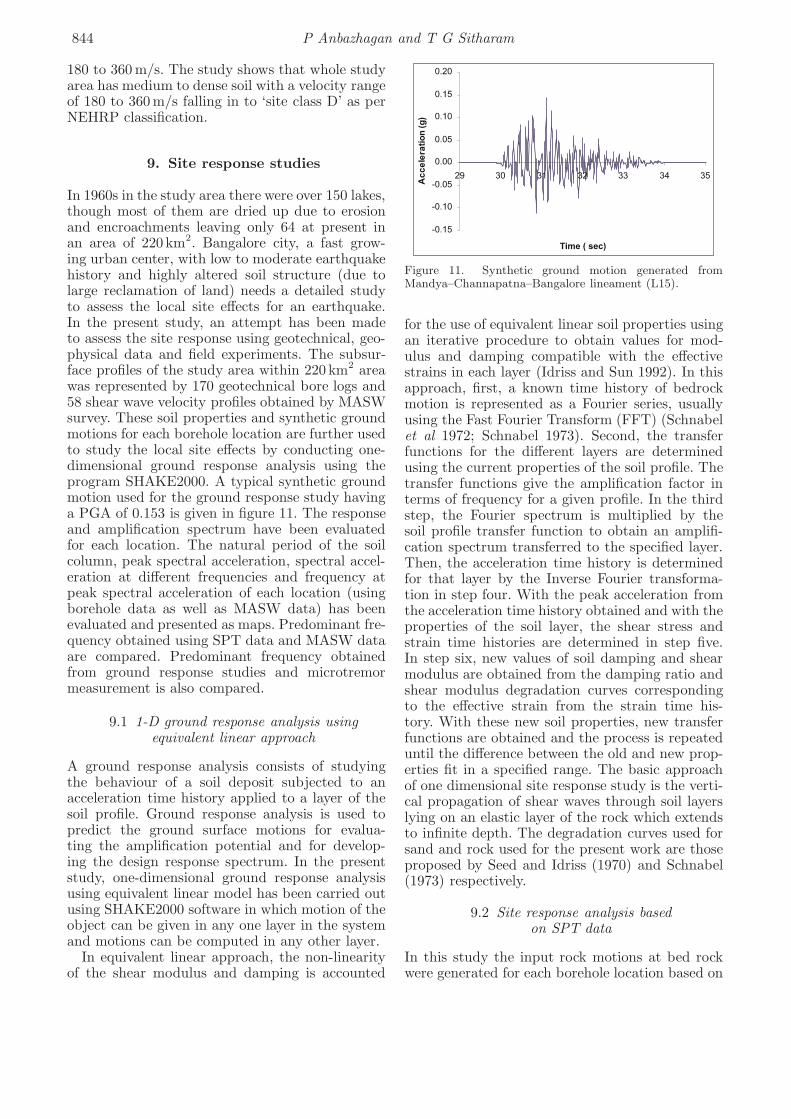
In 1960s in the study area there were over 150 lakes,though most of them are dried up due to erosionand encroachments leaving only 64 at present inan area of 220 km2. Bangalore city, a fast grow-ing urban center, with low to moderate earthquakehistory and highly altered soil structure (due tolarge reclamation of land) needs a detailed studyto assess the local site effects for an earthquake.In the present study, an attempt has been madeto assess the site response using geotechnical, geo-physical data and field experiments. The subsur-face profiles of the study area within 220 km2 areawas represented by 170 geotechnical bore logs and58 shear wave velocity profiles obtained by MASWsurvey. These soil properties and synthetic groundmotions for each borehole location are further usedto study the local site effects by conducting one-dimensional ground response analysis using theprogram SHAKE2000. A typical synthetic groundmotion used for the ground response study havinga PGA of 0.153 is given in figure 11. The responseand amplification spectrum have been evaluatedfor each location. The natural period of the soilcolumn, peak spectral acceleration, spectral accel-eration at different frequencies and frequency atpeak spectral acceleration of each location (usingborehole data as well as MASW data) has beenevaluated and presented as maps. Predominant fre-quency obtained using SPT data and MASW dataare compared. Predominant frequency obtainedfrom ground response studies and microtremormeasurement is also compared.
9.1 1-D ground response analysis usingequivalent linear approach
A ground response analysis consists of studyingthe behaviour of a soil deposit subjected to anacceleration time history applied to a layer of thesoil profile. Ground response analysis is used topredict the ground surface motions for evalua-ting the amplification potential and for develop-ing the design response spectrum. In the presentstudy, one-dimensional ground response analysisusing equivalent linear model has been carried outusing SHAKE2000 software in which motion of theobject can be given in any one layer in the systemand motions can be computed in any other layer.
In equivalent linear approach, the non-linearityof the shear modulus and damping is accounted
Figure 11. Synthetic ground motion generated fromMandya–Channapatna–Bangalore lineament (L15).
for the use of equivalent linear soil properties usingan iterative procedure to obtain values for mod-ulus and damping compatible with the effectivestrains in each layer (Idriss and Sun 1992). In thisapproach, first, a known time history of bedrockmotion is represented as a Fourier series, usuallyusing the Fast Fourier Transform (FFT) (Schnabelet al 1972; Schnabel 1973). Second, the transferfunctions for the different layers are determinedusing the current properties of the soil profile. Thetransfer functions give the amplification factor interms of frequency for a given profile. In the thirdstep, the Fourier spectrum is multiplied by thesoil profile transfer function to obtain an amplifi-cation spectrum transferred to the specified layer.Then, the acceleration time history is determinedfor that layer by the Inverse Fourier transforma-tion in step four. With the peak acceleration fromthe acceleration time history obtained and with theproperties of the soil layer, the shear stress andstrain time histories are determined in step five.In step six, new values of soil damping and shearmodulus are obtained from the damping ratio andshear modulus degradation curves correspondingto the effective strain from the strain time his-tory. With these new soil properties, new transferfunctions are obtained and the process is repeateduntil the difference between the old and new prop-erties fit in a specified range. The basic approachof one dimensional site response study is the verti-cal propagation of shear waves through soil layerslying on an elastic layer of the rock which extendsto infinite depth. The degradation curves used forsand and rock used for the present work are thoseproposed by Seed and Idriss (1970) and Schnabel(1973) respectively.
9.2 Site response analysis basedon SPT data
In this study the input rock motions at bed rockwere generated for each borehole location based on
Seismic microzonation of Bangalore, India 845
Fig
ure
12.
Distr
ibution
ofpea
khorizo
nta
lacc
eler
ation
at
gro
und
surf
ace
.
846 P Anbazhagan and T G Sitharam
Table 4. Zones and amplification factor range.
ApproximateAmplification average 30 m shear
Zone factor wave velocity (m/s)
1 (I) 1.00–1.99 400–9002 (II) 2.00–2.99 200–4003 (III) 3.00–3.99 300–5004 (IV) > 4.00 300–400
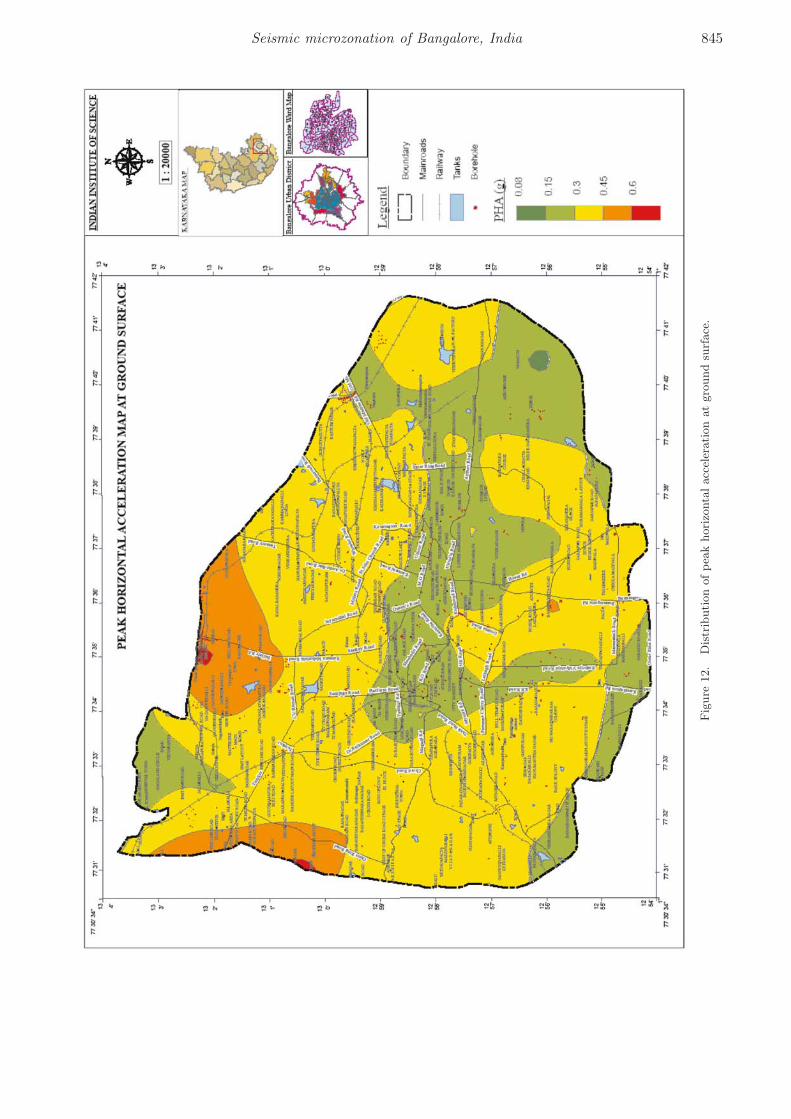
the hypocentral distance calculated for each bore-hole to the Mandya–Channapatna–Bangalore lin-eament and used as input for the correspondingborehole to study the site response. Out of 850borelogs 170 borelogs were carefully evaluated, forthe engineering bed rock depth in each borelogfrom the rock characterization tests, and selectedfor the site response study. Engineering bed rockis the bed rock having the shear wave velocityof around 700 m/s. The shear modulus is evalu-ated based on the equation developed by Imai andTonouchi (1982) using corrected SPT ‘N ’ values.The rock motion obtained from synthetic groundmotion model is assigned at the bedrock level asinput in SHAKE and evaluated peak accelerationvalues and acceleration time histories at the topof each sublayer. Response spectra at the top ofthe bedrock and at ground surface and amplifica-tion spectrum between the first and last layers ata frequency step of 0.125 are obtained. Similarly,stress-strain time history and Fourier amplitudespectrum have been obtained for all the bore-hole locations. These are compiled and presentedin the form of maps depicting variation of differ-ent parameters. The peak horizontal acceleration(PGA) values at bedrock level are amplified basedon the soil profile at various locations. The peakacceleration value at the ground surface obtainedfrom SHAKE2000 is used to prepare the PGA mapof Bangalore, which is shown in figure 12. The PGAvalue ranges from 0.088 to 0.66 g. They are notdistributed uniformly due to variation in the soilprofile at various locations.
9.3 Amplification factor map
The term Amplification Factor is used here torefer to the ratio of the peak horizontal accelerationat the ground surface to the peak horizontal acce-leration at the bedrock. This factor is evaluatedfor all the boreholes using the PGA at bedrockobtained from the synthetic acceleration time his-tory for each borehole and the peak ground surfaceacceleration obtained as a result of ground responseanalysis using SHAKE2000. The amplification fac-tor thus calculated ranged from 1 to 4.8. Theamplification factors obtained are used to prepare
the amplification map of Bangalore. Bangalore citycan be divided into four zones based on the rangeof amplification factors assigned to each zone asshown in table 4. Table 4 also lists the range of30 m average shear wave velocity from MASW test.The amplification factor map for Bangalore city isshown in figure 13. Lower amplification values indi-cate lesser amplification potential and hence lesserseismic hazard. It can be observed that the ampli-fication factor for most of Bangalore city is in therange of 2–3. A very small part of the city comesunder high amplification potential with the ampli-fication factor ranging from 3 to 5. Comparison ofthe variation of overburden thickness map and theamplification factor map shows that the regionshaving higher amplification zone has an overburdenthickness in the range of 5 to 18 m. The high ampli-fication potential in these regions can be attributedto factors other than the overburden thickness.Boreholes located in the north-eastern side of thecity fall in the zone IV. The amplification factor forthese soil profiles is very high due to presence ofclay layer and has thickness of the clay from 2m toabout 8m. This may be attributed to the fact thatthis region has a filled up soil of about 4m depthand a shallow water table depth of 0.3 m, whichconsiderably increases the amplification potential.
9.4 Site response analysis usingshear wave velocity
From the wave propagation theory, it is clearthat the ground motion amplitude depends on thedensity and shear wave velocity of subsurface mate-rial (Bullen 1965; Aki and Richards 1980). Usu-ally in situ density has relatively smaller variationwith depth and thus the shear wave velocity is thelogical choice for representing site conditions. Anattempt has been made to study the site responseof study area using measured shear wave velocityobtained from MASW test.
The peak horizontal acceleration at ground sur-face obtained using shear wave velocity rangesfrom 0.188 to 0.475 g. This is comparable to peakhorizontal acceleration values obtained using SPTdata. The ground acceleration is considerably largein the areas of tank beds, resulting from the thicklayers of silty sand with clay mixture. The shape ofvariation of peak acceleration with depth is similarto the SPT data. Typical PGA versus depth curveis shown in figure 14. Peak acceleration using SPTdata is higher when compared to the MASW dataand also these variations are large for shallow over-burden (within 12 m) thickness. The amplificationfactor thus calculated using MASW data rangesfrom 1 to 3.5 which are comparable with the valuescalculated using SPT data. The dense sand soil,where average shear wave velocity is more than

Seismic microzonation of Bangalore, India 847
Fig
ure
13.
Am
plifica
tion
map
ofB
angalo
re.

848 P Anbazhagan and T G Sitharam
Figure 14. Typical peak ground acceleration with soilcolumn thickness.
Figure 15. Typical amplification ratio using MASW andSPT.
Figure 16. Predominant frequencies using SPT and MASWdata.
350 m/s, has less amplification. Spectral values atdifferent frequency using MASW data do not varymuch from the values obtained using SPT data.The shape of the amplification spectrum obtained
using both data matches well, however values ofamplification ratio from MASW data is lower thanthe SPT data. Typical plot amplification ratio ver-sus frequency is shown in figure 15. Figure 15clearly shows that both data give same amplifica-tion ratio with different frequency. SPT data give5.5 Hz and MASW data give 4Hz corresponding topeak amplification ratio. Also amplification spec-trum from both data shows the double peak but atdifferent frequency.
9.5 Comparison of predominant frequencyobtained using SPT and MASW data
Predominant frequency of soil is widely usedto categorize the soil for a ground motion andit is mainly dependent upon the dynamic pro-perties of soil. The predominant frequency isdefined as the frequency of vibration correspon-ding to the maximum value of Fourier ampli-tude. In this study predominant frequency of soilcolumn is obtained from Fourier spectrum esti-mated using SHAKE2000. Predominant frequen-cies are estimated using both SPT data andMASW data. Results show that predominant fre-quencies obtained are similar from both meth-ods. Predominant frequency varies from 4 to 12 Hzbased on SPT data and 3.45 to 12 Hz based on Vs
from MASW survey. To compare predominant fre-quencies from both the methods, the site responsestudy results at 38 locations (where both bore-hole data and MASW survey area available) areused. Predominant frequencies corresponding tothese locations are presented in figure 16. Figure 16shows that the predominant frequencies obtainedfrom both data are comparable. Table 5 shows thatmost of the study area has higher predominant fre-quency (5 to 12.5 Hz) from both these methods.The predominant frequency of the soil layers hasbeen better estimated using shear wave velocitydata when compared to SPT data.
9.6 Comparison of predominant frequencyfrom site response study using Vs
and microtremor
The microtremor survey is carried out at 60 loca-tions jointly by National Geophysical ResearchInstitute (NGRI) Hyderabad and ourself for thisproject to compare predominant periods of thesoil columns. The instruments used in this experi-ment are L4-3D short period sensors equipped withdigital acquisition system. The duration of recor-ding was for a minimum of 3 h and a maximumof 26 h. In estimating the site response, Nakamuratechnique has been widely used and the resonancefrequency is obtained by evaluating the horizon-tal to vertical spectral ratios (Nakamura 1989).
Seismic microzonation of Bangalore, India 849
Table 5. Predominant frequency ranges.
NumbersPredominantfrequency Using Usingrange (Hz) Symbols SPT MASW
3.0 to 5.0 3 3
5.1 to 7.0 6 9
7.1 to 9.0 8 9
9.1 to 11.0 9 7
11.1 to 12.5 8 5
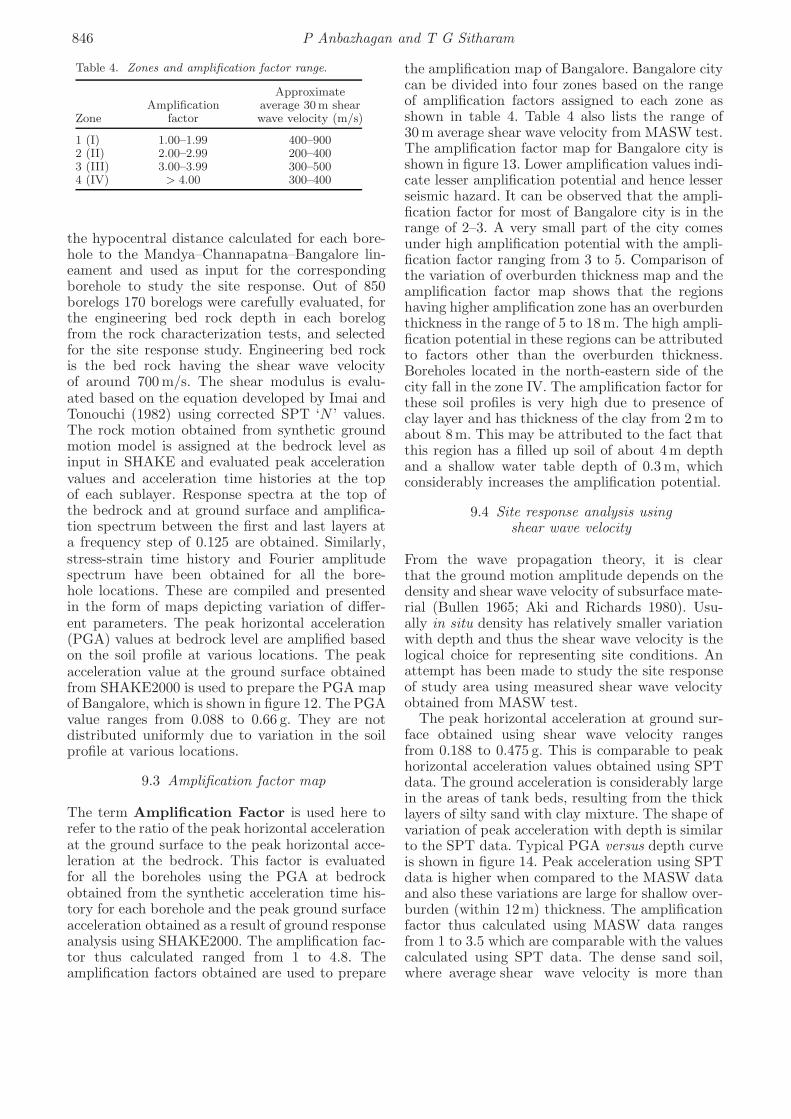
The spectra and the H/V ratios have been com-puted using the JSESAME program. Site responsestudies using SPT and MASW data shows thatthe predominate frequency of Bangalore soil variesfrom 5 to 12 Hz. But microtremor studies show thatthe predominant frequency of Bangalore soil variesfrom 1.5 to 12 Hz. Hence a comparative study hasbeen carried out using microtremor results and the-oretical studies based on SPT and MASW data. Atabout 43 locations both microtremor and MASWtests are comparatively closer to each other, andthese results are used to compare. The predom-inant frequency estimated from microtremor andestimated form site response using MASW areshown in figure 17. In figure 17, the values reportedon the left side of the symbol are obtained usingMASW based site response study and valuesreported on the right side of the symbols areobtained using microtremor experiments. Figure 17clearly shows that at most of the locations pre-dominant frequency from both the method matchesvery well. Most of the study area, predominant
Figure 17. Predominant frequency from microtremor and site response using shear wave velocity.
Table 6. Predominant frequency using site response studyand microtremor.
NumbersPredominantfrequency Using Usingrange (Hz) Symbols MASW microtremor
3.0 to 5.0 7 16
5.1 to 7.0 15 10
7.1 to 9.0 11 5
9.1 to 11.0 6 2
11.1 to 12.5 4 3
1.5 to 2.9 – 7
frequency is ranging from 3 to 12 Hz except atseven locations based on microtremor studies (seetable 6). The lower predominant frequency may beattributed due to the topographical effects, whichis not accounted in theoretical one-dimensionalground response analysis.
10. Factor of safety against liquefaction
To study the liquefaction hazard in Bangalore, theliquefaction hazard assessment has been carriedout using standard penetration test (SPT) dataand soil properties. Factor of safety against lique-faction of soil layers have been evaluated based onthe simplified procedure of Seed and Idriss (1971)and subsequent revisions of Seed et al (1983); Youdet al (2001) and Cetin et al (2004). Cyclic StressRatio (CSR) resulting from earthquake loading iscalculated by considering moment magnitude of 5.1

850 P Anbazhagan and T G Sitharam
Fig
ure
18.
Distr
ibution
offa
ctor
safe
tyagain
stliquef
act
ion.

Seismic microzonation of Bangalore, India 851
and amplified peak ground acceleration at groundsurface. Cyclic Resistant Ratio (CRR) is arrivedusing the corrected SPT ‘N ’ values and soil prop-erties. Detailed procedures and analysis are avail-able in Sitharam et al (2007). Figure 18 showsthe map of factor of safety against liquefaction(FS) for Bangalore city to the earthquake of 5.1 inmoment magnitude. Out of 620 locations, liquefac-tion analyses indicate that the factor of safety isless than one in 4.2% of total locations. Factor ofsafety of 1 to 2 and 2 to 3 is in about 14.7% and12.5% of the total locations respectively. Factor ofsafety of more than 3 is in about 68% of the totallocations. Typical borelogs obtained from locationswhere factor of safety of less than one clearly showsvery loose silty sand with clay and sand up to adepth of about 6 m. Soil in these locations is classi-fied as loose to medium sand having very low field‘N ’ values (less than 8). Also in these locationswater table has been met at 1.2 m from the groundlevel. Hence, above factors may be attributed to alow factor of safety in these locations. The studyshows that the areas in Bangalore is safe againstliquefaction except at few locations where the over-burden is sandy silt with presence of shallow watertable.
11. Conclusions
This study shows that, expected peak groundacceleration (PGA) at rock level using DSHA forBangalore is about 0.15 g. Based on large amountof borehole data with SPT ‘N ’ values, 3-D geotech-nical borehole model has been generated using GIS.Field ‘N ’ values were corrected for various cor-rections. The site characterization of Bangaloreis attempted using measured shear wave velocityfrom Multichannel Analysis of Surface Wave. Aver-age shear wave velocity at each 5 m interval upto a depth of 30 m was evaluated and presented.Based on soil average shear wave velocity and 30 maverage shear wave velocity, as per NEHRP andIBC, Bangalore is classified as “Site class D”. The-oretical 1-D site response study shows that theamplification factor is in the range of 1 to 4.7and predominant frequency varies from 3 to 12 Hz.The results of site response studies using SPTdata and MASW data are comparable. Groundresponse parameters evaluated using MASW dataare slightly lower when compared to the para-meters obtained using SPT data. Field study ofmicrotremor also shows similar values of predom-inant frequencies for the selected sites. Predomi-nant frequency obtained from these three methodsmatches very well. Liquefaction hazard map hasbeen generated using factor of safety against lique-faction. Liquefaction study shows that Bangalore
is safe against liquefaction except at few locationswhere the overburden is sandy silt with presence ofshallow water table.
Acknowledgements
Authors thank the Department of Scienceand Technology (DST), Seismology Division,Govt. of India for funding the project “Seis-mic Microzonation of Bangalore” (Ref. no.DST/23(315)/SU/2002 dated October 2003).ISRO–IISc Space Technology Cell, Indian Instituteof Science, Bangalore, India for funding the projecttitled “Use of remote sensing and GIS for Seis-mic Hazard Analyses of southern India” (Ref. no.ISTC/CCE/TGS/195/2007 dated 7 March 2007).
References
Aki K and Richards P G 1980 Quantitative Seismology;Freeman and Co., New York.
Atkinson G M and Boore D M 1995 Ground-motion Rela-tions for Eastern North America; Bull. Seismol. Soc. Am.85(1) 17–30.
Bansal B K and Vandana C 2007 Microzonation Studiesin India: DST initiatives; Proceedings of Workshop onMicrozonation, Indian Institute of Science, Bangalore,1–6.
Boore D M 1983 Stochastic simulation of high-frequencyground motions based on seismological models ofthe radiated spectra; Bull. Seismol. Soc. Am. 731865–1894.
Boore D M 2003 Simulation of ground motion using thestochastic method; Pure Appl. Geophys. 160 635–675.
Bullen K E 1965 An introduction to the theory of seismo-logy; Cambridge Univ. Press, Cambridge, U.K.
Cetin K O, Seed R B, Kiureghian A D, Tokimatsu K,Harder L F Jr., Kayen R E and Moss R E S 2004 Stan-dard penetration test-based probabilistic and determinis-tic assessment of seismic soil liquefaction potential; Jour-nal of Geotechnical and Geoenvironmental Engineering12 1314–1340.
Dobry R, Borcherdt R D, Crouse C B, Idriss I M,Joyner W B, Martin G R, Power M S, Rinne E E andSeed R B 2000 New site coefficients and site classificationsystem used in recent building seismic code provisions;Earthquake Spectra 16 41–67.
Ganesha Raj K and Nijagunappa R 2004 Major Linea-ments of Karnataka State and their Relation to Seismic-ity; Remote Sensing Based Analysis, J. Geol. Soc. India63 430–439.
GovindaRaju L, Ramana G V, HanumanthaRao C andSitharam T G 2004 Site specific ground response analy-sis, Special section; Geotechnics and Earthquake Hazards,Curr. Sci. 87(10) 1354–1362.
Heaton, Tajima T F and Mori A W 1986 Estimating Groundmotions using recorded Accelerograms; Surveys in Geo-physics 8 25–83.
Hwang H and Huo J R 1997 Attenuation relations ofground motion for rock and soil sites in eastern UnitedStates; Soil Dynamics and Earthquake Engineering 16363–372.

852 P Anbazhagan and T G Sitharam
Idriss I M and Boulanger R W 2004 Semi-empiricalprocedures for evaluating liquefaction potential dur-ing earthquakes; Proc. 11th International Conferenceon Soil Dynamics and Earthquake Engineering, and3rd International Conference on Earthquake Geotechni-cal Engineering (eds) Doolin D et al, Stallion Press, 132–56.
Idriss I M and Sun J I 1992 User’s Manual for SHAKE91;Center for Geotechnical Modeling, Department of Civiland Environmental Engineering, Univ. of California,Davis, CA, USA, 12.
Imai T and Tonouchi K 1982 Correlation of N-value withS-wave velocity and shear modulus; Proceedings, 2ndEuropean Symposium on Penetration Testing, Amster-dam 57–72.
Iyengar R N and Raghukanth S T G 2004 Attenuation ofStrong Ground Motion in Peninsular India; SeismologicalResearch Letters 75(4) 530–540.
Kanli A I, Tildy P, Pronay Z, Pinar A and Hemann L2006 V s30 mapping and soil classification for seismic siteeffect evaluation in Dinar region, SW Turkey; GeophysicsJ. Int. 165 223–235.
Nakamura Y 1989 Earthquake Alarm System for JapanRailways; Japanese Railway Engineering 28(4) 3–7.
Pearce J T and Baldwin J N 2005 Liquefaction Suscepti-bility Mapping ST. Louis, Missouri and Illinois – FinalTechnical Report; Published in web.er.usgs.gov/reports/abstract/2003/cu/03HQGR0029.pdf.
Regulatory Guide 1.165 1997 Identification and char-acterization of seismic sources and determination ofsafe shutdown earthquake ground motion; Publishedby U.S. Nuclear Regulatory Commission, USNRC,March 1997.
Schnabel P B 1973 Effects of Local Geology and Distancefrom Source on Earthquake Ground Motion; Ph.D. The-sis, University of California, Berkeley, California.
Schnabel P B, Lysmer J and Seed H Bolton 1972 SHAKE:A Computer Program for Earthquake Response Analy-sis of Horizontally Layered Sites; Earthquake Enginee-ring Research Center, University of California, Berkeley :Report No. UCB/EERC-72/12: 102.
Seed H B and Idriss I M 1971 Simplified procedure forevaluating soil liquefaction potential; Journal of theSoil Mechanics and Foundation Division, ASCE 97(9)1249–1274.
Seed H B and Idriss I M 1970 Soil Moduli and Dam-ping Factors for Dynamic Response Analyses; EarthquakeEngineering Research Center, University of California,Berkeley, California, Rep. No. EERC-70/10.
Seed H B, Idriss I M and Arango I 1983 Evaluation ofLiquefaction potential Using Field Performance Data;J. Geotech. Engg. 9(3) 458–482.
Seed H B, Tokimatsu K, Harder L F and Chung R M 1985The influence of SPT procedures in soil liquefaction resis-tance evaluations; J. Geotech. Engg., ASCE 111(12)1425–1445.
SEISAT 2000 Seismotectonic Atlas of India; Published byGeological Survey of India.
Sitharam T G and Anbazhagan P 2007 Seismic HazardAnalysis for the Bangalore Region; Natural Hazards 40261–278.
Sitharam T G, Anbazhagan P and Ganesha Raj K 2006 Useof remote sensing and seismotectonic parameters for seis-mic hazard analysis of Bangalore; Natural Hazards EarthSystem Sci. 6 927–939.
Sitharam T G, Anbazhagan P and Mahesh G U 2007Liquefaction Hazard Mapping using SPT Data; IndianGeotechnical Journal 37(3) 210–226.
Sitharam T G, Srinivasa Murthy B R and Aravind Kolge2001 A Post-Mortem of the Collapse of Structures inAhmedabad during the Bhuj Earthquake; Proceedings,Indian Geotechnical Conference I 344–347.
TC4-ISSMGE 1999 Manual for Zonation on SeismicGeotechnical Hazard; Revised edition, Technical Commit-tee for Earthquake Geotechnical Engineering (TC4) of theInternational Society of Soil Mechanics and GeotechnicalEngineering (ISSMGE), 209.
Tripathi J N and Ugalde A 2004 Regional estimation ofQ from seismic coda observations by the Gauribidanurseismic array (southern India); Physics of the Earth andPlanetary Interiors 145 115–126.
Wells D L and Coppersmith K J 1994 New empiricalrelationships among magnitude, rupture length, rupturewidth, rupture area, and surface displacement; Bull. Seis-mol. Soc. Am. 84 975–1002.
Xia J, Miller R D and Park C B 1999 Estimation of near-surface shear-wave velocity by inversion of Rayleigh wave;Geophysics 64(3) 691–700.
Youd T L, Idriss I M, Andrus R D, Arango I, Castro G,Christian J T, Dobry R, Liam Finn W D, Harder Jr. L H,Hynes M E, Ishihara K, Koester J P, Liao S S C,Marcuson W F, Marting G R, Mitchell J K, Moriwaki Y,Power M S, Robertson P K, Seed R B and Stokoe K H2001 Liquefaction Resistance of Soils: Summary fromthe 1996 NCEER and 1998 NCEER/NSF Workshopson Evaluation of Liquefaction Resistance of Soils; Jour-nal of Geotechnical and Geoenvironmental Engineering127(10) 817–833.
MS received 28 September 2007; revised 1 April 2008; accepted 2 April 2008

Reproduced with permission of the copyright owner. Further reproduction prohibited without permission.