LR PRESENTATION
26
Risk factors and determinants of most malignant cancer types globally and future challenges for public health specialists to reduce cancer rates Author: Athanasios Andriopoulos Supervisor: Carina Källestål Global Health course/ IMCH November 2016, Uppsala/ Sweden
-
Upload
thanos-andriopoulos -
Category
Documents
-
view
23 -
download
0
Transcript of LR PRESENTATION
Risk factors and determinants of most malignant cancer types globally and future challenges for public health specialists to reduce cancer rates
Author: Athanasios Andriopoulos Supervisor: Carina Källestål
Global Health course/ IMCH
November 2016, Uppsala/ Sweden
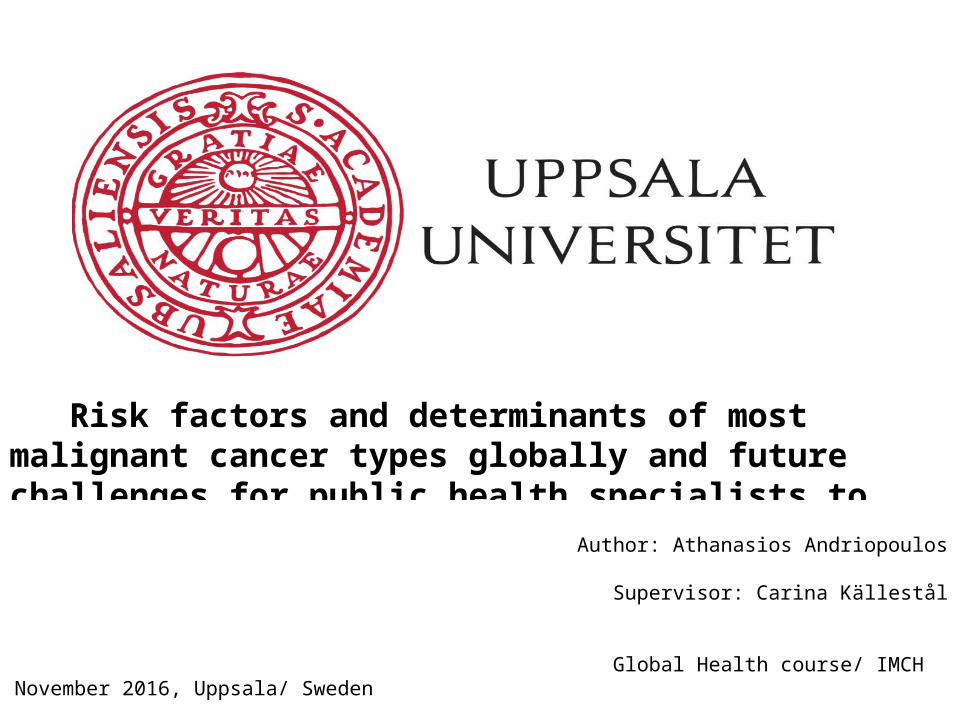
What is Cancer?
• The second most fatal disease currently• It is a NCD• Characterised by the unreasonable and
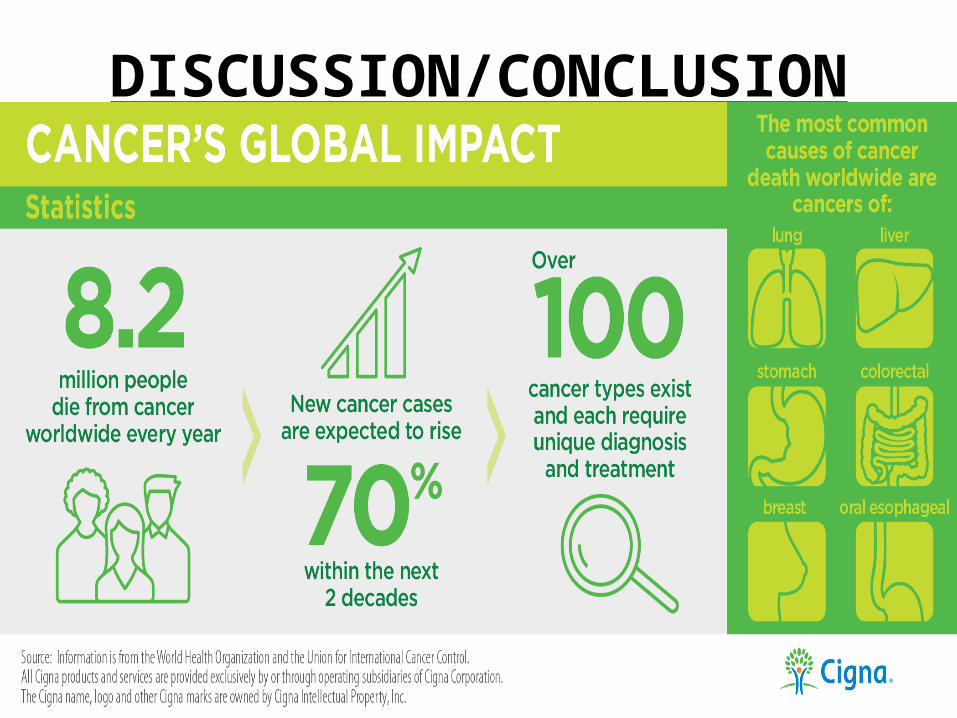
uncontrollable cell proliferation• 14 millions/ year are diagnosed• 8.2 million victims/ year• By 2030 we expect an increase around 70% in
cancer rates
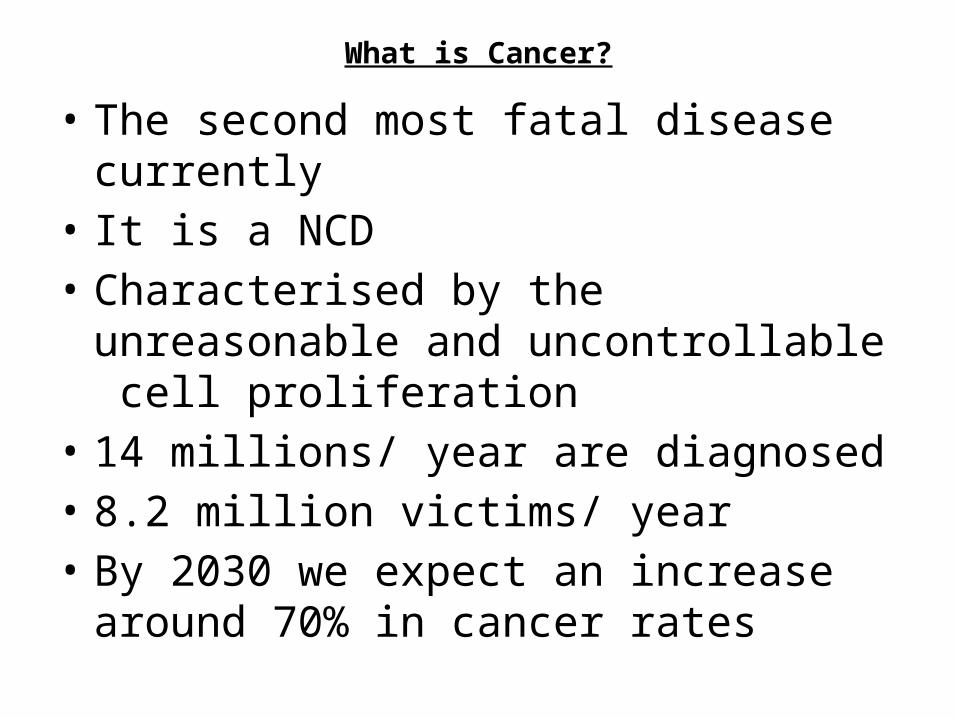
Defining Malignancy
MALIGNANT CANCER TYPES BENING CANCER TYPES
•They are Metastatic •Cancer cells unable to expand to nearby organs
•Such tumors grow quickly •Such tumors grow in a short pace
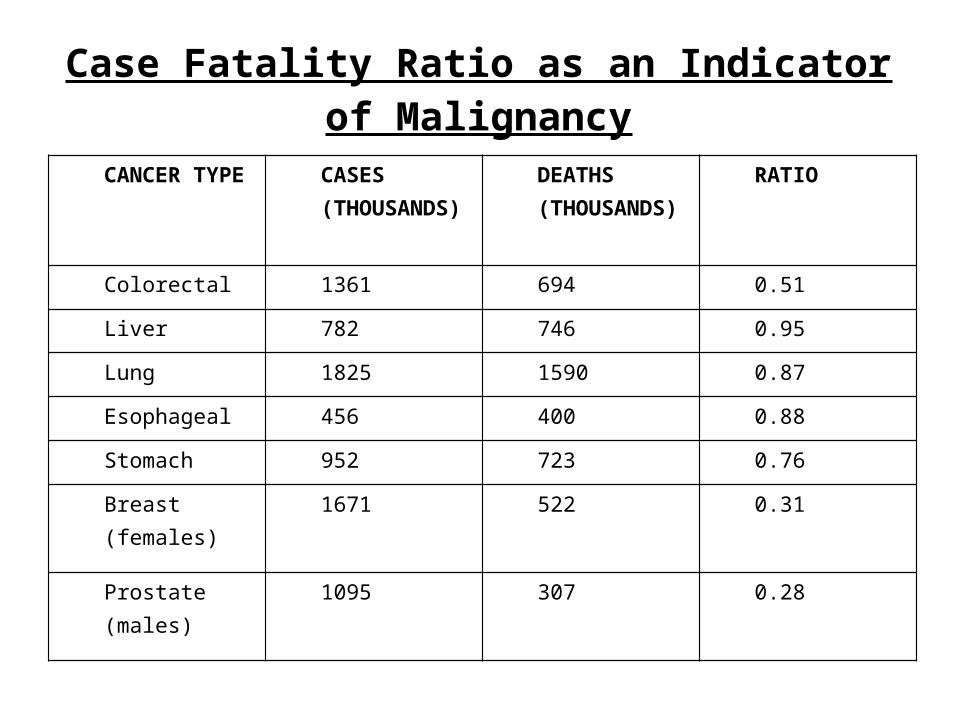
Case Fatality Ratio as an Indicator of Malignancy
CANCER TYPE CASES (THOUSANDS)
DEATHS (THOUSANDS)
RATIO
Colorectal 1361 694 0.51
Liver 782 746 0.95
Lung 1825 1590 0.87
Esophageal 456 400 0.88
Stomach 952 723 0.76
Breast (females) 1671 522 0.31
Prostate (males) 1095 307 0.28
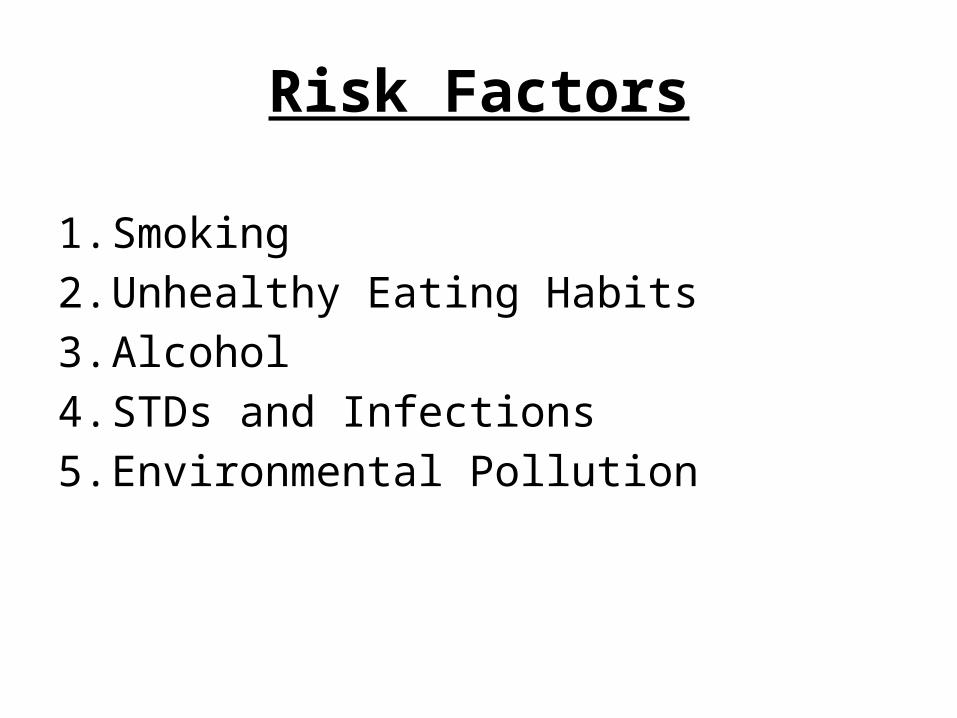
Risk Factors
1. Smoking2. Unhealthy Eating Habits3. Alcohol4. STDs and Infections5. Environmental Pollution
1) Smoking
• Leading cause of most cancer types• 18.75% of cancer deaths due to tobacco use• Lung, Pancreatic and Esophageal Cancer• Non-smokers: 30 times less likely to have lung
cancer• Snus/ Chewing Tobacco: Esophageal and
Pancreatic cancer
2) Unhealthy Eating Habits
• Red Meat and Trans Fat• Stomach, Esophageal, Colorectal, Breast, Prostate
Cancer• Cancer Patients with BMI>25 more likely to die• Obese Male Colorectal Cancer Patients: 25%
more likely to die• Obese Pancreatic Cancer Patients: Half chances to
survive• Distribution of fat in our body as in indicator of
possible cancer development
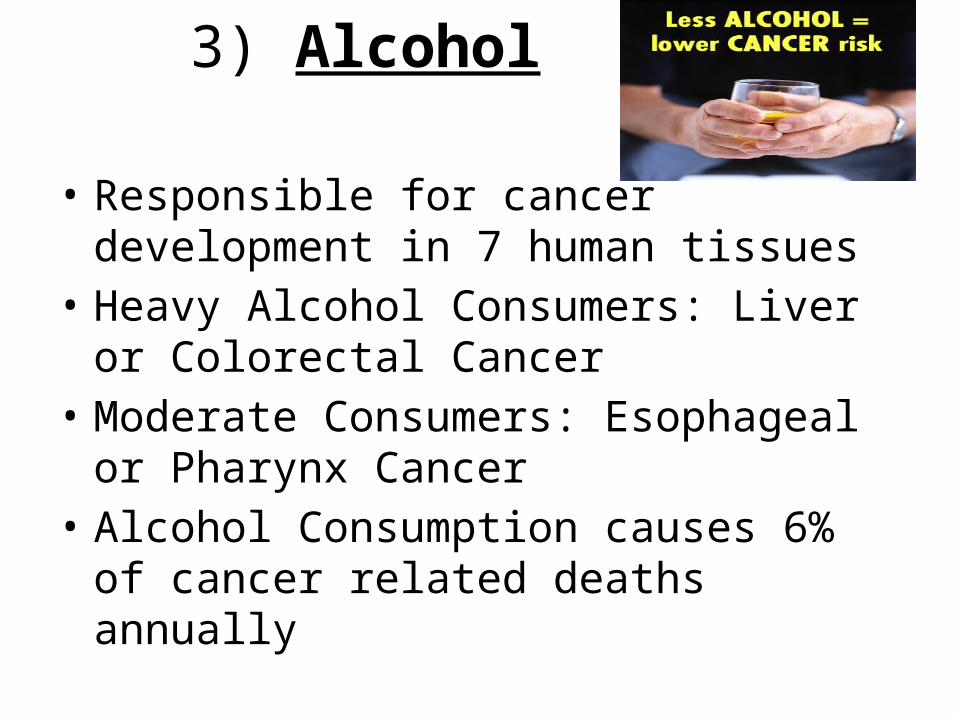
3) Alcohol
• Responsible for cancer development in 7 human tissues
• Heavy Alcohol Consumers: Liver or Colorectal Cancer
• Moderate Consumers: Esophageal or Pharynx Cancer
• Alcohol Consumption causes 6% of cancer related deaths annually
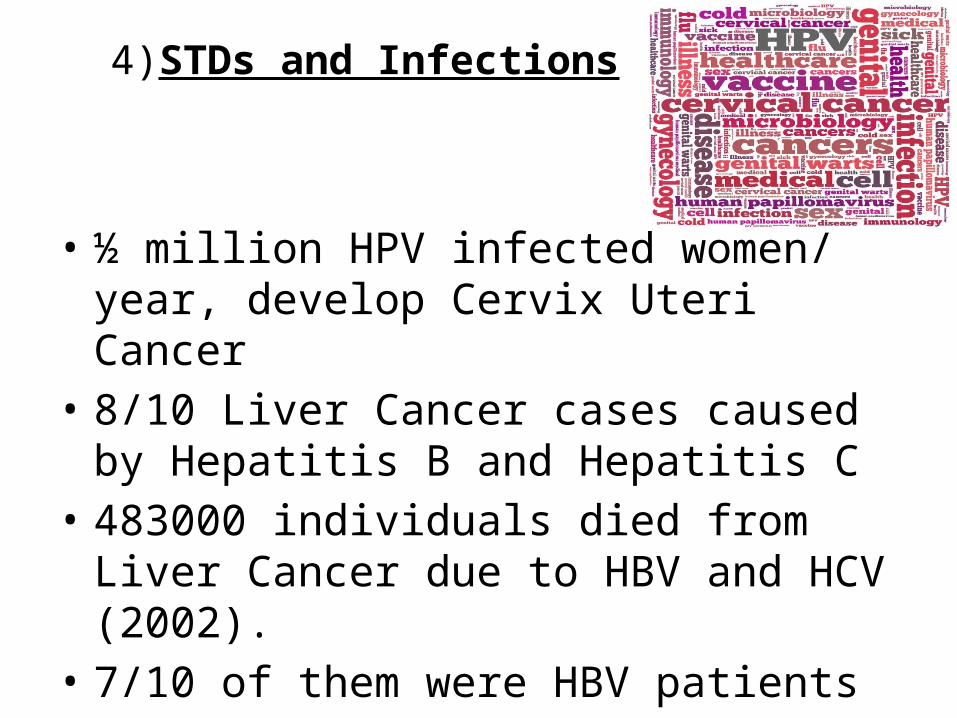
4)STDs and Infections
• ½ million HPV infected women/ year, develop Cervix Uteri Cancer
• 8/10 Liver Cancer cases caused by Hepatitis B and Hepatitis C
• 483000 individuals died from Liver Cancer due to HBV and HCV (2002).
• 7/10 of them were HBV patients• 3/10 of them were HCV patients
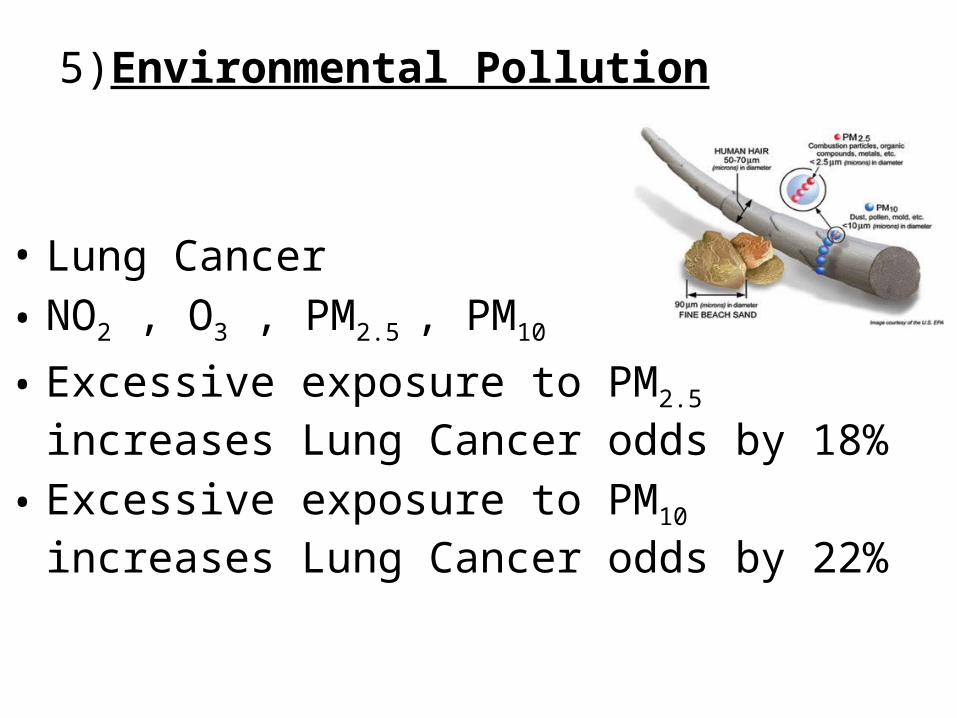
5)Environmental Pollution
• Lung Cancer• NO2 , O3 , PM2.5 , PM10
• Excessive exposure to PM2.5 increases Lung Cancer odds by 18%
• Excessive exposure to PM10 increases Lung Cancer odds by 22%
Cancer Determinants1. Gender2. Age3. Region (Ethnicity):• Sub Saharan Africa• Latin America and the Caribbean• Northern America• Eastern and Southern Asia• Europe• Northern Africa and Central and Western Asia
1)Gender• Men are more likely to develop cancer• Male cancer patients: 1 million more than the female ones• Male cancer victims: >1 million more than the female ones• Female Case Fatality Ratio: 0.53• Male Case Fatality Ratio: 0.62• 2012: 25% of Male cancer patients died due to Lung Cancer
(VS 14% of the Female Cancer Population)• 2012: 11.2% of Male cancer patients died due to Liver
Cancer (VS 6.3% of the Female Cancer Population)• Exception: Colorectal Cancer: Equal death rates for both
sexes
2)Age
• Cancer= Age-Related Disease• Most popular ages of cancer development in USA :1. 65 ± 1 years old2. 60-64 years old• 70 year old individuals: less likely to develop
cancer than 20 year olds• BUT, Younger cancer patients more likely to have a
5-year relative survival• Europe: ¼ of young cancer patients die in < 5 years
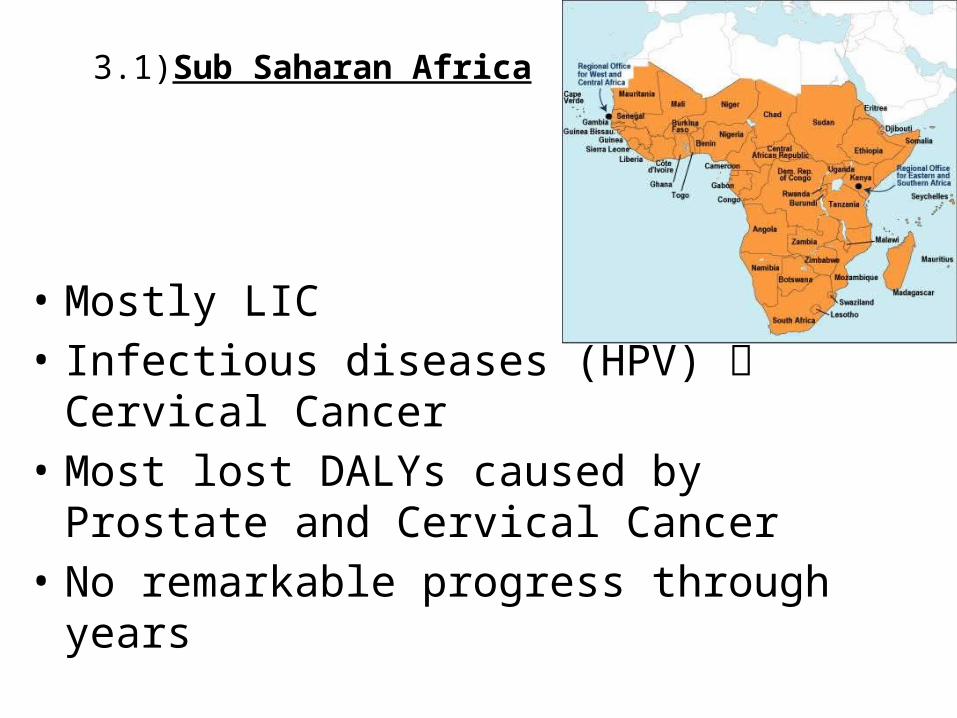
3.1)Sub Saharan Africa
• Mostly LIC• Infectious diseases (HPV) Cervical Cancer• Most lost DALYs caused by Prostate and Cervical
Cancer • No remarkable progress through years
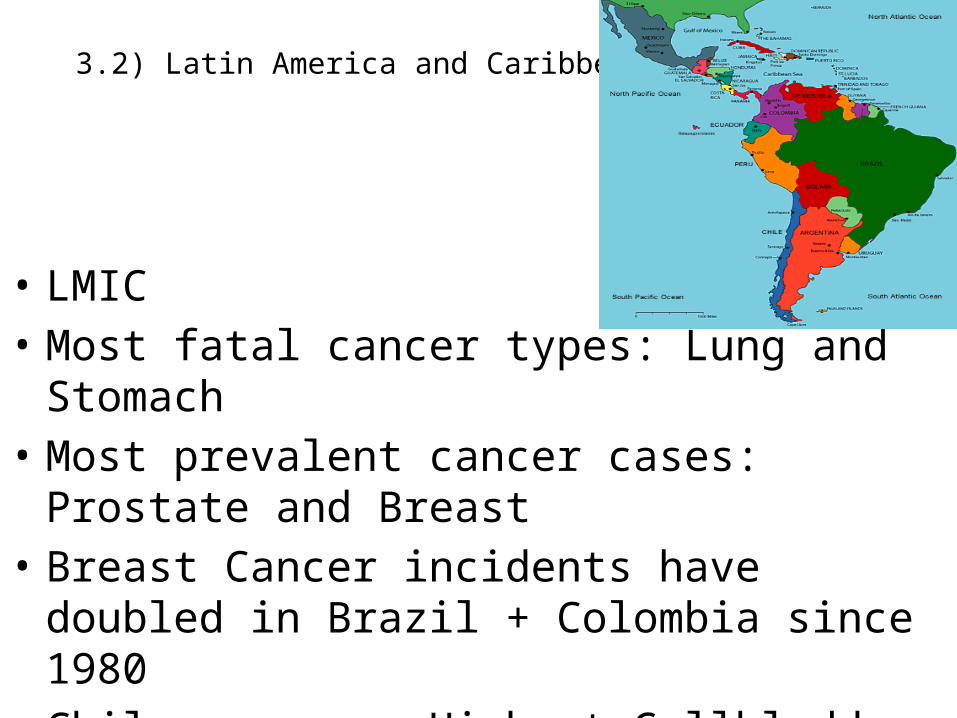
3.2) Latin America and Caribbean
• LMIC • Most fatal cancer types: Lung and Stomach• Most prevalent cancer cases: Prostate and Breast• Breast Cancer incidents have doubled in Brazil +
Colombia since 1980• Chilean women: Highest Gallbladder Cancer Rates • Overall Case Fatality Ratio: 0.59 (2012)
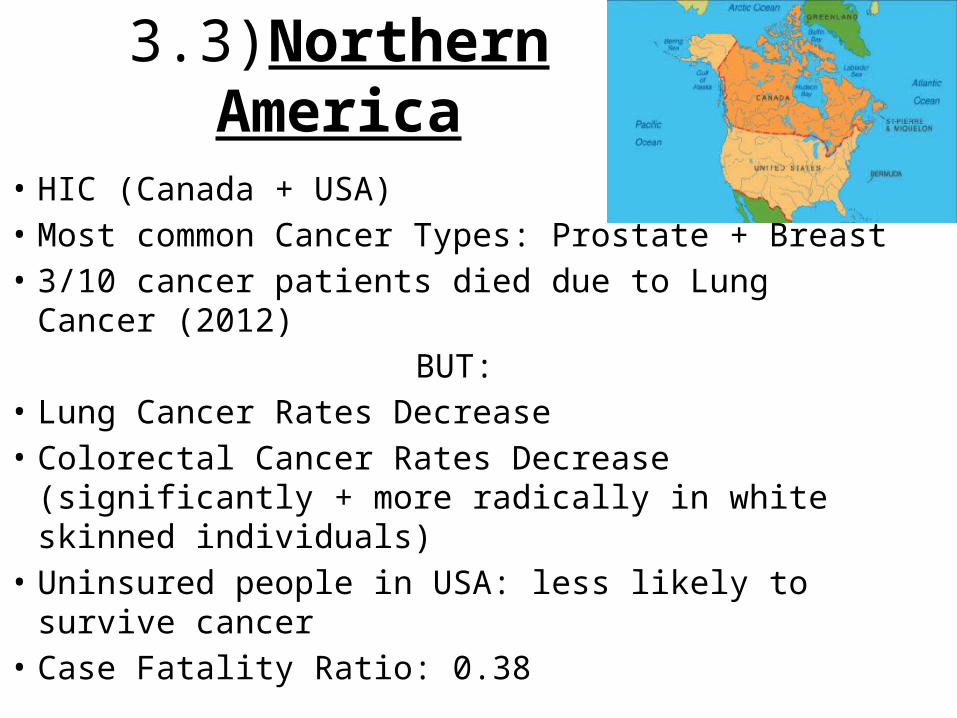
3.3)Northern America
• HIC (Canada + USA)• Most common Cancer Types: Prostate + Breast• 3/10 cancer patients died due to Lung Cancer (2012)
BUT:• Lung Cancer Rates Decrease• Colorectal Cancer Rates Decrease (significantly +
more radically in white skinned individuals)• Uninsured people in USA: less likely to survive cancer• Case Fatality Ratio: 0.38
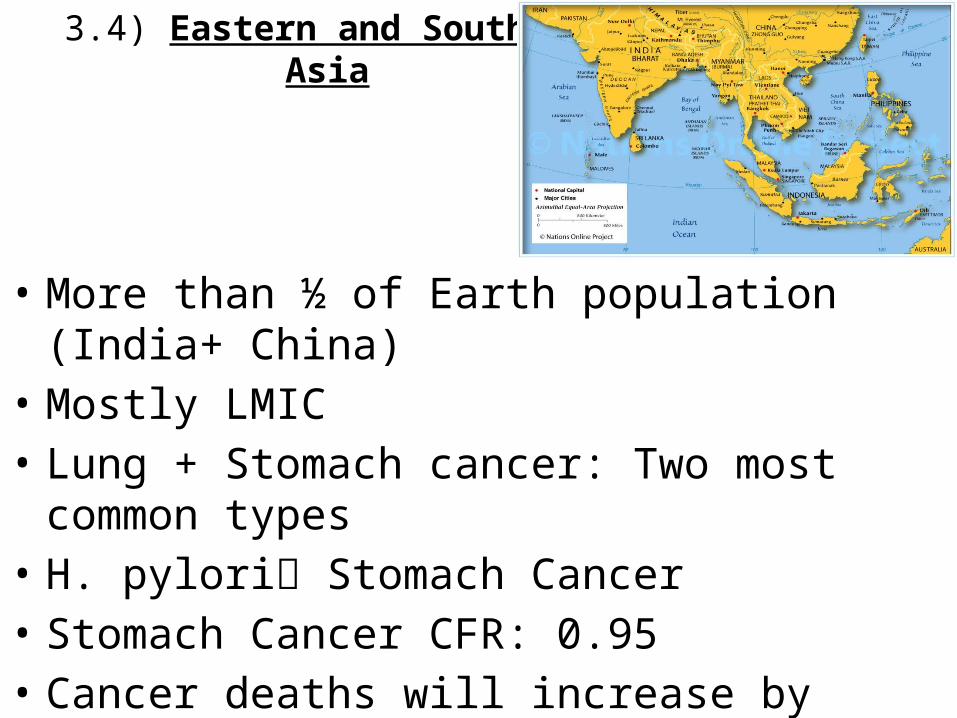
3.4) Eastern and Southern Asia
• More than ½ of Earth population (India+ China)• Mostly LMIC • Lung + Stomach cancer: Two most common types• H. pylori Stomach Cancer• Stomach Cancer CFR: 0.95• Cancer deaths will increase by 40% by 2025
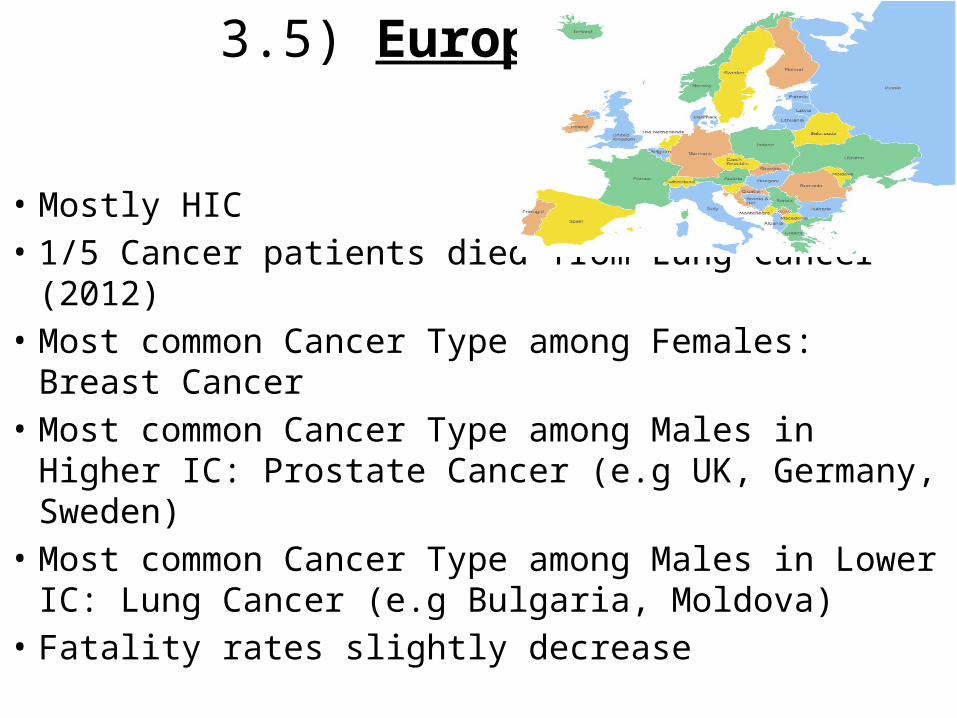
3.5) Europe
• Mostly HIC• 1/5 Cancer patients died from Lung Cancer (2012)• Most common Cancer Type among Females: Breast
Cancer• Most common Cancer Type among Males in Higher
IC: Prostate Cancer (e.g UK, Germany, Sweden)• Most common Cancer Type among Males in Lower
IC: Lung Cancer (e.g Bulgaria, Moldova)• Fatality rates slightly decrease
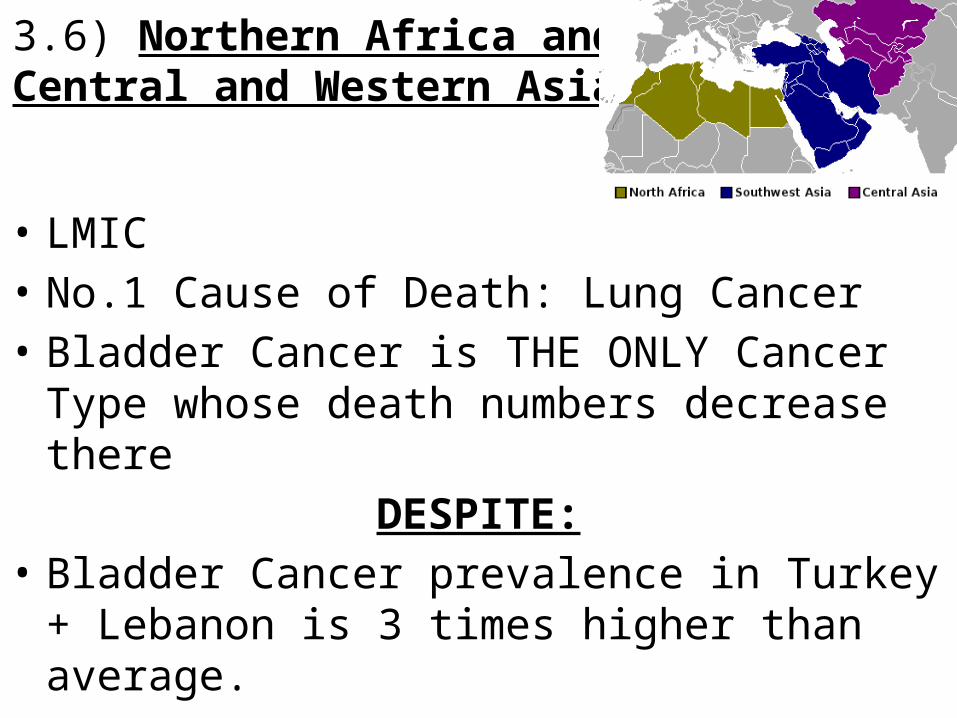
3.6) Northern Africa and Central and Western Asia
• LMIC• No.1 Cause of Death: Lung Cancer• Bladder Cancer is THE ONLY Cancer Type whose
death numbers decrease thereDESPITE:
• Bladder Cancer prevalence in Turkey + Lebanon is 3 times higher than average.
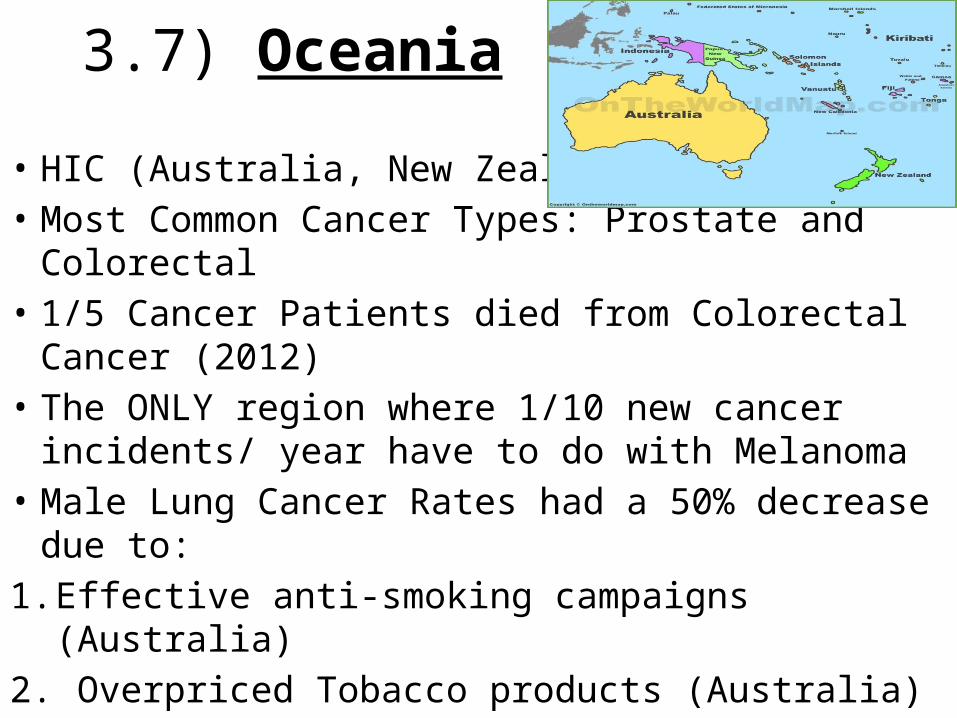
3.7) Oceania
• HIC (Australia, New Zealand)• Most Common Cancer Types: Prostate and
Colorectal• 1/5 Cancer Patients died from Colorectal Cancer
(2012)• The ONLY region where 1/10 new cancer incidents/
year have to do with Melanoma• Male Lung Cancer Rates had a 50% decrease due to:1. Effective anti-smoking campaigns (Australia)2. Overpriced Tobacco products (Australia)
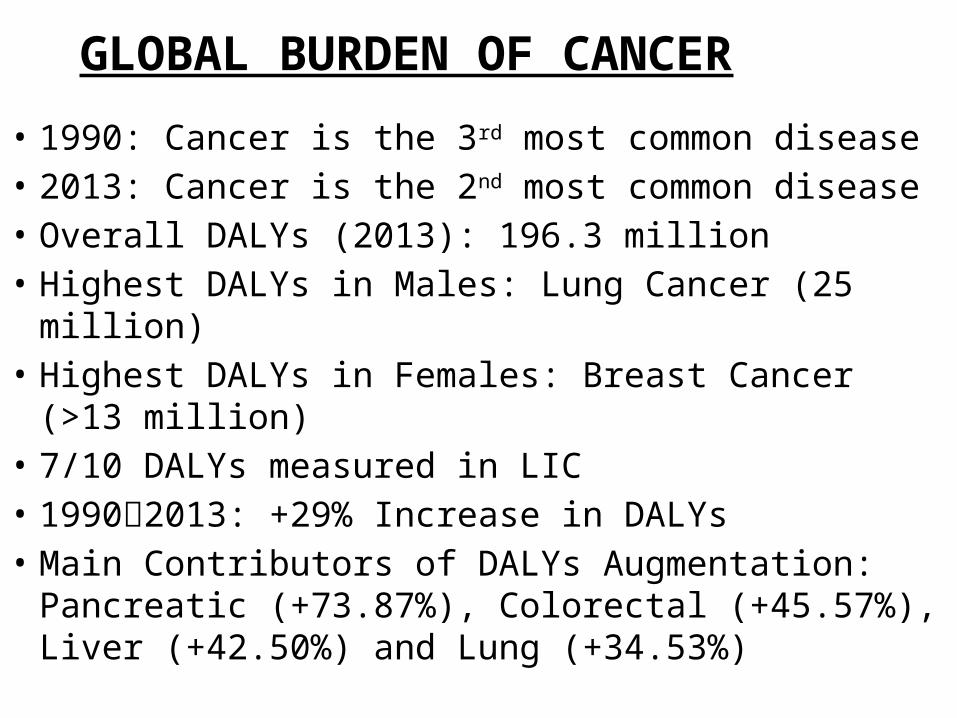
GLOBAL BURDEN OF CANCER
• 1990: Cancer is the 3rd most common disease• 2013: Cancer is the 2nd most common disease• Overall DALYs (2013): 196.3 million• Highest DALYs in Males: Lung Cancer (25 million)• Highest DALYs in Females: Breast Cancer (>13 million)• 7/10 DALYs measured in LIC• 19902013: +29% Increase in DALYs• Main Contributors of DALYs Augmentation:
Pancreatic (+73.87%), Colorectal (+45.57%), Liver (+42.50%) and Lung (+34.53%)
DISCUSSION/CONCLUSION
What should P.H specialists do?• Anti-cancer campaigns are NOT ENOUGH!!!
• P.H professionals should:CollaborateAnalyse Global Cancer DataFocus on Regions with Poor Survival Rates
• Cooperation with Pharmaceutical Companies:Free Vaccinations Reduce Virus-Related Cancer
Deaths
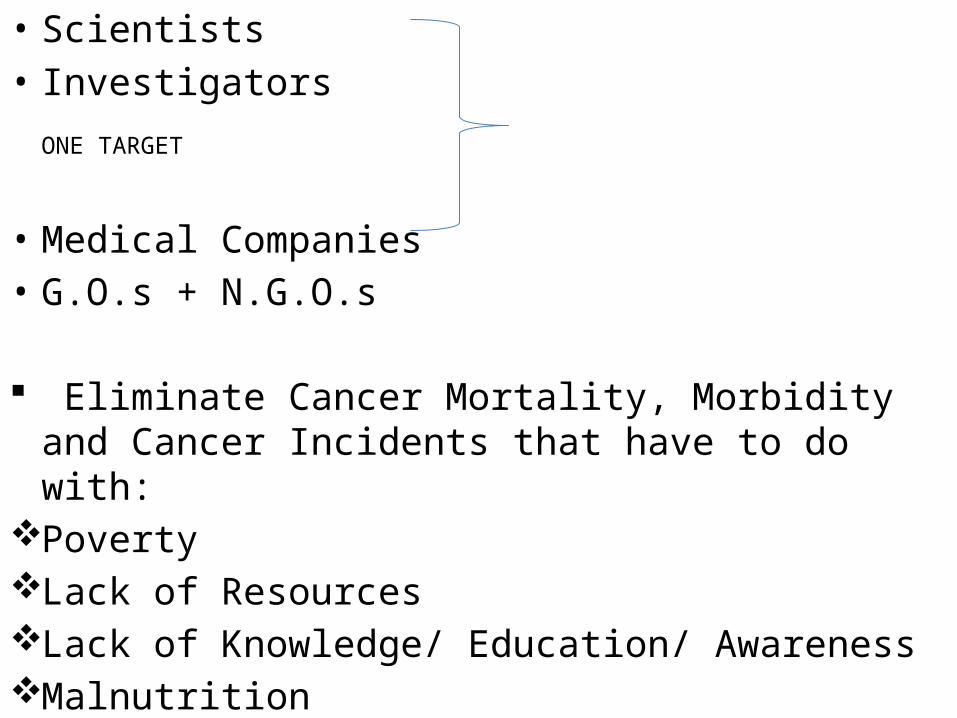
• Scientists• Investigators ONE TARGET
• Medical Companies • G.O.s + N.G.O.s
Eliminate Cancer Mortality, Morbidity and Cancer Incidents that have to do with:
PovertyLack of ResourcesLack of Knowledge/ Education/ AwarenessMalnutritionInfectious Diseases
ANY QUESTIONS?

THANK YOU FOR YOUR ATTENTION!