
LOOKING AFTER CHILDREN In Ontario: Parenting, Good ...Looking After Children: Ontario Provincial...
30
L L O O O O K K I I N N G G A A F F T T E E R R C C H H I I L L D D R R E E N N I I n n O O n n t t a a r r i i o o : : G G o o o o d d P P a a r r e e n n t t i i n n g g , , G G o o o o d d O O u u t t c c o o m m e e s s O O N N T T A A R R I I O O P P R R O O V V I I N N C C I I A A L L R R E E P P O O R R T T ( ( Y Y E E A A R R 1 1 3 3 ) ) Prepared by: Meagan Miller, OnLAC Research Coordinator & Robert Flynn, OnLAC Principal Investigator Centre for Research on Educational and Community Services, University of Ottawa September 2014 The collaboration and financial support of the Ontario Ministry of Children and Youth Services and the Ontario Association of Children’s Aid Societies are gratefully acknowledged.
Transcript of LOOKING AFTER CHILDREN In Ontario: Parenting, Good ...Looking After Children: Ontario Provincial...

LLOOOOKKIINNGG AAFFTTEERR CCHHIILLDDRREENN
IInn OOnnttaarriioo::
GGoooodd PPaarreennttiinngg,, GGoooodd OOuuttccoommeess
OONNTTAARRIIOO PPRROOVVIINNCCIIAALL RREEPPOORRTT
((YYEEAARR 1133))
Prepared by:
Meagan Miller, OnLAC Research Coordinator &
Robert Flynn, OnLAC Principal Investigator Centre for Research on Educational and Community Services, University of Ottawa
September 2014
The collaboration and financial support of the Ontario Ministry of Children and Youth Services and the Ontario Association of Children’s Aid Societies are gratefully acknowledged.

Looking After Children: Ontario Provincial Report (Year 13) 1
PPrreeffaaccee
This report is designed for use by child welfare organizations as a performance measurement system. The AAR outcome data available in this report should assist child welfare organizations in the development of an internal evaluation program. The AAR findings are intended to help supervisors, program managers, executive directors and board members within child welfare organizations monitor children’s outcomes on a regular basis by comparing children’s and youths’ developmental progress with intended goals. A second intended use of the AAR is to inform decision‐makers as to possible means of improving the quality and relevance of services on an ongoing basis.
Note: The AAR findings presented in this report must be reviewed and
interpreted carefully by child welfare organizations before new policies and services are implemented.
This report is also designed to provide policy‐makers with accurate, up‐to‐
date knowledge of system‐wide outcomes thereby fulfilling an accountability function and a guiding function in identifying policies and practices that promote continuous improvements in child welfare policies and practices.
The acronym ‘CAS’ appearing in the report represents the data for the
specific child welfare organization for which the report was prepared. ‘ON’ represents the Ontario sample.
A double hyphen (‐ ‐) in this report indicates that there was no data collected
on a specific variable for a specific group. Clarification is noted, where possible. Percentages were rounded.
Individual agency reports were generated for datasets with 20 or more young
people. Any comments and suggestions about this confidential report should be communicated to Meagan Miller at [email protected]
©Ontario Association of Children’s Aid Societies September, 2014

Looking After Children: Ontario Provincial Report (Year 13) 2
BBaacckkggrroouunndd IInnffoorrmmaattiioonn
TThhee BBaacckkggrroouunndd IInnffoorrmmaattiioonn sseeccttiioonn ooff tthhiiss rreeppoorrtt pprroovviiddeess bbaassiicc ssoocciioo‐‐ddeemmooggrraapphhiicc
iinnffoorrmmaattiioonn oonn tthhee yyoouunngg ppeeooppllee iinn ccaarree wwhhoo ccoommpplleetteedd aa YYeeaarr 1133 AAsssseessssmmeenntt aanndd AAccttiioonn
RReeccoorrdd ((AAAARR)),, tthheeiirr ccaarreeggiivveerrss,, aanndd tthheeiirr cchhiilldd wweellffaarree wwoorrkkeerrss..
WWhhoo aarree tthhee yyoouunngg ppeeooppllee lliivviinngg iinn ccaarree??
TTaabbllee 11..11:: GGeennddeerr aanndd aaggee ooff yyoouunngg ppeeooppllee wwhhoo ccoommpplleetteedd aa YYeeaarr 1133 AAAARR,, aanndd llaanngguuaaggee ooff tthhee
AAAARR ccoonnvveerrssaattiioonn..
TTaabbllee 11..22:: PPeerrcceennttaaggee ooff yyoouunngg ppeeooppllee wwhhoo ccoommpplleetteedd aa YYeeaarr 1133 AAAARR bbyy lleeggaall ssttaattuuss..
CCAASS OONN AAggee GGrroouupp 00‐‐44 55‐‐99 1100‐‐1155 1166‐‐2211 00‐‐44 55‐‐99 1100‐‐1155 1166‐‐2211
LLeeggaall
ssttaattuuss
CCrroowwnn WWaarrdd,, wwiitthh aacccceessss 44%% 2222%% 5533%% 6611%%
CCrroowwnn WWaarrdd 2299%% 3300%% 2255%% 2200%%
SSoocciieettyy WWaarrdd 2277%% 1188%% 1111%% 55%%
TTeemmppoorraarryy ccaarree aaggrreeeemmeenntt 22%% 22%% 22%% 00..44%%
IInntteerriimm ccaarree aanndd ccuussttooddyy 3333%% 2200%% 77%% 22%%
CCuussttoommaarryy ccaarree 55%% 88%% 33%% 00..44%%
EExxtteennddeedd CCaarree aanndd MMaaiinntteennaannccee ‐‐‐‐ ‐‐‐‐ ‐‐‐‐ 1100%%
OOtthheerr 00..44%% 00..55%% 00..22%% 00..88%%
CCAASS OONN
AAggee GGrroouupp SSaammppllee SSiizzee
00‐‐44 NN ==
55‐‐99 NN ==
1100‐‐1155 NN ==
1166‐‐2211 NN ==
00‐‐44 NN == 11004477
55‐‐99 NN == 11112244
1100‐‐1155 NN == 22666622
1166‐‐2211 NN == 11889944
GGeennddeerr MMaallee 5533%% 5577%% 5566%% 5544%%
FFeemmaallee 4488%% 4433%% 4444%% 4466%%
AAggee MMeeaann 22..00 77..11 1133..00 1166..77
MMeeddiiaann 22..00 77..00 1133..00 1177..00
LLaanngguuaaggee
EEnngglliisshh 9988%% 9988%% 9988%% 9977%%
FFrreenncchh 22%% 11%% 22%% 22%%
FFiirrsstt NNaattiioonnss oorr IInnuuiitt llaanngguuaaggee 00%% 00%% 00%% 00..11%%
OOtthheerr 00..22%% 00..22%% 00%% 00..44%%

Looking After Children: Ontario Provincial Report (Year 13) 3
IInn wwhhaatt sseettttiinnggss ddoo tthhee yyoouunngg ppeeooppllee lliivvee??
Table 1.3: Percentage of young people in Ontario in different placement settings.
CCAASS OONN AAggee GGrroouupp 00‐‐44 55‐‐99 1100‐‐1155 1166‐‐2211 00‐‐44 55‐‐99 1100‐‐1155 1166‐‐2211
PPllaacceemmeenntt
sseettttiinngg
FFoosstteerr hhoommee** 8800%% 6622%% 5500%% 3355%%
FFoosstteerr hhoommee**** 1111%% 1188%% 2200%% 1144%%
GGrroouupp hhoommee**** 00..33%% 33%% 1133%% 1166%%
KKiinnsshhiipp iinn ccaarree 66%% 1122%% 1111%% 66%%
GGrroouupp hhoommee** 00..33%% 33%% 22%% 22%%CChhiillddrreenn’’ss mmeennttaall hheeaalltthh
rreessiiddeennttiiaall ffaacciilliittyy 00%% 00..66%% 11%% 00..66%%
HHoossppiittaall 00..11%% 00%% 00%% 00%%
CCuussttoommaarryy ccaarree 22%% 33%% 00..77%% 00..11%%
CCuussttooddyy//DDeetteennttiioonn ffaacciilliittyy ‐‐‐‐ ‐‐‐‐ 00..22%% 00..66%%
WWiitthh bbiirrtthh ppaarreennttss 00%% 00%% 00..33%% 11%%
WWiitthh rreellaattiivveess ((nnoott iinn ccaarree)) 00%% 00%% 00..22%% 11%%
PPssyycchhiiaattrriicc ffaacciilliittyy 00%% 00%% 00..22%% 00%%
AAddooppttiioonn pprroobbaattiioonn 00..33%% 00..44%% 00..11%% 00%%
SShheelltteerr ‐‐‐‐ ‐‐‐‐ 00..11%% 00..33%%WWhheerreeaabboouuttss uunnkknnoowwnn oorr
uunnaapppprroovveedd ‐‐‐‐ ‐‐‐‐ 00..22%% 00..66%%
IInnddeeppeennddeenntt lliivviinngg ‐‐‐‐ ‐‐‐‐ 00%% 1188%%
OOtthheerr 00..11%% 00..55%% 00..77%% 33%%
*operated by a child welfare organization **outside purchased care
TTaabbllee 11..44:: RReeaassoonn((ss)) ffoorr aaddmmiissssiioonn ttoo ccaarree..
CCAASS OONN AAggee GGrroouupp 00‐‐44 55‐‐99 1100‐‐1155 1166‐‐2211 00‐‐44 55‐‐99 1100‐‐1155 1166‐‐2211
RReeaassoonnss
ffoorr
aaddmmiissssiioonn
ttoo ccaarree
PPhhyyssiiccaall hhaarrmm 2255%% 2277%% 2288%% 2233%%
SSeexxuuaall hhaarrmm 33%% 66%% 66%% 88%%
NNeegglleecctt 6655%% 6688%% 6622%% 4477%%
EEmmoottiioonnaall hhaarrmm 2266%% 4400%% 4400%% 3300%%
AAbbaannddoonnmmeenntt//SSeeppaarraattiioonn 77%% 1111%% 1188%% 2211%%
PPrroobblleemmaattiicc bbeehhaavviioouurr 11%% 88%% 1188%% 2233%%
DDoommeessttiicc vviioolleennccee 2222%% 2277%% 2222%% 1177%%
OOtthheerr 2200%% 1122%% 1111%% 1100%%
Note: respondents could select more than one option.
Looking After Children: Ontario Provincial Report (Year 13) 4
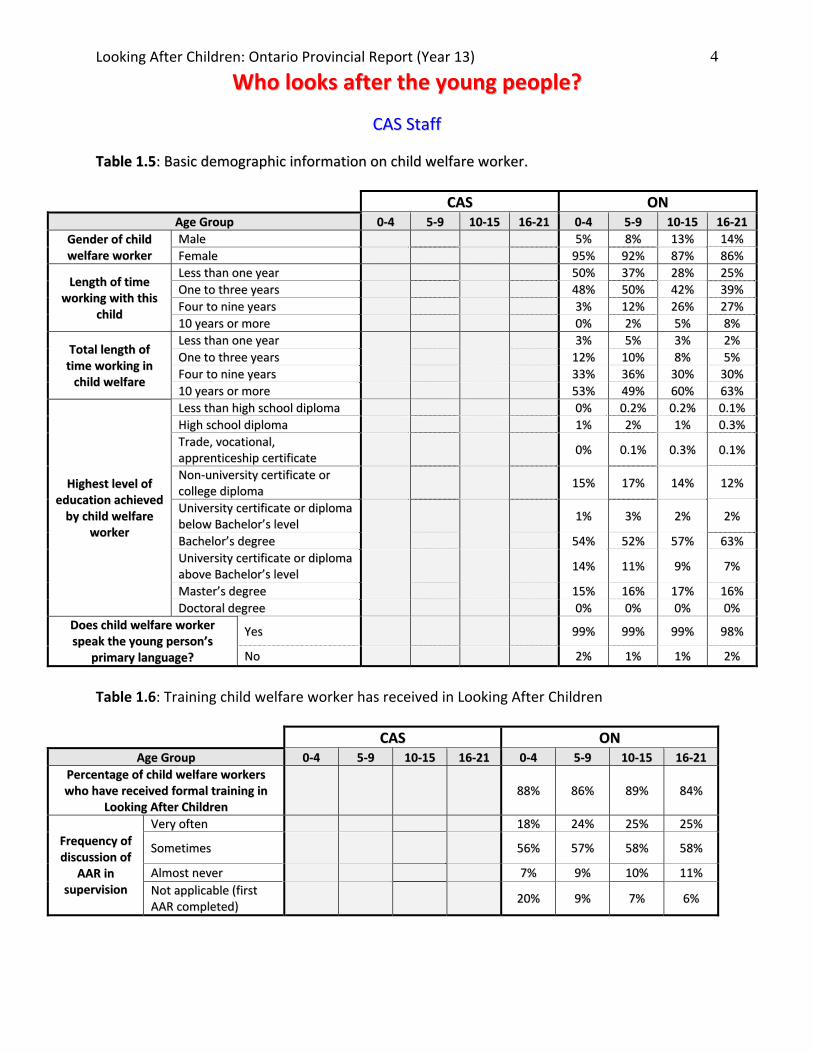
WWhhoo llooookkss aafftteerr tthhee yyoouunngg ppeeooppllee??
CCAASS SSttaaffff
TTaabbllee 11..55:: BBaassiicc ddeemmooggrraapphhiicc iinnffoorrmmaattiioonn oonn cchhiilldd wweellffaarree wwoorrkkeerr..
CCAASS OONN AAggee GGrroouupp 00‐‐44 55‐‐99 1100‐‐1155 1166‐‐2211 00‐‐44 55‐‐99 1100‐‐1155 1166‐‐2211
GGeennddeerr ooff cchhiilldd
wweellffaarree wwoorrkkeerr MMaallee 55%% 88%% 1133%% 1144%%
FFeemmaallee 9955%% 9922%% 8877%% 8866%%
LLeennggtthh ooff ttiimmee
wwoorrkkiinngg wwiitthh tthhiiss
cchhiilldd
LLeessss tthhaann oonnee yyeeaarr 5500%% 3377%% 2288%% 2255%%
OOnnee ttoo tthhrreeee yyeeaarrss 4488%% 5500%% 4422%% 3399%%
FFoouurr ttoo nniinnee yyeeaarrss 33%% 1122%% 2266%% 2277%%
1100 yyeeaarrss oorr mmoorree 00%% 22%% 55%% 88%%
TToottaall lleennggtthh ooff
ttiimmee wwoorrkkiinngg iinn
cchhiilldd wweellffaarree
LLeessss tthhaann oonnee yyeeaarr 33%% 55%% 33%% 22%%
OOnnee ttoo tthhrreeee yyeeaarrss 1122%% 1100%% 88%% 55%%
FFoouurr ttoo nniinnee yyeeaarrss 3333%% 3366%% 3300%% 3300%%
1100 yyeeaarrss oorr mmoorree 5533%% 4499%% 6600%% 6633%%
HHiigghheesstt lleevveell ooff
eedduuccaattiioonn aacchhiieevveedd
bbyy cchhiilldd wweellffaarree
wwoorrkkeerr
LLeessss tthhaann hhiigghh sscchhooooll ddiipplloommaa 00%% 00..22%% 00..22%% 00..11%%
HHiigghh sscchhooooll ddiipplloommaa 11%% 22%% 11%% 00..33%%
TTrraaddee,, vvooccaattiioonnaall,,
aapppprreennttiicceesshhiipp cceerrttiiffiiccaattee 00%% 00..11%% 00..33%% 00..11%%
NNoonn‐‐uunniivveerrssiittyy cceerrttiiffiiccaattee oorr ccoolllleeggee ddiipplloommaa
1155%% 1177%% 1144%% 1122%%
UUnniivveerrssiittyy cceerrttiiffiiccaattee oorr ddiipplloommaa bbeellooww BBaacchheelloorr’’ss lleevveell
11%% 33%% 22%% 22%%
BBaacchheelloorr’’ss ddeeggrreeee 5544%% 5522%% 5577%% 6633%%
UUnniivveerrssiittyy cceerrttiiffiiccaattee oorr ddiipplloommaa aabboovvee BBaacchheelloorr’’ss lleevveell
1144%% 1111%% 99%% 77%%
MMaasstteerr’’ss ddeeggrreeee 1155%% 1166%% 1177%% 1166%%
DDooccttoorraall ddeeggrreeee 00%% 00%% 00%% 00%%
DDooeess cchhiilldd wweellffaarree wwoorrkkeerr
ssppeeaakk tthhee yyoouunngg ppeerrssoonn’’ss
pprriimmaarryy llaanngguuaaggee??
YYeess 9999%% 9999%% 9999%% 9988%%
NNoo 22%% 11%% 11%% 22%%
Table 1.6: Training child welfare worker has received in Looking After Children
CCAASS OONN AAggee GGrroouupp 00‐‐44 55‐‐99 1100‐‐1155 1166‐‐2211 00‐‐44 55‐‐99 1100‐‐1155 1166‐‐2211
PPeerrcceennttaaggee ooff cchhiilldd wweellffaarree wwoorrkkeerrss
wwhhoo hhaavvee rreecceeiivveedd ffoorrmmaall ttrraaiinniinngg iinn
LLooookkiinngg AAfftteerr CChhiillddrreenn 8888%% 8866%% 8899%% 8844%%
FFrreeqquueennccyy ooff
ddiissccuussssiioonn ooff
AAAARR iinn
ssuuppeerrvviissiioonn
VVeerryy oofftteenn 1188%% 2244%% 2255%% 2255%%
SSoommeettiimmeess 5566%% 5577%% 5588%% 5588%%
AAllmmoosstt nneevveerr 77%% 99%% 1100%% 1111%%
NNoott aapppplliiccaabbllee ((ffiirrsstt
AAAARR ccoommpplleetteedd)) 2200%% 99%% 77%% 66%%
Looking After Children: Ontario Provincial Report (Year 13) 5
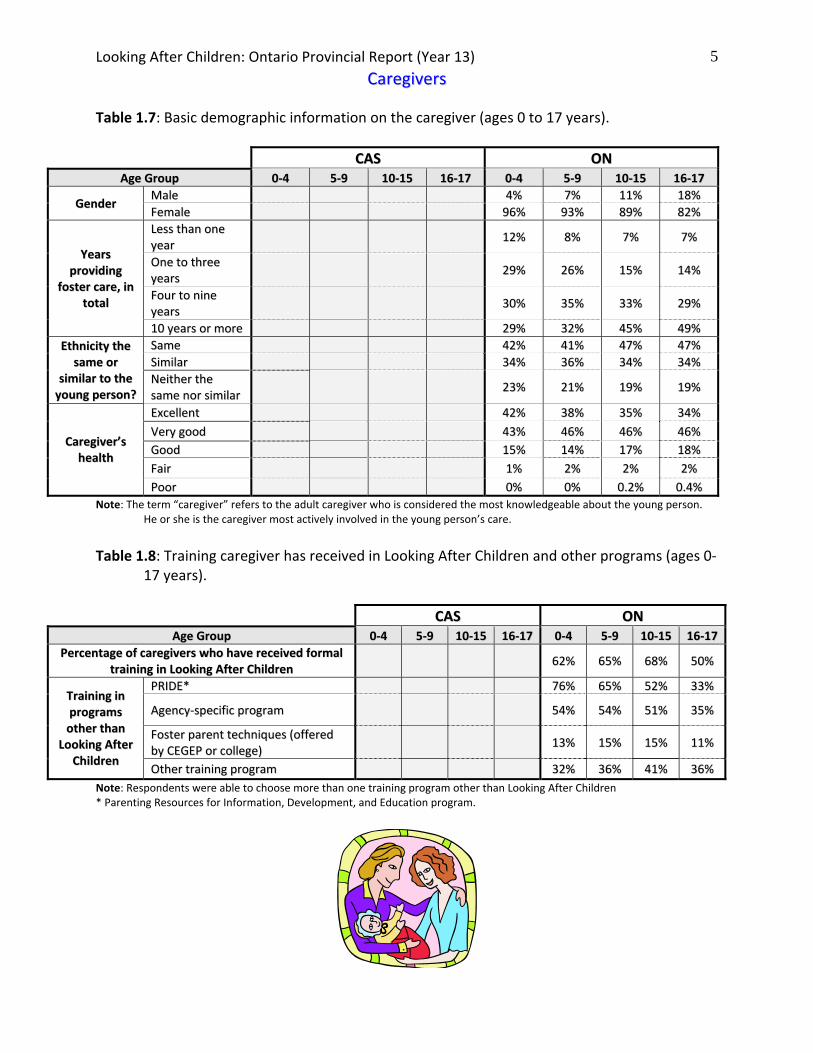
CCaarreeggiivveerrss
Table 1.7: Basic demographic information on the caregiver (ages 0 to 17 years).
CCAASS OONN AAggee GGrroouupp 00‐‐44 55‐‐99 1100‐‐1155 1166‐‐1177 00‐‐44 55‐‐99 1100‐‐1155 1166‐‐1177
GGeennddeerr MMaallee 44%% 77%% 1111%% 1188%%
FFeemmaallee 9966%% 9933%% 8899%% 8822%%
YYeeaarrss
pprroovviiddiinngg
ffoosstteerr ccaarree,, iinn
ttoottaall
LLeessss tthhaann oonnee
yyeeaarr 1122%% 88%% 77%% 77%%
OOnnee ttoo tthhrreeee
yyeeaarrss 2299%% 2266%% 1155%% 1144%%
FFoouurr ttoo nniinnee
yyeeaarrss 3300%% 3355%% 3333%% 2299%%
1100 yyeeaarrss oorr mmoorree 2299%% 3322%% 4455%% 4499%%
EEtthhnniicciittyy tthhee
ssaammee oorr
ssiimmiillaarr ttoo tthhee
yyoouunngg ppeerrssoonn??
SSaammee 4422%% 4411%% 4477%% 4477%%
SSiimmiillaarr 3344%% 3366%% 3344%% 3344%%
NNeeiitthheerr tthhee
ssaammee nnoorr ssiimmiillaarr 2233%% 2211%% 1199%% 1199%%
CCaarreeggiivveerr’’ss
hheeaalltthh
EExxcceelllleenntt 4422%% 3388%% 3355%% 3344%%
VVeerryy ggoooodd 4433%% 4466%% 4466%% 4466%%
GGoooodd 1155%% 1144%% 1177%% 1188%%
FFaaiirr 11%% 22%% 22%% 22%%
PPoooorr 00%% 00%% 00..22%% 00..44%%
Note: The term “caregiver” refers to the adult caregiver who is considered the most knowledgeable about the young person. He or she is the caregiver most actively involved in the young person’s care.
Table 1.8: Training caregiver has received in Looking After Children and other programs (ages 0‐
17 years).
CCAASS OONN AAggee GGrroouupp 00‐‐44 55‐‐99 1100‐‐1155 1166‐‐1177 00‐‐44 55‐‐99 1100‐‐1155 1166‐‐1177
PPeerrcceennttaaggee ooff ccaarreeggiivveerrss wwhhoo hhaavvee rreecceeiivveedd ffoorrmmaall ttrraaiinniinngg iinn LLooookkiinngg AAfftteerr CChhiillddrreenn
6622%% 6655%% 6688%% 5500%%
TTrraaiinniinngg iinn
pprrooggrraammss
ootthheerr tthhaann
LLooookkiinngg AAfftteerr
CChhiillddrreenn
PPRRIIDDEE** 7766%% 6655%% 5522%% 3333%%
AAggeennccyy‐‐ssppeecciiffiicc pprrooggrraamm 5544%% 5544%% 5511%% 3355%%
FFoosstteerr ppaarreenntt tteecchhnniiqquueess ((ooffffeerreedd bbyy CCEEGGEEPP oorr ccoolllleeggee))
1133%% 1155%% 1155%% 1111%%
OOtthheerr ttrraaiinniinngg pprrooggrraamm 3322%% 3366%% 4411%% 3366%%
Note: Respondents were able to choose more than one training program other than Looking After Children * Parenting Resources for Information, Development, and Education program.

Looking After Children: Ontario Provincial Report (Year 13) 6
WWhhaatt iiss tthhee tteemmppoorraall ssttaabbiilliittyy aassssoocciiaatteedd wwiitthh
ddiiffffeerreenntt ttyyppeess ooff ppllaacceemmeenntt sseettttiinnggss?? This section illustrates the stability associated with the top five placement settings for each age group, and overall for each age group.
Table 2.1: Measures of temporal stability by placement setting and overall (ages 0 to 17 years).
CCAASS OONN CCAASS OONN CCAASS OONN CCAASS OONN
AAggee GGrroouupp 00‐‐44 00‐‐44 55‐‐99 55‐‐99 1100‐‐1155 1100‐‐1155 1166‐‐1177 1166‐‐1177
AAvveerraaggee
yyeeaarrss iinn
ppllaacceemmeenntt
FFoosstteerr hhoommee 11..33 FFoosstteerr hhoommee 22..22 FFoosstteerr hhoommee 33..99 FFoosstteerr hhoommee 44..55
KKiinnsshhiipp 11..22 GGrroouupp hhoommee 11..66 GGrroouupp hhoommee 11..99 GGrroouupp hhoommee 11..88
CCuussttoommaarryy
CCaarree 11..66 KKiinnsshhiipp 22..99 KKiinnsshhiipp 55..66
IInnddeeppeennddeenntt
lliivviinngg 00..66
OOvveerraallll 11..33 OOvveerraallll 22..33 OOvveerraallll 33..77 OOvveerraallll 33..55
AAvveerraaggee
cchhaannggeess iinn
mmaaiinn
ccaarreeggiivveerr
ssiinnccee bbiirrtthh
FFoosstteerr hhoommee 22..44 FFoosstteerr hhoommee 33..44 FFoosstteerr hhoommee 44..22 FFoosstteerr hhoommee 44..88
KKiinnsshhiipp 22..44 GGrroouupp hhoommee 33..55 GGrroouupp hhoommee 55..77 GGrroouupp hhoommee 66..11
CCuussttoommaarryy
CCaarree 33..11 KKiinnsshhiipp 22..99 KKiinnsshhiipp 33..33
IInnddeeppeennddeenntt
lliivviinngg 66..88
OOvveerraallll 22..66 OOvveerraallll 33..33 OOvveerraallll 44..44 OOvveerraallll 55..33
AAvveerraaggee
cchhaannggeess iinn
ppllaaccee ooff
rreessiiddeennccee
ssiinnccee bbiirrtthh
FFoosstteerr hhoommee 33..00 FFoosstteerr hhoommee 44..33 FFoosstteerr hhoommee 55..44 FFoosstteerr hhoommee 66..11
KKiinnsshhiipp 33..22 GGrroouupp hhoommee 44..00 GGrroouupp hhoommee 66..44 GGrroouupp hhoommee 77..55
CCuussttoommaarryy
CCaarree 33..55 KKiinnsshhiipp 44..00 KKiinnsshhiipp 44..88
IInnddeeppeennddeenntt
lliivviinngg 99..55
OOvveerraallll 33..00 OOvveerraallll 44..33 OOvveerraallll 55..55 OOvveerraallll 66..99
Note: Provincial range years in placement overall by age group: 0‐4 = 0.8‐4.8 years; 5‐9 = 0.8‐9.9 years; 10‐15 = 0.8‐15.8 years; 16‐17 = 0.8‐17 years Provincial range changes in main caregiver since birth by age group: 0‐4 = 1‐12 caregivers; 5‐9 = 1‐32 caregivers; 10‐15 = 1‐82 caregivers; 16‐17 = 1‐77 caregivers Provincial range changes in place of residence since birth by age group: 0‐4 = 1‐66 changes; 5‐9 = 1‐20 changes; 10‐15 = 1‐63 changes; 16‐17 = 1‐66 changes

Looking After Children: Ontario Provincial Report (Year 13) 7Table 2.2: Young people who have a permanency plan by placement setting and overall (ages 0‐17 years).
CCAASS OONN CCAASS OONN CCAASS OONN CCAASS OONN
AAggee GGrroouupp 00‐‐44 00‐‐44 55‐‐99 55‐‐99 1100‐‐1155 1100‐‐1155 1166‐‐1177 1166‐‐1177
YYoouunngg ppeeooppllee
wwhhoo hhaavvee aa
ppeerrmmaanneennccyy
ppllaann
FFoosstteerr
hhoommee 7799%% FFoosstteerr hhoommee 8800%% FFoosstteerr hhoommee 8866%% FFoosstteerr hhoommee 9900%%
KKiinnsshhiipp 8833%% GGrroouupp hhoommee 6611%% GGrroouupp hhoommee 7766%% GGrroouupp hhoommee 8866%%
CCuussttoommaarryy
CCaarree 8844%% KKiinnsshhiipp 8888%% KKiinnsshhiipp 9966%%
IInnddeeppeennddeenntt lliivviinngg
8899%%
OOvveerraallll 7799%% OOvveerraallll 8800%% OOvveerraallll 8866%% OOvveerraallll 8888%%
Table 2.3: Permanency plans overall (ages 0 to 17 years).
CCAASS OONN
AAggee GGrroouupp 00‐‐44 55‐‐99 1100‐‐1155 1166‐‐1177 00‐‐44 55‐‐99 1100‐‐1155 1166‐‐1177
PPeerrmmaanneennccyy
ppllaann
RReemmaaiinn iinn ccuurrrreenntt ppllaacceemmeenntt 2233%% 3377%% 6688%% 5533%%
MMoovvee ttoo aaddooppttiioonn 4499%% 3344%% 88%% 00..88%%
MMoovvee ttoo kkiinnsshhiipp 33%% 33%% 22%% 00..77%%
SSttaattuuss cchhaannggee ttoo lleeggaall ccuussttooddyy 00..66%% 11%% 22%% 00..44%%
MMoovvee ttoo ccuussttoommaarryy ccaarree 11%% 11%% 00..22%% 00..11%%
MMoovvee ttoo iinnddeeppeennddeenntt lliivviinngg 00%% 00..11%% 22%% 2266%%
MMoovvee ttoo aadduulltt sseerrvviicceess 00%% 00..33%% 33%% 99%%
DDiisscchhaarrggee ffrroomm ccaarree 66%% 88%% 44%% 33%%
OOtthheerr 22%% 22%% 33%% 33%%
PPeerrmmaanneennccyy ppllaann nnoott yyeett ddeetteerrmmiinneedd 1166%% 1144%% 1100%% 55%%
Table 2.4: Permanency of placement by placement setting, reported by the child welfare
worker (ages 0 to 17 years).
CCAASS OONN CCAASS OONN CCAASS OONN CCAASS OONN
AAggee GGrroouupp 00‐‐44 00‐‐44 55‐‐99 55‐‐99 1100‐‐1155 1100‐‐1155 1166‐‐1177 1166‐‐1177
YYoouunngg ppeeooppllee
wwhhoo hhaavvee hhaadd
““mmuucchh””
ccoonnttiinnuuiittyy ooff
ccaarree
FFoosstteerr hhoommee 7777%% FFoosstteerr hhoommee 7799%% FFoosstteerr hhoommee 7799%% FFoosstteerr hhoommee 7766%%
KKiinnsshhiipp 6655%% GGrroouupp hhoommee 6633%% GGrroouupp hhoommee 5555%% GGrroouupp hhoommee 5544%%
CCuussttoommaarryy
CCaarree 7755%% KKiinnsshhiipp 8800%% KKiinnsshhiipp 9911%%
IInnddeeppeennddeenntt lliivviinngg
1122%%
OOvveerraallll 7766%% OOvveerraallll 7788%% OOvveerraallll 7755%% OOvveerraallll 6611%%
Looking After Children: Ontario Provincial Report (Year 13) 8
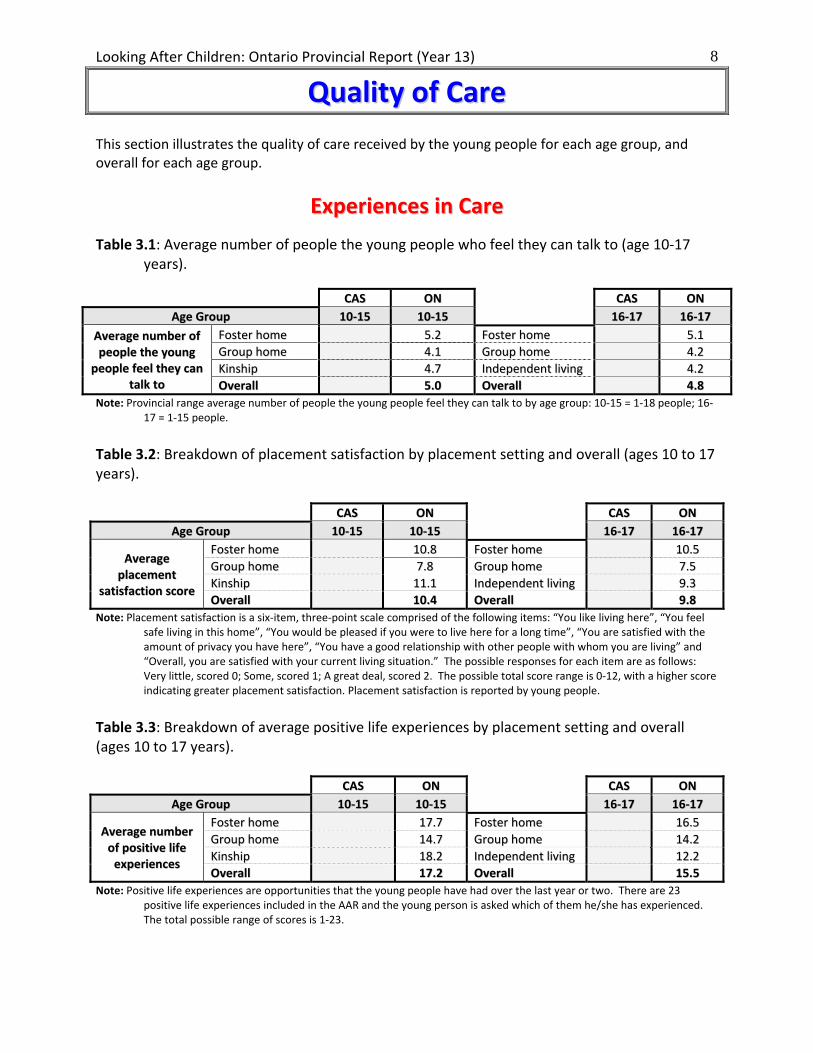
QQuuaalliittyy ooff CCaarree
This section illustrates the quality of care received by the young people for each age group, and overall for each age group.
EExxppeerriieenncceess iinn CCaarree
Table 3.1: Average number of people the young people who feel they can talk to (age 10‐17 years).
CCAASS OONN
CCAASS OONN
AAggee GGrroouupp 1100‐‐1155 1100‐‐1155 1166‐‐1177 1166‐‐1177
AAvveerraaggee nnuummbbeerr ooff
ppeeooppllee tthhee yyoouunngg
ppeeooppllee ffeeeell tthheeyy ccaann
ttaallkk ttoo
FFoosstteerr hhoommee 55..22 FFoosstteerr hhoommee 55..11
GGrroouupp hhoommee 44..11 GGrroouupp hhoommee 44..22
KKiinnsshhiipp 44..77 IInnddeeppeennddeenntt lliivviinngg 44..22
OOvveerraallll 55..00 OOvveerraallll 44..88
Note: Provincial range average number of people the young people feel they can talk to by age group: 10‐15 = 1‐18 people; 16‐17 = 1‐15 people.
Table 3.2: Breakdown of placement satisfaction by placement setting and overall (ages 10 to 17 years).
CCAASS OONN
CCAASS OONN
AAggee GGrroouupp 1100‐‐1155 1100‐‐1155 1166‐‐1177 1166‐‐1177
AAvveerraaggee
ppllaacceemmeenntt
ssaattiissffaaccttiioonn ssccoorree
FFoosstteerr hhoommee 1100..88 FFoosstteerr hhoommee 1100..55
GGrroouupp hhoommee 77..88 GGrroouupp hhoommee 77..55
KKiinnsshhiipp 1111..11 IInnddeeppeennddeenntt lliivviinngg 99..33
OOvveerraallll 1100..44 OOvveerraallll 99..88
Note: Placement satisfaction is a six‐item, three‐point scale comprised of the following items: “You like living here”, “You feel safe living in this home”, “You would be pleased if you were to live here for a long time”, “You are satisfied with the amount of privacy you have here”, “You have a good relationship with other people with whom you are living” and “Overall, you are satisfied with your current living situation.” The possible responses for each item are as follows: Very little, scored 0; Some, scored 1; A great deal, scored 2. The possible total score range is 0‐12, with a higher score indicating greater placement satisfaction. Placement satisfaction is reported by young people.
Table 3.3: Breakdown of average positive life experiences by placement setting and overall (ages 10 to 17 years).
CCAASS OONN
CCAASS OONN
AAggee GGrroouupp 1100‐‐1155 1100‐‐1155 1166‐‐1177 1166‐‐1177
AAvveerraaggee nnuummbbeerr
ooff ppoossiittiivvee lliiffee
eexxppeerriieenncceess
FFoosstteerr hhoommee 1177..77 FFoosstteerr hhoommee 1166..55
GGrroouupp hhoommee 1144..77 GGrroouupp hhoommee 1144..22
KKiinnsshhiipp 1188..22 IInnddeeppeennddeenntt lliivviinngg 1122..22
OOvveerraallll 1177..22 OOvveerraallll 1155..55
Note: Positive life experiences are opportunities that the young people have had over the last year or two. There are 23 positive life experiences included in the AAR and the young person is asked which of them he/she has experienced. The total possible range of scores is 1‐23.

Looking After Children: Ontario Provincial Report (Year 13) 9
Table 3.4: Health services received by placement setting and overall. CCAASS OONN CCAASS OONN CCAASS OONN CCAASS OONN
AAggee GGrroouupp 00‐‐44 00‐‐44 55‐‐99 55‐‐99 1100‐‐1155 1100‐‐1155 1166‐‐2211 1166‐‐2211
YYoouunngg ppeeooppllee
wwhhoo hhaavvee hhaadd
aa mmeeddiiccaall
eexxaammiinnaattiioonn iinn
tthhee llaasstt yyeeaarr
FFoosstteerr
hhoommee 9999%%
FFoosstteerr
hhoommee 9988%%
FFoosstteerr
hhoommee 9988%% FFoosstteerr hhoommee 9988%%
KKiinnsshhiipp 9966%% GGrroouupp
hhoommee 110000%%
GGrroouupp
hhoommee 110000%% GGrroouupp hhoommee 9988%%
CCuussttoommaarryy
CCaarree 9955%% KKiinnsshhiipp 9922%% KKiinnsshhiipp 9955%%
IInnddeeppeennddeenntt
lliivviinngg 8811%%
OOvveerraallll 9999%% OOvveerraallll 9977%% OOvveerraallll 9988%% OOvveerraallll 9933%%
FFNNMMII yyoouunngg
ppeeooppllee wwhhoo
hhaavvee sseeeenn aa
TTrraaddiittiioonnaall
HHeeaalleerr iinn tthhee
llaasstt yyeeaarr
OOvveerraallll 44%% OOvveerraallll 88%% OOvveerraallll 1111%% OOvveerraallll 1166%%
YYoouunngg ppeeooppllee
wwhhoo hhaavvee hhaadd
aa ddeennttaall
eexxaammiinnaattiioonn iinn
tthhee llaasstt yyeeaarr
FFoosstteerr
hhoommee 4400%%
FFoosstteerr
hhoommee 9999%%
FFoosstteerr hhoommee
9999%% FFoosstteerr hhoommee 9988%%
KKiinnsshhiipp 4466%% GGrroouupp
hhoommee 110000%%
GGrroouupp hhoommee
9999%% GGrroouupp hhoommee 9977%%
CCuussttoommaarryy
CCaarree 8855%% KKiinnsshhiipp 9999%% KKiinnsshhiipp 9988%%
IInnddeeppeennddeenntt
lliivviinngg 8833%%
OOvveerraallll 4411%% OOvveerraallll 9999%% OOvveerraallll 9999%% OOvveerraallll 9944%%
YYoouunngg ppeeooppllee
ttaakkiinngg
ppssyycchhoottrrooppiicc
oorr bbeehhaavviioouurr
aalltteerriinngg
mmeeddiiccaattiioonnss
FFoosstteerr
hhoommee 22%%
FFoosstteerr
hhoommee 3333%%
FFoosstteerr hhoommee
4477%% FFoosstteerr hhoommee 4411%%
KKiinnsshhiipp 00%% GGrroouupp
hhoommee 5588%%
GGrroouupp hhoommee
7744%% GGrroouupp hhoommee 6611%%
CCuussttoommaarryy
CCaarree 00%% KKiinnsshhiipp 2244%% KKiinnsshhiipp 3322%%
IInnddeeppeennddeenntt
lliivviinngg 2277%%
OOvveerraallll 22%% OOvveerraallll 3333%% OOvveerraallll 5500%% OOvveerraallll 4433%%
YYoouunngg ppeeooppllee
wwhhoossee
iimmmmuunniizzaattiioonnss
aarree uupp ttoo ddaattee
FFoosstteerr
hhoommee 9977%%
FFoosstteerr
hhoommee 9977%%
FFoosstteerr hhoommee
9988%% FFoosstteerr hhoommee 9988%%
KKiinnsshhiipp 9944%% GGrroouupp
hhoommee 9966%%
GGrroouupp hhoommee
9988%% GGrroouupp hhoommee 9988%%
CCuussttoommaarryy
CCaarree 110000%% KKiinnsshhiipp 9999%% KKiinnsshhiipp 9988%%
IInnddeeppeennddeenntt
lliivviinngg 9944%%
OOvveerraallll 9977%% OOvveerraallll 9988%% OOvveerraallll 9988%% OOvveerraallll 9977%%

Looking After Children: Ontario Provincial Report (Year 13) 10Table 3.5: Percentage of young people who have an RESP or a Canada Learning Bond by
placement setting and overall.
CCAASS OONN CCAASS OONN CCAASS OONN CCAASS OONN
AAggee GGrroouupp 00‐‐44 00‐‐44 55‐‐99 55‐‐99 1100‐‐1155 1100‐‐1155 1166‐‐2211 1166‐‐2211
YYoouunngg ppeeooppllee
wwhhoo hhaavvee aann
RREESSPP oorr aa
CCaannaaddaa LLeeaarrnniinngg
BBoonndd
FFoosstteerr hhoommee 2222%% FFoosstteerr
hhoommee 2233%%
FFoosstteerr hhoommee
2233%% FFoosstteerr hhoommee 2200%%
KKiinnsshhiipp 2244%% GGrroouupp
hhoommee 1166%%
GGrroouupp hhoommee
1155%% GGrroouupp hhoommee 1122%%
CCuussttoommaarryy
CCaarree 1166%% KKiinnsshhiipp 2299%% KKiinnsshhiipp 2266%%
IInnddeeppeennddeenntt lliivviinngg
1133%%
OOvveerraallll 2233%% OOvveerraallll 2233%% OOvveerraallll 2211%% OOvveerraallll 1188%%
Table 3.6: Percentage of children who have culturally appropriate toys, books, etc. by placement setting and overall (ages 0‐9 years.)
CCAASS OONN
CCAASS OONN
AAggee GGrroouupp 00‐‐44 00‐‐44 55‐‐99 55‐‐99
CChhiillddrreenn wwhhoo hhaavvee ttooyyss,, ppiiccttuurreess,,
bbooookkss,, aanndd mmuussiicc tthhaatt ppoossiittiivveellyy
rreefflleecctt tthhee eetthhnniicc aanndd ccuullttuurraall
bbaacckkggrroouunndd((ss)) ooff tthheeiirr bbiirrtthh ffaammiilliieess
FFoosstteerr hhoommee 9911%% FFoosstteerr hhoommee 9900%%
KKiinnsshhiipp 9922%% GGrroouupp hhoommee 9944%%
CCuussttoommaarryy CCaarree 9900%% KKiinnsshhiipp 9977%%
OOvveerraallll 9911%% OOvveerraallll 9911%%
Table 3.7: Perceived safety at school by placement setting and overall (ages 0‐17 years).
CCAASS OONN CCAASS OONN CCAASS OONN
AAggee GGrroouupp 55‐‐99 55‐‐99 1100‐‐1155 1100‐‐1155 1166‐‐1177 1166‐‐1177
SScchhooooll ssaaffeettyy
ssccoorree
FFoosstteerr hhoommee 1111..11 FFoosstteerr hhoommee 1100..88 FFoosstteerr hhoommee 1100..99
GGrroouupp hhoommee 1100..88 GGrroouupp hhoommee 1100..33 GGrroouupp hhoommee 1100..77
KKiinnsshhiipp 1100..99 KKiinnsshhiipp 1100..99 IInnddeeppeennddeenntt lliivviinngg 1100..99
OOvveerraallll 1111..00 OOvveerraallll 1100..77 OOvveerraallll 1100..99
Note: The School Safety score is a six‐item, three‐point scale reported by the caregiver in the 5‐9 age group, and the young person in the 10‐17 age groups. An example question is: “I feel safe on my way to and from school.” The total possible range of scores is 0‐12. Higher scores on this scale indicate greater feelings of safety at school.
Table 3.8: Social support and help scale by residential setting and overall (ages 18‐21 years).
CCAASS OONN
AAggee GGrroouupp 1188‐‐2211 1188‐‐2211
SSoocciiaall ssuuppppoorrtt
aanndd hheellpp
IInnddeeppeennddeenntt lliivviinngg 2211..33
OOtthheerr 2211..88
WWiitthh rreellaattiivveess 1199..44
OOvveerraallll 2211..22
Note: The Social Support and Help scale is a nine‐item, four‐point scale reported by the young adult. An example question is: “There are people I can count on in times of trouble.” The total possible range of scores is 0‐27. Higher scores on this scale indicate greater feelings of social support.

Looking After Children: Ontario Provincial Report (Year 13) 11
PPaarreennttiinngg
Table 3.9: Average feelings toward caregivers by placement setting and overall (ages 10 to 17 years).
CCAASS OONN
CCAASS OONN
AAggee GGrroouupp 1100‐‐1155 1100‐‐1155 1166‐‐1177 1166‐‐1177
YYoouunngg ppeerrssoonn’’ss
ffeeeelliinnggss ttoowwaarrdd
ccaarreeggiivveerr AA
((ffeemmaallee))
FFoosstteerr hhoommee 66..88 FFoosstteerr hhoommee 66..44
GGrroouupp hhoommee 66..22 GGrroouupp hhoommee 55..66
KKiinnsshhiipp 77..00 IInnddeeppeennddeenntt lliivviinngg 66..44
OOvveerraallll 66..88 OOvveerraallll 66..33
YYoouunngg ppeerrssoonn’’ss
ffeeeelliinnggss ttoowwaarrdd
ccaarreeggiivveerr AA
((mmaallee))
FFoosstteerr hhoommee 66..77 FFoosstteerr hhoommee 66..44
GGrroouupp hhoommee 55..99 GGrroouupp hhoommee 55..66
KKiinnsshhiipp 66..99 IInnddeeppeennddeenntt lliivviinngg 55..66
OOvveerraallll 66..55 OOvveerraallll 66..11
YYoouunngg ppeerrssoonn’’ss
ffeeeelliinnggss ttoowwaarrdd
ccaarreeggiivveerr BB
((ffeemmaallee))
FFoosstteerr hhoommee 66..55 FFoosstteerr hhoommee 66..33
GGrroouupp hhoommee 66..00 GGrroouupp hhoommee 55..33
KKiinnsshhiipp 77..33 IInnddeeppeennddeenntt lliivviinngg 55..77
OOvveerraallll 66..55 OOvveerraallll 66..11
YYoouunngg ppeerrssoonn’’ss
ffeeeelliinnggss ttoowwaarrdd
ccaarreeggiivveerr BB
((mmaallee))
FFoosstteerr hhoommee 66..11 FFoosstteerr hhoommee 55..77
GGrroouupp hhoommee 55..66 GGrroouupp hhoommee 55..55
KKiinnsshhiipp 66..55 IInnddeeppeennddeenntt lliivviinngg 55..55
OOvveerraallll 66..11 OOvveerraallll 55..77
Note: The Feelings Toward Caregiver score is a four‐item, three‐point scale reported by the young person. The items are: “How well do you feel he/she understands you”, “How much fairness do you receive from him/her?”, “How much affection do you receive from him/her?” and the response choices for these questions are: A great deal, Some, and Very little. The final question is “Overall, how would you describe your relationship with her?” and the response choices are: Very close, scored 2; Somewhat close, scored 1; Not very close, scored 0. The total range of scores is 0‐8. Higher scores on this scale indicate a greater degree of parental acceptance perceived by the young person.
Table 3.10: Positive parenting scores by placement setting and overall (ages 0 to 9 years).
CCAASS OONN CCAASS OONN
AAggee GGrroouupp 00‐‐44 00‐‐44 55‐‐99 55‐‐99
PPoossiittiivvee PPaarreennttiinngg SSccoorree
FFoosstteerr hhoommee 1177..66 FFoosstteerr hhoommee 1155..33
KKiinnsshhiipp 1177..44 GGrroouupp hhoommee 1166..88
CCuussttoommaarryy CCaarree 1177..44 KKiinnsshhiipp 1155..11
OOvveerraallll 1177..66 OOvveerraallll 1155..44
Note: The Positive Parenting scale for 0‐9 year olds is a parent‐reported, five‐item, five‐point scale. An example of items included in the scale is: “How often do you and the child laugh together?” Response choices are: Many times each day, scored 4; One or two times a day, scored 3; A few times a week, scored 2; About once a week or less, scored 1; and Never, scored 0. The total possible range is 0‐20. Higher scores on this scale indicate a greater number of positive interactions.

Looking After Children: Ontario Provincial Report (Year 13) 12Table 3.11: Parenting practices by placement setting and overall (ages 10 to 17 years).
CCAASS OONN CCAASS OONN CCAASS OONN CCAASS OONN
AAggee GGrroouupp 1100‐‐1155 1100‐‐1155 1166‐‐1177 1166‐‐1177
RReeppoorrtteedd bbyy CCaarreeggiivveerr YYoouunngg ppeerrssoonn CCaarreeggiivveerr YYoouunngg ppeerrssoonn
PPoossiittiivvee
PPaarreennttiinngg ssccaallee
FFoosstteerr hhoommee 1111..22 1100..44 FFoosstteerr hhoommee 1100..99 99..99
GGrroouupp hhoommee 1111..33 1100..00 GGrroouupp hhoommee 1100..99 99..55
KKiinnsshhiipp 1111..11 1100..66 IInnddeeppeennddeenntt lliivviinngg 99..99 88..66
OOvveerraallll 1111..22 1100..44 OOvveerraallll 1100..88 99..88
IInnccoonnssiisstteenntt
DDiisscciipplliinnee ssccaallee
FFoosstteerr hhoommee 22..44 22..88 FFoosstteerr hhoommee 22..22 22..55
GGrroouupp hhoommee 22..00 22..88 GGrroouupp hhoommee 22..77 33..11
KKiinnsshhiipp 33..00 33..33 IInnddeeppeennddeenntt lliivviinngg 33..11 33..33
OOvveerraallll 22..44 22..99 OOvveerraallll 22..44 22..88
PPoooorr
SSuuppeerrvviissiioonn
ssccaallee
FFoosstteerr hhoommee 11..11 11..55 FFoosstteerr hhoommee 22..44 22..44
GGrroouupp hhoommee 11..88 22..11 GGrroouupp hhoommee 33..11 33..44
KKiinnsshhiipp 11..11 11..66 IInnddeeppeennddeenntt lliivviinngg 33..88 33..22
OOvveerraallll 11..22 11..66 OOvveerraallll 22..66 22..77
Note: The Positive Parenting scale for 10‐17 year olds is a three‐item, five‐point scale. An example of items included in the caregiver‐reported scale is: “You praise the youth if he/she behaves well.” An example of items included in the youth‐reported scale is: “Your caregiver praises you for behaving well.” Response choices are: Always, scored 4; Often, scored 3; Sometimes, scored 2; Almost never, scored 1; and Never, scored 0. The total possible range is 0‐12. Higher scores on this scale indicate a higher level of positive parenting. The Inconsistent Discipline scale for 10‐17 year olds is a three‐item, five‐point scale. An example of items included in the caregiver‐reported scale is: “The youth talks you out of being disciplined after he/she has done something wrong.” An example of items included in the youth‐reported scale is: “You talk your caregiver out of disciplining you after you have done something wrong.” Response choices are: Always, scored 4; Often, scored 3; Sometimes, scored 2; Almost never, scored 1; and Never, scored 0. The total possible range is 0‐12. Higher scores on this scale indicate a higher level of inconsistent discipline. The Poor Supervision scale for 10‐17 year olds is a three‐item, five‐point scale. An example of items included in the caregiver‐reported scale is: “The youth is out with friends you don’t know.” An example of items included in the youth‐reported scale is: “Your caregiver does not know the friends you are out with.” Response choices are: Always, scored 4; Often, scored 3; Sometimes, scored 2; Almost never, scored 1; and Never, scored 0. The total possible range is 0‐12. Higher scores on this scale indicate a higher level of poor supervision.
Table 3.12: Effective discipline scores by placement setting and overall (ages 2 to 9 years).
Note: The Effective Discipline scale for 2‐9 year olds is a parent‐reported, six‐item, three‐point scale. An example of items included in the scale is: “How often do you raise your voice, scold, or yell at …?” The total possible range is 0‐12. Higher scores on this scale indicate a greater use of effective discipline
CCAASS OONN
CCAASS OONN
AAggee GGrroouupp 22‐‐44 22‐‐44 55‐‐99 55‐‐99
EEffffeeccttiivvee DDiisscciipplliinnee SSccoorree
FFoosstteerr hhoommee 88..55 FFoosstteerr hhoommee 88..33
KKiinnsshhiipp 88..55 GGrroouupp hhoommee 88..44
CCuussttoommaarryy CCaarree 77..99 KKiinnsshhiipp 88..00
OOvveerraallll 88..55 OOvveerraallll 88..33
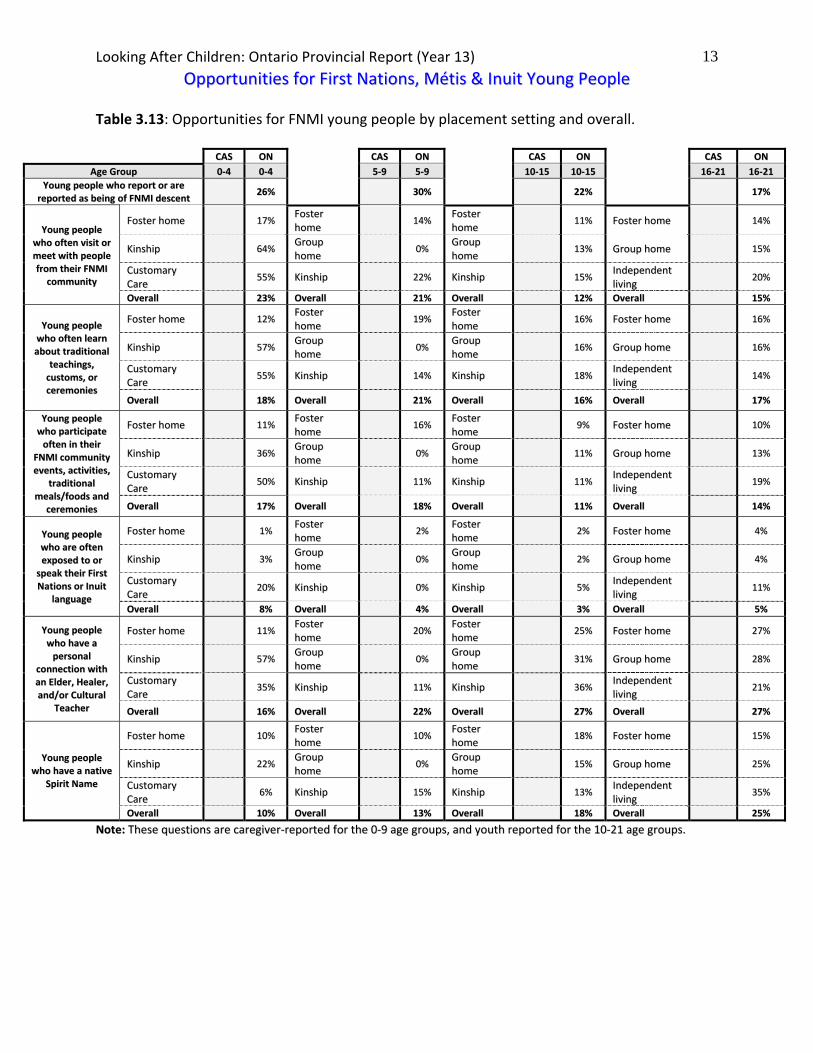
Looking After Children: Ontario Provincial Report (Year 13) 13
OOppppoorrttuunniittiieess ffoorr FFiirrsstt NNaattiioonnss,, MMééttiiss && IInnuuiitt YYoouunngg PPeeooppllee Table 3.13: Opportunities for FNMI young people by placement setting and overall.
CCAASS OONN CCAASS OONN CCAASS OONN CCAASS OONN
AAggee GGrroouupp 00‐‐44 00‐‐44 55‐‐99 55‐‐99 1100‐‐1155 1100‐‐1155 1166‐‐2211 1166‐‐2211
YYoouunngg ppeeooppllee wwhhoo rreeppoorrtt oorr aarree
rreeppoorrtteedd aass bbeeiinngg ooff FFNNMMII ddeesscceenntt 2266%% 3300%%
2222%% 1177%%
YYoouunngg ppeeooppllee
wwhhoo oofftteenn vviissiitt oorr
mmeeeett wwiitthh ppeeooppllee
ffrroomm tthheeiirr FFNNMMII
ccoommmmuunniittyy
FFoosstteerr hhoommee 1177%% FFoosstteerr
hhoommee 1144%%
FFoosstteerr hhoommee
1111%% FFoosstteerr hhoommee 1144%%
KKiinnsshhiipp 6644%% GGrroouupp
hhoommee 00%%
GGrroouupp hhoommee
1133%% GGrroouupp hhoommee 1155%%
CCuussttoommaarryy
CCaarree 5555%% KKiinnsshhiipp 2222%% KKiinnsshhiipp 1155%%
IInnddeeppeennddeenntt lliivviinngg
2200%%
OOvveerraallll 2233%% OOvveerraallll 2211%% OOvveerraallll 1122%% OOvveerraallll 1155%%
YYoouunngg ppeeooppllee
wwhhoo oofftteenn lleeaarrnn
aabboouutt ttrraaddiittiioonnaall
tteeaacchhiinnggss,,
ccuussttoommss,, oorr
cceerreemmoonniieess
FFoosstteerr hhoommee 1122%% FFoosstteerr
hhoommee 1199%%
FFoosstteerr hhoommee
1166%% FFoosstteerr hhoommee 1166%%
KKiinnsshhiipp 5577%% GGrroouupp
hhoommee 00%%
GGrroouupp hhoommee
1166%% GGrroouupp hhoommee 1166%%
CCuussttoommaarryy
CCaarree 5555%% KKiinnsshhiipp 1144%% KKiinnsshhiipp 1188%%
IInnddeeppeennddeenntt lliivviinngg
1144%%
OOvveerraallll 1188%% OOvveerraallll 2211%% OOvveerraallll 1166%% OOvveerraallll 1177%%
YYoouunngg ppeeooppllee
wwhhoo ppaarrttiicciippaattee
oofftteenn iinn tthheeiirr
FFNNMMII ccoommmmuunniittyy
eevveennttss,, aaccttiivviittiieess,,
ttrraaddiittiioonnaall
mmeeaallss//ffooooddss aanndd
cceerreemmoonniieess
FFoosstteerr hhoommee 1111%% FFoosstteerr
hhoommee 1166%%
FFoosstteerr hhoommee
99%% FFoosstteerr hhoommee 1100%%
KKiinnsshhiipp 3366%% GGrroouupp
hhoommee 00%%
GGrroouupp hhoommee
1111%% GGrroouupp hhoommee 1133%%
CCuussttoommaarryy
CCaarree 5500%% KKiinnsshhiipp 1111%% KKiinnsshhiipp 1111%%
IInnddeeppeennddeenntt lliivviinngg
1199%%
OOvveerraallll 1177%% OOvveerraallll 1188%% OOvveerraallll 1111%% OOvveerraallll 1144%%
YYoouunngg ppeeooppllee
wwhhoo aarree oofftteenn
eexxppoosseedd ttoo oorr
ssppeeaakk tthheeiirr FFiirrsstt
NNaattiioonnss oorr IInnuuiitt
llaanngguuaaggee
FFoosstteerr hhoommee 11%% FFoosstteerr
hhoommee 22%%
FFoosstteerr hhoommee
22%% FFoosstteerr hhoommee 44%%
KKiinnsshhiipp 33%% GGrroouupp
hhoommee 00%%
GGrroouupp hhoommee
22%% GGrroouupp hhoommee 44%%
CCuussttoommaarryy
CCaarree 2200%% KKiinnsshhiipp 00%% KKiinnsshhiipp 55%%
IInnddeeppeennddeenntt lliivviinngg
1111%%
OOvveerraallll 88%% OOvveerraallll 44%% OOvveerraallll 33%% OOvveerraallll 55%%
YYoouunngg ppeeooppllee
wwhhoo hhaavvee aa
ppeerrssoonnaall
ccoonnnneeccttiioonn wwiitthh
aann EEllddeerr,, HHeeaalleerr,,
aanndd//oorr CCuullttuurraall
TTeeaacchheerr
FFoosstteerr hhoommee 1111%% FFoosstteerr
hhoommee 2200%%
FFoosstteerr hhoommee
2255%% FFoosstteerr hhoommee 2277%%
KKiinnsshhiipp 5577%% GGrroouupp
hhoommee 00%%
GGrroouupp hhoommee
3311%% GGrroouupp hhoommee 2288%%
CCuussttoommaarryy
CCaarree 3355%% KKiinnsshhiipp 1111%% KKiinnsshhiipp 3366%%
IInnddeeppeennddeenntt lliivviinngg
2211%%
OOvveerraallll 1166%% OOvveerraallll 2222%% OOvveerraallll 2277%% OOvveerraallll 2277%%
YYoouunngg ppeeooppllee
wwhhoo hhaavvee aa nnaattiivvee
SSppiirriitt NNaammee
FFoosstteerr hhoommee 1100%% FFoosstteerr
hhoommee 1100%%
FFoosstteerr hhoommee
1188%% FFoosstteerr hhoommee 1155%%
KKiinnsshhiipp 2222%% GGrroouupp
hhoommee 00%%
GGrroouupp hhoommee
1155%% GGrroouupp hhoommee 2255%%
CCuussttoommaarryy
CCaarree 66%% KKiinnsshhiipp 1155%% KKiinnsshhiipp 1133%%
IInnddeeppeennddeenntt lliivviinngg
3355%%
OOvveerraallll 1100%% OOvveerraallll 1133%% OOvveerraallll 1188%% OOvveerraallll 2255%%
NNoottee:: TThheessee qquueessttiioonnss aarree ccaarreeggiivveerr‐‐rreeppoorrtteedd ffoorr tthhee 00‐‐99 aaggee ggrroouuppss,, aanndd yyoouutthh rreeppoorrtteedd ffoorr tthhee 1100‐‐2211 aaggee ggrroouuppss..

Looking After Children: Ontario Provincial Report (Year 13) 14
DDeevveellooppmmeennttaall AAsssseett PPrrooffiillee
The Search Institute has identified twenty external and internal assets as building blocks that help young people grow up healthy, caring, and responsible. External assets fall under the following categories: Support, Empowerment, and Boundaries and Expectations, and Constructive Use of Time. Internal assets fall under the following categories: Commitment to Learning, Positive Values, Social Competencies, and Positive Identity. Together, these make up the young person’s Asset Profile.
Table 4.1: Average external assets by placement setting and overall
CCAASS OONN CCAASS OONN CCAASS OONN CCAASS OONN
AAggee GGrroouupp 00‐‐44 00‐‐44 55‐‐99 55‐‐99 1100‐‐1155 1100‐‐1155 1166‐‐2211 1166‐‐2211
AAvveerraaggee
nnuummbbeerr ooff
eexxtteerrnnaall aasssseettss
((ppoossssiibbllee rraannggee
11‐‐2200))
FFoosstteerr hhoommee 1188..00 FFoosstteerr hhoommee
1166..77 FFoosstteerr hhoommee
1144..77 FFoosstteerr hhoommee 1133..77
KKiinnsshhiipp 1177..99 GGrroouupp hhoommee
1144..55 GGrroouupp hhoommee
1122..11 GGrroouupp hhoommee 1111..77
CCuussttoommaarryy
CCaarree 1177..44 KKiinnsshhiipp 1166..33 KKiinnsshhiipp 1155..55
IInnddeeppeennddeenntt lliivviinngg
99..88
OOvveerraallll 1188..00 OOvveerraallll 1166..66 OOvveerraallll 1144..33 OOvveerraallll 1122..88
AAvveerraaggee
nnuummbbeerr ooff
iinntteerrnnaall aasssseettss
((ppoossssiibbllee rraannggee
11‐‐2200))
FFoosstteerr hhoommee 1199..22 FFoosstteerr hhoommee
1177..88 FFoosstteerr hhoommee
1144..00 FFoosstteerr hhoommee 1133..22
KKiinnsshhiipp 1199..11 GGrroouupp hhoommee
1144..11 GGrroouupp hhoommee
99..77 GGrroouupp hhoommee 99..44
CCuussttoommaarryy
CCaarree 1177..88 KKiinnsshhiipp 1188..11 KKiinnsshhiipp 1155..66
IInnddeeppeennddeenntt lliivviinngg
1111..99
OOvveerraallll 1199..22 OOvveerraallll 1177..77 OOvveerraallll 1133..44 OOvveerraallll 1122..11
DDeevveellooppmmeennttaall
AAsssseett pprrooffiillee
((ppoossssiibbllee rraannggee
11‐‐4400))
FFoosstteerr hhoommee 3377..33 FFoosstteerr hhoommee
3344..55 FFoosstteerr hhoommee
2288..88 FFoosstteerr hhoommee 2266..99
KKiinnsshhiipp 3377..00 GGrroouupp hhoommee
2288..77 GGrroouupp hhoommee
2211..88 GGrroouupp hhoommee 2211..11
CCuussttoommaarryy
CCaarree 3355..22 KKiinnsshhiipp 3344..44 KKiinnsshhiipp 3311..00
IInnddeeppeennddeenntt lliivviinngg
2211..77
OOvveerraallll 3377..22 OOvveerraallll 3344..33 OOvveerraallll 2277..77 OOvveerraallll 2244..55

Looking After Children: Ontario Provincial Report (Year 13) 15 Figure 4.1: Overall breakdown of total number of Developmental Assets.
1%4%
96%
3%
14%
83%
18%
40% 42%
32%37%
31%
0%
10%
20%
30%
40%
50%
60%
70%
80%
90%
100%
1-20 Assets 21-30 Assets 31-40 Assets
ON 0-4
ON 5-9
ON 10-15
ON 16-21

Looking After Children: Ontario Provincial Report (Year 13) 16
EEdduuccaattiioonn:: HHooww aarree tthhee YYoouunngg PPeeooppllee DDooiinngg?? Table 5.1: Academic achievement as rated by caregivers (ages 5‐17 years).
CCAASS OONN AAggee GGrroouupp 55‐‐99 1100‐‐1155 1166‐‐1177 55‐‐99 1100‐‐1155 1166‐‐1177
RReeaaddiinngg VVeerryy wweellll oorr wweellll 2211%% 2244%% 2244%%
AAvveerraaggee 4477%% 5544%% 5566%%
PPoooorrllyy oorr vveerryy ppoooorrllyy 3322%% 2222%% 2200%%
MMaatthheemmaattiiccss VVeerryy wweellll oorr wweellll 1188%% 2200%% 2200%%
AAvveerraaggee 5544%% 5522%% 5522%%
PPoooorrllyy oorr vveerryy ppoooorrllyy 2288%% 2299%% 2288%%
SScciieennccee VVeerryy wweellll oorr wweellll 1177%% 2200%% 2222%%
AAvveerraaggee 6622%% 6611%% 5577%%
PPoooorrllyy oorr vveerryy ppoooorrllyy 2211%% 1199%% 2211%%
OOvveerraallll aaccaaddeemmiicc
aacchhiieevveemmeenntt
VVeerryy wweellll oorr wweellll 1188%% 2200%% 2211%%
AAvveerraaggee 5577%% 6611%% 5588%%
PPoooorrllyy oorr vveerryy ppoooorrllyy 2255%% 1199%% 2211%%
AAccaaddeemmiicc aacchhiieevveemmeenntt
ssccaallee
MMeeaann 33..77 44..00 44..00
MMeeddiiaann 44..00 44..00 44..00
Note: The above questions are asked pertaining to young people in the 5 to 17 age group. The Academic Achievement scale is a four‐item, three‐point scale, made up of the subjects above. Response choices are the same as above: Very well or well, scored 2; Average, scored 1; Poorly or very poor, scored 0. Range of possible scores is from 0 to 8. Higher scores on this scale indicate greater school performance, as rated by the caregiver.
Table 5.2: Young people’s rating of their own school success (ages 10‐17 years).
CCAASS OONN AAggee GGrroouupp 1100‐‐1155 1166‐‐1177 1100‐‐1155 1166‐‐1177
YYoouunngg ppeeooppllee’’ss rraattiinngg
ooff tthheeiirr oowwnn sscchhooooll
ssuucccceessss
VVeerryy wweellll oorr wweellll 3388%% 3300%%
AAvveerraaggee 5555%% 5588%%
PPoooorrllyy oorr vveerryy ppoooorr 77%% 1122%%

Looking After Children: Ontario Provincial Report (Year 13) 17Table 5.3: Percentage of young people who are at or above grade level by number of Developmental Assets and overall (ages 5‐17 years).
CCAASS OONN
AAggee GGrroouupp 55‐‐99 1100‐‐1155 1166‐‐1177 55‐‐99 1100‐‐1155 1166‐‐1177
CChhiillddrreenn aanndd yyoouunngg ppeeooppllee wwhhoo
aarree aatt oorr aabboovvee ggrraaddee lleevveell
11‐‐2200 AAsssseettss 2255%% 3311%% 2299%%
2211‐‐3300 AAsssseettss 3388%% 5533%% 5566%%
3311‐‐4400 AAsssseettss 6644%% 7722%% 7788%%
OOvveerraallll 5599%% 5577%% 5555%%
Table 5.4: Percentage of young people reporting the importance of school‐related activities (ages 10‐17 years).
CCAASS OONN AAggee GGrroouupp 1100‐‐1155 1166‐‐1177 1100‐‐1155 1166‐‐1177
GGeett ggoooodd ggrraaddeess??
VVeerryy iimmppoorrttaanntt 1155%% 6633%%
SSoommeewwhhaatt iimmppoorrttaanntt 6600%% 3322%%
NNoott vveerryy iimmppoorrttaanntt 2211%% ‐‐‐‐
NNoott iimmppoorrttaanntt aatt aallll 44%% 66%%
LLeeaarrnn nneeww tthhiinnggss?? VVeerryy iimmppoorrttaanntt 5599%% 5522%%
SSoommeewwhhaatt iimmppoorrttaanntt 3355%% 4422%%
NNoott iimmppoorrttaanntt 55%% 77%%
AAllwwaayyss sshhooww uupp ttoo
ccllaassss oonn ttiimmee??
VVeerryy iimmppoorrttaanntt 6677%% 5544%%
SSoommeewwhhaatt iimmppoorrttaanntt 2277%% 3355%%
NNoott iimmppoorrttaanntt 77%% 1111%%
EExxpprreessss yyoouurr ooppiinniioonn iinn
ccllaassss??
VVeerryy iimmppoorrttaanntt 4444%% 3388%%
SSoommeewwhhaatt iimmppoorrttaanntt 4422%% 4455%%
NNoott iimmppoorrttaanntt 1144%% 1177%%
HHaanndd iinn aassssiiggnnmmeennttss
oonn ttiimmee??
VVeerryy iimmppoorrttaanntt 6666%% 5599%%
SSoommeewwhhaatt iimmppoorrttaanntt 2266%% 3322%%
NNoott iimmppoorrttaanntt 77%% 99%%

Looking After Children: Ontario Provincial Report (Year 13) 18Table 5.6: Average frequency of literacy‐promoting activities, as reported by the caregiver by placement setting and overall (ages 1‐9 years).
CCAASS OONN CCAASS OONN CCAASS OONN
AAggee GGrroouupp 11‐‐22 11‐‐22 33‐‐44 33‐‐44 55‐‐99 55‐‐99
AAvveerraaggee ffrreeqquueennccyy
ooff lliitteerraaccyy‐‐
pprroommoottiinngg aaccttiivviittiieess
FFoosstteerr hhoommee 3322..22 4466..55 FFoosstteerr hhoommee 2233..88
KKiinnsshhiipp 3311..66 4455..11 GGrroouupp hhoommee 2211..44
CCuussttoommaarryy CCaarree 3333..11 4477..33 KKiinnsshhiipp 2233..77
OOvveerraallll 3322..22 4466..44 OOvveerraallll 2233..77
Note: The Literacy‐Promoting Scale for children aged 1‐2 is a ten‐item, five‐point scale, reported by the caregiver. A sample question from the scale is: “How often do you (or your spouse or partner) get the chance to do the following with the child: Read stories or show pictures or wordless baby books?” and response choices are: Daily, scored 4; A few times a week, scored 3; Once a week, scored 2; A few times a month, scored 1; Rarely or never, scored 0. The possible range is 0 to 40, with a higher score indicating more frequent literacy promoting activities.
The Literacy‐Promoting Scale for children aged 3‐4 is a 15‐item, five‐point scale, reported by the caregiver. A sample question from the scale is: “How often do you (or your spouse or partner) get the chance to do the following with the child: Teach him/her to name printed letters and/or numbers?” and response choices are: Daily, scored 4; A few times a week, scored 3; Once a week, scored 2; A few times a month, scored 1; Rarely or never, scored 0. The possible range is 0 to 60, with a higher score indicating more frequent literacy promoting activities.
The Literacy‐Promoting Scale for children aged 5‐9 is a five‐item, seven‐point scale, reported by the caregiver. A sample question from the scale is: “How often does the child read (or – in the case of younger children – look at books or try to read on his/her own) for pleasure?” and response choices are: Daily, scored 6; A few times a week, scored 5; Once a week, scored 4; A few times a month, scored 3; Once a month, scored 2; Less than once a month, scored 1; Rarely or never, scored 0. The possible range is 0 to 30, with a higher score indicating more frequent literacy promoting activities.
Table 5.7: Level of education that caregivers and young people hope is achieved.
CCAASS OONN AAggee GGrroouupp 00‐‐44 55‐‐99 1100‐‐1155 1166‐‐2222 00‐‐44 55‐‐99 1100‐‐1155 1166‐‐2222
SSeeccoonnddaarryy oorr hhiigghh
sscchhooooll ggrraadduuaattiioonn YYoouunngg ppeerrssoonn ‐‐‐‐ ‐‐‐‐ 1100%% 1122%%
CCaarreeggiivveerr 55%% 1100%% 1111%% 1122%%
AApppprreennttiicceesshhiipp
pprrooggrraamm YYoouunngg ppeerrssoonn ‐‐‐‐ ‐‐‐‐ 55%% 1100%%
CCaarreeggiivveerr 11%% 55%% 1100%% 1144%%
CCEEGGEEPP YYoouunngg ppeerrssoonn ‐‐‐‐ ‐‐‐‐ 00..33%% 00..88%%
CCaarreeggiivveerr 00..22%% 00..11%% 00..55%% 00..77%%
CCoolllleeggee ooff AApppplliieedd AArrttss
aanndd TTeecchhnnoollooggyy YYoouunngg ppeerrssoonn ‐‐‐‐ ‐‐‐‐ 3311%% 3399%%
CCaarreeggiivveerr 1166%% 2299%% 4400%% 4422%%
PPrriivvaattee ccaarreeeerr ccoolllleeggee YYoouunngg ppeerrssoonn ‐‐‐‐ ‐‐‐‐ 11%% 22%%
CCaarreeggiivveerr 00..66%% 00..33%% 11%% 11%%
UUnniivveerrssiittyy ddeeggrreeee YYoouunngg ppeerrssoonn ‐‐‐‐ ‐‐‐‐ 2266%% 1188%%
CCaarreeggiivveerr 6600%% 4400%% 2255%% 1199%%
MMoorree tthhaann oonnee
uunniivveerrssiittyy ddeeggrreeee YYoouunngg ppeerrssoonn ‐‐‐‐ ‐‐‐‐ 66%% 55%%
CCaarreeggiivveerr 77%% 33%% 33%% 22%%
II ddoonn’’tt kknnooww YYoouunngg ppeerrssoonn ‐‐‐‐ ‐‐‐‐ 1188%% 1111%%
CCaarreeggiivveerr 88%% 88%% 66%% 55%%
OOtthheerr YYoouunngg ppeerrssoonn ‐‐‐‐ ‐‐‐‐ 33%% 33%%
CCaarreeggiivveerr 33%% 55%% 55%% 66%%

Looking After Children: Ontario Provincial Report (Year 13) 19Table 5.8: Perceived reasons why completion of education may not be achieved (ages 16‐21 years).
CCAASS OONN AAggee GGrroouupp 1166‐‐1177 1188‐‐2211 1166‐‐1177 1188‐‐2211
BBaarrrriieerrss ffrroomm
ccoommpplleettiinngg
eedduuccaattiioonn//
ggooiinngg ttoo ppoosstt‐‐
sseeccoonnddaarryy
HHeeaalltthh rreeaassoonnss//ddiissaabbiilliittyy 1122%% 99%%
HHee//sshhee iiss nnoott iinntteerreesstteedd eennoouugghh 2266%% 1155%%
HHiiss//hheerr ffiinnaanncciiaall ssiittuuaattiioonn 77%% 1188%%
NNoo pprrooggrraammss cclloossee ttoo hhoommee 11%% 33%%
HHee//sshhee wwoonn’’tt hhaavvee tthhee rreeqquuiirreemmeennttss
1199%% 88%%
OOtthheerr 1100%% 1133%%
Note: Asked of the caregiver for the 16‐17 age group and of the young adult for the 18‐21 age group. Respondent could choose more than one answer.
Table 5.9: Current grade or level of schooling by total Developmental Assets (ages 16‐17 years).
CCAASS OONN TToottaall nnuummbbeerr ooff DDeevveellooppmmeennttaall AAsssseettss 11‐‐2200 2211‐‐3300 3311‐‐4400 11‐‐2200 2211‐‐3300 3311‐‐4400
GGrraaddee oorr lleevveell
ooff sscchhoooolliinngg
NNoott ccuurrrreennttllyy eennrroolllleedd iinn sscchhooooll 1111%% 11%% 00%%
GGrraaddee 99 66%% 33%% 00..66%%
GGrraaddee 1100 1188%% 1177%% 1133%%
GGrraaddee 1111 3333%% 4455%% 5500%%
GGrraaddee 1122 1177%% 2255%% 3300%%
UUnnggrraaddeedd 1111%% 77%% 44%%
AApppprreennttiicceesshhiipp 00%% 00%% 00..22%%
CCoolllleeggee ooff AApppplliieedd AArrttss aanndd TTeecchh.. 00..22%% 11%% 00..66%%
CCEEGGEEPP 00%% 00..22%% 00%%
PPrriivvaattee ccaarreeeerr ccoolllleeggee 00%% 00%% 00%%
UUnniivveerrssiittyy 00%% 00%% 00%%
OOtthheerr 44%% 22%% 00..88%%
Table 5.10: Highest level of schooling completed (ages 18‐21 years).
CCAASS OONN AAggee GGrroouupp 1188‐‐2211 1188‐‐2211
HHiigghheesstt lleevveell
ooff eedduuccaattiioonn
ccoommpplleetteedd
LLeessss tthhaann ggrraaddee 99 22%%
GGrraaddee 99 55%%
GGrraaddee 1100 1111%%
GGrraaddee 1111 2255%%
HHiigghh sscchhooooll ddiipplloommaa oorr eeqquuiivvaalleenntt 4499%%
TTeecchhnniiccaall,, ttrraaddee,, oorr vvooccaattiioonnaall sscchhooooll ((aabboovvee hhiigghh sscchhooooll lleevveell)) 00..66%%
CCoommmmuunniittyy ccoolllleeggee,, CCEEGGEEPP,, oorr aapppprreennttiicceesshhiipp 55%%
UUnniivveerrssiittyy ddeeggrreeee 11%%

Looking After Children: Ontario Provincial Report (Year 13) 20
HHooww PPhhyyssiiccaallllyy HHeeaalltthhyy aarree tthhee YYoouunngg PPeeooppllee?? Figure 6.1: Health status of young people by placement setting.
Figure 6.2: Prenatal history (ages 0 to 4 years)
CCAASS OONN
YYeess UUnncceerrttaaiinn NNoo YYeess UUnncceerrttaaiinn NNoo
DDiidd tthhee eexxppeeccttaanntt mmootthheerr ssmmookkee?? 5522%% 3333%% 1155%%
DDiidd tthhee eexxppeeccttaanntt mmootthheerr ddrriinnkk
aallccoohhooll?? 2211%% 5511%% 2277%%
DDiidd tthhee eexxppeeccttaanntt mmootthheerr ttaakkee
iilllliicciitt ddrruuggss?? 3366%% 4400%% 2244%%
DDiidd tthhee eexxppeeccttaanntt mmootthheerr ttaakkee
pprreessccrriippttiioonn mmeeddiiccaattiioonnss?? 1199%% 6600%% 2222%%
DDiidd tthhee eexxppeeccttaanntt mmootthheerr
rreegguullaarrllyy rreecceeiivvee pprreennaattaall ccaarree?? 3377%% 3399%% 2244%%
WWaass tthhee bbaabbyy ccaarrrriieedd ttoo ffuullll‐‐tteerrmm?? 6699%% 1144%% 1177%%
CCAASS OONN CCAASS OONN CCAASS OONN CCAASS OONN
AAggee GGrroouupp 00‐‐44 00‐‐44 55‐‐99 55‐‐99 1100‐‐1155 1100‐‐1155 1166‐‐2211 1166‐‐2211
EExxcceelllleenntt
FFoosstteerr HHoommee
5500%%
FFoosstteerr
HHoommee
4488%%
FFoosstteerr
HHoommee
4499%%
FFoosstteerr
hhoommee
3366%%
VV.. GGoooodd 3388%% 4422%% 3366%% 3399%%
GGoooodd 1100%% 99%% 1133%% 2211%%
FFaaiirr 22%% 11%% 22%% 44%%
PPoooorr 11%% 00..33%% 00..11%% 11%%
EExxcceelllleenntt
KKiinnsshhiipp
5533%%
GGrroouupp
hhoommee
2266%%
GGrroouupp
hhoommee
3355%%
GGrroouupp
hhoommee
2277%%
VV.. GGoooodd 3366%% 5500%% 3377%% 4411%%
GGoooodd 88%% 2244%% 2244%% 2266%%
FFaaiirr 33%% 00%% 44%% 66%%
PPoooorr 00%% 00%% 00%% 11%%
EExxcceelllleenntt
CCuussttoommaarryy
CCaarree
4455%%
KKiinnsshhiipp
5566%%
KKiinnsshhiipp
4466%%
IInndd.. lliivviinngg
2211%%
VV.. GGoooodd 4400%% 3355%% 4400%% 3388%%
GGoooodd 1100%% 66%% 1144%% 3333%%
FFaaiirr 55%% 22%% 00..77%% 66%%
PPoooorr 00%% 00%% 00%% 33%%

Looking After Children: Ontario Provincial Report (Year 13) 21Table 6.3: Young person’s activity level compared to other youths by placement setting (ages 0‐11 years.).
Table 6.4: Percentage of young people who have difficulties in one or more areas of physical ability (ages 1 to 17 years).
CCAASS OONN AAggee GGrroouupp 11‐‐44 55‐‐99 1100‐‐1155 1166‐‐1177 11‐‐44 55‐‐99 1100‐‐1155 1166‐‐1177
PPhhyyssiiccaall
aabbiilliittiieess
SSppeeaakkiinngg 3344%% 2244%% 88%% 44%%
WWaallkkiinngg 1111%% 66%% 33%% 33%%
CClliimmbbiinngg 77%% 66%% 33%% 22%%
BBeennddiinngg 44%% 33%% 33%% 44%%
SSeeeeiinngg 99%% 1166%% 1188%% 1166%%
HHeeaarriinngg 55%% 44%% 44%% 33%%
UUssiinngg hhaannddss aanndd
ffiinnggeerrss 88%% 1111%% 44%% 22%%
Table 6.5: Average number of physical difficulties by placement setting and overall (ages 1 to 17 yeas).
CCAASS OONN CCAASS OONN CCAASS OONN CCAASS OONN
AAggee GGrroouupp 11‐‐44 11‐‐44 55‐‐99 55‐‐99 1100‐‐1155 1100‐‐1155 1166‐‐1177 1166‐‐1177
AAvveerraaggee
nnuummbbeerr ooff
pphhyyssiiccaall
ddiiffffiiccuullttiieess
FFoosstteerr hhoommee 11..44 FFoosstteerr hhoommee 11..77 FFoosstteerr hhoommee 11..66 FFoosstteerr hhoommee 11..44
KKiinnsshhiipp 00..99 GGrroouupp hhoommee 22..77 GGrroouupp hhoommee 11..77 GGrroouupp hhoommee 11..77
CCuussttoommaarryy
CCaarree 11..11 KKiinnsshhiipp 11..77 KKiinnsshhiipp 11..44
IInnddeeppeennddeenntt lliivviinngg
11..44
OOvveerraallll 11..88 OOvveerraallll 11..88 OOvveerraallll 11..66 OOvveerraallll 11..55
CCAASS OONN CCAASS OONN CCAASS OONN
AAggee GGrroouupp 00‐‐44 00‐‐44 55‐‐99 55‐‐99 1100‐‐1111 1100‐‐1111
MMuucchh mmoorree
FFoosstteerr HHoommee
1177%%
FFoosstteerr HHoommee
2200%%
FFoosstteerr HHoommee
1122%%
MMooddeerraatteellyy mmoorree 2222%% 2233%% 2233%%
EEqquuaallllyy 5544%% 4477%% 5511%%
MMooddeerraatteellyy lleessss 44%% 66%% 1122%%
MMuucchh lleessss 33%% 33%% 22%%
MMuucchh mmoorree
KKiinnsshhiipp
1155%%
GGrroouupp HHoommee
2266%%
GGrroouupp hhoommee
2255%%
MMooddeerraatteellyy mmoorree 2255%% 99%% 2299%%
EEqquuaallllyy 5577%% 4411%% 2222%%
MMooddeerraatteellyy lleessss 33%% 99%% 1166%%
MMuucchh lleessss 00%% 1155%% 88%%
MMuucchh mmoorree
CCuussttoommaarryy
CCaarree
2211%%
KKiinnsshhiipp
1144%%
KKiinnsshhiipp
2200%%
MMooddeerraatteellyy mmoorree 3322%% 2277%% 2299%%
EEqquuaallllyy 4477%% 5544%% 3399%%
MMooddeerraatteellyy lleessss 00%% 33%% 1100%%
MMuucchh lleessss 00%% 22%% 11%%

Looking After Children: Ontario Provincial Report (Year 13) 22Table 6.6: Percentage of young people who have long term conditions.
CCAASS OONN AAggee GGrroouupp 00‐‐44 55‐‐99 1100‐‐1155 1166‐‐2211 00‐‐44 55‐‐99 1100‐‐1155 1166‐‐2211
LLoonngg‐‐tteerrmm
ccoonnddiittiioonnss
FFoooodd oorr ddiiggeessttiivvee aalllleerrggiieess 77%% 33%% 33%% 33%%
RReessppiirraattoorryy aalllleerrggiieess 11%% 22%% 33%% 22%%
AAnnyy ootthheerr aalllleerrggiieess 33%% 44%% 44%% 55%%
AAsstthhmmaa 66%% 77%% 66%% 77%%
BBrroonncchhiittiiss 11%% 00..44%% 00..11%% 00..55%%
HHeeaarrtt ccoonnddiittiioonn oorr ddiisseeaassee 22%% 11%% 11%% 11%%
EEppiilleeppssyy 11%% 11%% 22%% 22%%
CCeerreebbrraall ppaallssyy 22%% 22%% 11%% 11%%
KKiiddnneeyy ccoonnddiittiioonn oorr ddiisseeaassee 11%% 11%% 00..55%% 00..44%%
DDeevveellooppmmeennttaall ddiissaabbiilliittyy 1122%% 1133%% 1166%% 1144%%
LLeeaarrnniinngg ddiissaabbiilliittyy 55%% 1199%% 3333%% 3300%%
AAtttteennttiioonn ddeeffiicciitt ddiissoorrddeerr 11%% 2288%% 3366%% 3311%%
EEmmoottiioonnaall,, ppssyycchhoollooggiiccaall,, oorr nneerrvvoouuss ddiiffffiiccuullttiieess 22%% 1199%% 2255%% 2266%%
FFeettaall aallccoohhooll ssppeeccttrruumm ddiissoorrddeerr 22%% 44%% 77%% 55%%
DDiiaabbeetteess 00..11%% 00..44%% 00..55%% 00..66%%
BBlloooodd ddiissoorrddeerr 00..33%% 00..22%% 00..33%% 00..33%%
OOtthheerr lloonngg tteerrmm ccoonnddiittiioonn 1122%% 1122%% 1100%% 88%%
Table 6.7: Average number of long‐term conditions by placement setting and overall.
CCAASS OONN CCAASS OONN CCAASS OONN CCAASS OONN
AAggee GGrroouupp 00‐‐44 00‐‐44 55‐‐99 55‐‐99 1100‐‐1155 1100‐‐1155 1166‐‐2211 1166‐‐2211
AAvveerraaggee
nnuummbbeerr ooff
lloonngg‐‐tteerrmm
ccoonnddiittiioonnss
FFoosstteerr
hhoommee 11..77
FFoosstteerr
hhoommee 11..99
FFoosstteerr
hhoommee 22..11 FFoosstteerr hhoommee 22..11
KKiinnsshhiipp 11..55 GGrroouupp
hhoommee 22..55
GGrroouupp
hhoommee 22..55 GGrroouupp hhoommee 22..33
CCuussttoommaarryy
CCaarree 11..66 KKiinnsshhiipp 11..99 KKiinnsshhiipp 11..88
IInnddeeppeennddeenntt
lliivviinngg 11..77
OOvveerraallll 11..77 OOvveerraallll 22..00 OOvveerraallll 22..11 OOvveerraallll 22..00
Table 6.8: Health‐related experiences by placement setting and overall (ages 10 to 17 years).
CCAASS OONN CCAASS OONN
AAggee GGrroouupp 1100‐‐1155 1100‐‐1155 1166‐‐1177 1166‐‐1177
YYoouunngg ppeeooppllee wwhhoo rreeppoorrtt
eeaattiinngg bbrreeaakkffaasstt mmoosstt sscchhooooll
ddaayyss
FFoosstteerr hhoommee 8855%% FFoosstteerr hhoommee 7700%%
GGrroouupp hhoommee 8800%% GGrroouupp hhoommee 6633%%
KKiinnsshhiipp 8866%% IInnddeeppeennddeenntt lliivviinngg 5500%%
OOvveerraallll 8844%% OOvveerraallll 6655%%

Looking After Children: Ontario Provincial Report (Year 13) 23Table 6.9: Health‐related experiences by placement setting and overall (ages 10 to 21 years).
CCAASS OONN CCAASS OONN
AAggee GGrroouupp 1100‐‐1155 1100‐‐1155 1166‐‐2211 1166‐‐2211
YYoouunngg ppeeooppllee wwhhoo rreeppoorrtt
bbeeiinngg uussuuaallllyy ffrreeee ooff ppaaiinn aanndd
ddiissccoommffoorrtt
FFoosstteerr hhoommee 8833%% FFoosstteerr hhoommee 7799%%
GGrroouupp hhoommee 7755%% GGrroouupp hhoommee 7799%%
KKiinnsshhiipp 8877%% IInnddeeppeennddeenntt lliivviinngg 7700%%
OOvveerraallll 8811%% OOvveerraallll 7777%%
Table 6.10: Most serious injuries experienced by young people within last 12 months (ages 0 to 17 years).
Note: These results reflect only those young people whose caregivers responded “yes” when asked if the young person was seriously injured in the past 12 months.
Table 6.11: Young people’s experience with cigarettes, alcohol, and drugs by total number of Developmental Assets (ages 10‐17 years).
CCAASS OONN AAggee GGrroouupp 00‐‐44 55‐‐99 1100‐‐1155 1166‐‐1177 00‐‐44 55‐‐99 1100‐‐1155 1166‐‐1177
MMoosstt sseerriioouuss
iinnjjuurriieess
BBrrookkeenn oorr ffrraaccttuurreedd bboonneess 1122%% 2255%% 2211%% 1199%%
BBuurrnn oorr ssccaalldd 44%% 22%% 33%% 44%%
DDiissllooccaattiioonn 11%% 11%% 22%% 44%%
SSpprraaiinn oorr ssttrraaiinn 44%% 33%% 2244%% 2255%%
CCuutt,, ssccrraappee,, oorr bbrruuiissee 5588%% 4477%% 3300%% 2222%%
CCoonnccuussssiioonn 11%% 44%% 77%% 99%%
PPooiissoonniinngg bbyy ssuubbssttaannccee oorr lliiqquuiidd 11%% 11%% 00..55%% 33%%
IInntteerrnnaall iinnjjuurryy 00%% 00%% 00..22%% 00..77%%
DDeennttaall iinnjjuurryy 11%% 88%% 22%% 11%%
OOtthheerr sseerriioouuss iinnjjuurryy oorr mmuullttiippllee iinnjjuurriieess 1199%% 1100%% 1122%% 1144%%
1100‐‐1155 1166‐‐1177
CCAASS OONN CCAASS OONN
NNuummbbeerr ooff DDeevveellooppmmeennttaall AAsssseettss 11‐‐2200 2211‐‐3300 3311‐‐4400 11‐‐2200 2211‐‐3300 3311‐‐4400 11‐‐2200 2211‐‐3300 3311‐‐4400 11‐‐2200 2211‐‐3300 3311‐‐4400
SSmmookkiinngg cciiggaarreetttteess
DDaaiillyy 1177%% 66%% 11%% 5500%% 2244%% 99%%
OOccccaassiioonnaallllyy 99%% 55%% 11%% 1100%% 1100%% 44%%
TTrriieedd iitt 1133%% 1111%% 33%% 1100%% 1122%% 1100%%
NNoott aatt aallll 6611%% 7799%% 9944%% 3300%% 5544%% 7777%%
AAllccoohhooll
DDaaiillyy 00..55%% 00..22%% 00..11%% 33%% 00..55%% 00..44%%
OOccccaassiioonnaallllyy 1166%% 66%% 00..77%% 4411%% 2200%% 1133%%
TTrriieedd iitt 1177%% 1111%% 66%% 2277%% 2277%% 2244%%
NNoott aatt aallll 6666%% 8833%% 9933%% 2299%% 5533%% 6633%%
HHaavvee yyoouu eevveerr uusseedd
ddrruuggss?? NNoo 6611%% 7799%% 9933%% 2266%% 5522%% 7733%%
YYeess 3399%% 2211%% 77%% 7744%% 4488%% 2277%%

Looking After Children: Ontario Provincial Report (Year 13) 24
WWhhaatt iiss tthhee SSttaattuuss ooff tthhee YYoouunngg PPeeooppllee’’ss
EEmmoottiioonnaall HHeeaalltthh aanndd OOvveerraallll WWeellll‐‐BBeeiinngg??
Figure 7.1: Total positive mental well‐being score by placement setting and overall (ages 12‐17 years).
CCAASS OONN CCAASS OONN AAggee GGrroouupp 1122‐‐1155 1122‐‐1155 1166‐‐1177 1166‐‐1177
AAvveerraaggee mmeennttaall
wweellll‐‐bbeeiinngg ssccoorree
FFoosstteerr hhoommee 5566..22 FFoosstteerr hhoommee 5533..44
GGrroouupp hhoommee 4499..77 GGrroouupp hhoommee 4477..99
KKiinnsshhiipp 5577..88 IInnddeeppeennddeenntt lliivviinngg 4499..77
OOvveerraallll 5555..44 OOvveerraallll 5522..11
Note: The Mental Health Continuum Short Form is a 14‐item, six‐point scale, reported by the young person. A sample question from the scale is: “During the past month, how often did you feel that you had something important to contribute to society” and response choices are Every day, Almost every day, 2‐3 times a week, About once a week, Once or twice a month, and Never, scored 5‐0 respectively. The possible range of scores is from 0 to 70 with a higher score indicating a greater degree of positive mental well‐being.
Table 7.2: General self‐esteem scores by placement setting and overall (ages 5‐17 years).
CCAASS OONN CCAASS OONN CCAASS OONN
AAggee GGrroouupp 55‐‐99 55‐‐99 1100‐‐1155 1100‐‐1155 1166‐‐1177 1166‐‐1177
AAvveerraaggee
ggeenneerraall sseellff‐‐
eesstteeeemm ssccoorree
FFoosstteerr hhoommee 1100..33 FFoosstteerr hhoommee 1100..11 FFoosstteerr hhoommee 99..99
GGrroouupp hhoommee 99..22 GGrroouupp hhoommee 99..44 GGrroouupp hhoommee 99..55
KKiinnsshhiipp 1100..55 KKiinnsshhiipp 1100..66 IInnddeeppeennddeenntt lliivviinngg 99..66
OOvveerraallll 1100..33 OOvveerraallll 1100..00 OOvveerraallll 99..88
Note: The General Self‐Esteem scale is a six‐item, three‐point scale, reported by the young person (for the 5‐9 age group, the caregiver reports). A sample question from the scale is: “A lot of things about me are good” and response choices are True or mostly true scored 2, Sometimes false/sometimes true scored 1, and False or mostly false scored 0. The possible range of scores is from 0 to 12 with a higher score indicating a greater degree of positive general self‐image.
Table 7.3: Depressive symptoms by residential setting and overall (ages 18‐21 years).
CCAASS OONN
AAggee GGrroouupp 1188‐‐2211 1188‐‐2211
DDeepprreessssiioonn ssccaallee
IInnddeeppeennddeenntt lliivviinngg 88..66
OOtthheerr 77..44
WWiitthh rreellaattiivveess 99..44
OOvveerraallll 88..44
Note: The Depression Scale is a 12‐item, four‐point scale reported by the young adult. An example question is: “I have trouble keeping my mind on what I was doing.” The total possible range of scores is 0‐36. Higher scores on this scale indicate greater depressive symptoms.

Looking After Children: Ontario Provincial Report (Year 13) 25Figure 7.4: Average hope score by placement setting and overall (age 12‐17 years).
CCAASS OONN CCAASS OONN AAggee GGrroouupp 1122‐‐1155 1122‐‐1155 1166‐‐1177 1166‐‐1177
AAvveerraaggee hhooppee
ssccoorree
FFoosstteerr hhoommee 1133..55 FFoosstteerr hhoommee 1133..66
GGrroouupp hhoommee 1111..77 GGrroouupp hhoommee 1122..11
KKiinnsshhiipp 1144..33 IInnddeeppeennddeenntt lliivviinngg 1133..33
OOvveerraallll 1133..44 OOvveerraallll 1133..22
Note: The Hope scale is a six‐item, four‐point scale, reported by the young person. A sample question from the scale is: “I think I am doing pretty well” and response choices are Most of the time scored 3, Often scored 2, Sometimes scored 1, and Never scored 0. The possible range of scores is from 0 to 18 with a higher score indicating a greater degree of hopefulness.
Table 7.5: Perceived quality of friendships by placement setting and overall (ages 10‐17 years).
CCAASS OONN CCAASS OONN AAggee GGrroouupp 1100‐‐1155 1100‐‐1155 1166‐‐1177 1166‐‐1177
AAvveerraaggee qquuaalliittyy
ooff ffrriieennddsshhiippss
ssccoorree
FFoosstteerr hhoommee 33..33 FFoosstteerr hhoommee 33..22
GGrroouupp hhoommee 22..99 GGrroouupp hhoommee 33..00
KKiinnsshhiipp 33..55 IInnddeeppeennddeenntt lliivviinngg 33..11
OOvveerraallll 33..33 OOvveerraallll 33..22
Note: The Friendships scale is a two‐item, three‐point scale, reported by the young person. The items are: “I have many friends” and “I get along easily with others my age.” Response choices are: False or mostly false, scored 0; Sometimes false or sometimes true, scored 1; True or mostly true, scored 2. The possible range of scores is from 0 to 4, with a higher score indicating a greater number of positive relationships with friends.
Figure 7.6: Average approach coping strategies score by placement setting and overall (age 12‐17 years).
CCAASS OONN CCAASS OONN AAggee GGrroouupp 1122‐‐1155 1122‐‐1155 1166‐‐1177 1166‐‐1177
AAvveerraaggee aaccttiivvee
ccooppiinngg ssccoorree
FFoosstteerr hhoommee 77..99 FFoosstteerr hhoommee 77..99
GGrroouupp hhoommee 66..66 GGrroouupp hhoommee 77..22
KKiinnsshhiipp 88..55 IInnddeeppeennddeenntt lliivviinngg 88..22
OOvveerraallll 77..88 OOvveerraallll 77..88
Note: The Approach Coping Strategies scale is a four‐item, four‐point scale, reported by the young person. Items are as indicated in Table 5.6. Response choices are: Never, scored 0; Sometimes, scored 1; Often, scored 2; Always, scored 3. The possible range of scores is from 0 to 12, with a higher score indicating a greater level of hopefulness.

Looking After Children: Ontario Provincial Report (Year 13) 26Table 7.7: Level of perceived mastery reported by young adults by residential setting and overall (ages 18‐21 years).
CCAASS OONN
AAggee GGrroouupp 1188‐‐2211 1188‐‐2211
PPeerrcceeiivveedd
mmaasstteerryy
IInnddeeppeennddeenntt lliivviinngg 1155..11
OOtthheerr 1144..99
WWiitthh rreellaattiivveess 1144..00
OOvveerraallll 1155..00
Note: The Perceived Mastery scale is a seven‐item, four‐point scale, reported by the young adult. An example item is: “What happens to me in the future depends on me.” Response choices are: Strongly disagree, scored 0; Disagree, scored 1; Agree, scored 2; Strongly agree, scored 3. Five of the seven items are reverse coded. The possible range of scores is from 0 to 21, with a higher score indicating a greater degree of mastery perceived by the young person.
Table 7.8: Percentage of caregivers (or young people) who responded “Always” or “Often” with regard to indicators of the young person’s social presentation (ages 10‐21 years).
CCAASS OONN AAggee GGrroouupp 1100‐‐1155 1166‐‐2211 1100‐‐1155 1166‐‐2211
SSoocciiaall
pprreesseennttaattiioonn
KKeeeeppss hhiimmsseellff//hheerrsseellff cclleeaann 8800%% 8855%%
TTaakkeess aaddeeqquuaattee ccaarree ooff hhiiss//hheerr sskkiinn 7777%% 8811%%
PPeerrssoonnaall aappppeeaarraannccee ggiivveess ppeeooppllee tthhee iimmpprreessssiioonnss tthhaatt hhee//sshhee ttaakkeess ccaarree ooff
hhiimmsseellff//hheerrsseellff** 8899%% 8877%%
WWeeaarrss ssuuiittaabbllee ccllootthheess 9933%% 9911%%
PPeeooppllee ccaann uunnddeerrssttaanndd wwhhaatt hhee//sshhee iiss ssaayyiinngg 8899%% 9911%%
IIss ppoolliittee wwiitthh ffrriieennddss//aadduullttss** 8855%% 8833%%
DDoo yyoouu kknnooww hhooww ttoo aaddjjuusstt yyoouurr bbeehhaavviioouurr aanndd ccoonnvveerrssaattiioonn aapppprroopprriiaatteellyy ttoo ddiiffffeerreenntt
ssiittuuaattiioonnss??**** ‐‐‐‐ 9944%%
*Asked only of 10 to 17 year olds ** Asked directly and only of 18‐21 year olds

Looking After Children: Ontario Provincial Report (Year 13) 27 Table 7.9: Percentage of caregivers who responded “Always” or “Often” with regard to indicators of the child’s social presentation (ages 0 to 9 years).
Table 7.10: Attachment to at least one caregiver by placement setting (ages 0‐15 years).
CCAASS OONN AAggee GGrroouupp 00‐‐22 33‐‐44 55‐‐99 00‐‐22 33‐‐44 55‐‐99
SSoocciiaall
pprreesseennttaattiioonn
PPrroommppttllyy cchhaannggeedd wwhheenn wweett oorr ddiirrttyy 9999%% ‐‐‐‐ ‐‐‐‐
BBaatthheedd ddaaiillyy 5577%% ‐‐‐‐ ‐‐‐‐
SSkkiinn aanndd hhaaiirr aarree ccaarreedd ffoorr aapppprroopprriiaatteellyy 9999%% ‐‐‐‐ ‐‐‐‐
DDrreesssseedd aapppprroopprriiaatteellyy 110000%% 9999%% 9988%%
AAppppeeaarrss wweellll ccaarreedd ffoorr ‐‐‐‐ 110000%% 9999%%
MMaakkeess hhiimmsseellff//hheerrsseellff uunnddeerrssttoooodd bbyy ppeeooppllee oouuttssiiddee tthhee iimmmmeeddiiaattee ffaammiillyy
‐‐‐‐ 5588%% 7788%%
SSaayyss pplleeaassee,, tthhaannkk yyoouu,, eexxccuussee mmee,, eettcc.. ‐‐‐‐ 6677%% 7799%%
CCAASS OONN CCAASS OONN CCAASS OONN
AAggee GGrroouupp 00‐‐44 00‐‐44 55‐‐99 55‐‐99 1100‐‐1155 1100‐‐1155
DDeeffiinniitteellyy aattttaacchheedd
FFoosstteerr HHoommee
8844%%
FFoosstteerr HHoommee
7788%%
FFoosstteerr HHoommee
7700%%
SSoommee aattttaacchhmmeenntt 1166%% 2200%% 2266%%
LLiittttllee oorr nnoo
aattttaacchhmmeenntt 11%% 22%% 44%%
DDeeffiinniitteellyy aattttaacchheedd
KKiinnsshhiipp
110000%%
GGrroouupp HHoommee
4466%%
GGrroouupp HHoommee
3366%%
SSoommee aattttaacchhmmeenntt 00%% 3355%% 4455%%
LLiittttllee oorr nnoo
aattttaacchhmmeenntt 00%% 2200%% 1199%%
DDeeffiinniitteellyy aattttaacchheedd
CCuussttoommaarryy
CCaarree
8833%%
KKiinnsshhiipp
8899%%
KKiinnsshhiipp
8899%%
SSoommee aattttaacchhmmeenntt 1177%% 99%% 99%%
LLiittttllee oorr nnoo
aattttaacchhmmeenntt 00%% 22%% 22%%
Looking After Children: Ontario Provincial Report (Year 13) 28Table 7.11: Strengths and Difficulties Questionnaire by placement setting and overall (ages 5‐17 years).
CCAASS OONN CCAASS OONN CCAASS OONN
AAggee GGrroouupp 55‐‐99 55‐‐99 1100‐‐1155 1100‐‐1155 1166‐‐1177 1166‐‐1177
PPrroo‐‐ssoocciiaall
SSccoorree
FFoosstteerr hhoommee 77..55 FFoosstteerr hhoommee 77..88 FFoosstteerr hhoommee 77..88
GGrroouupp hhoommee 55..33 GGrroouupp hhoommee 66..33 GGrroouupp hhoommee 66..55
KKiinnsshhiipp 88..33 KKiinnsshhiipp 88..66 IInnddeeppeennddeenntt lliivviinngg 77..33
OOvveerraallll 77..66 OOvveerraallll 77..66 OOvveerraallll 77..55
EEmmoottiioonnaall
SSyymmppttoommss
SSccoorree
FFoosstteerr hhoommee 22..55 FFoosstteerr hhoommee 22..88 FFoosstteerr hhoommee 22..88
GGrroouupp hhoommee 33..11 GGrroouupp hhoommee 33..66 GGrroouupp hhoommee 33..55
KKiinnsshhiipp 22..55 KKiinnsshhiipp 22..44 IInnddeeppeennddeenntt lliivviinngg 33..55
OOvveerraallll 22..55 OOvveerraallll 22..99 OOvveerraallll 22..99
HHyyppeerraaccttiivviittyy
SSccoorree
FFoosstteerr hhoommee 55..99 FFoosstteerr hhoommee 44..99 FFoosstteerr hhoommee 44..33
GGrroouupp hhoommee 77..11 GGrroouupp hhoommee 66..11 GGrroouupp hhoommee 55..44
KKiinnsshhiipp 44..99 KKiinnsshhiipp 44..22 IInnddeeppeennddeenntt lliivviinngg 44..88
OOvveerraallll 55..77 OOvveerraallll 55..00 OOvveerraallll 44..66
CCoonndduucctt
PPrroobblleemmss
SSccoorree
FFoosstteerr hhoommee 33..11 FFoosstteerr hhoommee 22..66 FFoosstteerr hhoommee 22..22
GGrroouupp hhoommee 33..66 GGrroouupp hhoommee 33..88 GGrroouupp hhoommee 33..66
KKiinnsshhiipp 22..33 KKiinnsshhiipp 11..88 IInnddeeppeennddeenntt lliivviinngg 33..88
OOvveerraallll 33..00 OOvveerraallll 22..77 OOvveerraallll 22..66
PPeeeerr RReellaattiioonn
PPrroobblleemmss
SSccoorree
FFoosstteerr hhoommee 22..33 FFoosstteerr hhoommee 22..44 FFoosstteerr hhoommee 22..55
GGrroouupp hhoommee 33..99 GGrroouupp hhoommee 33..88 GGrroouupp hhoommee 33..66
KKiinnsshhiipp 11..88 KKiinnsshhiipp 11..66 IInnddeeppeennddeenntt lliivviinngg 22..44
OOvveerraallll 22..33 OOvveerraallll 22..66 OOvveerraallll 22..77
TToottaall
DDiiffffiiccuullttiieess
SSccoorree
FFoosstteerr hhoommee 1133..88 FFoosstteerr hhoommee 1122..77 FFoosstteerr hhoommee 1111..77
GGrroouupp hhoommee 1177..33 GGrroouupp hhoommee 1177..33 GGrroouupp hhoommee 1166..00
KKiinnsshhiipp 1111..44 KKiinnsshhiipp 99..88 IInnddeeppeennddeenntt lliivviinngg 1144..55
OOvveerraallll 1133..55 OOvveerraallll 1133..22 OOvveerraallll 1122..88
Note: The Pro‐social scale is a five‐item, three‐point scale, reported by the caregiver. A sample item is: “Shares readily with other youth, for example books, games, food.” Response choices are: Not true, scored 0; Somewhat true, scored 1; True, scored 2. The possible range of scores is from 0 to 10, with a higher score indicating a greater amount of pro‐social behaviours.
The Emotional Symptoms scale is a five‐item, three‐point scale reported by the caregiver. A sample item is: “Often unhappy, depressed, or tearful.” Response choices are: Not true, scored 0; Somewhat true, scored 1; True, scored 2. The possible range of scores is from 0 to 10, with a higher score indicating a greater amount of emotional symptoms.
The Hyperactivity scale is a five‐item, three‐point scale reported by the caregiver. A sample item is: “Easily distracted, concentration wanders.” Response choices are: Not true, scored 0; Somewhat true, scored 1; True, scored 2. Two items are reverse coded. The possible range of scores is from 0 to 10, with a higher score indicating a greater degree of hyperactivity.
The Conduct Problems scale is a five‐item, three‐point scale reported by the caregiver. A sample item is: “Often loses temper.” Response choices are: Not true, scored 0; Somewhat true, scored 1; True, scored 2. The possible range of scores is from 0 to 10, with a higher score indicating a greater number of behaviours associated with conduct problems.
The Peer Relation Problems scale is a five‐item, three‐point scale reported by the caregiver. A sample item is: “Would rather be alone than with other youth.” Response choices are: Not true, scored 0; Somewhat true, scored 1; True, scored 2. Two items are reverse coded. The possible range of scores is from 0 to 10, with a higher score indicating a greater level of problems with peers.
The Total Difficulties score is a twenty‐item, three‐point scale, constructed by adding together the items from the Emotional Symptoms scale, the Hyperactivity scale, the Conduct Problems scale, and the Peer Relation Problems scale. The possible range of scores is from 0 to 40, with a higher score indicating a greater level of overall difficulties.
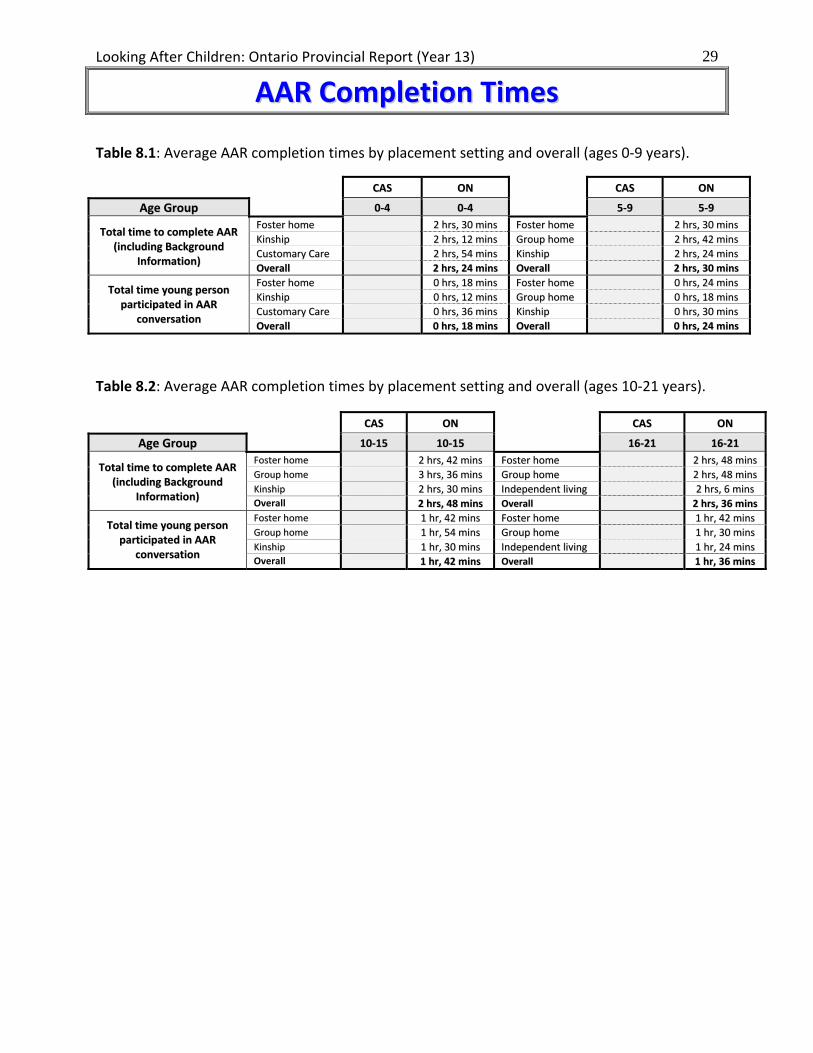
Looking After Children: Ontario Provincial Report (Year 13) 29
AAAARR CCoommpplleettiioonn TTiimmeess
Table 8.1: Average AAR completion times by placement setting and overall (ages 0‐9 years).
CCAASS OONN CCAASS OONN
AAggee GGrroouupp 00‐‐44 00‐‐44 55‐‐99 55‐‐99
TToottaall ttiimmee ttoo ccoommpplleettee AAAARR
((iinncclluuddiinngg BBaacckkggrroouunndd
IInnffoorrmmaattiioonn))
FFoosstteerr hhoommee 22 hhrrss,, 3300 mmiinnss FFoosstteerr hhoommee 22 hhrrss,, 3300 mmiinnss
KKiinnsshhiipp 22 hhrrss,, 1122 mmiinnss GGrroouupp hhoommee 22 hhrrss,, 4422 mmiinnss
CCuussttoommaarryy CCaarree 22 hhrrss,, 5544 mmiinnss KKiinnsshhiipp 22 hhrrss,, 2244 mmiinnss
OOvveerraallll 22 hhrrss,, 2244 mmiinnss OOvveerraallll 22 hhrrss,, 3300 mmiinnss
TToottaall ttiimmee yyoouunngg ppeerrssoonn
ppaarrttiicciippaatteedd iinn AAAARR
ccoonnvveerrssaattiioonn
FFoosstteerr hhoommee 00 hhrrss,, 1188 mmiinnss FFoosstteerr hhoommee 00 hhrrss,, 2244 mmiinnss
KKiinnsshhiipp 00 hhrrss,, 1122 mmiinnss GGrroouupp hhoommee 00 hhrrss,, 1188 mmiinnss
CCuussttoommaarryy CCaarree 00 hhrrss,, 3366 mmiinnss KKiinnsshhiipp 00 hhrrss,, 3300 mmiinnss
OOvveerraallll 00 hhrrss,, 1188 mmiinnss OOvveerraallll 00 hhrrss,, 2244 mmiinnss
Table 8.2: Average AAR completion times by placement setting and overall (ages 10‐21 years).
CCAASS OONN CCAASS OONN
AAggee GGrroouupp 1100‐‐1155 1100‐‐1155 1166‐‐2211 1166‐‐2211
TToottaall ttiimmee ttoo ccoommpplleettee AAAARR
((iinncclluuddiinngg BBaacckkggrroouunndd
IInnffoorrmmaattiioonn))
FFoosstteerr hhoommee 22 hhrrss,, 4422 mmiinnss FFoosstteerr hhoommee 22 hhrrss,, 4488 mmiinnss
GGrroouupp hhoommee 33 hhrrss,, 3366 mmiinnss GGrroouupp hhoommee 22 hhrrss,, 4488 mmiinnss
KKiinnsshhiipp 22 hhrrss,, 3300 mmiinnss IInnddeeppeennddeenntt lliivviinngg 22 hhrrss,, 66 mmiinnssOverall 22 hhrrss,, 4488 mmiinnss OOvveerraallll 22 hhrrss,, 3366 mmiinnss
TToottaall ttiimmee yyoouunngg ppeerrssoonn
ppaarrttiicciippaatteedd iinn AAAARR
ccoonnvveerrssaattiioonn
FFoosstteerr hhoommee 11 hhrr,, 4422 mmiinnss FFoosstteerr hhoommee 11 hhrr,, 4422 mmiinnss
GGrroouupp hhoommee 11 hhrr,, 5544 mmiinnss GGrroouupp hhoommee 11 hhrr,, 3300 mmiinnss
KKiinnsshhiipp 11 hhrr,, 3300 mmiinnss IInnddeeppeennddeenntt lliivviinngg 11 hhrr,, 2244 mmiinnssOverall 11 hhrr,, 4422 mmiinnss OOvveerraallll 11 hhrr,, 3366 mmiinnss