
Jyotsna Kumar Mandal Debika Bhattacharya Editors Emerging ...
30
Advances in Intelligent Systems and Computing 937 Jyotsna Kumar Mandal Debika Bhattacharya Editors Emerging Technology in Modelling and Graphics Proceedings of IEM Graph 2018
Transcript of Jyotsna Kumar Mandal Debika Bhattacharya Editors Emerging ...

Advances in Intelligent Systems and Computing 937
Jyotsna Kumar MandalDebika Bhattacharya Editors
Emerging Technology in Modelling and GraphicsProceedings of IEM Graph 2018

Advances in Intelligent Systems and Computing
Volume 937
Series Editor
Janusz Kacprzyk, Systems Research Institute, Polish Academy of Sciences,Warsaw, Poland
Advisory Editors
Nikhil R. Pal, Indian Statistical Institute, Kolkata, IndiaRafael Bello Perez, Faculty of Mathematics, Physics and Computing,Universidad Central de Las Villas, Santa Clara, CubaEmilio S. Corchado, University of Salamanca, Salamanca, SpainHani Hagras, School of Computer Science & Electronic Engineering,University of Essex, Colchester, UKLászló T. Kóczy, Department of Automation, Széchenyi István University,Gyor, HungaryVladik Kreinovich, Department of Computer Science, University of Texasat El Paso, El Paso, TX, USAChin-Teng Lin, Department of Electrical Engineering, National ChiaoTung University, Hsinchu, TaiwanJie Lu, Faculty of Engineering and Information Technology,University of Technology Sydney, Sydney, NSW, AustraliaPatricia Melin, Graduate Program of Computer Science, Tijuana Instituteof Technology, Tijuana, MexicoNadia Nedjah, Department of Electronics Engineering, University of Rio deJaneiro, Rio de Janeiro, BrazilNgoc Thanh Nguyen, Faculty of Computer Science and Management,Wrocław University of Technology, Wrocław, PolandJun Wang, Department of Mechanical and Automation Engineering,The Chinese University of Hong Kong, Shatin, Hong Kong

The series “Advances in Intelligent Systems and Computing” contains publicationson theory, applications, and design methods of Intelligent Systems and IntelligentComputing. Virtually all disciplines such as engineering, natural sciences, computerand information science, ICT, economics, business, e-commerce, environment,healthcare, life science are covered. The list of topics spans all the areas of modernintelligent systems and computing such as: computational intelligence, soft comput-ing including neural networks, fuzzy systems, evolutionary computing and the fusionof these paradigms, social intelligence, ambient intelligence, computational neuro-science, artificial life, virtual worlds and society, cognitive science and systems,Perception and Vision, DNA and immune based systems, self-organizing andadaptive systems, e-Learning and teaching, human-centered and human-centriccomputing, recommender systems, intelligent control, robotics and mechatronicsincluding human-machine teaming, knowledge-based paradigms, learning para-digms, machine ethics, intelligent data analysis, knowledge management, intelligentagents, intelligent decision making and support, intelligent network security, trustmanagement, interactive entertainment, Web intelligence and multimedia.
The publications within “Advances in Intelligent Systems and Computing” areprimarily proceedings of important conferences, symposia and congresses. Theycover significant recent developments in the field, both of a foundational andapplicable character. An important characteristic feature of the series is the shortpublication time and world-wide distribution. This permits a rapid and broaddissemination of research results.
** Indexing: The books of this series are submitted to ISI Proceedings,EI-Compendex, DBLP, SCOPUS, Google Scholar and Springerlink **
More information about this series at http://www.springer.com/series/11156

Jyotsna Kumar Mandal •
Debika BhattacharyaEditors
Emerging Technologyin Modelling and GraphicsProceedings of IEM Graph 2018
123

EditorsJyotsna Kumar MandalDepartment of Computer Scienceand EngineeringUniversity of KalyaniKalyani, West Bengal, India
Debika BhattacharyaDepartment of Computer Scienceand EngineeringInstitute of Engineering and ManagementKolkata, West Bengal, India
ISSN 2194-5357 ISSN 2194-5365 (electronic)Advances in Intelligent Systems and ComputingISBN 978-981-13-7402-9 ISBN 978-981-13-7403-6 (eBook)https://doi.org/10.1007/978-981-13-7403-6
© Springer Nature Singapore Pte Ltd. 2020This work is subject to copyright. All rights are reserved by the Publisher, whether the whole or partof the material is concerned, specifically the rights of translation, reprinting, reuse of illustrations,recitation, broadcasting, reproduction on microfilms or in any other physical way, and transmissionor information storage and retrieval, electronic adaptation, computer software, or by similar or dissimilarmethodology now known or hereafter developed.The use of general descriptive names, registered names, trademarks, service marks, etc. in thispublication does not imply, even in the absence of a specific statement, that such names are exempt fromthe relevant protective laws and regulations and therefore free for general use.The publisher, the authors and the editors are safe to assume that the advice and information in thisbook are believed to be true and accurate at the date of publication. Neither the publisher nor theauthors or the editors give a warranty, expressed or implied, with respect to the material containedherein or for any errors or omissions that may have been made. The publisher remains neutral with regardto jurisdictional claims in published maps and institutional affiliations.
This Springer imprint is published by the registered company Springer Nature Singapore Pte Ltd.The registered company address is: 152 Beach Road, #21-01/04 Gateway East, Singapore 189721,Singapore

Preface
The 1st International Conference IEMGraph 2018—International Conference onEmerging Technology in Modelling and Graphics was held on 6–7 September 2018in Kolkata, India. IEMGraph 2018 was an international and interdisciplinary con-ference covering research and development in the field of emerging technologies inintelligent systems and computing. It addressed all trending research topics and thelatest research in emerging technology in modelling and graphics including imageprocessing and analysis, image segmentation, digital geometry for computerimaging, image and security, biometrics, video processing, medical imaging, andvirtual and augmented reality.
More than 250 pre-registered authors submitted their work in this conference.IEMGraph 2018 finally accepted and hosted 70 papers after a double-blind peerreview process. The conference technical committee with the contribution ofcompetent and expert reviewers decided about the acceptance of the submittedpapers.
One of the primary objectives of IEMGraph 2018 was the investigation ofinformation-based technological change and its adaptation in different industriesand academic world. The conference tried to bridge the gap between industrydemand and academic supply in research fields to address that demand. This annualevent was addressed jointly to academics and practitioners and provided a forum fora number of perspectives based on either theoretical analyses or empirical casestudies that foster the exchange of ideas. The conference offered a number ofsessions under its patronage that was a valuable resource for scholars and practi-tioners, and also the conference workshop was organized to give hands-on expe-rience to students in image processing, graphical modelling, and AI-related fields.
We would like to thank all participated in any way in the IEMGraph 2018 andteam members of organizing committee and other committees for organizing theconference successfully. Also, thanks to the contributors of this volume for con-tributing their articles for publication. We express our sincere gratitude to thefamous publication house Springer for their communication sponsorship and the
v

co-organizer “Indian Space Research Organisation (ISRO)”, India, for their tech-nical sponsorship, and to the members of the technical committee who provided asignificant contribution to the review of papers and all members of the organizingcommittee for their help, support, and spirit participation before, during, and afterthe conference.
This volume will be a state-of-the-art material for researchers, engineers, andstudents.
Kalyani, India Jyotsna Kumar MandalKolkata, India Debika Bhattacharya
vi Preface

Contents
Identification of Noise Pollution Prone Regions in Mumbai UsingExpectation-Maximization Clustering Technique . . . . . . . . . . . . . . . . . . 1Arushi Agarwal, Pratibha Chaudhary, Rana Majumdar,Sunil Kumar Chowdhary and Abhishek Srivastava
An Automated Segmentation Approach from Colored RetinalImages for Feature Extraction . . . . . . . . . . . . . . . . . . . . . . . . . . . . . . . . 9Suchismita Goswami, Sushmita Goswami, Shubhasri Roy,Shreejita Mukherjee and Nilanjana Dutta Roy
Epileptic Seizure Recognition Using Deep Neural Network . . . . . . . . . . 21Anubhav Guha, Soham Ghosh, Ayushi Roy and Sankhadeep Chatterjee
Graph-Based Supervised Feature Selection Using CorrelationExponential . . . . . . . . . . . . . . . . . . . . . . . . . . . . . . . . . . . . . . . . . . . . . . 29Gulshan Kumar, Gitesh Jain, Mrityunjoy Panday, Amit Kumar Dasand Saptarsi Goswami
A Sentiment-Based Hotel Review Summarization . . . . . . . . . . . . . . . . . . 39Debraj Ghosh
Heuristic Approach for Finding Threshold Value in ImageSegmentation . . . . . . . . . . . . . . . . . . . . . . . . . . . . . . . . . . . . . . . . . . . . . 45Sandip Mal and Ashiwani Kumar
An Educational Chatbot for Answering Queries . . . . . . . . . . . . . . . . . . 55Sharob Sinha, Shyanka Basak, Yajushi Dey and Anupam Mondal
A Supervised Approach to Analyse and Simplify Micro-texts . . . . . . . . 61Vaibhav Chaturvedi, Arunangshu Pramanik, Sheersendu Ghosh,Priyanka Bhadury and Anupam Mondal
vii

A Short Review on Different Clustering Techniques and TheirApplications . . . . . . . . . . . . . . . . . . . . . . . . . . . . . . . . . . . . . . . . . . . . . . 69Attri Ghosal, Arunima Nandy, Amit Kumar Das, Saptarsi Goswamiand Mrityunjoy Panday
An Efficient Descriptor for Gait Recognition Using Spatio-TemporalCues . . . . . . . . . . . . . . . . . . . . . . . . . . . . . . . . . . . . . . . . . . . . . . . . . . . . 85Sanjay Kumar Gupta, Gaurav Mahesh Sultaniya and Pratik Chattopadhyay
Supervised Classification Algorithms in Machine Learning:A Survey and Review . . . . . . . . . . . . . . . . . . . . . . . . . . . . . . . . . . . . . . . 99Pratap Chandra Sen, Mahimarnab Hajra and Mitadru Ghosh
Breast Cancer Diagnosis Using Image Processing and MachineLearning . . . . . . . . . . . . . . . . . . . . . . . . . . . . . . . . . . . . . . . . . . . . . . . . . 113Subham Sadhukhan, Nityasree Upadhyay and Prerana Chakraborty
Using Convolutions and Image Processing Techniques to SegmentLungs from CT Data . . . . . . . . . . . . . . . . . . . . . . . . . . . . . . . . . . . . . . . 129Souvik Ghosh, Sayan Sil, Rohan Mark Gomes and Monalisa Dey
Analyzing Code-Switching Rules for English–Hindi Code-MixedText . . . . . . . . . . . . . . . . . . . . . . . . . . . . . . . . . . . . . . . . . . . . . . . . . . . . 137Sainik Kumar Mahata, Sushnat Makhija, Ayushi Agnihotriand Dipankar Das
Detection of Pulsars Using an Artificial Neural Network . . . . . . . . . . . . 147Rajarshi Lahiri, Souvik Dey, Soumit Roy and Soumyadip Nag
Modification of Existing Face Images Based on TextualDescription Through Local Geometrical Transformation . . . . . . . . . . . . 159Mrinmoyi Pal, Subhajit Ghosh and Rajnika Sarkar
A Neural Network Framework to Generate Caption from Images . . . . . 171Ayan Ghosh, Debarati Dutta and Tiyasa Moitra
Remote Sensing and Advanced Encryption Standard Using256-Bit Key . . . . . . . . . . . . . . . . . . . . . . . . . . . . . . . . . . . . . . . . . . . . . . 181Sumiran Naman, Sayari Bhattacharyya and Tufan Saha
Grasp-Pose Prediction for Hand-Held Objects . . . . . . . . . . . . . . . . . . . . 191Abhirup Das, Ayon Chattopadhyay, Firdosh Alia and Juhi Kumari
A Multi-level Polygonal Approximation-Based Shape EncodingFramework for Automated Shape Retrieval . . . . . . . . . . . . . . . . . . . . . . 203Sourav Saha, Soumi Bhunia, Laboni Nayak, Rebeka Bhattacharyyaand Priya Ranjan Sinha Mahapatra
viii Contents
A Hand Gesture Recognition Model Using Fuzzy DirectionalEncoding of Polygonal Approximation . . . . . . . . . . . . . . . . . . . . . . . . . . 217Sourav Saha, Soma Das, Shubham Debnath and Sayantan Banik
Signature-Based Data Reporting in Wireless Sensor Networks . . . . . . . 231Monika Bhalla and Ajay Sharma
Wine Quality Analysis Using Machine Learning . . . . . . . . . . . . . . . . . . 239Bipul Shaw, Ankur Kumar Suman and Biswarup Chakraborty
Generalized Smart Traffic Regulation Framework with DynamicAdaptation and Prediction Logic Using Computer Vision . . . . . . . . . . . 249Vishal Narnolia, Uddipto Jana, Soham Chattopadhyay and Shramana Roy
A Short Review on Applications of Big Data Analytics . . . . . . . . . . . . . 265Ranajit Roy, Ankur Paul, Priya Bhimjyani, Nibhash Dey,Debankan Ganguly, Amit Kumar Das and Suman Saha
A Survey of Music Recommendation Systems with a ProposedMusic Recommendation System . . . . . . . . . . . . . . . . . . . . . . . . . . . . . . . 279Dip Paul and Subhradeep Kundu
Interactive Systems for Fashion Clothing Recommendation . . . . . . . . . . 287Himani Sachdeva and Shreelekha Pandey
Embedded Implementation of Early Started Hybrid DenoisingTechnique for Medical Images with Optimized Loop . . . . . . . . . . . . . . . 295Khakon Das, Mausumi Maitra, Minakshi Banerjee and Punit Sharma
Stress Profile Analysis in n-FinFET Devices . . . . . . . . . . . . . . . . . . . . . . 309T. P. Dash, S. Das, S. Dey, J. Jena and C. K. Maiti
An Annotation System to Annotate Healthcare Informationfrom Tweets . . . . . . . . . . . . . . . . . . . . . . . . . . . . . . . . . . . . . . . . . . . . . . 319Nixon Dutta, Anupam Mondal and Pritam Paul
Broad Neural Network for Change Detection in Aerial Images . . . . . . . 327Shailesh Shrivastava, Alakh Aggarwal and Pratik Chattopadhyay
User-Item-Based Hybrid Recommendation System by EmployingMahout Framework . . . . . . . . . . . . . . . . . . . . . . . . . . . . . . . . . . . . . . . . 341Sutanu Paul and Dipankar Das
Gray Matter Segmentation and Delineation from PositronEmission Tomography (PET) Image . . . . . . . . . . . . . . . . . . . . . . . . . . . 359Abhishek Bal, Minakshi Banerjee, Punit Sharma and Mausumi Maitra
A Joint Image Compression–Encryption Algorithm Basedon SPIHT Coding and 3D Chaotic Map . . . . . . . . . . . . . . . . . . . . . . . . . 373Ramkrishna Paira
Contents ix

Improved Multi-feature Computer Vision for Video Surveillance . . . . . 383Ashutosh Upadhyay and Jeevanandam Jotheeswaran
Topic Modeling for Text Classification . . . . . . . . . . . . . . . . . . . . . . . . . . 395Pinaki Prasad Guha Neogi, Amit Kumar Das, Saptarsi Goswamiand Joy Mustafi
Low Frequency Noise Analysis in Strained-Si Devices . . . . . . . . . . . . . . 409Sanghamitra Das, Tara Prasanna Dash and Chinmay Kumar Maiti
Employing Cross-genre Unstructured Texts to Extract Entitiesin Adapting Sister Domains . . . . . . . . . . . . . . . . . . . . . . . . . . . . . . . . . . 419Promita Maitra and Dipankar Das
Relation Extraction from Cross-Genre Unstructured Text . . . . . . . . . . . 433Promita Maitra and Dipankar Das
An Efficient Algorithm for Detecting and Measure the Propertiesof Pothole . . . . . . . . . . . . . . . . . . . . . . . . . . . . . . . . . . . . . . . . . . . . . . . . 447Amitava Choudhury, Rohit Ramchandani, Mohammad Shamoon,Ankit Khare and Keshav Kaushik
Quantitative Interpretation of Cryptographic Algorithms . . . . . . . . . . . 459Aditi Jha and Shilpi Sharma
Ransomware Attack: India Issues Red Alert . . . . . . . . . . . . . . . . . . . . . 471Simran Sabharwal and Shilpi Sharma
An Automated Dual Threshold Band-Based Approach for MalariaParasite Segmentation from Thick Blood Smear . . . . . . . . . . . . . . . . . . 485Debapriya Paul, Nilanjan Daw, Nilanjana Dutta Roy and Arindam Biswas
A Secured Biometric-Based Authentication Scheme in IoT-BasedPatient Monitoring System . . . . . . . . . . . . . . . . . . . . . . . . . . . . . . . . . . . 501Sushanta Sengupta
Automatic Facial Expression Recognition Using GeometricalFeatures . . . . . . . . . . . . . . . . . . . . . . . . . . . . . . . . . . . . . . . . . . . . . . . . . 519Tanmoy Banerjee, Sayantan De, Sampriti Das, Susmit Sarkarand Spandan Swarnakar
A Review on Different Image De-hazing Methods . . . . . . . . . . . . . . . . . 533Sweta Shaw, Rajarshi Gupta and Somshubhra Roy
An OverView of Different Image Algorithms and FilteringTechniques . . . . . . . . . . . . . . . . . . . . . . . . . . . . . . . . . . . . . . . . . . . . . . . 541Sumit Prakash, Abhas Somya and Ayush Kumar Rai
Design of a Quantum One-Way Trapdoor Function . . . . . . . . . . . . . . . 547Partha Sarathi Goswami and Tamal Chakraborty
x Contents

Relation Estimation of Packets Dropped by Wormhole Attackto Packets Sent Using Regression Analysis . . . . . . . . . . . . . . . . . . . . . . . 557Sayan Majumder and Debika Bhattacharyya
A Review on Agricultural Advancement Based on ComputerVision and Machine Learning . . . . . . . . . . . . . . . . . . . . . . . . . . . . . . . . 567Abriti Paul, Sourav Ghosh, Amit Kumar Das, Saptarsi Goswami,Sruti Das Choudhury and Soumya Sen
Transformation of Supply Chain Provenance UsingBlockchain—A Short Review . . . . . . . . . . . . . . . . . . . . . . . . . . . . . . . . . 583Sekhar Kumar Roy, Runa Ganguli and Saptarsi Goswami
A Framework for Predicting and Identifying Radicalizationand Civil Unrest Oriented Threats from WhatsApp Group . . . . . . . . . . 595Koushik Deb, Souptik Paul and Kaustav Das
Flower Pollination Algorithm-Based FIR Filter Design for ImageDenoising . . . . . . . . . . . . . . . . . . . . . . . . . . . . . . . . . . . . . . . . . . . . . . . . 607Supriya Dhabal, Srija Chakraborty and Prosenjit Sikdar
Image Enhancement Using Differential Evolution Based WhaleOptimization Algorithm . . . . . . . . . . . . . . . . . . . . . . . . . . . . . . . . . . . . . 619Supriya Dhabal and Dip Kumar Saha
Advanced Portable Exoskeleton with Self-healing TechnologyAssisted by AI . . . . . . . . . . . . . . . . . . . . . . . . . . . . . . . . . . . . . . . . . . . . 629Piyush Keshari and Santanu Koley
Crosstalk Minimization as a High-Performance Factor in Three-LayerChannel Routing . . . . . . . . . . . . . . . . . . . . . . . . . . . . . . . . . . . . . . . . . . 645Sumanta Chakraborty
A Human Intention Detector—An Application of SentimentAnalysis . . . . . . . . . . . . . . . . . . . . . . . . . . . . . . . . . . . . . . . . . . . . . . . . . 659Megha Dutta, Shayan Mondal, Sanjay Chakrabortyand Arpan Chakraborty
Survey on Applications of Machine Learning in the Fieldof Computer Vision . . . . . . . . . . . . . . . . . . . . . . . . . . . . . . . . . . . . . . . . 667Himanshu Shekhar, Sujoy Seal, Saket Kedia and Amartya Guha
Automatic Speech Recognition Based on Clustering Technique . . . . . . . 679Saswati Debnath and Pinki Roy
A Study of Interrelation Between Ratings and User Reviewsin Light of Classification . . . . . . . . . . . . . . . . . . . . . . . . . . . . . . . . . . . . 689Pritam Mondal, Amlan Ghosh, Abhirup Sinha and Saptarsi Goswami
Contents xi

A Study on Spatiotemporal Topical Analysis of Twitter Data . . . . . . . . 699Lalmohan Dutta, Giridhar Maji and Soumya Sen
A Secure Steganography Scheme Using LFSR . . . . . . . . . . . . . . . . . . . . 713Debalina Ghosh, Arup Kumar Chattopadhyay, Koustav Chandaand Amitava Nag
Crowd Behavior Analysis and Alert System Using ImageProcessing . . . . . . . . . . . . . . . . . . . . . . . . . . . . . . . . . . . . . . . . . . . . . . . 721Sayan Dutta, Sayan Burman, Agnip Mazumdar and Nilanjana Dutta Roy
Review Article on Magnetic Resonance Imaging . . . . . . . . . . . . . . . . . . 731Shatadru Majumdar, Rashmita Roy, Madhurima Senand Mahima Chakraborty
An Intelligent Traffic Light Control System Based on Densityof Traffic . . . . . . . . . . . . . . . . . . . . . . . . . . . . . . . . . . . . . . . . . . . . . . . . 741Kriti Dangi, Manish Singh Kushwaha and Rajitha Bakthula
Scheduling in Cloud Computing Environment using MetaheuristicTechniques: A Survey . . . . . . . . . . . . . . . . . . . . . . . . . . . . . . . . . . . . . . 753Harvinder Singh, Sanjay Tyagi and Pardeep Kumar
Crown Detection and Counting Using Satellite Images . . . . . . . . . . . . . 765Rebeka Bhattacharyya and Avijit Bhattacharyya
Hand Segmentation from Complex Background for GestureRecognition . . . . . . . . . . . . . . . . . . . . . . . . . . . . . . . . . . . . . . . . . . . . . . 775Soumi Paul, Arpan Bhattacharyya, Ayatullah Faruk Mollah,Subhadip Basu and Mita Nasipuri
A Study on Content Selection and Cost-Effectiveness of CognitiveE-Learning in Distance Education of Rural Areas . . . . . . . . . . . . . . . . . 783Anindita Chatterjee, Kushal Ghosh and Biswajoy Chatterjee
An Automatic Method for Bifurcation Angle Calculationin Retinal Fundus Image . . . . . . . . . . . . . . . . . . . . . . . . . . . . . . . . . . . . 787Suchismita Goswami and Sushmita Goswami
Author Index . . . . . . . . . . . . . . . . . . . . . . . . . . . . . . . . . . . . . . . . . . . . . . . . 797
xii Contents
About the Editors
Jyotsna Kumar Mandal, M.Sc.(Ph.), JU, M.Tech.(CS), CU, Ph.D.(Eng.), JUProfessor CSE, is former Dean of the FETM, and was KU for two consecutiveterms. He has nearly 30 years of teaching and research experience, and has com-pleted four AICTE and one state government project. He is a life member of theCSI, CRSI, a member of the ACM, and fellow of the IETE. He was also honoraryvice chairman and chairman of the CSI. He has delivered over 100 lectures andorganized more than 25 national and international conferences. He currently servesas an editorial board member and corresponding editor for the Proceedings ofScience Direct, IEEE and other conferences, as well as guest editor of the MSTJournal. He has published more than 400 research articles and six books.
Dr. Debika Bhattacharya obtained her B.Tech. and M.Tech. in Radiophysics andElectronics from Calcutta University, and her Ph.D. in Electronics and Telecom-munication from Jadavpur University. She is currently Dean (of Academics) at theInstitute of Engineering andManagement. She hasmore than 22 years of teaching andresearch experience, has publishedmany papers in prominent journals and conferenceproceedings, and has completed 2AICTE and 1DST project. In 2018 she received theVenus International Foundation’s “Distinguished Leader” award in engineering.
xiii

Identification of Noise Pollution ProneRegions in Mumbai UsingExpectation-Maximization ClusteringTechnique
Arushi Agarwal, Pratibha Chaudhary, Rana Majumdar,Sunil Kumar Chowdhary and Abhishek Srivastava
Abstract Noise pollution is escalating at an alarming rate as a one of the criticaloutcomes of urbanization. This led to harmful effect on the health of human being asit can cause annoyance, hypertension, heart disease, and sleep disturbances. Despiteall measures to control noise pollution that have been taken in Mumbai so far, thoseare prone to vulnerabilities. The differences in these vulnerability-inducing causesarise a need for an effective analysis. Themotive of this paper is to have datamining tocome to aid to create a model that provides the heterogeneity of the data by groupingsimilar objects together to find the noise pollution regions in the Mumbai state withrespect to different factors.
Keywords Data mining · Cluster · Noise pollution · Root nodes
1 Introduction
From past few years, industries have been extended and numbers of transport vehi-cles on the roads have been increased due to rapid urbanization. These are the sourcesof environmental noise pollution. Noise pollution led to harmful effect on the phys-iological and physical health of human being. Noise pollution can cause annoyance,
A. Agarwal · P. Chaudhary · R. Majumdar (B) · S. K. Chowdhary · A. SrivastavaAmity School of Engineering and Technology,Amity University, Noida, Uttar Pradesh, Indiae-mail: [email protected]
A. Agarwale-mail: [email protected]
P. Chaudharye-mail: [email protected]
S. K. Chowdharye-mail: [email protected]
A. Srivastavae-mail: [email protected]
© Springer Nature Singapore Pte Ltd. 2020J. K. Mandal and D. Bhattacharya (eds.), Emerging Technology in Modellingand Graphics, Advances in Intelligent Systems and Computing 937,https://doi.org/10.1007/978-981-13-7403-6_1
1

2 A. Agarwal et al.
hypertension, heart disease, and sleep disturbances.As per the report byWHO(WorldHealth Organization), several cities had exceeded the acceptable level of noise pol-lution. In India, in 2011, Central Pollution Control Board (CPCB) [1] has been set upfor Real-time National Ambient Noise Monitoring Network that includes nine cities(Delhi, Lucknow, Chennai,Mumbai, NaviMumbai, Thane, Kolkata, Hyderabad, andBangalore). According to the statistical report generated by CPCB [1], Mumbai is onthe top that exceeded maximum limits of prescribed noise level. Particularly, amidGaneshotsav, the highest levels of noise are recorded on this day.
According to WHO standard [2], the community noise should not be more than30 A-weighted decibels (dB (A), dB is used to measure noise) for sleeping at nightand not be more than 35 dB (A) in classrooms for studying. The night noise shouldnot be more than 40 dB (A) of annual average (light) of bedrooms to avoid adverseeffects on health from night noise.
The main objective of this paper is to study the several regions of Mumbai againstthe contributing causes and draw conclusion in order to control noise pollution inthe state. In this research work, we perform clustering techniques to group regionsand identify causes of health risks in regions.
2 Literature Survey
The regular exposure to increased sound levels that may have adverse effects on thelives of humans or other living beings is called noise pollution. According to WHOstudy [1], sound levels should not be more than 70 db. Then, it cannot harm the livingorganisms. Exposure for 8 h and more to constant noise higher than 85 dB may becalamitous.
Noise free is thought to be a fundamental, essential of human well-being andprosperity. However, noise pollution is becoming a calamity to prosperity aroundthe globe (WHO 2011). The study of noise pollution reveals that the effects ofnoise pollution are also hazardous as compare to other types of pollution, not onlyin Mumbai regions, but across the world. Many strategies have been introduced tomonitor noise pollution in smart cities for different noise quality levels. The analysisalso concluded that many measures have taken to reduce the effects and causes ofnoise pollution. There are many different techniques, along with data mining that canbe used to monitor and analyze the noise pollution data. Table 1 summarizes some ofthe research studies where various techniques are used to understand its implicationin noise pollution.
Clustering helps in the formation of data sets of similar type of group structures,thus dividing and arranging the data into subclasses. In this paper, the clusteringtechnique used is expectation-maximization (EM) clustering using Gaussian mix-ture models (GMM). The data points are assumed to be in multivariate Gaussiandistribution surface. Mean and standard deviation are the two important parametersdescribing the shape of the clusters. A single cluster is assigned an each Gaussian

Identification of Noise Pollution Prone Regions in Mumbai … 3
Table 1 Techniques used S. No. Author Research Technique
1. Panu Maijala(2018) [5]
Monitoringnoise sources
Acousticpatternclassificationalgorithm
2. Maisonneuve(2010) [6]
Noise pollution Mobile phones
distribution. Expectation-maximization (EM), an optimization algorithm, is used tofind the parameters. The further technique is preceded using GMMs.
3 Problem Conceptualizations
Mumbai region is one among the top five cities in India which have higher impacton lives due to the adverse effects created by the noise pollution. A certain highlevel of noise is also a deadly cause affecting the lives of people living in Mum-bai. Many noise-monitoring schemas and noise-controlling plans have been directedby the authorities, but the implementation of the tasks hadn’t created much differ-ence to resolve the issue of noise pollution. We hardly find any silent zones in theMumbai region which are safe away from the hands of noise pollution, as CentralPollution Control Board (CPCB) has also revealed that areas around hospitals, edu-cational intuitions, courts, etc. didn’t fall in the silence zones within the range of100 m. In this paper, we have proposed a process which can be adopted for theanalysis and identification of the highly prone noise pollution-affected regions inMumbai using data mining approach of clustering techniques called expectation-maximization (EM) clustering using Gaussian mixture models (GMM), and also adecision tree can be made which shows the classification of the major causes of thenoise pollution in the Mumbai region.
4 Proposed Methodology Model
The proposed methodology model is depicted in Fig. 1, and the flow of execution isfrom top to bottom. The steps involved are described in the following flowchart.

4 A. Agarwal et al.
Fig. 1 Flowchart of applied techniques
4.1 Gathering of the Data from CPCB Official Website
The sample of noise monitoring data set of Mumbai for the year 2014 is collectedfrom [3]. The data set consists of different regions of Mumbai affected by noisepollution in day time as well as night time. Figure 2 represents the chosen data set.
4.2 Treating and Cleaning of the Missing Values in Data Set
This is preprocessing step which involves the steps to remove the missing values(i.e., noisy values) from the data set, which in turn reduces the set of data (cleaningof data). Max–min normalization is also calculated, which converts the data in thenormalized form for each year and combines the data into the Excel sheet.
4.3 Using Clustering Technique (Expectation-MaximizationClustering Using Gaussian Mixture Models)
The clustering technique to group similar object used is expectation-maximizationclustering using Gaussian mixture models that is described in Fig. 3.
The data mining approach we proposed in this paper, used to form the clusters ofthe affected regions of Mumbai due to noise pollution, is expectation-maximization

Identification of Noise Pollution Prone Regions in Mumbai … 5
Fig. 2 The sample data set for several regions of Mumbai
Fig. 3 Steps of clustering technique

6 A. Agarwal et al.
(EM) clustering using Gaussian mixture models (GMM). The symbols used in theequations are described in the table. The steps involved are as follows:
1. Estimating Parameters (mean and covariance): Using the multivariate Gaussiandistribution, we estimate the parameters (mean and covariance) of a distribution.In this step, the clusters of data are predicted to have an independent Gaussiandistribution, each having their ownmean and covariance matrices. The estimatedparameters are as:
N (x |μ,Σ) = 1
(2π |Σ |)1/2 exp{−1
2(x − μ)TΣ−1(x − μ)
}(1)
Mean, μML = 1
N
N∑n=1
xn
Covariance, ΣML = 1
N
(N∑
n=1
(xn − μML)(xn − μML)T
)(2)
2. Expectation-Maximization: It is an iterative technique, which includes expec-tation and maximization step (explained in next steps). The expectation-maximization algorithm is used for the generation that maximizes the proba-bility of output data of means and variance, for the distributional parameters ofmulti-mode data. The techniques involve the probabilistic models.
3. Expectation Step: In this step, we assign each point to a cluster. Using the esti-mated mean and covariance, we can predict and calculate the probability of eachdata point belonging to each cluster.We can calculate the fixed, data-independentparameters. Thus, for already calculated parameters we can calculate the approx-imation values of latent variable. The formula for depicting the responsibility(calculating data point for each cluster) in expectation step is:
ric = πcN (xi |μc, σc)∑j∈[0,k} π j N
(xi |μ j , σ j
) (3)
Suppose, if we have 80 data points with a mixture of 4 Gaussians, we need tocalculate 320 numbers (matrix is of 80*4).
4. Maximization Step: Now in this step, we works on the improvement of guess ofeach curve mean, standard deviation, and weighting factor. The parameters thatare known in above expectation step are fully determined, and maximization ofparameters is done. This step updates the distributional class parameters basedon the new parameters.
NewMean, μnewc = 1
Nc
∑iricxi (4)
NewStandardDeviation, σ newc = 1
Nc
∑iric
(xi − μnew
c
)2(5)
Identification of Noise Pollution Prone Regions in Mumbai … 7
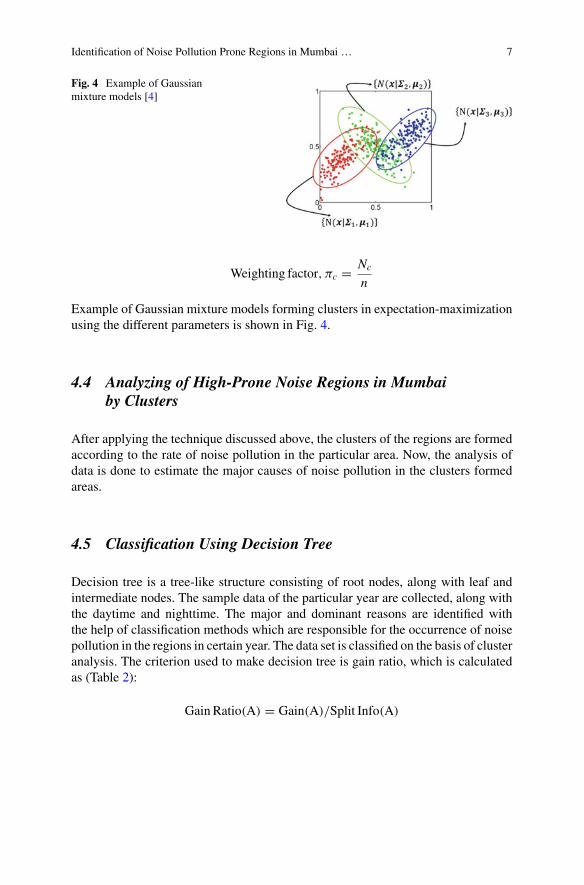
Fig. 4 Example of Gaussianmixture models [4]
Weighting factor, πc = Nc
n
Example of Gaussian mixture models forming clusters in expectation-maximizationusing the different parameters is shown in Fig. 4.
4.4 Analyzing of High-Prone Noise Regions in Mumbaiby Clusters
After applying the technique discussed above, the clusters of the regions are formedaccording to the rate of noise pollution in the particular area. Now, the analysis ofdata is done to estimate the major causes of noise pollution in the clusters formedareas.
4.5 Classification Using Decision Tree
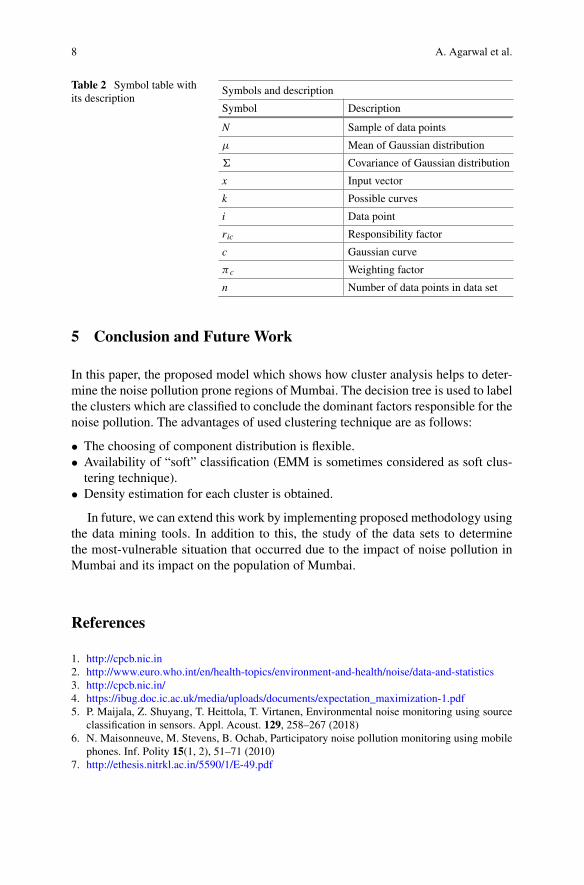
Decision tree is a tree-like structure consisting of root nodes, along with leaf andintermediate nodes. The sample data of the particular year are collected, along withthe daytime and nighttime. The major and dominant reasons are identified withthe help of classification methods which are responsible for the occurrence of noisepollution in the regions in certain year. The data set is classified on the basis of clusteranalysis. The criterion used to make decision tree is gain ratio, which is calculatedas (Table 2):
Gain Ratio(A) = Gain(A)/Split Info(A)
8 A. Agarwal et al.
Table 2 Symbol table withits description
Symbols and description
Symbol Description
N Sample of data points
μ Mean of Gaussian distribution
� Covariance of Gaussian distribution
x Input vector
k Possible curves
i Data point
ric Responsibility factor
c Gaussian curve
πc Weighting factor
n Number of data points in data set
5 Conclusion and Future Work
In this paper, the proposed model which shows how cluster analysis helps to deter-mine the noise pollution prone regions of Mumbai. The decision tree is used to labelthe clusters which are classified to conclude the dominant factors responsible for thenoise pollution. The advantages of used clustering technique are as follows:
• The choosing of component distribution is flexible.• Availability of “soft” classification (EMM is sometimes considered as soft clus-tering technique).
• Density estimation for each cluster is obtained.
In future, we can extend this work by implementing proposed methodology usingthe data mining tools. In addition to this, the study of the data sets to determinethe most-vulnerable situation that occurred due to the impact of noise pollution inMumbai and its impact on the population of Mumbai.
References
1. http://cpcb.nic.in2. http://www.euro.who.int/en/health-topics/environment-and-health/noise/data-and-statistics3. http://cpcb.nic.in/4. https://ibug.doc.ic.ac.uk/media/uploads/documents/expectation_maximization-1.pdf5. P. Maijala, Z. Shuyang, T. Heittola, T. Virtanen, Environmental noise monitoring using source
classification in sensors. Appl. Acoust. 129, 258–267 (2018)6. N. Maisonneuve, M. Stevens, B. Ochab, Participatory noise pollution monitoring using mobile
phones. Inf. Polity 15(1, 2), 51–71 (2010)7. http://ethesis.nitrkl.ac.in/5590/1/E-49.pdf

An Automated Segmentation Approachfrom Colored Retinal Images for FeatureExtraction
Suchismita Goswami, Sushmita Goswami, Shubhasri Roy, ShreejitaMukherjee and Nilanjana Dutta Roy
Abstract Segmentation fromcolored retina images plays a vital role in stable featureextraction for image registration and detection in many ocular diseases. In this study,the authors will look at the segmentation of the blood vessels from fundus imageswhich will further help in preparation of digital template. Here, images are passedthrough the preprocessing stages and then some of the morphological operators forthresholding are applied on the images for segmentation. Finally, noise removal andbinary conversion complete the segmentation method. Then, a number count onblood vessels around the optic disk is done as a feature for further processing. Theauthors will ensure whether the segmentation accuracy, based on comparison with aground truth, can serve as a reliable platform for image registration and ocular diseasedetection. Experiments are done on the images of DRIVE and VARIA databaseswith an average accuracy of 97.20 and 96.45%, respectively, for segmentation, anda comparative study has also been shown with the existing works.
Keywords Segmentation · Fundus images · Blood vessels · Morphologicaloperators
S. Goswami · S. Goswami · S. Roy · S. Mukherjee (B) · N. D. RoyDepartment of Computer Science and Engineering, Institute of Engineering and Management,Kolkata, Indiae-mail: [email protected]
S. Goswamie-mail: [email protected]
S. Goswamie-mail: [email protected]
S. Roye-mail: [email protected]
N. D. Roye-mail: [email protected]
© Springer Nature Singapore Pte Ltd. 2020J. K. Mandal and D. Bhattacharya (eds.), Emerging Technology in Modellingand Graphics, Advances in Intelligent Systems and Computing 937,https://doi.org/10.1007/978-981-13-7403-6_2
9

10 S. Goswami et al.
1 Introduction
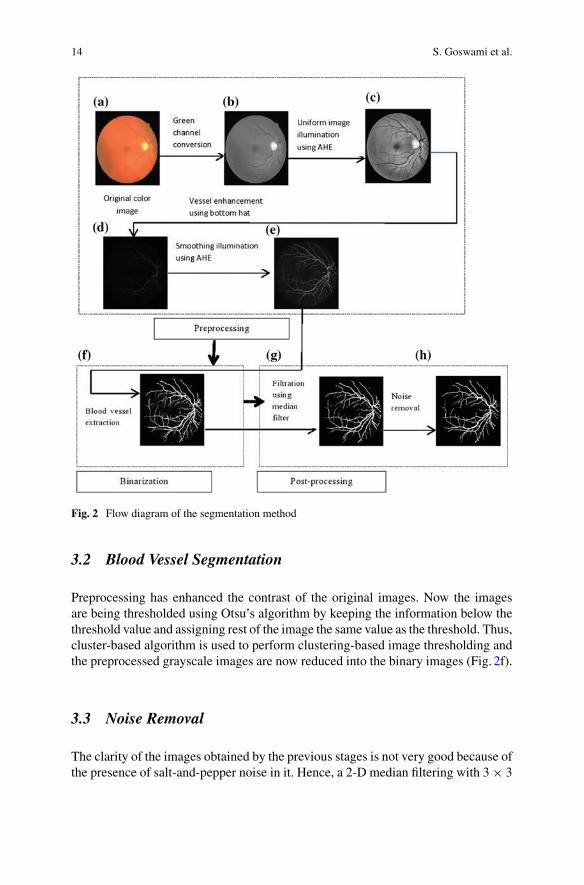
Automated analysis and segmentation from colored retinal images is a challengingtask. It has a potential research impact in various areas like diagnosing of many dis-eases, person identification and security purposes due to significant advances in thefield of digital image processing. Extraction of stable features from retina like bifur-cation points, bifurcation angle, location of optic disk, width of the blood vessels,etc., needs special care. Thus, proper segmentation from colored retinal images isan essential task to accomplish the same. Manual segmentation of blood vessels is acumbersome and time-consuming process. In a research setting, with proper techni-cal support, automatic segmentation from retinal images provides better and fastersolution. It also plays an important role in diagnosing many ocular diseases affect-ing retina [1, 2]. Blood vessels are indicative to many pathological changes causeddue to hypertension, diabetes, arteriosclerosis, cardiovascular diseases. So obser-vation on the vascular changes sometimes improves the disease diagnosis process.Apart from the medical diagnostics, the segmentation method has another potentialapplication in person identification. The microvascular structure of human retinais unique for each individual and usually remains same during any one’s lifetimeexcept surgical issues. With some existing distinct features on retinal vascular struc-ture, it could be used as a secure template for identification. Many algorithms arethere in literature to segment the blood vessel from colored retinal images. In thispaper, a best suited segmentation approach has been proposed using some of themor-phological operators which will further help in macula detection in the future. Theproposed segmentation algorithm is subdivided into three categories, preprocessing,thresholding and blood vessel segmentation and post-processing. Preprocessing, likechannel conversion, enhancement and noise removal techniques, helps in improvingthe quality of the image as most of them suffer from poor local contrast compared tobackground. Thresholding and binarization help in actual segmentation, and finally,noise present on the images is removed by applying 2-D median filtering in a 3 × 3scanning window. Later, a count on blood vessels around optic disk [3] is done fromthe segmented images by looking at the number of transitions on binary images. Theapproach proves sensitivity and specificity as 0.9632 and 0.9470, respectively, andaccuracy as 97%. Due to the inadequacy of available resources, the experiments aredone only on all the images of DRIVE [4] and VARIA [5] databases. A precise viewof the segmentation method is described in Fig. 1.
2 Background
Segmentation of a blood vessel from the retinal images using tracking-based ap-proach is proposed in [6]. In this approach, fuzzy model of a one-dimensional vesselprofile drives the segmentation process. One drawback of these approaches is thatthis method of segmentation depends upon the methods for identifying the seed pixel

An Automated Segmentation Approach from Colored … 11
Fig. 1 Flow diagram of the segmentation method

12 S. Goswami et al.
which is either the optic disk or the branch points which are detected subsequently.Gabor filter-based image processingmethodswere proposed for retinal vessel extrac-tion in [7–10]. For segmentation of the blood vessels in the retinal images, optimizedGabor filters with local entropy thresholding had been used in those approaches.The drawback of those segmentation methodologies is that optimized Gabor filtermethods fail to detect vessel of different widths and may sometimes detect bloodvessels falsely. Also, detection process fails in case of defected retinal image causedby various retinal diseases. An automated texture-based blood vessel segmentationhas been proposed in the paper [11]. In this paper, they have used Fuzzy c-Means(FCM) clustering algorithm for the classification between vessels and non-vesselsdepending on texture properties. This algorithm is having 84.37% sensitivity and99.19% specificity.
3 Proposed Method
The existing algorithms suffer from problem of non-uniform illumination of thebackground in the retinal fundus image. The proposed method shows a way to over-come the limitations and to improve the effectiveness, accuracy and computationaltime.
Broadly, there are three principal stages of the segmentation method, preprocess-ing, blood vessel extraction and post-processing. Preprocessing technique has beenapplied, to increase the accuracy in recognizing and extracting the blood vessels.Green channel conversion of RGB images initiates the process as the green channelprovides the highest vessel background contrast. Next, the boundary of the greenchanneled images is removed and contrast-limited adaptive histogram equalization(CLAHE) is applied over it to make a uniform illumination distribution. To this,morphological bottom hat operation with disk-shaped structuring element is appliedto enhance the retinal blood vessels. Finally, to correct the illumination variation inthe background of retinal image obtained from the previous stage, estimation of thebackground illumination and the contrast distribution is applied over it.
Image binarization and segmentation of the blood vessels are two essential tasksto be performed here with an empirically generated threshold value.
The primary task in post-processing stage is 2-D median filtering and morpho-logical noise removal operations. This would remove the disconnected blood vesseland noise from the binary image and assist to accomplish the desired goal.
3.1 Image Preprocessing and Segmentation
The retinal images show non-uniform illumination of the background due to thepresence of vitreous humor, which is a transparent gel that fills the interior of theeye. The blood vessels show variety in their thickness and contrast. So the darker

An Automated Segmentation Approach from Colored … 13
vessels are clearly seen and easily detected. But it is difficult to extract the thinvessels having low contrast. It is easy to segment if the blood vessels appear as darkstructure in the brighter background. So, difference in the contrast between the retinalblood vessels and the background is desirable. Hence, preprocessing is applied tothe original retinal image to eliminate these anomalies and to prepare the image forthe next steps of segmentation.Channel conversion It is necessary to convert color (RGB) images into green channelas the green channel provides the best contrast between blood vessels and backgroundof the RGB representation. As the red channel has low contrast and the blue channelhas poor dynamic range, we are focusing only on green channel, refer Fig. 2b.Boundary removal In this step, the outer border of the green component of theimage is removed by suppressing the structures that have lower contrast than thesurroundings and that are connected to the image border.Uniform image illumination using AHE Fundus images suffer from backgroundintensity variation due to non-uniform illumination which further deteriorate thesegmentation result. Due to this issue, background pixels sometimes have highergray-level values than the vessel pixels. Because of the difference in gray-level in-tensity and false vessel’s appearance, the global thresholding techniques cannot beapplied in this phase. Contrast-limited adaptive histogram equalization (CLAHE) isapplied here to enhance the contrast of the green channel retinal image, as shown inFig. 2c. It redistributes the light value of the image within small regions of the imageinstead of the entire one. The process thus enhances the contrast of every smallerregion of the image. This step also helps to reduce few false detection of blood ves-sels that would otherwise decrease the performance of blood vessel segmentationmethod.Morphological transformation Sometimes, retinal blood vessels falsely appear asbackground due to poor intensity variation between the blood vessels and the imagebackground. So to brighten the darker blood vessels in lighter background withan empirically tested disk-shaped structuring element of size 8 × 8, morphologicalbottom hat operation is applied here. Bottom hat filtering subtracts the input imagefrom the result to perform a morphological closing operation on the image whichis dilation followed by erosion. Dilation is an operation that grows or thickens theobject in binary image. Erosion operation shrinks the object by eroding away theboundaries of regions of foreground pixels. After applying bottom hat, the changesin the result are shown in Fig. 2d.Smoothing IlluminationThe imageproduced after the bottomhat operationhas poordistribution of lightness value. To improve the distribution of intensity, againCLAHEis applied, so that the image iswell prepared for thresholding and segmentation stages;see Fig. 2e.
14 S. Goswami et al.
Fig. 2 Flow diagram of the segmentation method
3.2 Blood Vessel Segmentation
Preprocessing has enhanced the contrast of the original images. Now the imagesare being thresholded using Otsu’s algorithm by keeping the information below thethreshold value and assigning rest of the image the same value as the threshold. Thus,cluster-based algorithm is used to perform clustering-based image thresholding andthe preprocessed grayscale images are now reduced into the binary images (Fig. 2f).
3.3 Noise Removal
The clarity of the images obtained by the previous stages is not very good because ofthe presence of salt-and-pepper noise in it. Hence, a 2-D median filtering with 3 × 3

An Automated Segmentation Approach from Colored … 15
neighborhood size is applied to reduce the noise from the segmented image. Next, thesmall connected components, having lesser than 35 white pixels around it within the8-connectivity window, are removed from the previously processed image. Desiredimage is shown in Fig. 2h.
3.4 Counting Vessels Around Optic Disk
Common parameters, like accuracy, specificity and sensitivity, are used to measurethe strength of an algorithm and to compare the results with other segmentationalgorithms. To compare the result of the proposed approach with gold standardimages, count on the number of vessels is essential. Also, counting the numberof blood vessels around optic disk helps in diagnosis of severe ocular disease calledproliferative diabetic retinopathy (PDR). Abrupt changes in count on vessels arealarming for some unusual scenario on regular monitoring. Algorithm 1 explains themethod of counting blood vessels in segmented images. Table1 shows the number ofblood vessels detected by the proposed algorithm on the images of DRIVE database.
Algorithm 1 Count on blood vessels around OD1: count ← number of blood vessels around OD2: for within a 50 × 50 window around the optic disk do3: repeat4: for for each pixel along the window border do5: if a white pixel is found then6: repeat7: move along the border of the window by one pixel8: until white to black transitions occur9: count ← count + 110: else11: move along the border of the window by one pixel12: end if13: end for14: until all the pixels along the four border of the specified window is traversed15: end for
Table 1 Count on number of blood vessels around OD
Image Count Image Count Image Count
Image 1 14 Image 6 12 Image 11 10
Image 2 12 Image 7 16 Image 12 12
Image 3 16 Image 8 16 Image 13 14
Image 4 13 Image 9 14 Image 14 13
Image 5 10 Image 10 13 Image 15 12
16 S. Goswami et al.
4 Results and Performance Evaluation
A complete segmentation method, along with the intermediate steps, is shown inFig. 2. To show the proficiency of the proposed algorithm, gold standard imageswhich are manual segmented images from DRIVE [4] database have been used.Specificity, sensitivity and accuracy are calculated as measuring parameters to com-pare the results of the proposed algorithm with the other existing algorithms.
Sensitivity = TP
(TP + FN)(1)
Specificity = TN
(TN + FP)(2)
Accuracy = (TP + TN)
(TP + TN + FP + FN)(3)
where TP is correctly detected positive values; TN is correctly detected negativevalues; FP is feature is negative, but detected as positive; and FN is feature is positive,but cannot detect (Figs. 3 and 4).
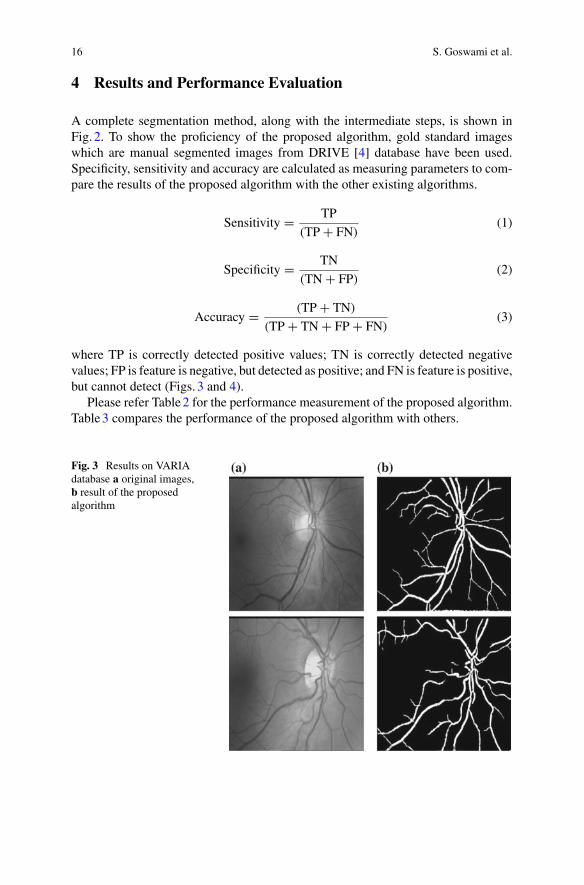
Please refer Table2 for the performance measurement of the proposed algorithm.Table3 compares the performance of the proposed algorithm with others.
Fig. 3 Results on VARIAdatabase a original images,b result of the proposedalgorithm