
Geneexpressionprofilesofpoor-prognosisprimary ...diagnosis, have substantially improved the...
10
Gene expression profiles of poor-prognosis primary breast cancer correlate with survival Franc ¸ ois Bertucci 1,2,7 , Vale ´ry Nasser 1 , Samuel Granjeaud 6 , Franc ¸ ois Eisinger 3 , Jose ´ Adelaı ¨de 1 , Rebecca Tagett 4 , Be ´ atrice Loriod 6 , Aure ´ lia Giaconia 1 , Athmane Benziane 4 , Elisabeth Devilard 5 , Jocelyne Jacquemier 5 , Patrice Viens 2,7 , Catherine Nguyen 6 , Daniel Birnbaum 1,7,8,* and Re ´ mi Houlgatte 6 1 De ´ partement d’Oncologie Mole ´culaire TAGC, 2 De ´ partement d’Oncologie Me ´ dicale, 3 De ´partement de Pre ´vention et De ´ pistage, 4 Ipsogen SA and 5 De ´ partement d’Anatomie Pathologique, Institut Paoli-Calmettes, 6 TAGC, CIML Luminy, 7 Universite ´ de la Me ´ diterrane ´e and 8 Laboratoire d’Oncologie Mole ´ culaire, U.119 Inserm, Marseille, France Received December 19, 2001; Revised and Accepted February 20, 2002 The extensive heterogeneity of breast cancer complicates the precise assessment of tumour aggressiveness, making therapeutic decisions difficult and treatments inappropriate in some cases. Consequently, the long- term metastasis-free survival rate of patients receiving adjuvant chemotherapy is only 60%. There is a genuine need to identify parameters that might accurately predict the effectiveness of this treatment for each patient. Using cDNA arrays, we profiled tumour samples from 55 women with poor-prognosis breast cancer treated with adjuvant anthracycline-based chemotherapy. Gene expression monitoring was applied to a set of about 1000 candidate cancer genes. Differences in expression profiles provided molecular evidence of the clinical heterogeneity of disease. First, we confirmed the capacity of a 23-gene predictor set, identified in a previous study, to distinguish between tumours associated with different survival. Second, using a refined gene set derived from the previous one, we distinguished, among the 55 clinically homogeneous tumours, three classes with significantly different clinical outcome: 5-year overall survival and metastasis-free survival rates were respectively 100% and 75% in the first class, 65% and 56% in the second and 40% and 20% in the third. This discrimination resulted from the differential expression of two clusters of genes encoding proteins with diverse functions, including the estrogen receptor (ER). Another finding was the identification of two ER-positive tumour subgroups with different survival. These results indicate that gene expression profiling can predict clinical outcome and lead to a more precise classification of breast tumours. Furthermore, the characterization of discriminator genes might accelerate the development of new specific and alternative therapies, allowing more rationally tailored treatments that are potentially more efficient and less toxic. INTRODUCTION Over the last decades, advances in systemic adjuvant therapy, designed to eradicate the micrometastases observed at diagnosis, have substantially improved the treatment of poor- prognosis primary breast cancer (1,2). But conventional clinicopathological factors remain insufficient to evaluate the substantial prognostic heterogeneity of this disease. Therefore, a recent consensus conference led by the US National Cancer Institute (NCI) has recommended the enlargement of the criteria leading to the use of adjuvant chemotherapy, which still relies on clinical and morphological parameters and the use of anthracycline-based regimens as standard treatment (http:// odp.od.nih.gov/consensus/). Consequently, more and more patients are offered this therapy [with a 60% long-term metastasis-free survival rate (1)] whose success or failure in an individual patient cannot currently be predicted by any clinical or morphological factor. Alternative therapeutic strategies have been developed, and have already had promising results in advanced disease. Among those being tested as adjuvant treatments are new cytotoxic agents (e.g. taxanes), new hormonal therapies and new biological agents (e.g. trastuzumab) (3). There is clearly a crucial need to identify parameters that might accurately predict the clinical outcome after specific adjuvant treatment in individual patients, allowing a rational choice between the different therapies available, improving efficiency and reducing morbidity and cost of treatment. *To whom correspondence should be addressed at: Laboratoire d’Oncologie Mole ´culaire, U.119 Inserm, IFR57, 27 Boulevard Leı ¨ Roure, 13009 Marseille, France. Tel: þ 33 4 91 75 84 07; Fax: þ 33 4 91 26 03 64; Email: [email protected] # 2002 Oxford University Press Human Molecular Genetics, 2002, Vol. 11. No. 8 863–872
Transcript of Geneexpressionprofilesofpoor-prognosisprimary ...diagnosis, have substantially improved the...

Gene expression profiles of poor-prognosis primarybreast cancer correlate with survival
Francois Bertucci1,2,7, Valery Nasser1, Samuel Granjeaud6, Francois Eisinger3,
Jose Adelaıde1, Rebecca Tagett4, Beatrice Loriod6, Aurelia Giaconia1, Athmane Benziane4,
Elisabeth Devilard5, Jocelyne Jacquemier5, Patrice Viens2,7, Catherine Nguyen6,
Daniel Birnbaum1,7,8,* and Remi Houlgatte6
1Departement d’Oncologie Moleculaire TAGC, 2Departement d’Oncologie Medicale, 3Departement de Prevention et
Depistage, 4Ipsogen SA and 5Departement d’Anatomie Pathologique, Institut Paoli-Calmettes, 6TAGC, CIML
Luminy, 7Universite de la Mediterranee and 8Laboratoire d’Oncologie Moleculaire, U.119 Inserm, Marseille, France
Received December 19, 2001; Revised and Accepted February 20, 2002
The extensive heterogeneity of breast cancer complicates the precise assessment of tumour aggressiveness,making therapeutic decisions difficult and treatments inappropriate in some cases. Consequently, the long-term metastasis-free survival rate of patients receiving adjuvant chemotherapy is only 60%. There is agenuine need to identify parameters that might accurately predict the effectiveness of this treatment for eachpatient. Using cDNA arrays, we profiled tumour samples from 55 women with poor-prognosis breast cancertreated with adjuvant anthracycline-based chemotherapy. Gene expression monitoring was applied to a setof about 1000 candidate cancer genes. Differences in expression profiles provided molecular evidence of theclinical heterogeneity of disease. First, we confirmed the capacity of a 23-gene predictor set, identified in aprevious study, to distinguish between tumours associated with different survival. Second, using a refinedgene set derived from the previous one, we distinguished, among the 55 clinically homogeneous tumours,three classes with significantly different clinical outcome: 5-year overall survival and metastasis-free survivalrates were respectively 100% and 75% in the first class, 65% and 56% in the second and 40% and 20% in thethird. This discrimination resulted from the differential expression of two clusters of genes encoding proteinswith diverse functions, including the estrogen receptor (ER). Another finding was the identification of twoER-positive tumour subgroups with different survival. These results indicate that gene expression profilingcan predict clinical outcome and lead to a more precise classification of breast tumours. Furthermore, thecharacterization of discriminator genes might accelerate the development of new specific and alternativetherapies, allowing more rationally tailored treatments that are potentially more efficient and less toxic.
INTRODUCTION
Over the last decades, advances in systemic adjuvant therapy,designed to eradicate the micrometastases observed atdiagnosis, have substantially improved the treatment of poor-prognosis primary breast cancer (1,2). But conventionalclinicopathological factors remain insufficient to evaluate thesubstantial prognostic heterogeneity of this disease. Therefore,a recent consensus conference led by the US National CancerInstitute (NCI) has recommended the enlargement of thecriteria leading to the use of adjuvant chemotherapy, which stillrelies on clinical and morphological parameters and the useof anthracycline-based regimens as standard treatment (http://odp.od.nih.gov/consensus/). Consequently, more and more
patients are offered this therapy [with a 60% long-termmetastasis-free survival rate (1)] whose success or failure inan individual patient cannot currently be predicted by anyclinical or morphological factor. Alternative therapeuticstrategies have been developed, and have already hadpromising results in advanced disease. Among those beingtested as adjuvant treatments are new cytotoxic agents (e.g.taxanes), new hormonal therapies and new biological agents(e.g. trastuzumab) (3). There is clearly a crucial need to identifyparameters that might accurately predict the clinical outcomeafter specific adjuvant treatment in individual patients, allowinga rational choice between the different therapies available,improving efficiency and reducing morbidity and cost oftreatment.
*To whom correspondence should be addressed at: Laboratoire d’Oncologie Moleculaire, U.119 Inserm, IFR57, 27 Boulevard Leı Roure, 13009Marseille, France. Tel: þ33 4 91 75 84 07; Fax: þ33 4 91 26 03 64; Email: [email protected]
# 2002 Oxford University Press Human Molecular Genetics, 2002, Vol. 11. No. 8 863–872
Breast cancer is a multifactorial disease characterized by theaccumulation of numerous molecular alterations in the cells.This complexity makes each tumour potentially distinct fromall others at the molecular and clinical levels. Prognosis andresistance to treatment are not likely to be associated with thedisturbance of a single gene, but rather with the combinedinfluence of many genes. Comprehensive molecular analysesshould help identify such genes, and cDNA array technology(4,5), which allows the analysis of the mRNA expression levelsof thousands of genes simultaneously in a sample, could be themethod of choice. Tumour cell models have suggested theutility of this approach for investigating major issues inmetastasis (6,7) and chemoresistance (8–10). Notably, theresponse of cancer cell lines to certain drugs has been shown tobe predictable by gene expression signatures (9). Several recentstudies have demonstrated the usefulness of expression profilesfor improving the classification of cancers by identifying newsubgroups of tumours within clinically and morphologicallysimilar groups (11–19). Such a molecular taxonomy hassuggested prognostic information for lymphomas (12), renalcell carcinomas (20), and oesophageal (21), lung (22,23) andbreast cancers (14,24).
Our aim is to identify, within apparently homogeneouspopulations of samples, new previously unrecognized tumourclasses displaying distinct clinical courses after therapy. Byanalysing a limited series of primary breast carcinomas withcDNA arrays, we previously identified, using a supervisedanalysis, a predictor set of 23 genes whose expression patternsdifferentiated two groups of patients with different survivalafter adjuvant chemotherapy (14). To validate and furtherextend these results, we present here the expression analysis ofsome 1000 candidate genes from a larger, independent andhomogeneous series of poor-prognosis primary breast cancerstreated with adjuvant chemotherapy. We confirm the prognosticclassification provided by the previously identified predictor setof 23 genes. Then we improve this predictor set and refine thetumour classification by sorting the samples into three classeswith significantly different long-term survival.
RESULTS
Gene expression profiling of breast cancer
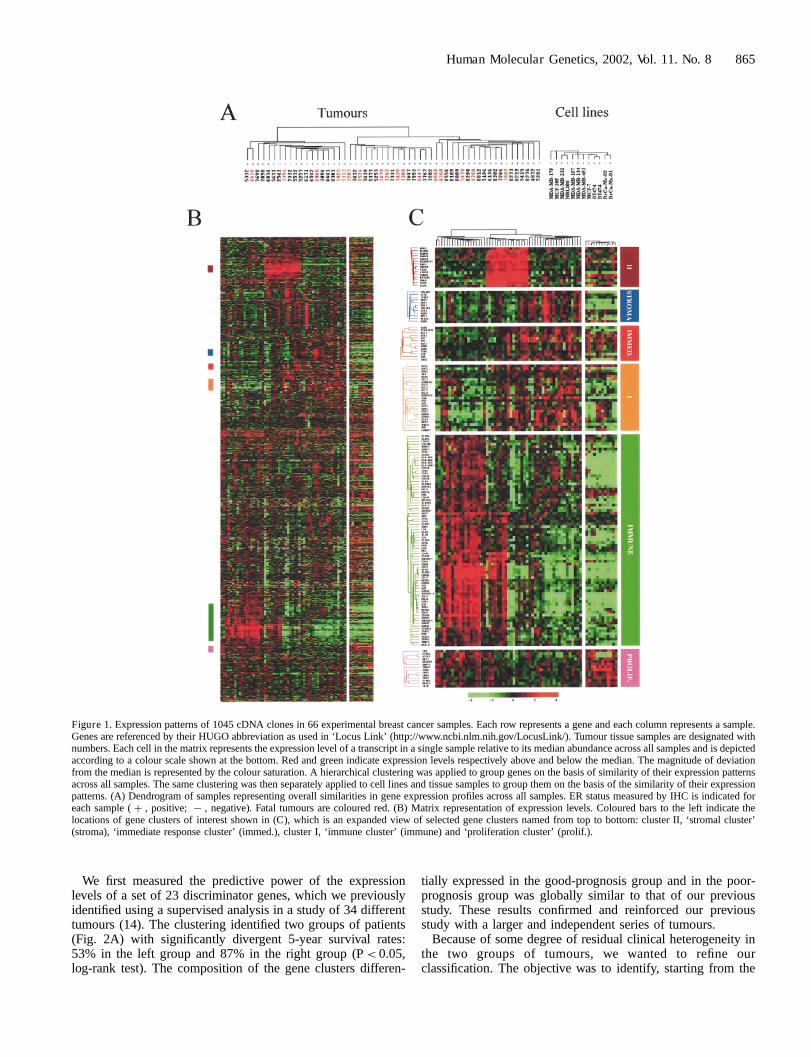
The mRNA from 66 different human breast cancer samples,including 55 clinical tissue samples and 11 cell lines, werehybridized with cDNA arrays containing about 1000 selectedgenes. The overall expression patterns for these 66 sampleswere analysed with hierarchical clustering and displayed in acolour-coded matrix (Fig. 1). The clustering algorithmclassifies samples on the horizontal axis and genes on thevertical axis, ordered on the basis of similarity of theirexpression profiles. Overall similarity of breast tumours andcell lines is shown as a dendrogram where branch lengthreflects relatedness of the samples (Fig. 1A). This analysishighlighted groups of correlated genes across correlatedsamples (Fig. 1B). Some interesting gene clusters are indicatedby coloured bars on the left of Fig. 1B and are shown enlargedin Fig. 1C. Three of these were differentially expressed betweentissue samples and epithelial cell lines. A ‘stromal cluster’ (blue
bar) and an ‘immune cluster’ (green bar) were overexpressed intissues overall as compared with cell lines, probably reflectingthe inflammatory component of the tumours. These clusterswere rich in genes whose expression is respectively found instromal cells (collagen genes COL1A1, COL6A1, proteasesMMP2, MMP3, microfibrillar-associated protein 2 MFAP2) andin B cells (immunoglobulin genes, CD79, HLA class II, . . .),T-cells (CD2, CD3, TRB, TRD, . . .), monocytes or macrophages(CD14, CSF1R). The third cluster (‘proliferation cluster’, pinkbar) included several genes involved in cell proliferation suchas CDK4, ODC1, GSTP1, UBCH10, DNMT1, TUBA1, HDAC2and PCNA (which codes for a proliferation marker used inclinical practice). This cluster was overexpressed in cell linesoverall as compared with tissues, probably reflecting thedifference in proliferation rate between rapidly dividing cells inculture and asynchronously proliferating cells in tumourtissues.
Comparison between tumour tissue RNA indicated a greatheterogeneity of expression profiles, which were distinct foreach tumour. The samples were classified in three largebranches by the clustering algorithm (Fig. 1A, C). The‘stromal’, ‘immune’ and ‘proliferation’ clusters were differen-tially expressed in these three categories. Similar grouping wasobserved using other classification algorithms such as k-means.As expected, the ‘immune cluster’ and the ‘proliferationcluster’ were overexpressed in estrogen receptor (ER)-negativetumours overall as compared with ER-positive tumours, inagreement with respectively a more abundant inflammatorystroma and a higher proliferation index (25). Anotherdifferentially expressed gene cluster contained the immediate-early genes FOS, JUNB and EGR1, which code for transcrip-tion factors involved in signalling pathways triggered byproliferation stimuli (‘immediate response cluster’, red bar inFig. 1B, C). Interestingly, this cluster has previously beenobserved in breast (13) and ovarian (18) cancers. Anothercluster (designated cluster I, orange bar in Fig. 1B, C) includedESR1, which codes for the estrogen receptor (ER) severaltranscription factor genes (GATA3, ILF1, XBP1, CRABP2,SMARCA2, ELF1, BS69 and GLI3) and the anti-apoptotic geneBCL2. Variation in expression of ESR1 mRNA correlated wellwith that of the protein measured by immunohistochemistry(IHC; concordance in 50 out of 55 samples). Finally, a cluster(designated cluster II, brown bar in Fig. 1B, C) was highlyoverexpressed in the middle group of tumours. It containedgenes coding for membrane proteins (connexin 43/GJA1,cadherin 15, prolactin receptor PRLR, endothelin receptorEDNRA, mucin-like hormone receptor EMR1, P-glycoprotein1/ABCB1/MDR1, MLANA/MART1) and genes involved in thecell cycle or apoptosis (CDKN3, DAP3, CIDEA).
Classification of breast cancer and selection of gene clusterswith potential prognostic role
As shown in Fig. 1A, classification with the whole set of genesidentified three large groups of tumours differing with respectto their IHC ER status, but similar with respect to histologicaltype or clinical outcome. The absence of prognostic classifica-tion could be due to the presence of irrelevant clusters of co-expressed genes that exert a dominant influence upon theclustering.
864 Human Molecular Genetics, 2002, Vol. 11. No. 8
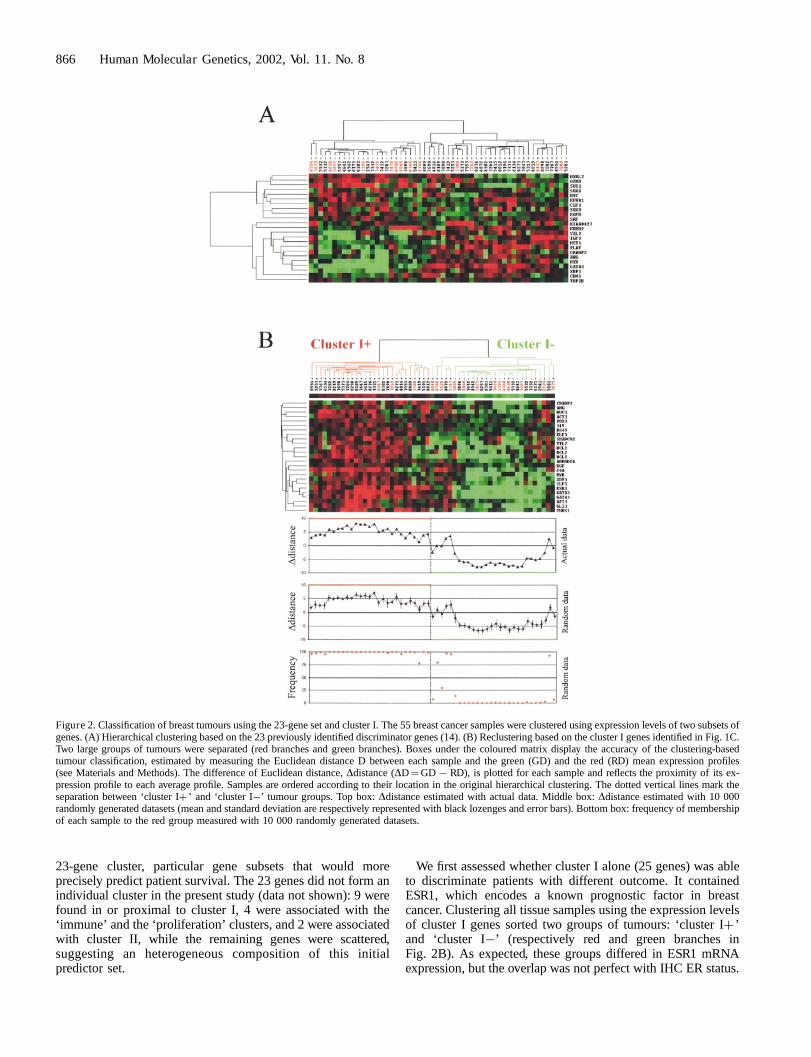
We first measured the predictive power of the expressionlevels of a set of 23 discriminator genes, which we previouslyidentified using a supervised analysis in a study of 34 differenttumours (14). The clustering identified two groups of patients(Fig. 2A) with significantly divergent 5-year survival rates:53% in the left group and 87% in the right group (P< 0.05,log-rank test). The composition of the gene clusters differen-
tially expressed in the good-prognosis group and in the poor-prognosis group was globally similar to that of our previousstudy. These results confirmed and reinforced our previousstudy with a larger and independent series of tumours.
Because of some degree of residual clinical heterogeneity inthe two groups of tumours, we wanted to refine ourclassification. The objective was to identify, starting from the
Figure 1. Expression patterns of 1045 cDNA clones in 66 experimental breast cancer samples. Each row represents a gene and each column represents a sample.Genes are referenced by their HUGO abbreviation as used in ‘Locus Link’ (http://www.ncbi.nlm.nih.gov/LocusLink/). Tumour tissue samples are designated withnumbers. Each cell in the matrix represents the expression level of a transcript in a single sample relative to its median abundance across all samples and is depictedaccording to a colour scale shown at the bottom. Red and green indicate expression levels respectively above and below the median. The magnitude of deviationfrom the median is represented by the colour saturation. A hierarchical clustering was applied to group genes on the basis of similarity of their expression patternsacross all samples. The same clustering was then separately applied to cell lines and tissue samples to group them on the basis of the similarity of their expressionpatterns. (A) Dendrogram of samples representing overall similarities in gene expression profiles across all samples. ER status measured by IHC is indicated foreach sample ( þ , positive; 7 , negative). Fatal tumours are coloured red. (B) Matrix representation of expression levels. Coloured bars to the left indicate thelocations of gene clusters of interest shown in (C), which is an expanded view of selected gene clusters named from top to bottom: cluster II, ‘stromal cluster’(stroma), ‘immediate response cluster’ (immed.), cluster I, ‘immune cluster’ (immune) and ‘proliferation cluster’ (prolif.).
Human Molecular Genetics, 2002, Vol. 11. No. 8 865
23-gene cluster, particular gene subsets that would moreprecisely predict patient survival. The 23 genes did not form anindividual cluster in the present study (data not shown): 9 werefound in or proximal to cluster I, 4 were associated with the‘immune’ and the ‘proliferation’ clusters, and 2 were associatedwith cluster II, while the remaining genes were scattered,suggesting an heterogeneous composition of this initialpredictor set.
We first assessed whether cluster I alone (25 genes) was ableto discriminate patients with different outcome. It containedESR1, which encodes a known prognostic factor in breastcancer. Clustering all tissue samples using the expression levelsof cluster I genes sorted two groups of tumours: ‘cluster Iþ ’and ‘cluster I�’ (respectively red and green branches inFig. 2B). As expected, these groups differed in ESR1 mRNAexpression, but the overlap was not perfect with IHC ER status.
Figure 2. Classification of breast tumours using the 23-gene set and cluster I. The 55 breast cancer samples were clustered using expression levels of two subsets ofgenes. (A) Hierarchical clustering based on the 23 previously identified discriminator genes (14). (B) Reclustering based on the cluster I genes identified in Fig. 1C.Two large groups of tumours were separated (red branches and green branches). Boxes under the coloured matrix display the accuracy of the clustering-basedtumour classification, estimated by measuring the Euclidean distance D between each sample and the green (GD) and the red (RD) mean expression profiles(see Materials and Methods). The difference of Euclidean distance, Ddistance (DD¼GD7RD), is plotted for each sample and reflects the proximity of its ex-pression profile to each average profile. Samples are ordered according to their location in the original hierarchical clustering. The dotted vertical lines mark theseparation between ‘cluster Iþ ’ and ‘cluster I�’ tumour groups. Top box: Ddistance estimated with actual data. Middle box: Ddistance estimated with 10 000randomly generated datasets (mean and standard deviation are respectively represented with black lozenges and error bars). Bottom box: frequency of membershipof each sample to the red group measured with 10 000 randomly generated datasets.
866 Human Molecular Genetics, 2002, Vol. 11. No. 8
While the ‘cluster Iþ ’ group included only IHC-positivetumours, the ‘cluster I�’ group included both IHC-negativeand IHC-positive tumours. The overall survival was signifi-cantly different between the two groups, with 3 deaths out of 27patients in the ‘cluster Iþ ’ group and 14 deaths out of 28 in the‘cluster I�’ group (P< 0.05, log-rank test). Interestingly,patients with ER-positive ‘cluster I�’ tumours had a sig-nificantly shorter survival than patients with ER-positive‘cluster Iþ ’ tumours (P< 0.005, log-rank test). These resultssuggest that expression profiles of ESR1-associated genesprovide different and more accurate clinical information thanthe IHC status alone, possibly reflecting functional differencesin the ESR1 pathway.
Confidence for the two tumour groups revealed by clusteringwas assessed by measuring the distance between each sampleand the mean profile of each group. As shown in Fig. 2B (topbox), 50 samples were closer to their original group, while 3were closer to the opposite group and 2 exhibited the samedistance relative to the red or green groups. These 5 tumoursdisplayed an ‘intermediate cluster I profile’. Confidence wasfurther checked by using randomly generated subsets of 25genes from a larger set of genes correlated with ESR1 (using acorrelation cut-off of 0.5 in the gene dendrogram). Thisresampling allowed the estimation of the mean and standarddeviation of the differences of distances for each sample to thered and the green mean profiles (Fig. 2B, middle box) and thefrequency of membership of each sample to the red group(Fig. 2B, bottom box). Results showed that 51 samples wereinitially well classified, while 4 ‘cluster I�’ tumours werecloser to the ‘cluster Iþ ’ group. This classification discrepancybetween clustering and distance to mean profile methodsconfirmed the ‘intermediate cluster I profile’ for these 4tumours, perhaps due to a partially functional ESR1 pathway.
While these results confirmed the utility of our initialpredictor gene set, as well as cluster I, to separate clinicallyidentical tumours, the two groups of tumours still displayedsome residual clinical heterogeneity (three deaths in the better-prognosis ‘cluster Iþ ’ group).
Gene-expression-based classification of breast cancer andsurvival
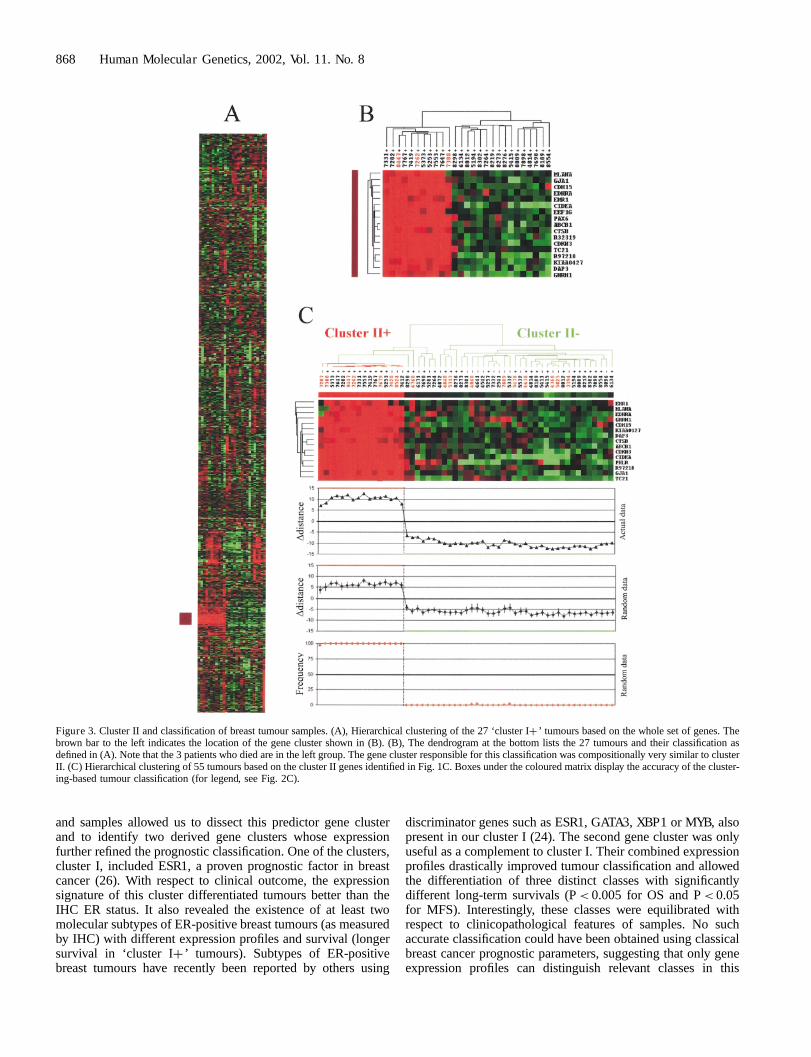
Focusing only on the ‘cluster Iþ ’ tumours, we identified a genecluster whose expression profile could separate two subgroupsof samples, one of which included the three patients who died(Fig. 3A, B). Since this gene cluster was similar to cluster II,cluster II genes were used to recluster the 55 tumours. The twogroups of tumours (Fig. 3C) that emerged had very distinctexpression profiles (Fig. 3C, boxes) and different clinicaloutcomes (although not statistically significant: P¼ 0.11, log-rank test). Further clustering of all 55 samples with all genesfrom clusters I and II failed to identify groups with significantlydifferent survival (data not shown).
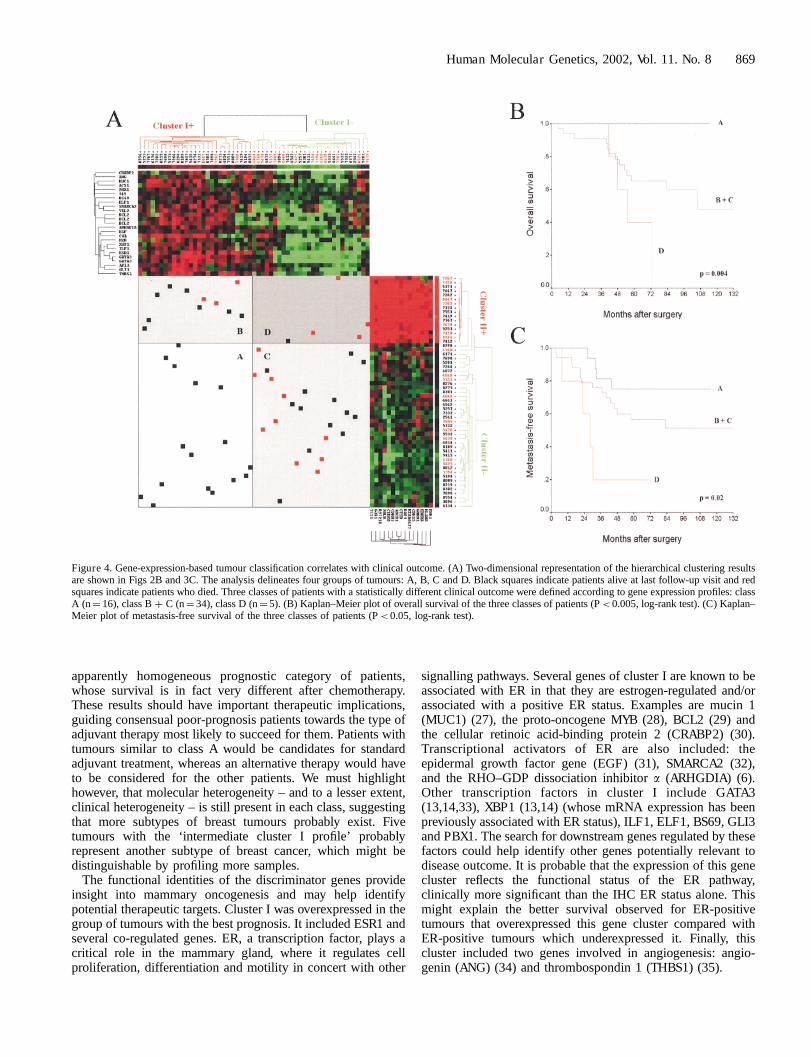
A complementarity between clusters I and II was found,however, when the corresponding classifications were analysedin a ‘2D representation’ (Fig. 4A). This representationdelineated four groups of tumours, A, B, C and D, which werein close agreement with the clinical outcome of patients.Overexpression of cluster I together with underexpression ofcluster II defined a group (A) with ‘good prognosis’ and no
mortality in 16 patients. Underexpression of cluster I togetherwith overexpression of cluster II defined a group (D) with ‘poorprognosis’: 4 deaths out of 5 patients. The two other groups (Band C) defined ‘intermediate prognosis’, with respectively 3deaths out of 11 women in B and 10 out of 23 in C. Groups Band C were merged (class B þ C), thus defining three classes.With a median follow-up of 60 months, the difference foroverall survival (OS) was statistically significant between thethree classes (P< 0.005, log-rank test). Concerning metastases,the difference was also statistically significant (P< 0.05, log-rank test), with 4 relapses out of 16 in A, 15 out of 34 in B þ Cand 4 out of 5 in D. Figures 4B and C respectively show theKaplan Meier plots of overall survival and metastasis-freesurvival (MFS) from these three classes of tumours. Althoughthe 5-year OS and MFS rates were 72% and 58% respectivelyfor the whole population, they were 100% and 75% in the firstclass (A), 65% and 56% in the second (B þ C), and 40% and20% in the last (D).
Interestingly, these three classes did not show any significantdifference with respect to follow-up or to classical breast cancerprognostic factors such as axillary lymph node status, patientage and menopausal status, histological type, and grade andsize of tumours. Furthermore, no such prognostic survivalclassification was possible by axillary lymph node (negativeversus positive; P¼ 0.89 for OS and P¼ 0.49 for MFS, log-rank test) or IHC ER status (negative versus positive; P¼ 0.45for OS and P¼ 0.88 for MFS, log-rank test), both of which areclassical and strong prognostic factors of breast cancer. Thesame analysis restricted to the 42 ductal tumours (11 samples inA, 27 in B þ C and 4 in D) gave similar results, withsignificantly different survivals between the three classes (datanot shown). Finally, survival differences between the threeclasses remained significant (P< 0.05, log-rank test), evenwhen all 5 of the ‘intermediate cluster I profile’ tumours wereartificially relocated to another class (from C to A) or excludedfrom analysis, further indicating the robustness of our results.
DISCUSSION
Several recent studies have suggested the usefulness ofcomprehensive cDNA array-based gene expression profilesfor cancer classification (13,15–19), and some have directlyaddressed the issue of prognosis (12,14,20–24). Using thistechnology, we profiled a series of 55 primary breast cancersusing a set of candidate genes, the large majority of which aredirectly or indirectly implicated in oncogenesis. All patientshad a poor-prognosis tumour according to the criteria in use atour institute, and had received adjuvant anthracycline-basedchemotherapy after surgery. Today, all would receive the sametreatment according to the recent NCI consensus recommenda-tions. Follow-up of patients was sufficiently long to considersurvival (median, 5 years), which conformed to data in theliterature for similar population and treatment (1).
The expression patterns generated delineated clinicallyrelevant classes of tumours. We first confirmed our initialresults with a 23-gene predictor set defined in a previouslystudied cohort of patients (14). This set identified, within thepresent larger and independent series of tumours, two groupswith different survival rates. Then, the analysis of more genes
Human Molecular Genetics, 2002, Vol. 11. No. 8 867
and samples allowed us to dissect this predictor gene clusterand to identify two derived gene clusters whose expressionfurther refined the prognostic classification. One of the clusters,cluster I, included ESR1, a proven prognostic factor in breastcancer (26). With respect to clinical outcome, the expressionsignature of this cluster differentiated tumours better than theIHC ER status. It also revealed the existence of at least twomolecular subtypes of ER-positive breast tumours (as measuredby IHC) with different expression profiles and survival (longersurvival in ‘cluster Iþ ’ tumours). Subtypes of ER-positivebreast tumours have recently been reported by others using
discriminator genes such as ESR1, GATA3, XBP1 or MYB, alsopresent in our cluster I (24). The second gene cluster was onlyuseful as a complement to cluster I. Their combined expressionprofiles drastically improved tumour classification and allowedthe differentiation of three distinct classes with significantlydifferent long-term survivals (P< 0.005 for OS and P< 0.05for MFS). Interestingly, these classes were equilibrated withrespect to clinicopathological features of samples. No suchaccurate classification could have been obtained using classicalbreast cancer prognostic parameters, suggesting that only geneexpression profiles can distinguish relevant classes in this
Figure 3. Cluster II and classification of breast tumour samples. (A), Hierarchical clustering of the 27 ‘cluster Iþ ’ tumours based on the whole set of genes. Thebrown bar to the left indicates the location of the gene cluster shown in (B). (B), The dendrogram at the bottom lists the 27 tumours and their classification asdefined in (A). Note that the 3 patients who died are in the left group. The gene cluster responsible for this classification was compositionally very similar to clusterII. (C) Hierarchical clustering of 55 tumours based on the cluster II genes identified in Fig. 1C. Boxes under the coloured matrix display the accuracy of the cluster-ing-based tumour classification (for legend, see Fig. 2C).
868 Human Molecular Genetics, 2002, Vol. 11. No. 8
apparently homogeneous prognostic category of patients,whose survival is in fact very different after chemotherapy.These results should have important therapeutic implications,guiding consensual poor-prognosis patients towards the type ofadjuvant therapy most likely to succeed for them. Patients withtumours similar to class A would be candidates for standardadjuvant treatment, whereas an alternative therapy would haveto be considered for the other patients. We must highlighthowever, that molecular heterogeneity – and to a lesser extent,clinical heterogeneity – is still present in each class, suggestingthat more subtypes of breast tumours probably exist. Fivetumours with the ‘intermediate cluster I profile’ probablyrepresent another subtype of breast cancer, which might bedistinguishable by profiling more samples.
The functional identities of the discriminator genes provideinsight into mammary oncogenesis and may help identifypotential therapeutic targets. Cluster I was overexpressed in thegroup of tumours with the best prognosis. It included ESR1 andseveral co-regulated genes. ER, a transcription factor, plays acritical role in the mammary gland, where it regulates cellproliferation, differentiation and motility in concert with other
signalling pathways. Several genes of cluster I are known to beassociated with ER in that they are estrogen-regulated and/orassociated with a positive ER status. Examples are mucin 1(MUC1) (27), the proto-oncogene MYB (28), BCL2 (29) andthe cellular retinoic acid-binding protein 2 (CRABP2) (30).Transcriptional activators of ER are also included: theepidermal growth factor gene (EGF) (31), SMARCA2 (32),and the RHO–GDP dissociation inhibitor a (ARHGDIA) (6).Other transcription factors in cluster I include GATA3(13,14,33), XBP1 (13,14) (whose mRNA expression has beenpreviously associated with ER status), ILF1, ELF1, BS69, GLI3and PBX1. The search for downstream genes regulated by thesefactors could help identify other genes potentially relevant todisease outcome. It is probable that the expression of this genecluster reflects the functional status of the ER pathway,clinically more significant than the IHC ER status alone. Thismight explain the better survival observed for ER-positivetumours that overexpressed this gene cluster compared withER-positive tumours which underexpressed it. Finally, thiscluster included two genes involved in angiogenesis: angio-genin (ANG) (34) and thrombospondin 1 (THBS1) (35).
Figure 4. Gene-expression-based tumour classification correlates with clinical outcome. (A) Two-dimensional representation of the hierarchical clustering resultsare shown in Figs 2B and 3C. The analysis delineates four groups of tumours: A, B, C and D. Black squares indicate patients alive at last follow-up visit and redsquares indicate patients who died. Three classes of patients with a statistically different clinical outcome were defined according to gene expression profiles: classA (n¼ 16), class B þ C (n¼ 34), class D (n¼ 5). (B) Kaplan–Meier plot of overall survival of the three classes of patients (P< 0.005, log-rank test). (C) Kaplan–Meier plot of metastasis-free survival of the three classes of patients (P< 0.05, log-rank test).
Human Molecular Genetics, 2002, Vol. 11. No. 8 869
Cluster II was overexpressed in the group of tumours with theworst prognosis. It contained highly co-regulated genes withdiverse functions such as oncogenes, hormone receptors andapoptotic factors. A notable feature was the inclusion of theABCB1 gene coding for the membrane-associated P-glycopro-tein 1, an ATP-binding cassette chloride channel involved inmultidrug resistance and poor response to chemotherapy inbreast cancer (36). Among the other genes were the cathepsin Bprotease gene (CTSB) implicated in metastasis (37), the RAS-like GTPase TC21 (38) and CDKN3, a cell cycle regulator (39).Interestingly, several hormone and hormone receptor transcriptswere represented (PRLR, EMR1 and GNRH1). Prolactin (PRL)functions as an autocrine/paracrine factor that stimulatesgrowth and differentiation of mammary tissue after bindingto its receptor (PRLR). Although the activation of the PRL/PRLR pathway increases cellular motility in vitro (40), the roleof PRL and PRLR in breast cancer progression remains poorlydelineated (41). GJA1, the predominant connexin in humanmammary epithelium, has been found to be overexpressed indoxorubicin-resistant breast cancer cell lines (10). Whichevermight be the driving genes of these predictive clusters, theirprognostic accuracy and value are certainly increased by thepresence of other co-regulated genes, highlighting the utility oflarge-scale molecular analyses for explaining tumour hetero-geneity. The identification of the most relevant genes in eachclass is interesting because they represent novel potentialmarkers of sensitivity to current anticancer drugs and/ortumour aggressiveness. In addition, new specific therapiestargeting these genes might be developed as alternatives tostandard chemotherapy in the patients with poor outcome(classes B þ C and D).
In conclusion, our study shows that gene expression profiles,defined using candidate gene arrays, can identify clinicallyrelevant tumour subgroups, significantly contributing to therefinement of poor-prognosis breast cancer classification. Bydelineating discriminator genes, new alternative anticancerdrugs might soon be developed. The application of bettertailored and more specific therapy should lead to majorimprovements in cancer management, with better chances ofsuccess and potentially fewer side-effects. The next importantstep will be the analysis of larger series of patients inprospective clinical trials to assess the true impact of cDNAarray data on patient treatment.
MATERIALS AND METHODS
Breast tumour samples and characteristics of patients
Tumour samples were obtained from 55 women treated at theInstitut Paoli-Calmettes. These were chosen after carefulscreening based on the following criteria: (i) sporadic primarybreast cancer treated with surgery followed by adjuvantanthracycline-based chemotherapy, (ii) tumour material quicklydissected and frozen in liquid nitrogen and stored at �160�C,(iii) patient follow-up 48 months or more after diagnosis. Inaddition to the axillary node status, four poor-prognosis criteriawere used to determine whether adjuvant chemotherapy shouldbe administered: patient age less than 40 years, pathologicaltumour size greater than 20 mm, Scarff–Bloom–Richardson
(SBR) grade equal to 3, and negative ER status as evaluated byIHC (with a positivity cut-off value of 1%). Women whoreceived chemotherapy were those either with node-positivetumours, or with node-negative tumours and one of the poor-prognosis criteria if non-menopausal or two criteria ifmenopausal. After surgery, all patients received comparableregimens of chemotherapy containing conventional doses ofanthracycline every 21 days for six cycles. All tumour sectionswere de novo reviewed by a pathologist (J.J.) prior to analysis.All samples contained more than 50% tumour cells. Tumourswere infiltrating adenocarcinomas, including (according to theWHO histological typing) 42 ductal carcinomas, 5 lobular, 5mixed, and 3 medullary. Other main characteristics of patientsare listed in Table 1.
Breast cancer cell lines
All breast-cancer-derived cell lines were obtained from theAmerican Type Culture Collection – except BrCa-MZ-01 andBrCA-MZ-02, which were kind gifts from Dr V.J. Mobus (Ulm,Germany) – and were grown as recommended.
Complementary DNA array production
The 1045 human cDNA clones used in the study were obtainedfrom the IMAGE consortium. These were chosen to representgenes with proven or suspected roles in cancer, including genesinvolved in transcription, the cell cycle, cell adhesion, invasion,angiogenesis and chemoresistance (the complete list isavailable at http:/tagc.univ-mrs.fr/pub/Cancer/). The use ofcontrol clones, PCR amplification and robotical spotting ofPCR products onto Hybond-Nþ membranes (Amersham) weredone as described previously (42).
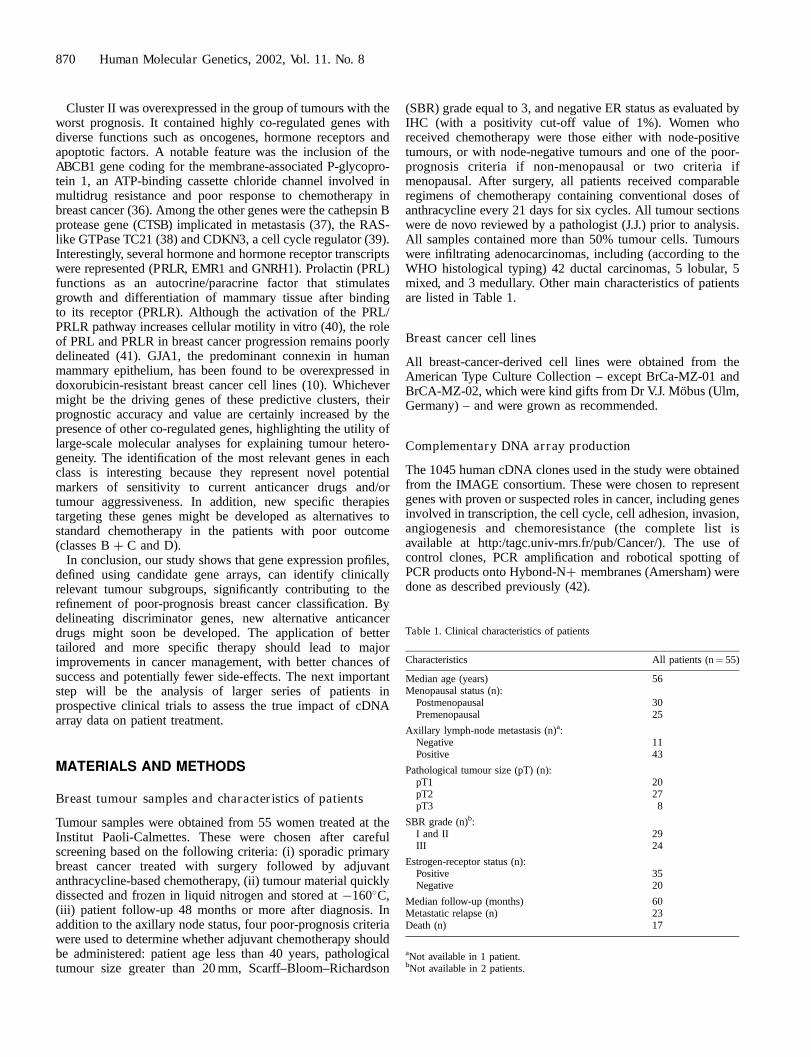
Table 1. Clinical characteristics of patients
Characteristics All patients (n¼ 55)
Median age (years) 56Menopausal status (n):
Postmenopausal 30Premenopausal 25
Axillary lymph-node metastasis (n)a:Negative 11Positive 43
Pathological tumour size (pT) (n):pT1 20pT2 27pT3 8
SBR grade (n)b:I and II 29III 24
Estrogen-receptor status (n):Positive 35Negative 20
Median follow-up (months) 60Metastatic relapse (n) 23Death (n) 17
aNot available in 1 patient.bNot available in 2 patients.
870 Human Molecular Genetics, 2002, Vol. 11. No. 8
RNA extraction, hybridizations and data acquisition
Total RNA was extracted from frozen tumour samples and celllines by standard methods (43). RNA integrity was controlledby 28S northern blots before labelling. Hybridizations ofcDNA arrays were done with radioactive [a-33P]dCTP-labelledprobes made from 5 mg of total RNA from each sampleaccording to described protocols (http:/tagc.univ-mrs.fr/pub/Cancer/). After washes, arrays were exposed to phosphoima-ging plates, which were then scanned with a FUJI BAS 1500machine.
Data analysis and statistical methods
Signal intensities were quantified, normalized for the amount ofspotted DNA (44) and the variability of experimentalconditions, and log-transformed (42). Average-linkage hier-archical clustering was then applied to investigate relationshipsbetween samples and relationships between genes. We used theCluster program (with Pearson correlation as similarity metric)and displayed results with the TreeView program (45).
The accuracy of tumour classification defined by hierarchicalclustering was assessed. We determined the average expressionprofile of each tumour group defined by the originalclassification (green and red groups in Figs 2B and 3C) andmeasured the Euclidean distance D between each sampleand the green (GD) and the red (RD) mean expression profiles.The difference between these distances (Ddistance, DD¼
GD7RD) reflected the proximity to average profiles (DD waspositive for samples closer to the red profile and negative forsamples closer to the green profile). Then, we used the intrinsicnoise in the experimental data to estimate confidence levels forDD and the probability of each tumour belonging to eachgroup. For every gene cluster tested, we retained a larger set ofgenes that contained, in addition to the original genes, theirneighbour genes belonging to dendrogram branches with acorrelation cut-off of 0.5. 10 000 datasets of the same size asthe initial selected cluster were randomly generated from thisnew set, allowing, for each sample, the computation of DD(mean and standard deviation) and the frequency with which itwas found closer to the red mean profile.
Survival analysis was done with the SPSS software (version10.0.5). The primary endpoint was the overall survival (OS)measured from the time of diagnosis until the date of the lastfollow-up visit or cancer-related death. Metastasis-free survival(MFS) was the secondary endpoint and was measured in thesame way until the date of the first distant metastasis. Survivalswere estimated with the Kaplan–Meier method and comparedbetween groups using the log-rank test (46). Data concerningpatients who were alive or without metastatic relapse at lastfollowup were censored. A P-value of less than 0.05 wasconsidered significant.
ACKNOWLEDGEMENTS
We are grateful to Drs G. Houvenaeghel, B.R. Jordan,D. Maraninchi and C. Mawas for encouragements, and toP. Hingamp for advice and help. This work was supported inpart by Inserm, CNRS, Institut Paoli-Calmettes, AssociationFrancaise Contre la Myopathie, Association pour la Recherche
sur le Cancer, Comite de la Corse du Sud de la Ligue NationaleContre le Cancer, and Federation Nationale des Centres deLutte Contre le Cancer. F.B. was supported by a fellowshipfrom Association pour la Recherche Contre le Cancer. V.N. wassupported by a fellowship from la Fondation de France.
REFERENCES
1. Early Breast Cancer Trialists’ Collaborative Group (1998) Polychemo-therapy for early breast cancer: an overview of the randomised trials.Lancet, 352, 930–942.
2. Early Breast Cancer Trialists’ Collaborative Group (1998) Tamoxifen forearly breast cancer: an overview of the randomised trials. Lancet, 351,1451–1467.
3. McCarthy, N.J. and Swain, S.M. (2000) Update on adjuvant chemotherapyfor early breast cancer. Oncology (Huntingt), 14, 1267–1280; discussion1280–1264, 1287–1268.
4. The Chipping Forecast (1999) Nat. Genet., 21(Suppl.), 1–60.
5. Granjeaud, S., Bertucci, F. and Jordan, B.R. (1999) Expression profiling:DNA arrays in many guises. Bioessays, 21, 781–790.
6. Clark, E.A., Golub, T.R., Lander, E.S. and Hynes, R.O. (2000) Genomicanalysis of metastasis reveals an essential role for RhoC. Nature, 406,532–535.
7. Zajchowski, D.A., Bartholdi, M.F., Gong, Y., Webster, L., Liu, H.L.,Munishkin, A., Beauheim, C., Harvey, S., Ethier, S.P. and Johnson, P.H.(2001) Identification of gene expression profiles that predict the aggressivebehavior of breast cancer cells. Cancer Res., 61, 5168–5178.
8. Scherf, U., Ross, D.T., Waltham, M., Smith, L.H., Lee, J.K., Tanabe, L.,Kohn, K.W., Reinhold, W.C., Myers, T.G., Andrews, D.T. et al. (2000) Agene expression database for the molecular pharmacology of cancer. Nat.Genet., 24, 236–244.
9. Staunton, J.E., Slonim, D.K., Coller, H.A., Tamayo, P., Angelo, M.J., Park,J., Scherf, U., Lee, J.K., Reinhold, W.O., Weinstein, J.N. et al. (2001)Chemosensitivity prediction by transcriptional profiling. Proc. Natl Acad.Sci. USA, 98, 10787–10792.
10. Turton, N.J., Judah, D.J., Riley, J., Davies, R., Lipson, D., Styles, J.A.,Smith, A.G. and Gant, T.W. (2001) Gene expression and amplification inbreast carcinoma cells with intrinsic and acquired doxorubicin resistance.Oncogene, 20, 1300–1306.
11. Golub, T.R., Slonim, D.K., Tamayo, P., Huard, C., Gaasenbeek, M.,Mesirov, J.P., Coller, H., Loh, M.L., Downing, J.R., Caligiuri, M.A. et al.(1999) Molecular classification of cancer: class discovery and classprediction by gene expression monitoring. Science, 286, 531–537.
12. Alizadeh, A.A., Eisen, M.B., Davis, R.E., Ma, C., Lossos, I.S., Rosenwald,A., Boldrick, J.C., Sabet, H., Tran, T., Yu, X. et al. (2000) Distinct types ofdiffuse large B-cell lymphoma identified by gene expression profiling.Nature, 403, 503–511.
13. Perou, C.M., Sorlie, T., Eisen, M.B., van de Rijn, M., Jeffrey, S.S., Rees,C.A., Pollack, J.R., Ross, D.T., Johnsen, H., Akslen, L.A. et al. (2000)Molecular portraits of human breast tumours. Nature, 406, 747–752.
14. Bertucci, F., Houlgatte, R., Benziane, A., Granjeaud, S., Adelaide, J.,Tagett, R., Loriod, B., Jacquemier, J., Viens, P., Jordan, B. et al. (2000)Gene expression profiling of primary breast carcinomas using arrays ofcandidate genes. Hum. Mol. Genet., 9, 2981–2991.
15. Martin, K.J., Kritzman, B.M., Price, L.M., Koh, B., Kwan, C.P., Zhang, X.,Mackay, A., O’Hare, M.J., Kaelin, C.M., Mutter, G.L. et al. (2000) Linkinggene expression patterns to therapeutic groups in breast cancer. CancerRes., 60, 2232–2238.
16. Hedenfalk, I., Duggan, D., Chen, Y., Radmacher, M., Bittner, M., Simon,R., Meltzer, P., Gusterson, B., Esteller, M., Kallioniemi, O.P. et al. (2001)Gene-expression profiles in hereditary breast cancer. N. Engl. J. Med., 344,539–548.
17. Bittner, M., Meltzer, P., Chen, Y., Jiang, Y., Seftor, E., Hendrix, M.,Radmacher, M., Simon, R., Yakhini, Z., Ben-Dor, A. et al. (2000)Molecular classification of cutaneous malignant melanoma by geneexpression profiling. Nature, 406, 536–540.
18. Welsh, J.B., Zarrinkar, P.P., Sapinoso, L.M., Kern, S.G., Behling, C.A.,Monk, B.J., Lockhart, D.J., Burger, R.A. and Hampton, G.M. (2001)Analysis of gene expression profiles in normal and neoplastic ovarian tissue
Human Molecular Genetics, 2002, Vol. 11. No. 8 871
samples identifies candidate molecular markers of epithelial ovarian cancer.Proc. Natl Acad. Sci. USA, 98, 1176–1181.
19. Khan, J., Wei, J.S., Ringner, M., Saal, L.H., Ladanyi, M., Westermann, F.,Berthold, F., Schwab, M., Antonescu, C.R., Peterson, C. et al. (2001)Classification and diagnostic prediction of cancers using gene expressionprofiling and artificial neural networks. Nat. Med., 7, 673–679.
20. Takahashi, M., Rhodes, D.R., Furge, K.A., Kanayama, H., Kagawa, S.,Haab, B.B. and Teh, B.T. (2001) Gene expression profiling of clear cellrenal cell carcinoma: gene identification and prognostic classification. Proc.Natl Acad. Sci. USA, 98, 9754–9759.
21. Kihara, C., Tsunoda, T., Tanaka, T., Yamana, H., Furukawa, Y., Ono, K.,Kitahara, O., Zembutsu, H., Yanagawa, R., Hirata, K. et al. (2001)Prediction of sensitivity of esophageal tumors to adjuvant chemotherapy bycDNA microarray analysis of gene-expression profiles. Cancer Res., 61,6474–6479.
22. Garber, M.E., Troyanskaya, O.G., Schluens, K., Petersen, S., Thaesler, Z.,Pacyna-Gengelbach, M., van De Rijn, M., Rosen, G.D., Perou, C.M.,Whyte, R.I. et al. (2001) Diversity of gene expression in adenocarcinoma ofthe lung. Proc. Natl Acad. Sci. USA, 13, 13784–13789.
23. Bhattacharjee, A., Richards, W.G., Staunton, J., Li, C., Monti, S., Vasa, P.,Ladd, C., Beheshti, J., Bueno, R., Gillette, M. et al. (2001) Classification ofhuman lung carcinomas by mRNA expression profiling reveals distinctadenocarcinoma subclasses. Proc. Natl Acad. Sci. USA, 13, 13790–13795.
24. Sorlie, T., Perou, C.M., Tibshirani, R., Aas, T., Geisler, S., Johnsen, H.,Hastie, T., Eisen, M.B., van de Rijn, M., Jeffrey, S.S. et al. (2001) Geneexpression patterns of breast carcinomas distinguish tumor subclasses withclinical implications. Proc. Natl Acad. Sci. USA, 98, 10869–10874.
25. Fisher, E.R., Osborne, C.K., McGuire, W.L., Redmond, C., Knight, W.A.,3rd, Fisher, B., Bannayan, G., Walder, A., Gregory, E.J., Jacobsen, A. et al.(1981) Correlation of primary breast cancer histopathology and estrogenreceptor content. Breast Cancer Res. Treat., 1, 37–41.
26. Chang, J., Powles, T.J., Allred, D.C., Ashley, S.E., Clark, G.M., Makris, A.,Assersohn, L., Gregory, R.K., Osborne, C.K., and Dowsett, M. (1999)Biologic markers as predictors of clinical outcome from systemic therapyfor primary operable breast cancer. J. Clin. Oncol., 17, 3058–3063.
27. McGuckin, M.A., Walsh, M.D., Hohn, B.G., Ward, B.G., and Wright, R.G.(1995) Prognostic significance of MUC1 epithelial mucin expression inbreast cancer. Hum. Pathol., 26, 432–439.
28. Guerin, M., Sheng, Z.M., Andrieu, N., and Riou, G. (1990) Strongassociation between c-myb and oestrogen-receptor expression in humanbreast cancer. Oncogene, 5, 131–135.
29. Binder, C., Marx, D., Overhoff, R., Binder, L., Schauer, A. and Hiddemann,W. (1995) Bcl-2 protein expression in breast cancer in relation toestablished prognostic factors and other clinicopathological variables. Ann.Oncol., 6, 1005–1010.
30. Bucco, R.A., Zheng, W.L., Wardlaw, S.A., Davis, J.T., Sierra-Rivera, E.,Osteen, K.G., Melner, M.H., Kakkad, B.P. and Ong, D.E. (1996) Regulationand localization of cellular retinol-binding protein, retinol-binding protein,cellular retinoic acid-binding protein (CRABP) and CRABP II in the uterusof the pseudopregnant rat. Endocrinology, 137, 3111–3122.
31. Kato, S., Endoh, H., Masuhiro, Y., Kitamoto, T., Uchiyama, S., Sasaki, H.,Masushige, S., Gotoh, Y., Nishida, E., Kawashima, H. et al. (1995)Activation of the estrogen receptor through phosphorylation by mitogen-activated protein kinase. Science, 270, 1491–1494.
32. Chiba, H., Muramatsu, M., Nomoto, A. and Kato, H. (1994) Two humanhomologues of Saccharomyces cerevisiae SWI2/SNF2 and Drosophilabrahma are transcriptional coactivators cooperating with the estrogenreceptor and the retinoic acid receptor. Nucleic Acids Res., 22, 1815–1820.
33. Hoch, R.V., Thompson, D.A., Baker, R.J. and Weigel, R.J. (1999) GATA-3is expressed in association with estrogen receptor in breast cancer. Int. J.Cancer, 84, 122–128.
34. Montero, S., Guzman, C., Cortes-Funes, H. and Colomer, R. (1998)Angiogenin expression and prognosis in primary breast carcinoma. Clin.Cancer Res., 4, 2161–2168.
35. Weinstat-Saslow, D.L., Zabrenetzky, V.S., VanHoutte, K., Frazier, W.A.,Roberts, D.D. and Steeg, P.S. (1994) Transfection of thrombospondin 1complementary DNA into a human breast carcinoma cell line reducesprimary tumor growth, metastatic potential, and angiogenesis. Cancer Res.,54, 6504–6511.
36. Trock, B.J., Leonessa, F. and Clarke, R. (1997) Multidrug resistance inbreast cancer: a meta-analysis of MDR1/gp170 expression and its possiblefunctional significance. J. Natl Cancer Inst., 89, 917–931.
37. Foekens, J.A., Kos, J., Peters, H.A., Krasovec, M., Look, M.P., Cimerman,N., Meijer-van Gelder, M.E., Henzen-Logmans, S.C., van Putten, W.L. andKlijn, J.G. (1998) Prognostic significance of cathepsins B and L in primaryhuman breast cancer. J. Clin. Oncol., 16, 1013–1021.
38. Clark, G.J., Kinch, M.S., Gilmer, T.M., Burridge, K. and Der, C.J. (1996)Overexpression of the Ras-related TC21/R-Ras2 protein may contribute tothe development of human breast cancers. Oncogene, 12, 169–176.
39. Lee, S.W., Reimer, C.L., Fang, L., Iruela-Arispe, M.L. and Aaronson, S.A.(2000) Overexpression of kinase-associated phosphatase (KAP) in breastand prostate cancer and inhibition of the transformed phenotype byantisense KAP expression. Mol. Cell. Biol., 20, 1723–1732.
40. Maus, M.V., Reilly, S.C. and Clevenger, C.V. (1999) Prolactin as achemoattractant for human breast carcinoma. Endocrinology, 140, 5447–5450.
41. Reynolds, C., Montone, K.T., Powell, C.M., Tomaszewski, J. E andClevenger, C.V. (1997) Expression of prolactin and its receptor in humanbreast carcinoma. Endocrinology, 138, 5555–5560.
42. Bertucci, F., Van Hulst, S., Bernard, K., Loriod, B., Granjeaud, S., Tagett,R., Starkey, M., Nguyen, C., Jordan, B. and Birnbaum, D. (1999)Expression scanning of an array of growth control genes in human tumorcell lines. Oncogene, 18, 3905–3912.
43. Theillet, C., Adelaide, J., Louason, G., Bonnet-Dorion, F., Jacquemier, J.,Adnane, J., Longy, M., Katsaros, D., Sismondi, P., Gaudray, P. et al. (1993)FGFRI and PLAT genes and DNA amplification at 8p12 in breast andovarian cancers. Genes Chromosomes Cancer, 7, 219–226.
44. Bertucci, F., Bernard, K., Loriod, B., Chang, Y.C., Granjeaud, S., Birnbaum,D., Nguyen, C., Peck, K. and Jordan, B.R. (1999) Sensitivity issues in DNAarray-based expression measurements and performance of nylon micro-arrays for small samples. Hum. Mol. Genet., 8, 1715–1722.
45. Eisen, M.B., Spellman, P.T., Brown, P.O. and Botstein, D. (1998) Clusteranalysis and display of genome-wide expression patterns. Proc. Natl Acad.Sci. USA, 95, 14863–14868.
46. Kaplan, E. and Meier, P. (1958) Nonparametric estimation from incompleteobservations. J. Am. Stat. Assoc., 53, 457–481.
872 Human Molecular Genetics, 2002, Vol. 11. No. 8