G INTERNACIONAL (2011) 502: 163175 O PAPER New detailed ... fileORIGINAL PAPER. H. G. Nami 164...
13
GEOFÍSICA INTERNACIONAL (2011) 50-2: 163-175 Resumen Se reporta información paleomagnética de una sección sedimentaria del sitio arqueológico San- ta Lucía, provincia de Corrientes (Nordeste de Argentina). El magnetismo remanente natural obtenido en 74 especimenes orientados mostró una remanencia magnética normal e interme- dia con bajos valores negativos y positivos de inclinación durante el Holoceno tardío. La mag- netización remanente característica fue determi- nada por desmagnetización progresiva utilizando campos alternos. Los polos geomagnéticos vir- tuales muestran algunas coincidencias con los registrados durante el Pleistoceno Terminal y Holoceno en otros sitos del cono sur de Suda- mérica. Los polos paleomagnéticos calculados con sitios del nordeste de Argentina se localizan ~3-15° alejados del eje de rotación de la Tierra. Palabras clave: paleomagnetismo, variaciones paleoseculares, Holoceno, Arqueología, Sudamé- rica, Argentina. Abstract Paleomagnetic data from a sedimentary section from Santa Lucía archaeological site, Corrientes province (Northeastern Argentina) are reported. Natural remanent magnetization obtained from 74 oriented cores showed normal and intermediate magnetic remanence with negative and positive low inclination values during the Late Holocene. Characteristic remanent magnetization was deter- mined by progressive demagnetization using the AF method. Virtual geomagnetic poles show some agreement with those registered during the terminal Pleistocene and Holocene in other sites from the southern cone of South America. Palaeomagnetic poles for other contemporaneous sites from northeastern Argentina fall some ~3–15° away from the Earth’s rotation’s axis. Key words: paleomagnetism, paleosecular variations, Holocene, Archaeology, South Ame- rica, Argentina. 163 New detailed paleosecular variation record at Santa Lucía archaeological site (Corrientes province, northeastern Argentina) Hugo G. Nami Received: June 2, 2009; accepted: March 9, 2011; published on line: March 29, 2011 H. G. Nami CONICET Instituto de Geofísica “Daniel A. Valencio” Departamento de Ciencias Geológicas Facultad de Ciencias Exactas, Físicas y Naturales Universidad de Buenos Aires Ciudad Universitaria (Pabellón II) Buenos Aires (C1428EHA) República Argentina Associated Research Department of Anthropology National Museum of Natural History Smithsonian Institution Washington, D. C. Corresponding author: [email protected] ORIGINAL PAPER
-
Upload
nguyenlien -
Category
Documents
-
view
215 -
download
0
Transcript of G INTERNACIONAL (2011) 502: 163175 O PAPER New detailed ... fileORIGINAL PAPER. H. G. Nami 164...
GEOFÍSICA INTERNACIONAL (2011) 502: 163175
Resumen
Se reporta información paleomagnética de una sección sedimentaria del sitio arqueológico Santa Lucía, provincia de Corrientes (Nordeste de Argentina). El magnetismo remanente natural obtenido en 74 especimenes orientados mostró una remanencia magnética normal e intermedia con bajos valores negativos y positivos de inclinación durante el Holoceno tardío. La magnetización remanente característica fue determinada por desmagnetización progresiva utilizando campos alternos. Los polos geomagnéticos virtuales muestran algunas coincidencias con los registrados durante el Pleistoceno Terminal y Holoceno en otros sitos del cono sur de Sudamérica. Los polos paleomagnéticos calculados con sitios del nordeste de Argentina se localizan ~315° alejados del eje de rotación de la Tierra.
Palabras clave: paleomagnetismo, variaciones paleoseculares, Holoceno, Arqueología, Sudamérica, Argentina.
Abstract
Paleomagnetic data from a sedimentary section from Santa Lucía archaeological site, Corrientes province (Northeastern Argentina) are reported. Natural remanent magnetization obtained from 74 oriented cores showed normal and intermediate magnetic remanence with negative and positive low inclination values during the Late Holocene. Characteristic remanent magnetization was determined by progressive demagnetization using the AF method. Virtual geomagnetic poles show some agreement with those registered during the terminal Pleistocene and Holocene in other sites from the southern cone of South America. Palaeomagnetic poles for other contemporaneous sites from northeastern Argentina fall some ~3–15° away from the Earth’s rotation’s axis.
Key words: paleomagnetism, paleosecular variations, Holocene, Archaeology, South America, Argentina.
163
New detailed paleosecular variation record at Santa Lucía archaeological site(Corrientes province, northeastern Argentina)
Hugo G. Nami
Received: June 2, 2009; accepted: March 9, 2011; published on line: March 29, 2011
H. G. NamiCONICETInstituto de Geofísica “Daniel A. Valencio”Departamento de Ciencias GeológicasFacultad de Ciencias Exactas, Físicas y NaturalesUniversidad de Buenos AiresCiudad Universitaria (Pabellón II)Buenos Aires (C1428EHA)República Argentina
Associated ResearchDepartment of AnthropologyNational Museum of Natural HistorySmithsonian InstitutionWashington, D. C.Corresponding author: [email protected]
ORIGINAL PAPER
H. G. Nami
164 VOLUME 50 NUMBER 2
Introduction
Paleomagnetic research recently performed in several archaeological, paleontological and geological deposits located in the southern cone of South America yielded large paleosecular variation (PSV) logs (especially in inclination) during the terminal Pleistocene and Holocene at ~120.1 ka (Sinito et al., 1997, Nami 1995, 1999, 2006, 2008, Ré et al., 2008). To go deeper !"#$%&#'"()*&+,&#(-#$%&#,&(./,"&$!0#1&*+#23456#in this part of the continent, a variety of sections of recent sediments were sampled. This paper reports the results of a detailed palaeomagnetic research performed at the Santa Lucía (SL) archaeological site in Northeastern Corrientes province, Argentine Republic. Additionally, by using regional PSV logs previously reported diverse aspects of paleomagnetic records are discussed.
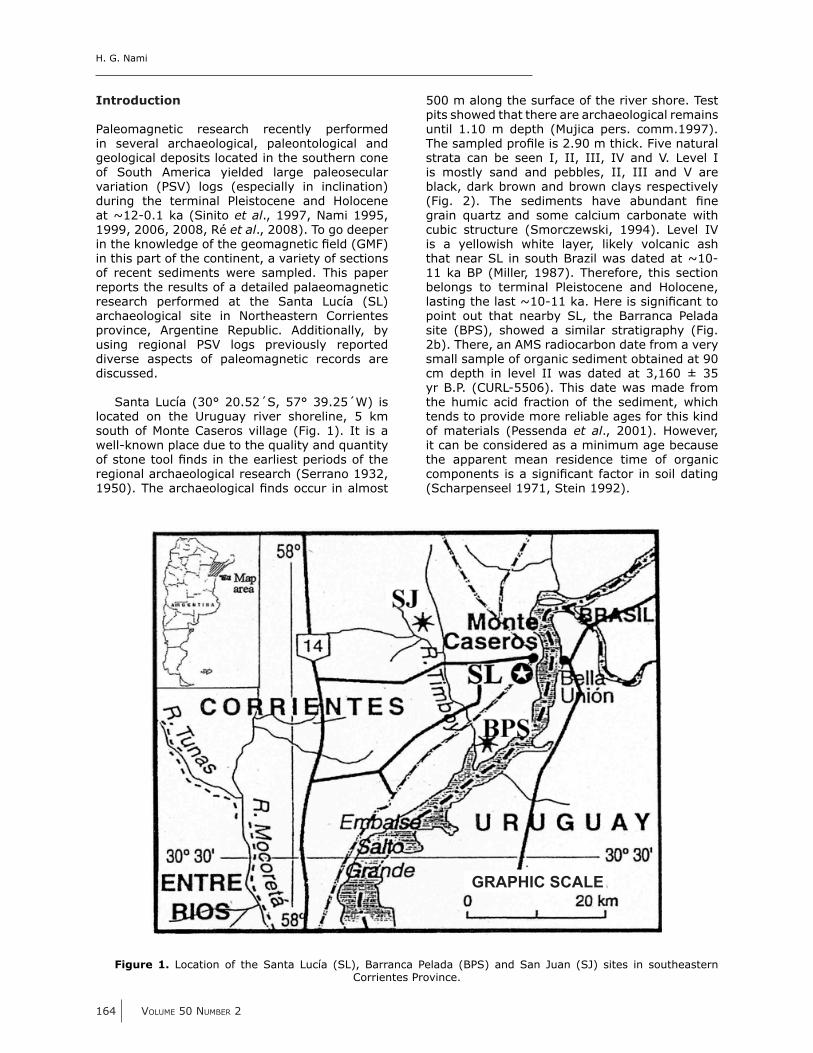
Santa Lucía (30° 20.52´S, 57° 39.25´W) is located on the Uruguay river shoreline, 5 km south of Monte Caseros village (Fig. 1). It is a wellknown place due to the quality and quantity (-#7$("&#$((*#1"+7#!"#$%&#&/8*!&7$#9&8!(+7#(-#$%&#regional archaeological research (Serrano 1932, :;<=6>#?%&#/80%/&(*(,!0/*#1"+7#(00@8#!"#/*.(7$#
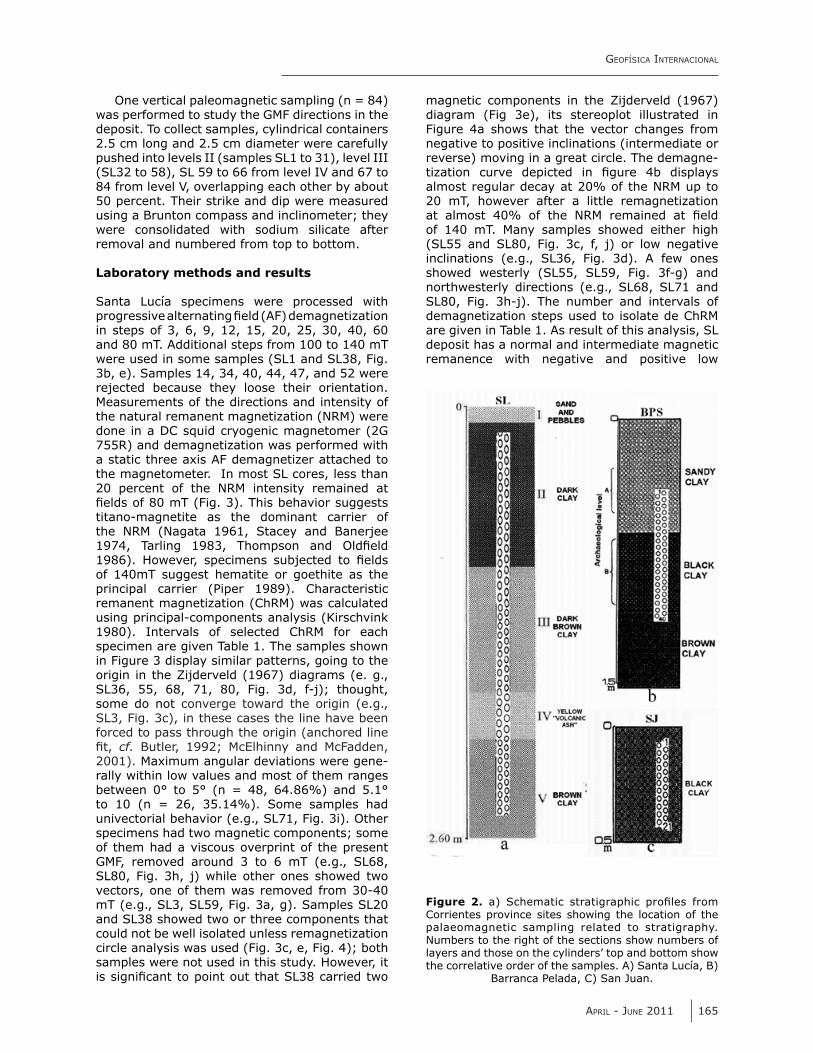
500 m along the surface of the river shore. Test pits showed that there are archaeological remains until 1.10 m depth (Mujica pers. comm.1997). ?%/.9*&+#98(1*&#!7#A>;=#.#$%!0'>#5!B&#"/$@8/*#strata can be seen I, II, III, IV and V. Level I is mostly sand and pebbles, II, III and V are black, dark brown and brown clays respectively 25!,># A6># ?%&# 7&+!.&"$7# %/B&# /C@"+/"$# 1"&#grain quartz and some calcium carbonate with cubic structure (Smorczewski, 1994). Level IV is a yellowish white layer, likely volcanic ash that near SL in south Brazil was dated at ~1011 ka BP (Miller, 1987). Therefore, this section belongs to terminal Pleistocene and Holocene, */7$!",#$%&#*/7$#D:=E::#'/>#F&8&#!7#7!,"!10/"$#$(#point out that nearby SL, the Barranca Pelada site (BPS), showed a similar stratigraphy (Fig. 2b). There, an AMS radiocarbon date from a very small sample of organic sediment obtained at 90 cm depth in level II was dated at 3,160 ± 35 yr B.P. (CURL5506). This date was made from the humic acid fraction of the sediment, which tends to provide more reliable ages for this kind of materials (Pessenda et al., 2001). However, it can be considered as a minimum age because the apparent mean residence time of organic 0(.9("&"$7#!7#/#7!,"!10/"$#-/0$(8#!"#7(!*#+/$!",#(Scharpenseel 1971, Stein 1992).
Figure 1. Location of the Santa Lucía (SL), Barranca Pelada (BPS) and San Juan (SJ) sites in southeastern Corrientes Province.
GRAPHIC SCALE
GEOFÍSICA INTERNACIONAL
APRIL JUNE 2011 165
One vertical paleomagnetic sampling (n = 84) was performed to study the GMF directions in the deposit. To collect samples, cylindrical containers 2.5 cm long and 2.5 cm diameter were carefully pushed into levels II (samples SL1 to 31), level III (SL32 to 58), SL 59 to 66 from level IV and 67 to 84 from level V, overlapping each other by about 50 percent. Their strike and dip were measured using a Brunton compass and inclinometer; they were consolidated with sodium silicate after removal and numbered from top to bottom.
Laboratory methods and results
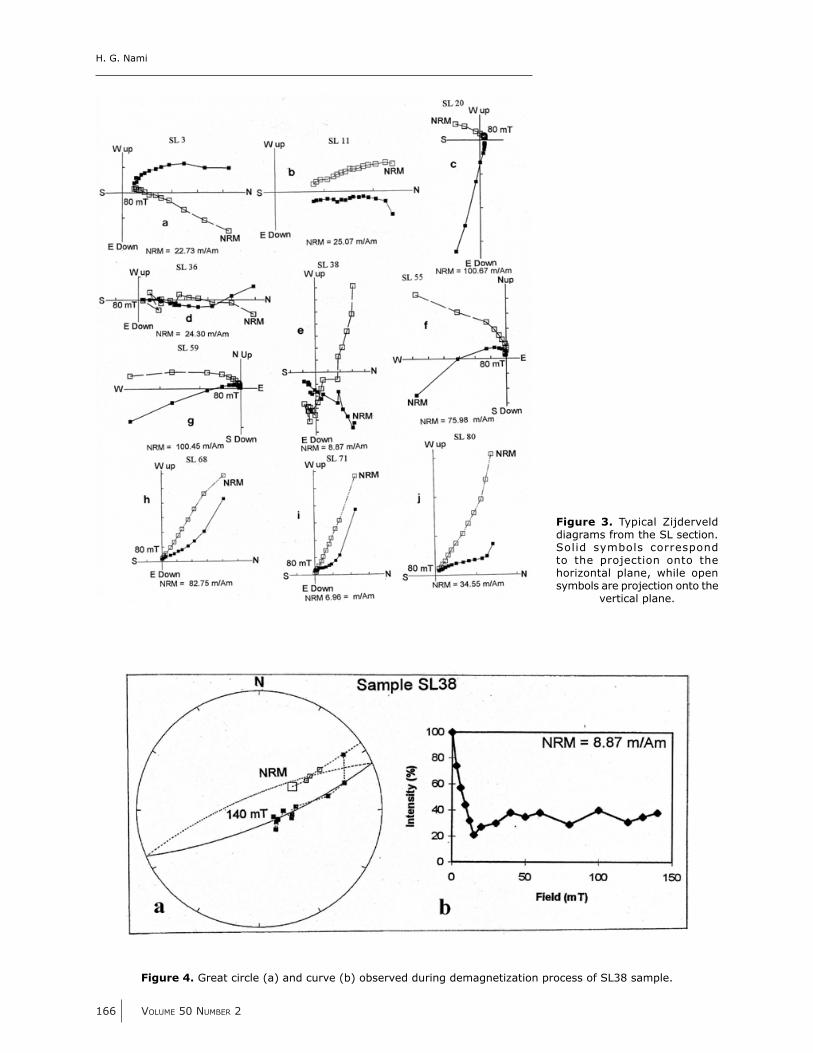
Santa Lucía specimens were processed with 98(,8&77!B&#/*$&8"/$!",#1&*+#2G56#+&./,"&$!H/$!("#in steps of 3, 6, 9, 12, 15, 20, 25, 30, 40, 60 and 80 mT. Additional steps from 100 to 140 mT were used in some samples (SL1 and SL38, Fig. 3b, e). Samples 14, 34, 40, 44, 47, and 52 were rejected because they loose their orientation. Measurements of the directions and intensity of the natural remanent magnetization (NRM) were done in a DC squid cryogenic magnetomer (2G 755R) and demagnetization was performed with a static three axis AF demagnetizer attached to the magnetometer. In most SL cores, less than 20 percent of the NRM intensity remained at 1&*+7#(-#I=#.?#25!,>#J6>#?%!7#C&%/B!(8#7@,,&7$7#titanomagnetite as the dominant carrier of the NRM (Nagata 1961, Stacey and Banerjee :;KLM# ?/8*!",# :;IJM# ?%(.97("# /"+# N*+1&*+#:;IO6># F()&B&8M# 79&0!.&"7# 7@CP&0$&+# $(# 1&*+7#of 140mT suggest hematite or goethite as the principal carrier (Piper 1989). Characteristic remanent magnetization (ChRM) was calculated using principalcomponents analysis (Kirschvink 1980). Intervals of selected ChRM for each specimen are given Table 1. The samples shown in Figure 3 display similar patterns, going to the origin in the Zijderveld (1967) diagrams (e. g., SL36, 55, 68, 71, 80, Fig. 3d, fj); thought, some do not converge toward the origin (e.g., SL3, Fig. 3c), in these cases the line have been forced to pass through the origin (anchored line 1$M# cf. Butler, 1992; McElhinny and McFadden, 2001). Maximum angular deviations were generally within low values and most of them ranges between 0° to 5° (n = 48, 64.86%) and 5.1° to 10 (n = 26, 35.14%). Some samples had univectorial behavior (e.g., SL71, Fig. 3i). Other specimens had two magnetic components; some of them had a viscous overprint of the present GMF, removed around 3 to 6 mT (e.g., SL68, SL80, Fig. 3h, j) while other ones showed two vectors, one of them was removed from 3040 mT (e.g., SL3, SL59, Fig. 3a, g). Samples SL20 and SL38 showed two or three components that could not be well isolated unless remagnetization circle analysis was used (Fig. 3c, e, Fig. 4); both samples were not used in this study. However, it !7#7!,"!10/"$#$(#9(!"$#(@$#$%/$#QRJI#0/88!&+#$)(#
magnetic components in the Zijderveld (1967) diagram (Fig 3e), its stereoplot illustrated in Figure 4a shows that the vector changes from negative to positive inclinations (intermediate or reverse) moving in a great circle. The demagne$!H/$!("# 0@8B&# +&9!0$&+# !"# 1,@8&# LC# +!79*/S7#almost regular decay at 20% of the NRM up to 20 mT, however after a little remagnetization /$# /*.(7$# L=T# (-# $%&# UV4# 8&./!"&+# /$# 1&*+#of 140 mT. Many samples showed either high (SL55 and SL80, Fig. 3c, f, j) or low negative inclinations (e.g., SL36, Fig. 3d). A few ones showed westerly (SL55, SL59, Fig. 3fg) and northwesterly directions (e.g., SL68, SL71 and SL80, Fig. 3hj). The number and intervals of demagnetization steps used to isolate de ChRM are given in Table 1. As result of this analysis, SL deposit has a normal and intermediate magnetic remanence with negative and positive low
Figure 2.# /6# Q0%&./$!0# 7$8/$!,8/9%!0# 98(1*&7# -8(.#Corrientes province sites showing the location of the palaeomagnetic sampling related to stratigraphy. Numbers to the right of the sections show numbers of layers and those on the cylinders’ top and bottom show the correlative order of the samples. A) Santa Lucía, B)
Barranca Pelada, C) San Juan.
H. G. Nami
166 VOLUME 50 NUMBER 2
Figure 3. Typical Zijderveld diagrams from the SL section. Solid symbols correspond to the projection onto the horizontal plane, while open symbols are projection onto the
vertical plane.
Figure 4. Great circle (a) and curve (b) observed during demagnetization process of SL38 sample.
GEOFÍSICA INTERNACIONAL
APRIL JUNE 2011 167
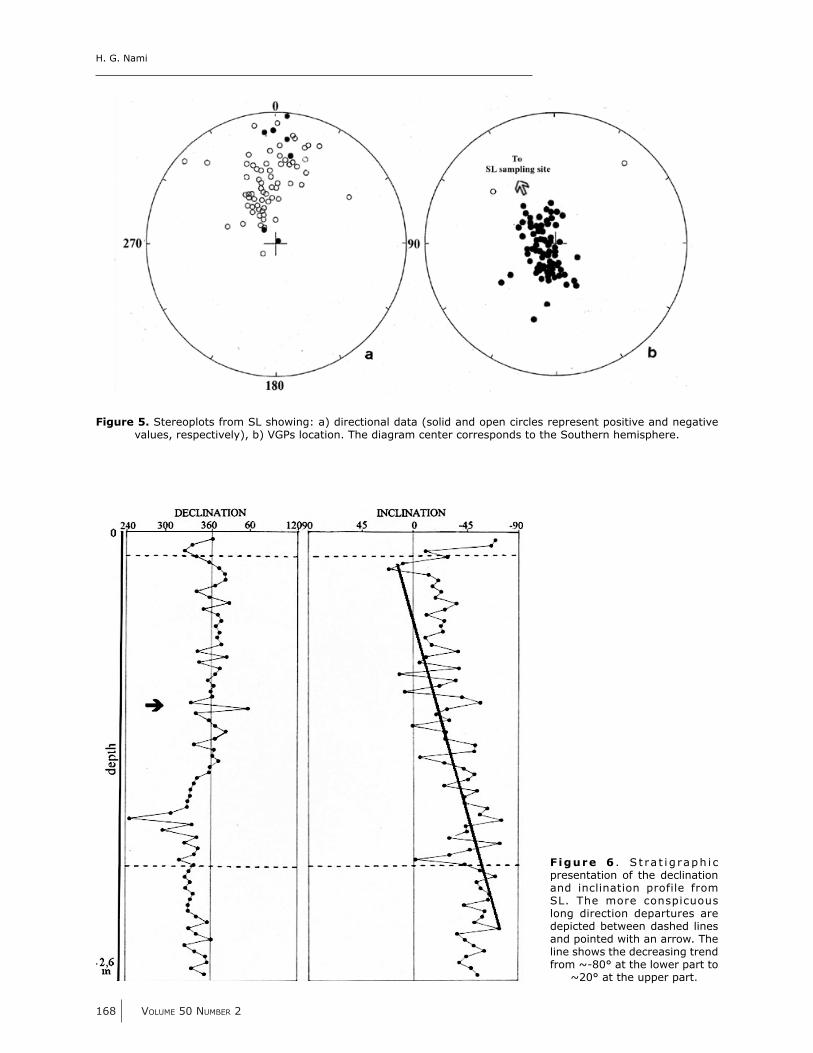
inclination values. Figures 5a and b illustrates the stereographic projection of ChRM and virtual geomagnetic pole (VGP) calculated from the directions of Table 1. Figure 6 shows changes in the declination and inclination from ChRM isolated for the entire section according to the stratigraphic depth. They clearly show a similar GMF behavior with the most conspicuous long declination and inclination departures depicted between dashed lines and pointed with an arrow. The record of inclination presents a general decreasing trend from 80° at the lower part to 20° at the upper part. The uppermost samples vary widely and there are transitional positions
between the swings. An important oscillation in declination, that reaches values of ~40° to the east, is located between SL7 and SL46 samples (level II and top of level III).
Nearby SL, also in the Corrientes province, results obtained at BPS and San Juan (SJ) sites were previously reported (Nami 1999: Figs. 9 and 10b). They also showed unstable records with a similar behavior, suggesting that these variations .!,%$# 8&W&0$# $%&# XQY># 5!,@8&# K# !**@7$8/$&7# $%&#overlapped stratigraphic presentation of each section showing a remarkably match of BPS (samples BPS9 to BPS39) and SJ logs with the
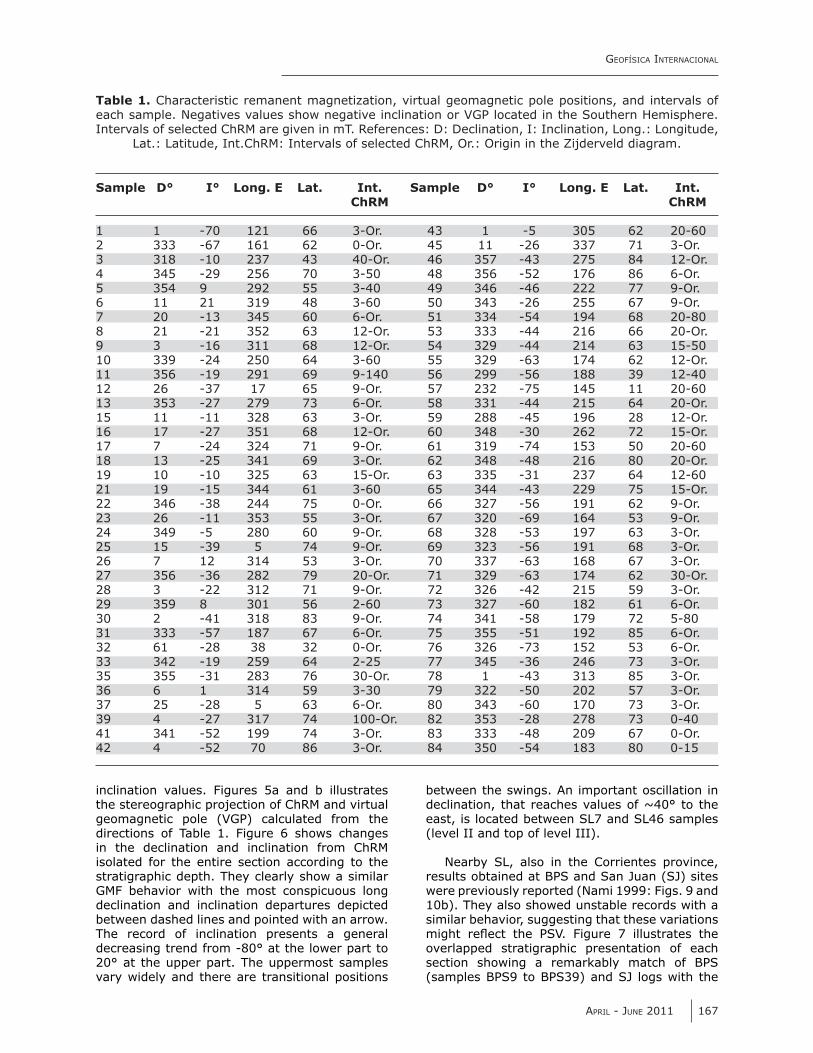
Table 1. Characteristic remanent magnetization, virtual geomagnetic pole positions, and intervals of each sample. Negatives values show negative inclination or VGP located in the Southern Hemisphere. Intervals of selected ChRM are given in mT. References: D: Declination, I: Inclination, Long.: Longitude,
Lat.: Latitude, Int.ChRM: Intervals of selected ChRM, Or.: Origin in the Zijderveld diagram.
Sample D° I° Long. E Lat. Int. Sample D° I° Long. E Lat. Int. ChRM ChRM
1 1 70 121 66 3Or. 43 1 5 305 62 20602 333 67 161 62 0Or. 45 11 26 337 71 3Or.3 318 10 237 43 40Or. 46 357 43 275 84 12Or.4 345 29 256 70 350 48 356 52 176 86 6Or.5 354 9 292 55 340 49 346 46 222 77 9Or.6 11 21 319 48 360 50 343 26 255 67 9Or.7 20 13 345 60 6Or. 51 334 54 194 68 20808 21 21 352 63 12Or. 53 333 44 216 66 20Or.9 3 16 311 68 12Or. 54 329 44 214 63 155010 339 24 250 64 360 55 329 63 174 62 12Or.11 356 19 291 69 9140 56 299 56 188 39 124012 26 37 17 65 9Or. 57 232 75 145 11 206013 353 27 279 73 6Or. 58 331 44 215 64 20Or.15 11 11 328 63 3Or. 59 288 45 196 28 12Or.16 17 27 351 68 12Or. 60 348 30 262 72 15Or.17 7 24 324 71 9Or. 61 319 74 153 50 206018 13 25 341 69 3Or. 62 348 48 216 80 20Or.19 10 10 325 63 15Or. 63 335 31 237 64 126021 19 15 344 61 360 65 344 43 229 75 15Or.22 346 38 244 75 0Or. 66 327 56 191 62 9Or.23 26 11 353 55 3Or. 67 320 69 164 53 9Or.24 349 5 280 60 9Or. 68 328 53 197 63 3Or.25 15 39 5 74 9Or. 69 323 56 191 68 3Or.26 7 12 314 53 3Or. 70 337 63 168 67 3Or.27 356 36 282 79 20Or. 71 329 63 174 62 30Or.28 3 22 312 71 9Or. 72 326 42 215 59 3Or.29 359 8 301 56 260 73 327 60 182 61 6Or.30 2 41 318 83 9Or. 74 341 58 179 72 58031 333 57 187 67 6Or. 75 355 51 192 85 6Or.32 61 28 38 32 0Or. 76 326 73 152 53 6Or.33 342 19 259 64 225 77 345 36 246 73 3Or.35 355 31 283 76 30Or. 78 1 43 313 85 3Or.36 6 1 314 59 330 79 322 50 202 57 3Or.37 25 28 5 63 6Or. 80 343 60 170 73 3Or.39 4 27 317 74 100Or. 82 353 28 278 73 04041 341 52 199 74 3Or. 83 333 48 209 67 0Or.42 4 52 70 86 3Or. 84 350 54 183 80 015
H. G. Nami
168 VOLUME 50 NUMBER 2
Figure 5. Stereoplots from SL showing: a) directional data (solid and open circles represent positive and negative values, respectively), b) VGPs location. The diagram center corresponds to the Southern hemisphere.
F igure 6 . S t ra t i g raph i c presentation of the declination and inclination profile from SL. The more conspicuous long direction departures are depicted between dashed lines and pointed with an arrow. The line shows the decreasing trend from ~80° at the lower part to ~20° at the upper part.
GEOFÍSICA INTERNACIONAL
APRIL JUNE 2011 169
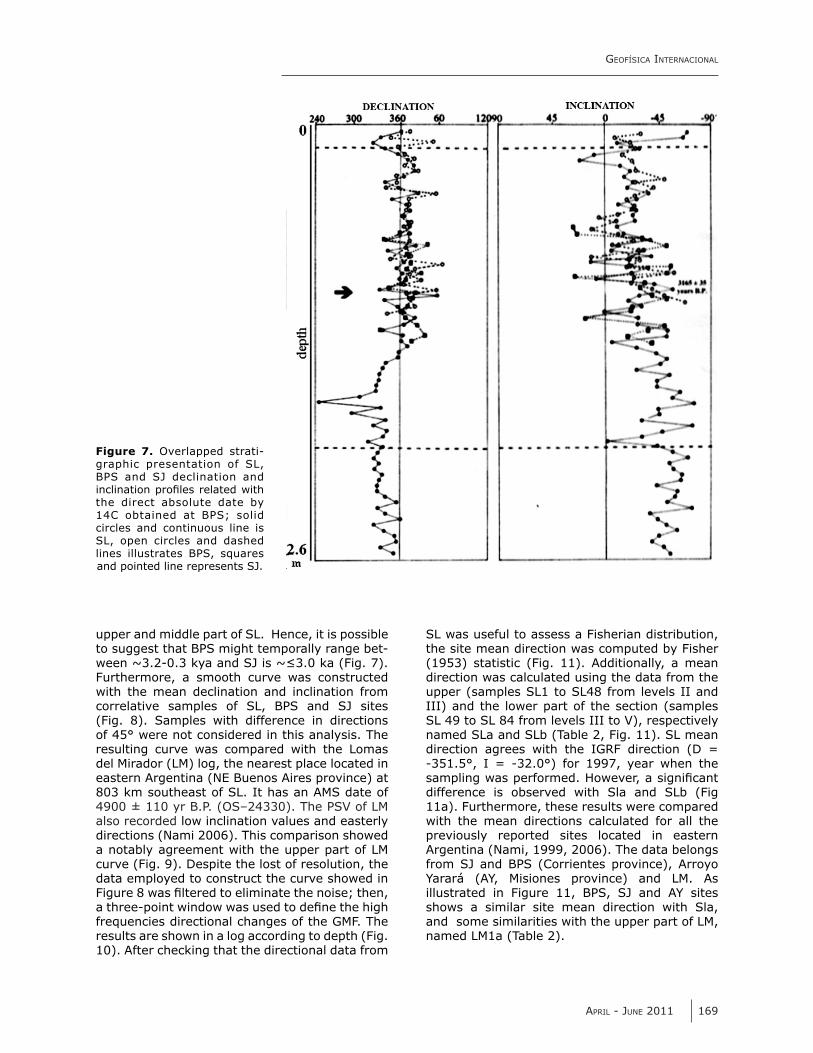
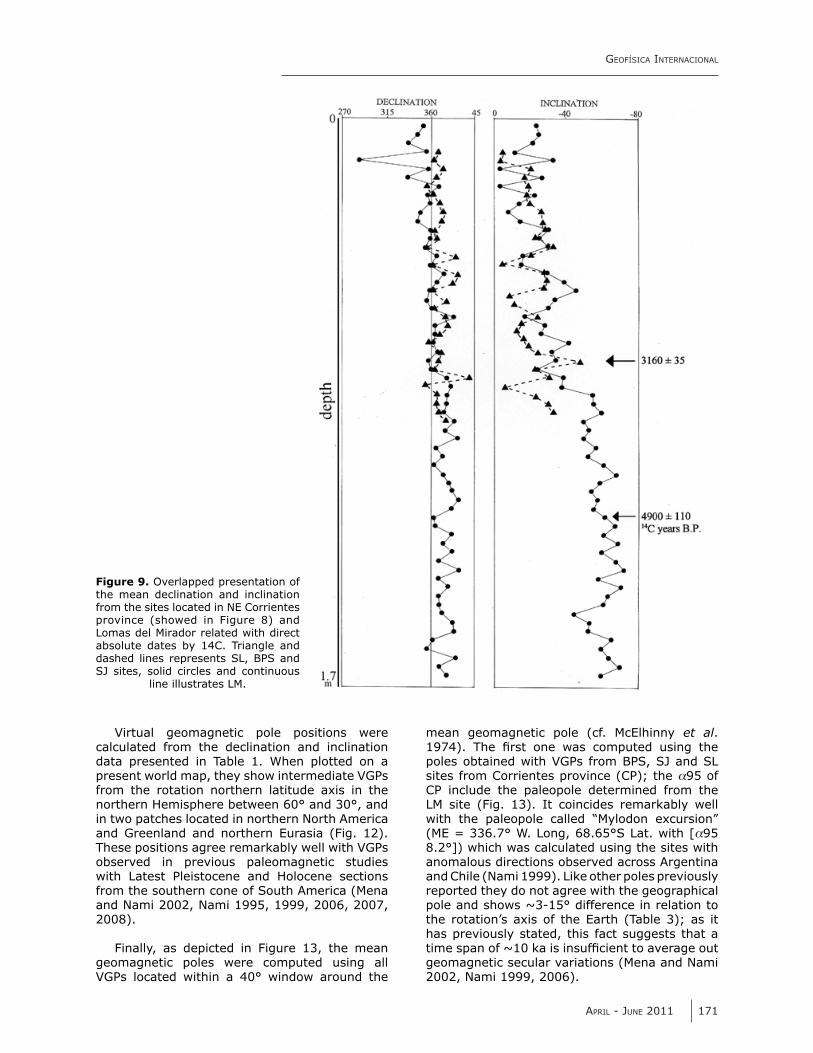
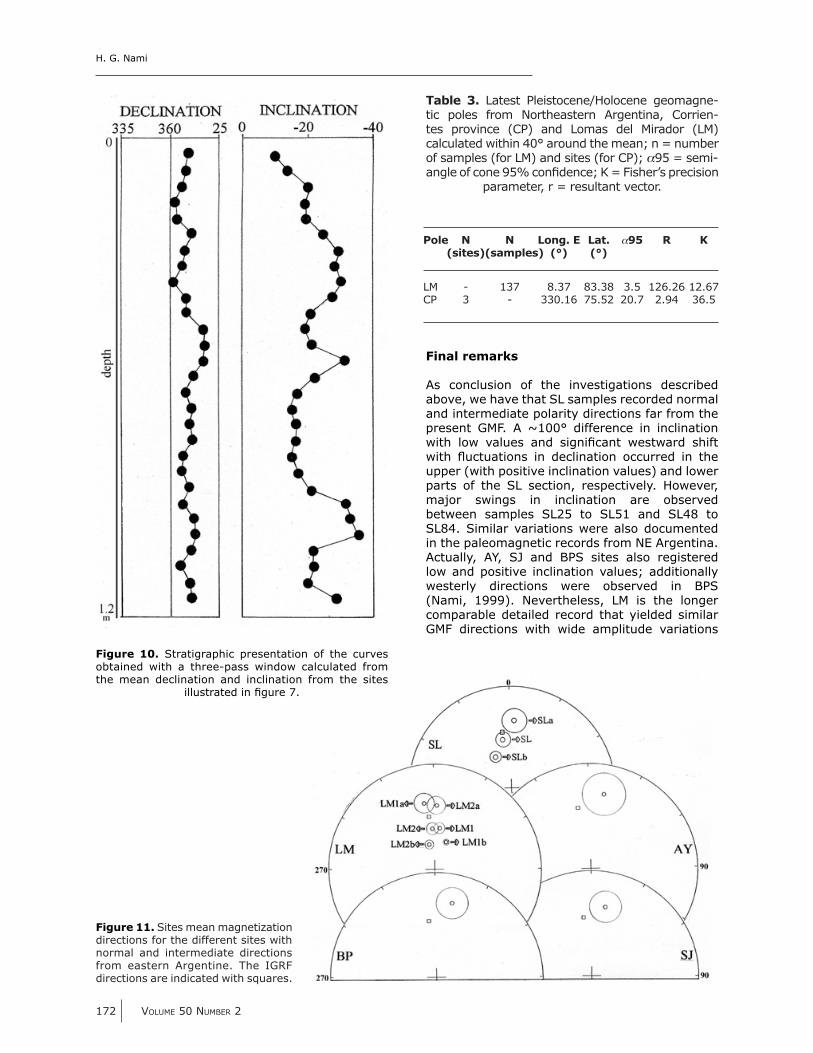
upper and middle part of SL. Hence, it is possible to suggest that BPS might temporally range bet)&&"#DJ>AE=>J#'S/#/"+#QZ#!7#D[J>=#'/#25!,>#K6>#Furthermore, a smooth curve was constructed with the mean declination and inclination from correlative samples of SL, BPS and SJ sites (Fig. 8). Samples with difference in directions of 45° were not considered in this analysis. The resulting curve was compared with the Lomas del Mirador (LM) log, the nearest place located in eastern Argentina (NE Buenos Aires province) at 803 km southeast of SL. It has an AMS date of 4900 ± 110 yr B.P. (OS–24330). The PSV of LM also recorded low inclination values and easterly directions (Nami 2006). This comparison showed a notably agreement with the upper part of LM curve (Fig. 9). Despite the lost of resolution, the data employed to construct the curve showed in 5!,@8&#I#)/7#1*$&8&+#$(#&*!.!"/$&#$%&#"(!7&\#$%&"M#/#$%8&&E9(!"$#)!"+()#)/7#@7&+#$(#+&1"&#$%&#%!,%#frequencies directional changes of the GMF. The results are shown in a log according to depth (Fig. 10). After checking that the directional data from
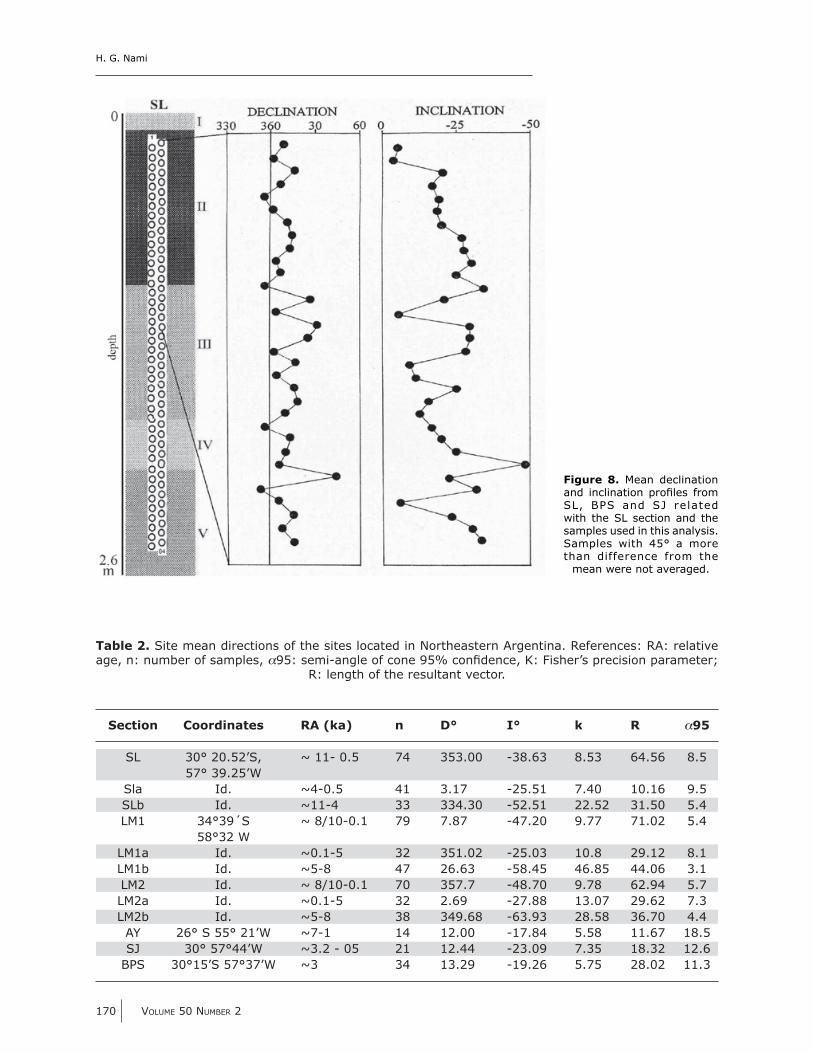
SL was useful to assess a Fisherian distribution, the site mean direction was computed by Fisher (1953) statistic (Fig. 11). Additionally, a mean direction was calculated using the data from the upper (samples SL1 to SL48 from levels II and III) and the lower part of the section (samples SL 49 to SL 84 from levels III to V), respectively named SLa and SLb (Table 2, Fig. 11). SL mean direction agrees with the IGRF direction (D = 351.5°, I = 32.0°) for 1997, year when the 7/.9*!",#)/7#9&8-(8.&+>#F()&B&8M#/#7!,"!10/"$#difference is observed with Sla and SLb (Fig 11a). Furthermore, these results were compared with the mean directions calculated for all the previously reported sites located in eastern Argentina (Nami, 1999, 2006). The data belongs from SJ and BPS (Corrientes province), Arroyo Yarará (AY, Misiones province) and LM. As illustrated in Figure 11, BPS, SJ and AY sites shows a similar site mean direction with Sla, and some similarities with the upper part of LM, named LM1a (Table 2).
Figure 7. Overlapped stratigraphic presentation of SL, BPS and SJ declination and !"0*!"/$!("#98(1*&7#8&*/$&+#)!$%#the direct absolute date by 14C obtained at BPS; solid circles and continuous line is SL, open circles and dashed lines illustrates BPS, squares and pointed line represents SJ.
H. G. Nami
170 VOLUME 50 NUMBER 2
Figure 8. Mean declination /"+# !"0*!"/$!("#98(1*&7# -8(.#SL, BPS and SJ related with the SL section and the samples used in this analysis. Samples with 45° a more than difference from the mean were not averaged.
Table 2. Site mean directions of the sites located in Northeastern Argentina. References: RA: relative age, n: number of samples, !;<]#7&.!E/",*&#(-#0("&#;<T#0("1+&"0&M#^]#5!7%&8_7#98&0!7!("#9/8/.&$&8\#
R: length of the resultant vector.
Section Coordinates RA (ka) n D° I° k R !95
SL 30° 20.52’S, ~ 11 0.5 74 353.00 38.63 8.53 64.56 8.5 57° 39.25’W Sla Id. ~40.5 41 3.17 25.51 7.40 10.16 9.5 SLb Id. ~114 33 334.30 52.51 22.52 31.50 5.4 LM1 34°39´S ~ 8/100.1 79 7.87 47.20 9.77 71.02 5.4 58°32 W LM1a Id. ~0.15 32 351.02 25.03 10.8 29.12 8.1 LM1b Id. ~58 47 26.63 58.45 46.85 44.06 3.1 LM2 Id. ~ 8/100.1 70 357.7 48.70 9.78 62.94 5.7 LM2a Id. ~0.15 32 2.69 27.88 13.07 29.62 7.3 LM2b Id. ~58 38 349.68 63.93 28.58 36.70 4.4 AY 26° S 55° 21’W ~71 14 12.00 17.84 5.58 11.67 18.5 SJ 30° 57°44’W ~3.2 05 21 12.44 23.09 7.35 18.32 12.6 BPS 30°15’S 57°37’W ~3 34 13.29 19.26 5.75 28.02 11.3
GEOFÍSICA INTERNACIONAL
APRIL JUNE 2011 171
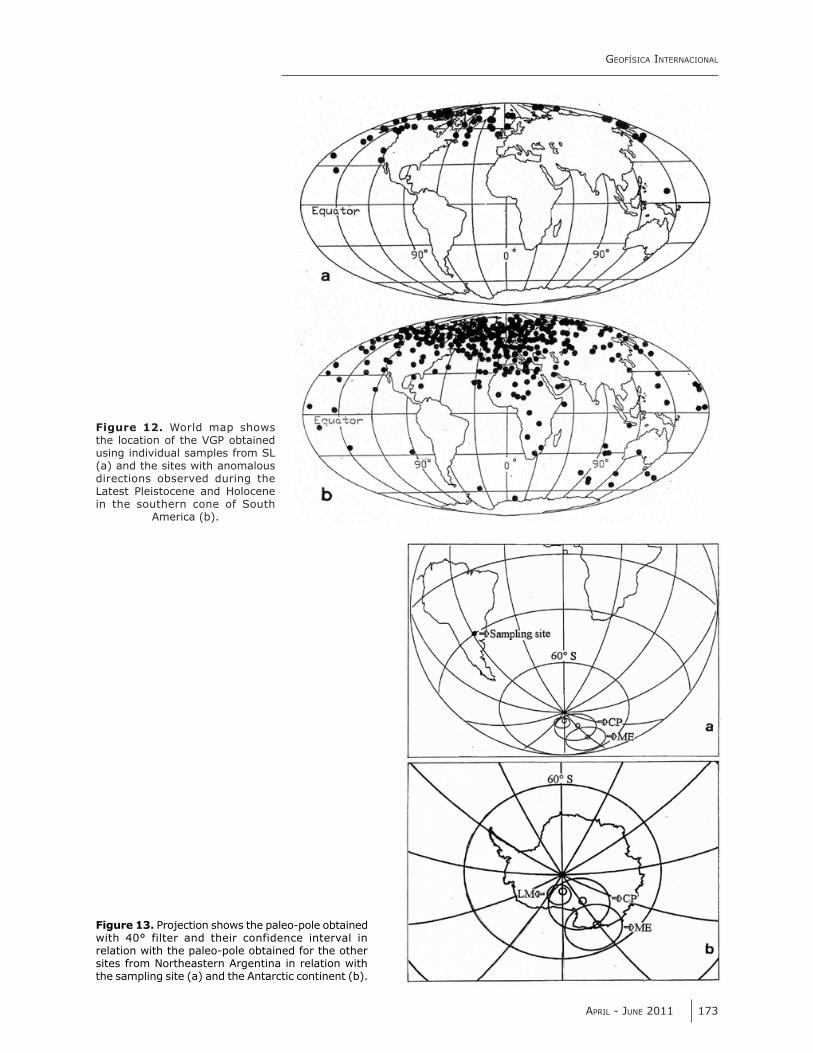
Virtual geomagnetic pole positions were calculated from the declination and inclination data presented in Table 1. When plotted on a present world map, they show intermediate VGPs from the rotation northern latitude axis in the northern Hemisphere between 60° and 30°, and in two patches located in northern North America and Greenland and northern Eurasia (Fig. 12). These positions agree remarkably well with VGPs observed in previous paleomagnetic studies with Latest Pleistocene and Holocene sections from the southern cone of South America (Mena and Nami 2002, Nami 1995, 1999, 2006, 2007, 2008).
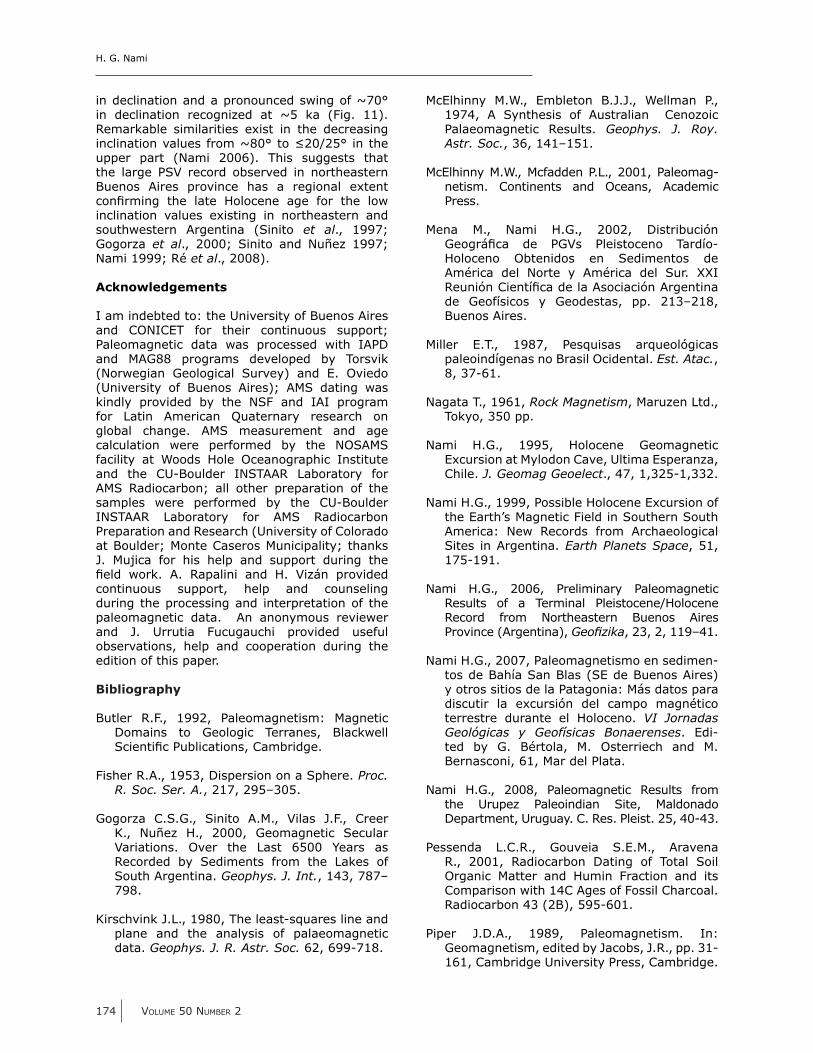
Finally, as depicted in Figure 13, the mean geomagnetic poles were computed using all VGPs located within a 40° window around the
mean geomagnetic pole (cf. McElhinny et al. :;KL6># ?%&# 187$# ("&# )/7# 0(.9@$&+# @7!",# $%&#poles obtained with VGPs from BPS, SJ and SL sites from Corrientes province (CP); the !95 of CP include the paleopole determined from the LM site (Fig. 13). It coincides remarkably well with the paleopole called “Mylodon excursion” (ME = 336.7° W. Long, 68.65°S Lat. with [!95 8.2°]) which was calculated using the sites with anomalous directions observed across Argentina and Chile (Nami 1999). Like other poles previously reported they do not agree with the geographical pole and shows ~315° difference in relation to the rotation’s axis of the Earth (Table 3); as it has previously stated, this fact suggests that a $!.O/"#(-#D:=#'/#!7#!"7@-10!&"$#$(#/B&8/,&#(@$#geomagnetic secular variations (Mena and Nami 2002, Nami 1999, 2006).
Figure 9. Overlapped presentation of the mean declination and inclination from the sites located in NE Corrientes province (showed in Figure 8) and Lomas del Mirador related with direct absolute dates by 14C. Triangle and dashed lines represents SL, BPS and SJ sites, solid circles and continuous
line illustrates LM.
H. G. Nami
172 VOLUME 50 NUMBER 2
Final remarks
As conclusion of the investigations described above, we have that SL samples recorded normal and intermediate polarity directions far from the present GMF. A ~100° difference in inclination )!$%# *()# B/*@&7# /"+# 7!,"!10/"$# )&7$)/8+# 7%!-$#)!$%# W@0$@/$!("7# !"# +&0*!"/$!("# (00@88&+# !"# $%&#upper (with positive inclination values) and lower parts of the SL section, respectively. However, major swings in inclination are observed between samples SL25 to SL51 and SL48 to SL84. Similar variations were also documented in the paleomagnetic records from NE Argentina. Actually, AY, SJ and BPS sites also registered low and positive inclination values; additionally westerly directions were observed in BPS (Nami, 1999). Nevertheless, LM is the longer comparable detailed record that yielded similar GMF directions with wide amplitude variations
Figure 10. Stratigraphic presentation of the curves obtained with a threepass window calculated from the mean declination and inclination from the sites
!**@7$8/$&+#!"#1,@8&#K>
Figure 11. Sites mean magnetization directions for the different sites with normal and intermediate directions from eastern Argentine. The IGRF directions are indicated with squares.
Table 3. Latest Pleistocene/Holocene geomagnetic poles from Northeastern Argentina, Corrientes province (CP) and Lomas del Mirador (LM) calculated within 40° around the mean; n = number of samples (for LM) and sites (for CP); !95 = semi/",*&#(-#0("&#;<T#0("1+&"0&\# # #5!7%&8_7#98&0!7!("#
parameter, r = resultant vector.
Pole N N Long. E Lat. !95 R K (sites) (samples) (°) (°)
LM 137 8.37 83.38 3.5 126.26 12.67CP 3 330.16 75.52 20.7 2.94 36.5
GEOFÍSICA INTERNACIONAL
APRIL JUNE 2011 173
Figure 12. World map shows the location of the VGP obtained using individual samples from SL (a) and the sites with anomalous directions observed during the Latest Pleistocene and Holocene in the southern cone of South
America (b).
Figure 13. Projection shows the paleopole obtained with 40° filter and their confidence interval in relation with the paleopole obtained for the other sites from Northeastern Argentina in relation with the sampling site (a) and the Antarctic continent (b).
H. G. Nami
174 VOLUME 50 NUMBER 2
in declination and a pronounced swing of ~70° in declination recognized at ~5 ka (Fig. 11). Remarkable similarities exist in the decreasing !"0*!"/$!("#B/*@&7#-8(.#DI=a#$(#[A=bA<a#!"#$%&#upper part (Nami 2006). This suggests that the large PSV record observed in northeastern Buenos Aires province has a regional extent 0("18.!",# $%&# */$&# F(*(0&"&# /,&# -(8# $%&# *()#inclination values existing in northeastern and southwestern Argentina (Sinito et al., 1997; Gogorza et al., 2000; Sinito and Nuñez 1997; Nami 1999; Ré et al., 2008).
Acknowledgements
I am indebted to: the University of Buenos Aires and CONICET for their continuous support; Paleomagnetic data was processed with IAPD and MAG88 programs developed by Torsvik (Norwegian Geological Survey) and E. Oviedo (University of Buenos Aires); AMS dating was kindly provided by the NSF and IAI program for Latin American Quaternary research on global change. AMS measurement and age calculation were performed by the NOSAMS facility at Woods Hole Oceanographic Institute and the CUBoulder INSTAAR Laboratory for AMS Radiocarbon; all other preparation of the samples were performed by the CUBoulder INSTAAR Laboratory for AMS Radiocarbon Preparation and Research (University of Colorado at Boulder; Monte Caseros Municipality; thanks J. Mujica for his help and support during the 1&*+# )(8'># G># V/9/*!"!# /"+# F># Y!Hc"# 98(B!+&+#continuous support, help and counseling during the processing and interpretation of the paleomagnetic data. An anonymous reviewer and J. Urrutia Fucugauchi provided useful observations, help and cooperation during the edition of this paper.
Bibliography
Butler R.F., 1992, Paleomagnetism: Magnetic Domains to Geologic Terranes, Blackwell Q0!&"$!10#X@C*!0/$!("7M#d/.C8!+,&>
Fisher R.A., 1953, Dispersion on a Sphere. Proc. R. Soc. Ser. A., 217, 295–305.
Gogorza C.S.G., Sinito A.M., Vilas J.F., Creer K., Nuñez H., 2000, Geomagnetic Secular Variations. Over the Last 6500 Years as Recorded by Sediments from the Lakes of South Argentina. Geophys. J. Int., 143, 787–798.
Kirschvink J.L., 1980, The leastsquares line and plane and the analysis of palaeomagnetic data. Geophys. J. R. Astr. Soc. 62, 699718.
McElhinny M.W., Embleton B.J.J., Wellman P., 1974, A Synthesis of Australian Cenozoic Palaeomagnetic Results. Geophys. J. Roy. Astr. Soc., 36, 141–151.
McElhinny M.W., Mcfadden P.L., 2001, Paleomagnetism. Continents and Oceans, Academic Press.
Mena M., Nami H.G., 2002, Distribución 3&(,8c10/# +&# X3Y7# X*&!7$(0&"(# ?/8+e(EHoloceno Obtenidos en Sedimentos de América del Norte y América del Sur. XXI V&@"!f"#d!&"$e10/#+&#*/#G7(0!/0!f"#G8,&"$!"/#de Geofísicos y Geodestas, pp. 213–218, Buenos Aires.
Miller E.T., 1987, Pesquisas arqueológicas paleoindígenas no Brasil Ocidental. Est. Atac., 8, 3761.
Nagata T., 1961, Rock Magnetism, Maruzen Ltd., Tokyo, 350 pp.
Nami H.G., 1995, Holocene Geomagnetic Excursion at Mylodon Cave, Ultima Esperanza, Chile. J. Geomag Geoelect., 47, 1,3251,332.
Nami H.G., 1999, Possible Holocene Excursion of the Earth’s Magnetic Field in Southern South America: New Records from Archaeological Sites in Argentina. Earth Planets Space, 51, 175191.
Nami H.G., 2006, Preliminary Paleomagnetic Results of a Terminal Pleistocene/Holocene Record from Northeastern Buenos Aires Province (Argentina), !"#$%&'(, 23, 2, 119–41.
Nami H.G., 2007, Paleomagnetismo en sedimentos de Bahía San Blas (SE de Buenos Aires) y otros sitios de la Patagonia: Más datos para discutir la excursión del campo magnético terrestre durante el Holoceno. VI Jornadas Geológicas y Geofísicas Bonaerenses. Edited by G. Bértola, M. Osterriech and M. Bernasconi, 61, Mar del Plata.
Nami H.G., 2008, Paleomagnetic Results from the Urupez Paleoindian Site, Maldonado Department, Uruguay. C. Res. Pleist. 25, 4043.
Pessenda L.C.R., Gouveia S.E.M., Aravena R., 2001, Radiocarbon Dating of Total Soil Organic Matter and Humin Fraction and its Comparison with 14C Ages of Fossil Charcoal. Radiocarbon 43 (2B), 595601.
Piper J.D.A., 1989, Paleomagnetism. In: Geomagnetism, edited by Jacobs, J.R., pp. 31161, Cambridge University Press, Cambridge.
GEOFÍSICA INTERNACIONAL
APRIL JUNE 2011 175
Ré G.H., Mena M., Vilas J.F., 2008, Late Cenozoic Paleomagnetic Studies in Patagonia. The Late Cenozoic of Patagonia and Tierra Del Fuego, pp. 121150, ed. J.Rabassa, Elsevier.
Scharpenseel H.W., 1971, Radiocarbon Dating of SoilsProblems, Troubles, Hopes. Paleopedology. Origin, Nature and Dating,
edited by D. H. Yaalon, pp. 7788, International Society of Soil Scientists and Israel University Press, Jerusalem.
Schmitz P.I., 1987, Prehistoric Hunter and Gatherers of Brazil, J. W. Prehistory, 1, 53–126.
Serrano A., 1932, Exploraciones arqueológicas en el río Uruguay Medio, Paraná.
Serrano A., 1950, Los primitivos habitantes de Entre Ríos, Biblioteca entrerriana Gral. Perón, Ministerio de Educación, Paraná.
Sinito A.M., Nami H.G., Gogorza C., 1997, Analysis of palaeomagnetic results from Holocene sediments sampled at archaeological excavations in South America, Quat. South Am. Antarc. Penninsula, 10, 31–44.
Sinito A.M., Nuñez H.J., 1997, Paleosecular Variations Recorded on Lake Sediments from South America. J. Geomagn. Geoelectr., 49, 473–483.
Smorczewski M., 1994, Protocolo de Análisis FísicoQuímico, Laboratorio de Análisis de Suelo (INTA), MS.
Stacey F.D., Banerjee S.K., 1974, The Physical Principles of Rock Magnetism, Elsevier, Amsterdan, 195 pp.
Stein J.K., 1992, Organic Matter in Archaeological Contexts. Soils in Archaeology (Holliday, V. T., editor), pp. 193216, Smithsonian Institution Press, Washington D.C.
?%(.97("##V>M#N*+1&*+#5>M#:;IOM#Environmental Magnetism, Allen and Unwin, London, 227 pp.
Tarling D., 1983, Paleomagnetism, Chapman and Hall, New York 379 pp.
Zijderveld J.D.A., 1967, AC demagnetization of rocks: Analysis of results. Methods in Paleomagnetism, pp.254286, ed. Collinson, D. W., Creer, K. M. & Runcorn, S.K., Elsevier.