Fremont Industrial Presentation 3-25-2016
15
CLICK TO EDIT MASTER TITLE STYLE FREMONT INDUSTRIAL MARKET Is this the one good year in a decade?
-
Upload
steve-kapp-sior -
Category
Documents
-
view
63 -
download
0
Transcript of Fremont Industrial Presentation 3-25-2016

CLICK TO EDIT MASTER TITLE STYLE
FREMONT INDUSTRIAL MARKET
Is this the one good year in a decade?
2
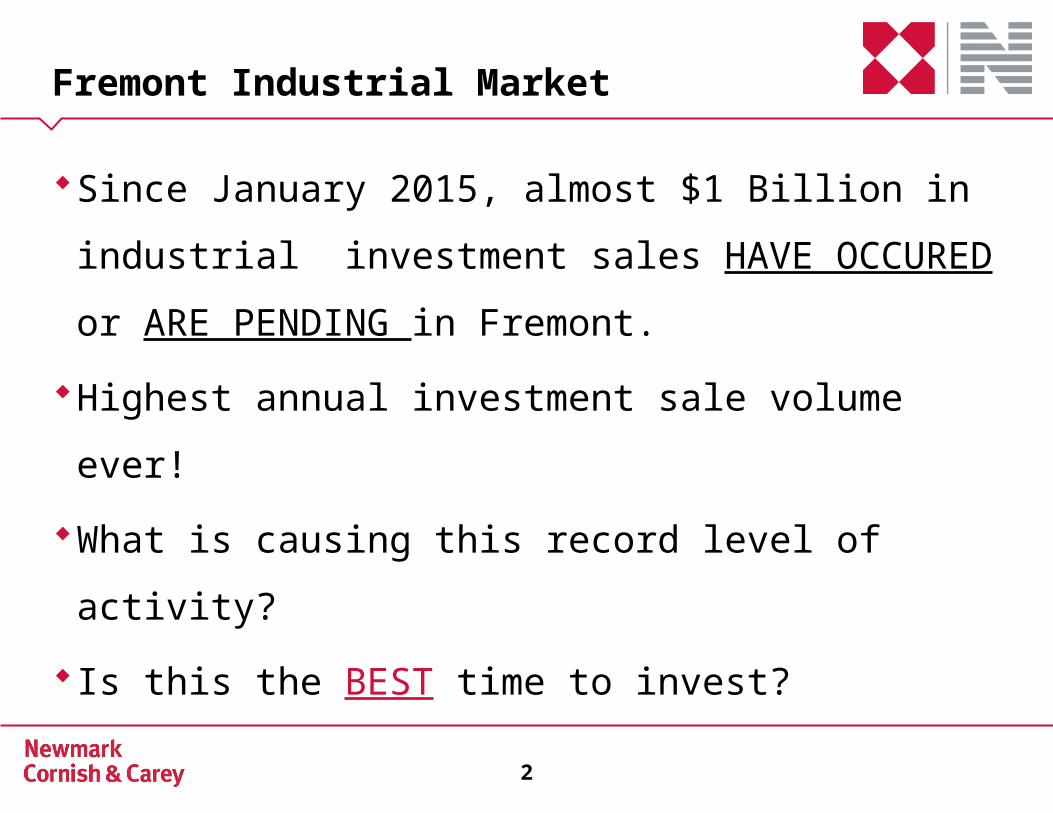
Fremont Industrial Market
Since January 2015, almost $1 Billion in industrial
investment sales HAVE OCCURED or ARE PENDING in
Fremont.
Highest annual investment sale volume ever!
What is causing this record level of activity?
Is this the BEST time to invest?

3
Demand Factors
One single dominant sector: TECHOr is it?
Autonomous Cars – Tesla, Google, Apple
Robotics- Neato, Fanuc, Chipscale, Infineum
Advanced Manufacturing- Smart Modular, Unigen, Morpho, Lam Research
Memory/Storage- Flash, Corsair, Kyocera, Hayward Quartz, Seagate
Virtual Reality/Augmented Reality- Sportvision, Samsung, Sigma Designs
E-commerce- Amazon, Alibaba
Artificial Intelligence- Google, Sentient
Sensors- Tyco, Imergy
Nanotechnology- Intematix, Neophotonics, Thermo Fisher
Energy- Solar City, Imergy, Glasspointe
4
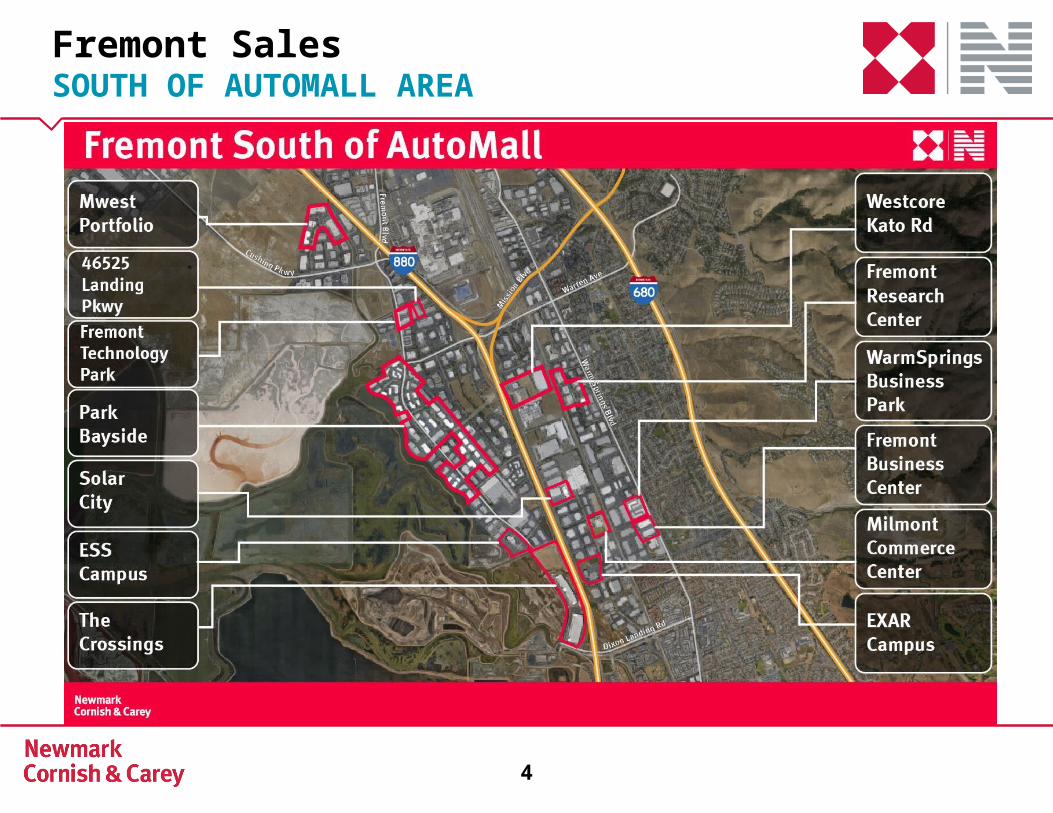
Fremont SalesSOUTH OF AUTOMALL AREA
5
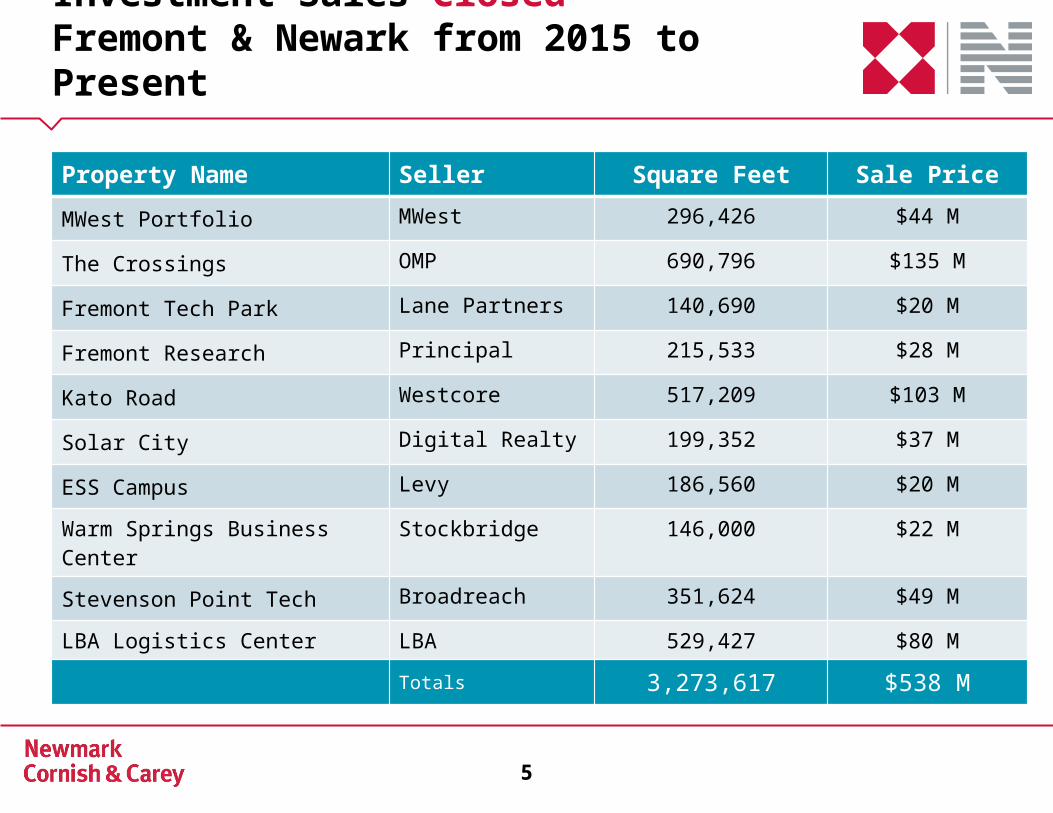
Investment Sales ClosedFremont & Newark from 2015 to Present
Property Name Seller Square Feet Sale PriceMWest Portfolio MWest 296,426 $44 M
The Crossings OMP 690,796 $135 M
Fremont Tech Park Lane Partners 140,690 $20 M
Fremont Research Principal 215,533 $28 M
Kato Road Westcore 517,209 $103 M
Solar City Digital Realty 199,352 $37 M
ESS Campus Levy 186,560 $20 M
Warm Springs Business Center Stockbridge 146,000 $22 M
Stevenson Point Tech Broadreach 351,624 $49 M
LBA Logistics Center LBA 529,427 $80 M
Totals 3,273,617 $538 M
6
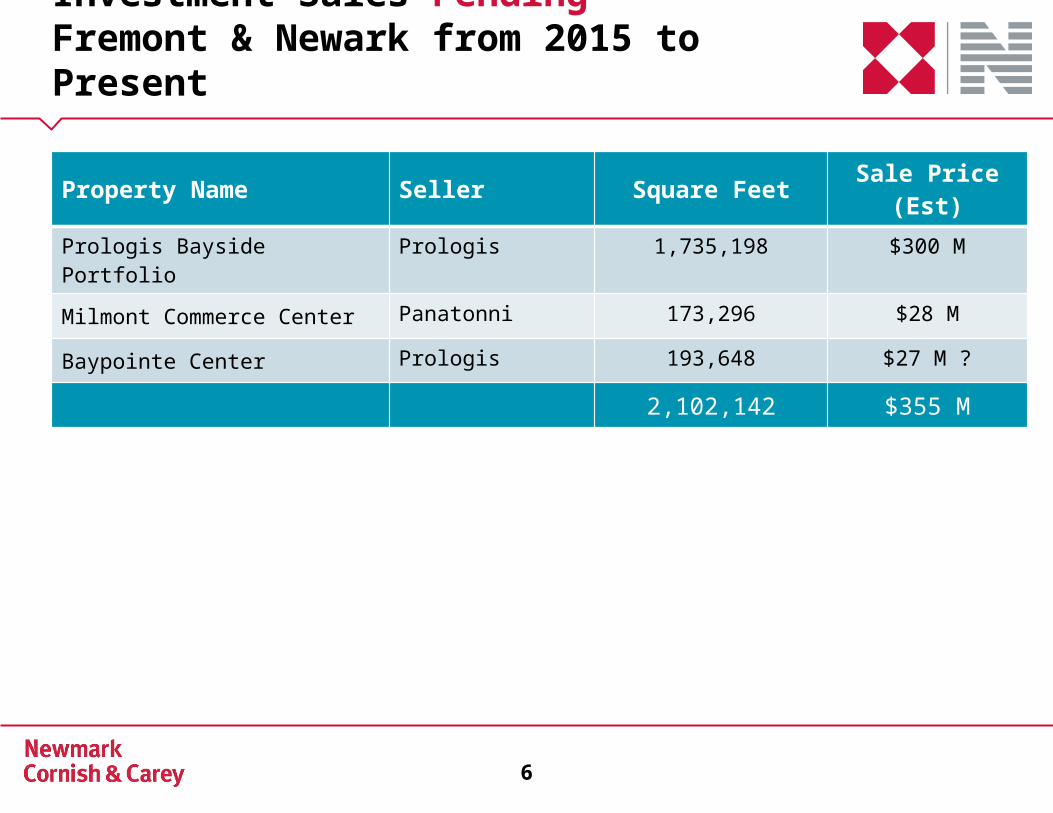
Investment Sales PendingFremont & Newark from 2015 to Present
Property Name Seller Square Feet Sale Price (Est)
Prologis Bayside Portfolio Prologis 1,735,198 $300 M
Milmont Commerce Center Panatonni 173,296 $28 M
Baypointe Center Prologis 193,648 $27 M ?
2,102,142 $355 M
7
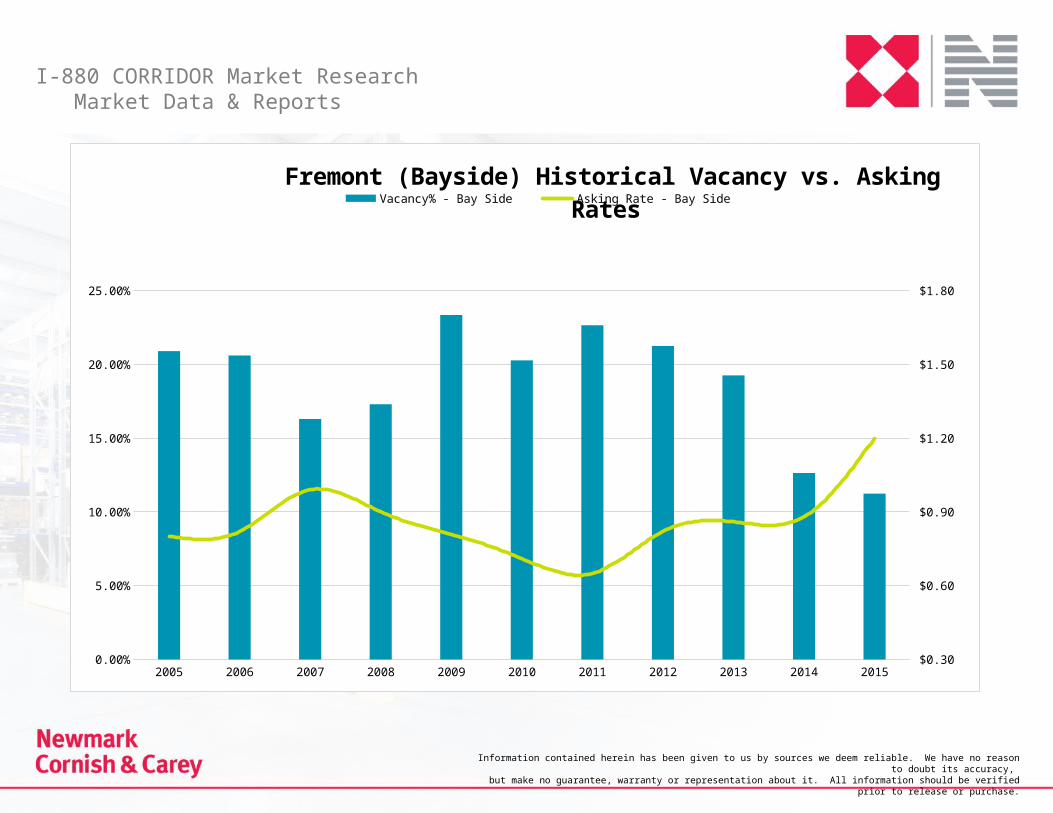
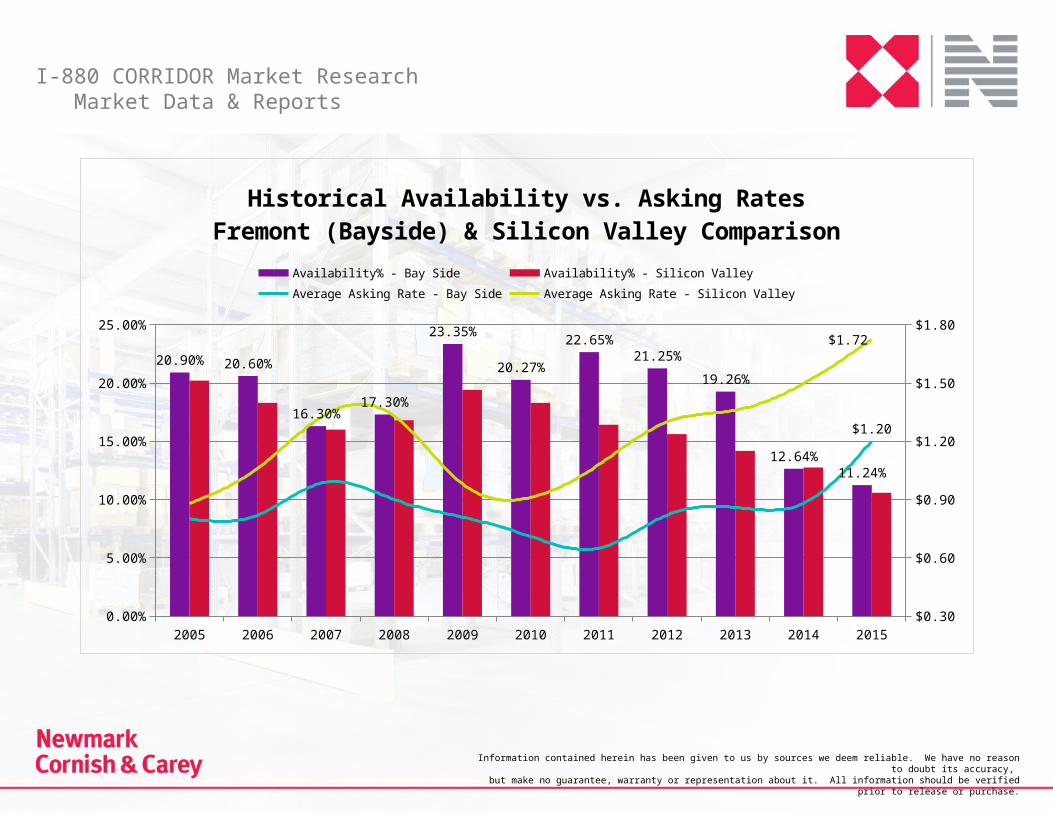
I-880 CORRIDOR Market Research Market Data & Reports
Information contained herein has been given to us by sources we deem reliable. We have no reason to doubt its accuracy, but make no guarantee, warranty or representation about it. All information should be verified prior to release or purchase.
2005 2006 2007 2008 2009 2010 2011 2012 2013 2014 20150.00%
5.00%
10.00%
15.00%
20.00%
25.00%
$0.30
$0.60
$0.90
$1.20
$1.50
$1.80
Fremont (Bayside) Historical Vacancy vs. Asking Rates Vacancy% - Bay Side Asking Rate - Bay Side
8
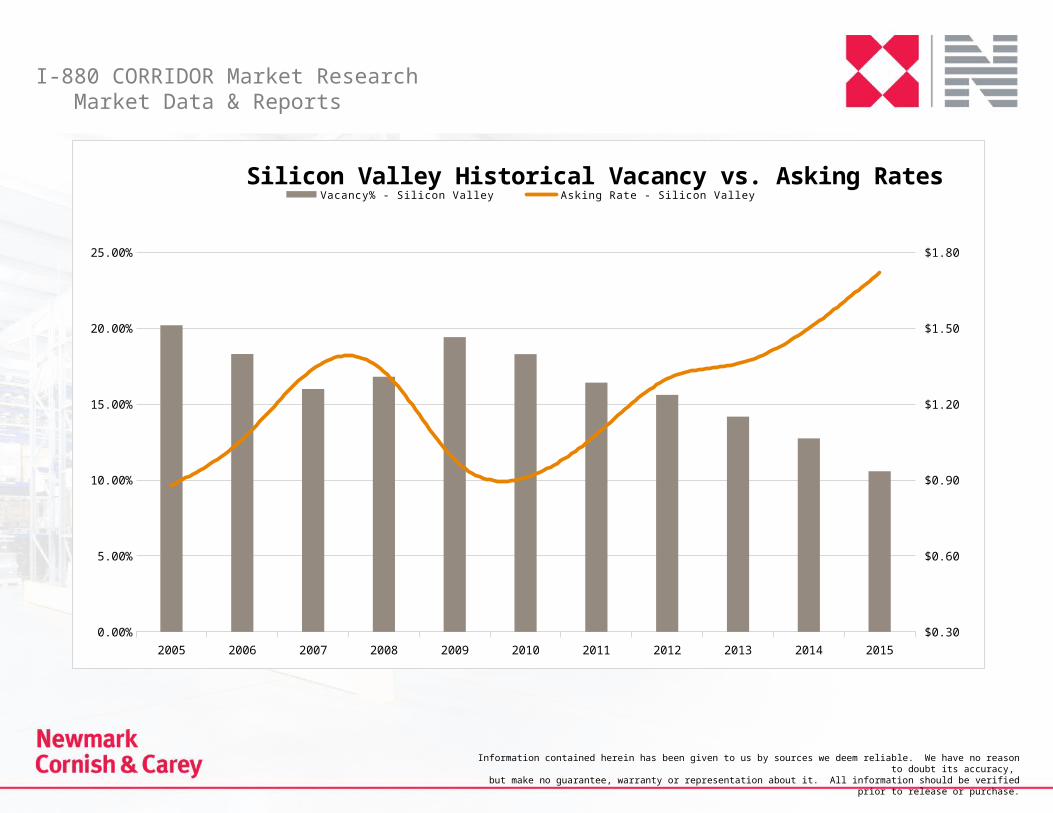
I-880 CORRIDOR Market Research Market Data & Reports
Information contained herein has been given to us by sources we deem reliable. We have no reason to doubt its accuracy, but make no guarantee, warranty or representation about it. All information should be verified prior to release or purchase.
2005 2006 2007 2008 2009 2010 2011 2012 2013 2014 20150.00%
5.00%
10.00%
15.00%
20.00%
25.00%
$0.30
$0.60
$0.90
$1.20
$1.50
$1.80
Silicon Valley Historical Vacancy vs. Asking Rates Vacancy% - Silicon Valley Asking Rate - Silicon Valley
9
I-880 CORRIDOR Market Research Market Data & Reports
Information contained herein has been given to us by sources we deem reliable. We have no reason to doubt its accuracy, but make no guarantee, warranty or representation about it. All information should be verified prior to release or purchase.
2005 2006 2007 2008 2009 2010 2011 2012 2013 2014 20150.00%
5.00%
10.00%
15.00%
20.00%
25.00%
$0.30
$0.60
$0.90
$1.20
$1.50
$1.80
20.90% 20.60%
16.30%17.30%
23.35%
20.27%
22.65%21.25%
19.26%
12.64%11.24%
$1.20
$1.72
Historical Availability vs. Asking RatesFremont (Bayside) & Silicon Valley Comparison
Availability% - Bay Side Availability% - Silicon ValleyAverage Asking Rate - Bay Side Average Asking Rate - Silicon Valley
10
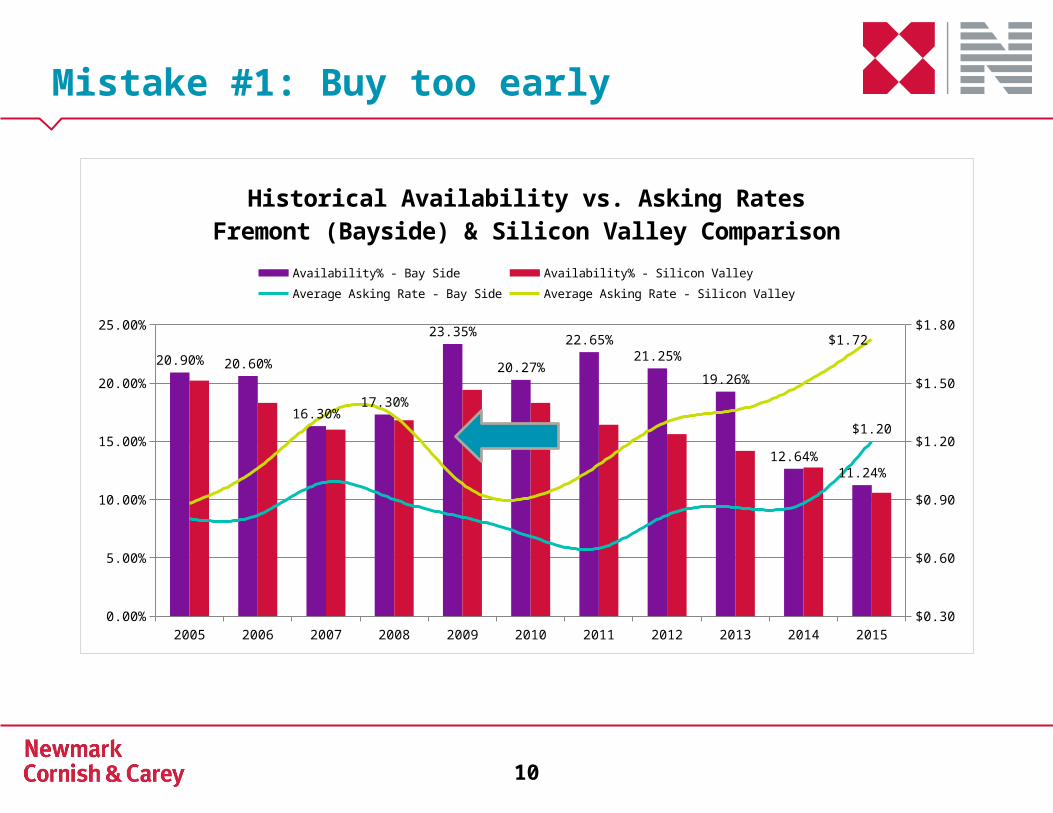
2005 2006 2007 2008 2009 2010 2011 2012 2013 2014 20150.00%
5.00%
10.00%
15.00%
20.00%
25.00%
$0.30
$0.60
$0.90
$1.20
$1.50
$1.80
20.90% 20.60%
16.30%17.30%
23.35%
20.27%
22.65%21.25%
19.26%
12.64%11.24%
$1.20
$1.72
Historical Availability vs. Asking RatesFremont (Bayside) & Silicon Valley Comparison
Availability% - Bay Side Availability% - Silicon ValleyAverage Asking Rate - Bay Side Average Asking Rate - Silicon Valley
Mistake #1: Buy too early
11
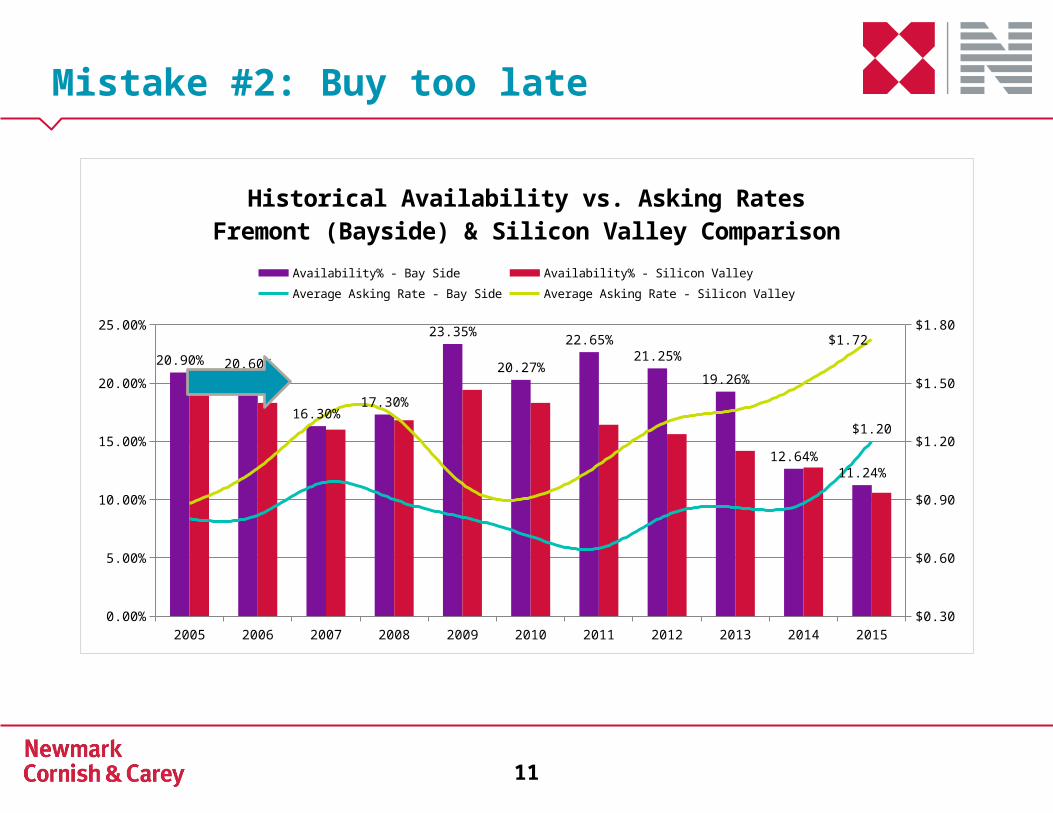
2005 2006 2007 2008 2009 2010 2011 2012 2013 2014 20150.00%
5.00%
10.00%
15.00%
20.00%
25.00%
$0.30
$0.60
$0.90
$1.20
$1.50
$1.80
20.90% 20.60%
16.30%17.30%
23.35%
20.27%
22.65%21.25%
19.26%
12.64%11.24%
$1.20
$1.72
Historical Availability vs. Asking RatesFremont (Bayside) & Silicon Valley Comparison
Availability% - Bay Side Availability% - Silicon ValleyAverage Asking Rate - Bay Side Average Asking Rate - Silicon Valley
Mistake #2: Buy too late

12
2005 2006 2007 2008 2009 2010 2011 2012 2013 2014 20150.00%
5.00%
10.00%
15.00%
20.00%
25.00%
$0.30
$0.60
$0.90
$1.20
$1.50
$1.80
20.90% 20.60%
16.30%17.30%
23.35%
20.27%
22.65%21.25%
19.26%
12.64%11.24%
$1.20
$1.72
Historical Availability vs. Asking RatesFremont (Bayside) & Silicon Valley Comparison
Availability% - Bay Side Availability% - Silicon ValleyAverage Asking Rate - Bay Side Average Asking Rate - Silicon Valley
Mistake #3: Sell too early
13
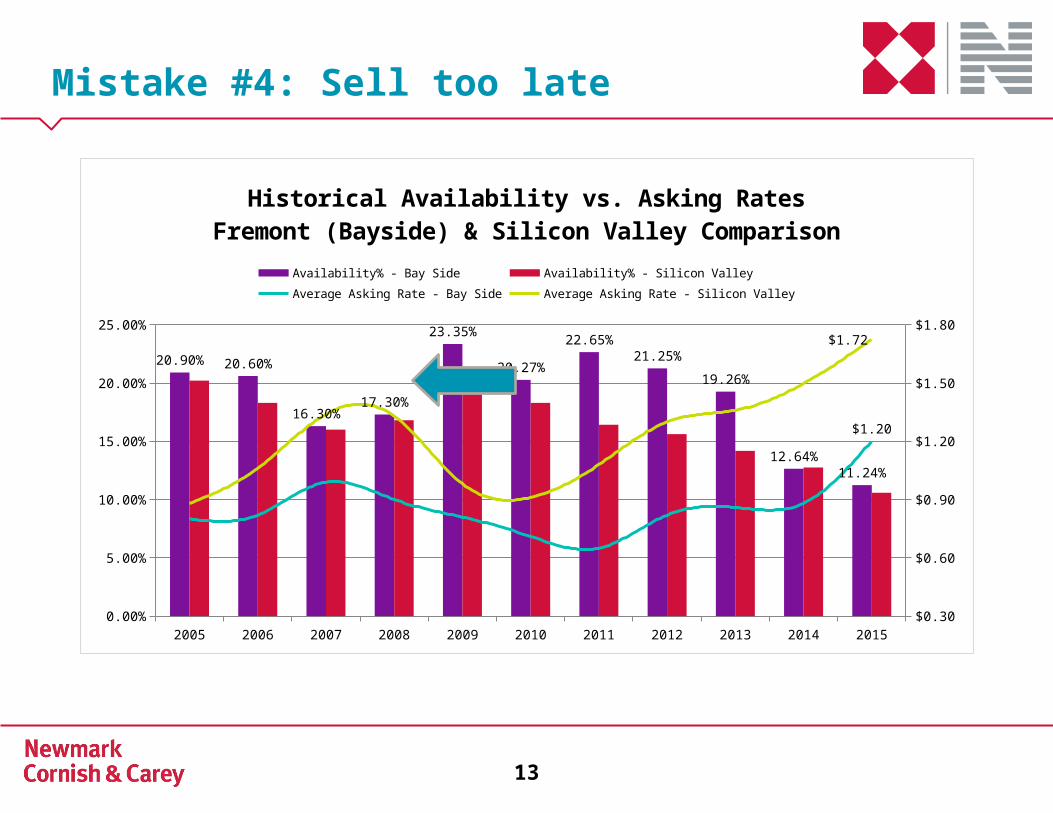
2005 2006 2007 2008 2009 2010 2011 2012 2013 2014 20150.00%
5.00%
10.00%
15.00%
20.00%
25.00%
$0.30
$0.60
$0.90
$1.20
$1.50
$1.80
20.90% 20.60%
16.30%17.30%
23.35%
20.27%
22.65%21.25%
19.26%
12.64%11.24%
$1.20
$1.72
Historical Availability vs. Asking RatesFremont (Bayside) & Silicon Valley Comparison
Availability% - Bay Side Availability% - Silicon ValleyAverage Asking Rate - Bay Side Average Asking Rate - Silicon Valley
Mistake #4: Sell too late
14
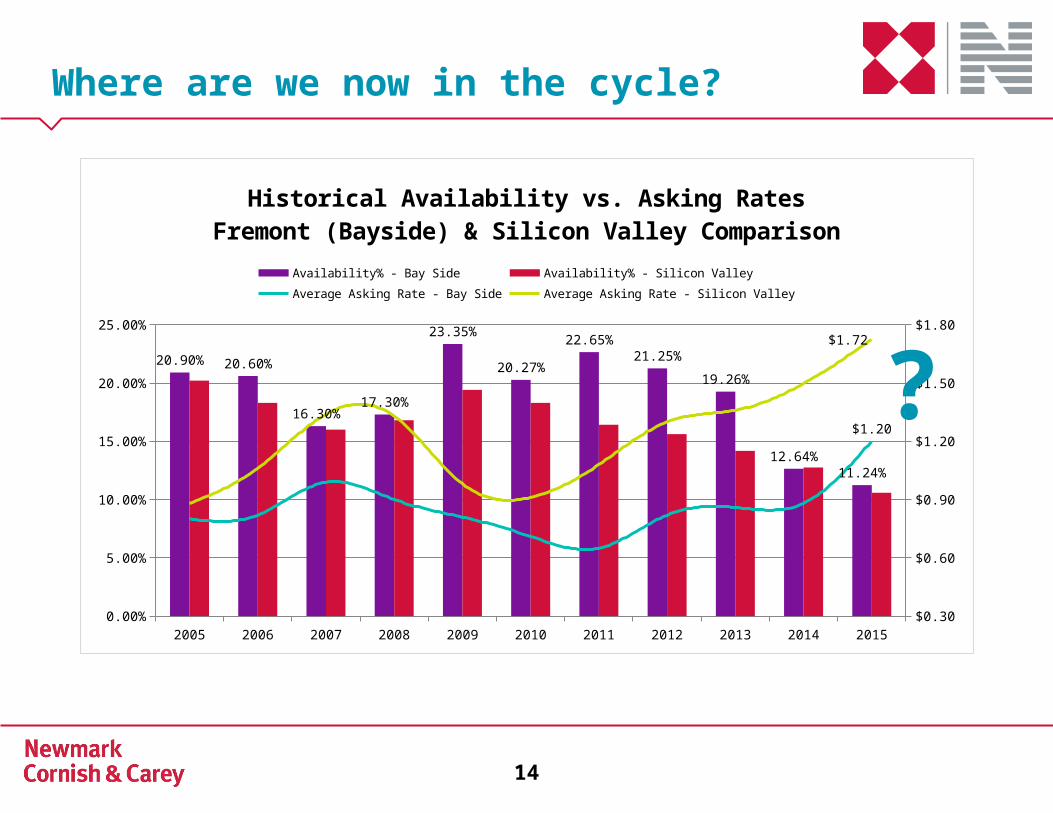
2005 2006 2007 2008 2009 2010 2011 2012 2013 2014 20150.00%
5.00%
10.00%
15.00%
20.00%
25.00%
$0.30
$0.60
$0.90
$1.20
$1.50
$1.80
20.90% 20.60%
16.30%17.30%
23.35%
20.27%
22.65%21.25%
19.26%
12.64%11.24%
$1.20
$1.72
Historical Availability vs. Asking RatesFremont (Bayside) & Silicon Valley Comparison
Availability% - Bay Side Availability% - Silicon ValleyAverage Asking Rate - Bay Side Average Asking Rate - Silicon Valley
Where are we now in the cycle?
?

Steve Kapp, SIORExecutive Managing [email protected]
Fremont Industrial Market:
Is this the one good year in a decade?
Thanks for Attending!