Fire behaviour of concrete made with recycled rubber ... · Fire behaviour of concrete made with...
15
Fire behaviour of concrete made with recycled rubber aggregates Extended Abstract André Filipe de Melo Marques Supervisor: Prof. Doutor João Pedro Ramôa Ribeiro Correia (IST) Co-supervisor: Prof. Doutor Jorge Manuel Caliço Lopes de Brito (IST) Lisbon, October 2010
Transcript of Fire behaviour of concrete made with recycled rubber ... · Fire behaviour of concrete made with...
Fire behaviour of concrete made with recycled rubber aggregates
Extended Abstract
André Filipe de Melo Marques
Supervisor: Prof. Doutor João Pedro Ramôa Ribeiro Correia (IST)
Co-supervisor: Prof. Doutor Jorge Manuel Caliço Lopes de Brito (IST)
Lisbon, October 2010
Fire behaviour of concrete made with recycled rubber aggregates
1
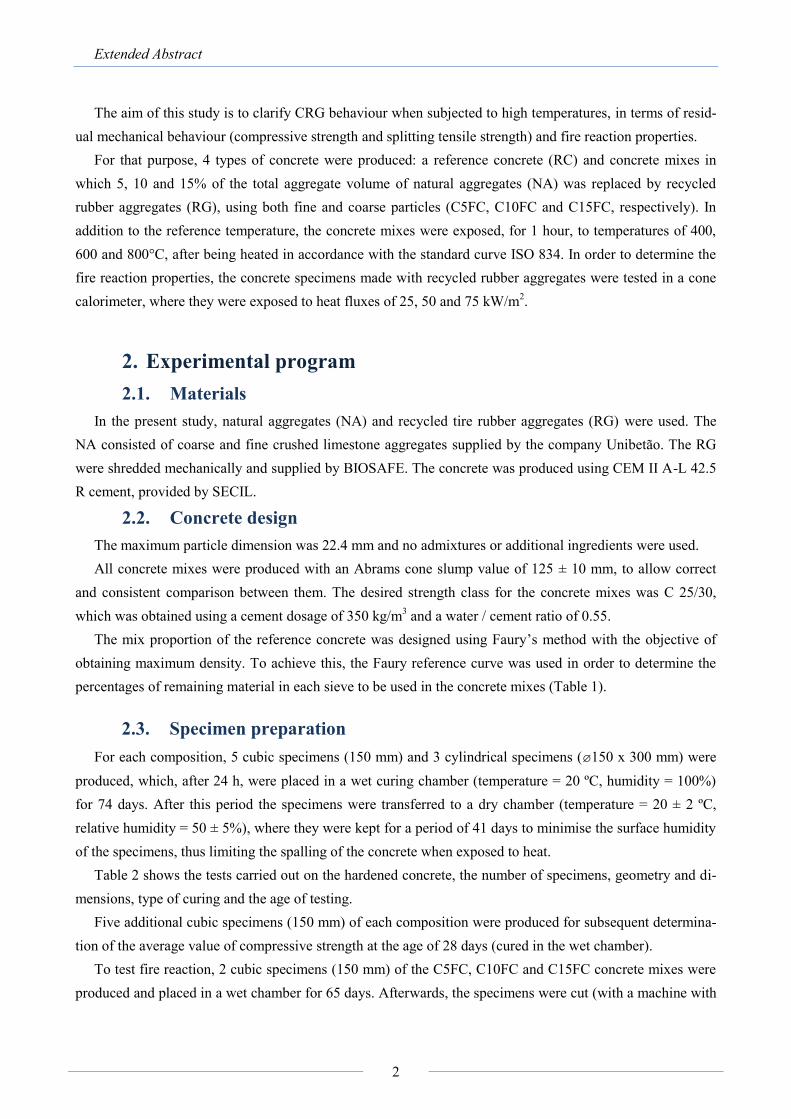
1. Introduction
Depositing used tyres in open-air sites is currently an inevitable end-of-the-process, taking into account
the lack of viable alternatives liable to find a useful end to the large number of tyres Society discards. In the
United States, for example, there are 2 to 3 billion tyres deposited in landfills and 242 million tyres discarded
per year, of which only 38% are reused or recycled (Humphrey, 1995). This is not an environmentally sus-
tainable alternative, given the many environmental hazards associated with this practice, such as soil con-
tamination and a greater probability of the occurrence of uncontrolled combustion.
Recently, legislative efforts have been made with the aim of diverting this type of waste to serve a useful
purpose, in which recycling takes on a fundamental role. Within this context, the use of such material in the
construction industry, such as incorporating it into concrete, is a reasonable alternative, and gives rise to the
need to study the structural behaviour of this type of concrete, in order to define the limits of its application.
The different research carried out into concrete made with recycled rubber aggregates (CRG) has made it
possible to gain a better understanding of its mechanical properties. However, in order for this alternative to
become widespread in the building sector, the behaviour of concrete made with recycled rubber aggregates
when subjected to fire must be evaluated, since it considerably influences the probability of collapse of the
different structural elements in the event of fire.
The fire behaviour of concrete depends on the proportions of the components used, and is determined by
complex physic-chemical transformations that occur when the material heats up (Khoury, 2000). Thus, when
an element of conventional concrete is exposed to high temperatures, e.g. in a fire, its components undergo
major changes, such as: the water inside the concrete begins to evaporate in temperatures of 100ºC and
above; loss of cement hydration water occurs between 300 and 400 ºC, which leads to a loss in strength and
causes superficial cracks to appear; up to 600 ºC aggregates undergo thermal expansion, causing internal
tensions that lead to the concrete breaking down; from 800 ºC, aggregates begin to decompose, accentuating
the weakening of the concrete’s strength until it becomes a fragile material (Georgali and Tsakiridis, 2004).
Research into CRG fire behaviour is scarce and inconclusive. Hernandez-Olivares and Barluenga (2004)
tested recycled rubber-filled high-strength concrete (1.25 cm long) at high temperatures. In order to do this,
specimens of different composition (0, 3, 5 and 8% of rubber fibre volumetric fraction) were produced and
then heated in accordance with ISO 834 curve until the sides of the specimens directly exposed to the heat
reached a temperature of 1000 ºC. The authors concluded that, for the concrete containing no rubber, the
curvature of the specimen’s outer face (not exposed to the fire) increases sharply because spalling occurs,
contrary to the specimens containing rubber aggregates.
Akasaki et al. (2006) assessed the mechanical performance of concrete when mixed with recycled rubber
aggregates, heated to a temperature of 600 ºC, in accordance with the ISO 834 curve. Specimens were pre-
pared using concrete made with recycled rubber aggregates, subjected to a two-stage heating rate: the first
from 105 ºC/min up to 538 ºC and the second from 33 ºC/min up to the target temperature (600 ºC). The
authors concluded that the introduction of rubber does not interfere significantly with observed strength re-
duction, given that the maximum strength reduction values obtained were 70% for the concrete specimens
made with recycled rubber aggregates and 64% for the concrete containing no rubber.
Extended Abstract
2
The aim of this study is to clarify CRG behaviour when subjected to high temperatures, in terms of resid-
ual mechanical behaviour (compressive strength and splitting tensile strength) and fire reaction properties.
For that purpose, 4 types of concrete were produced: a reference concrete (RC) and concrete mixes in
which 5, 10 and 15% of the total aggregate volume of natural aggregates (NA) was replaced by recycled
rubber aggregates (RG), using both fine and coarse particles (C5FC, C10FC and C15FC, respectively). In
addition to the reference temperature, the concrete mixes were exposed, for 1 hour, to temperatures of 400,
600 and 800°C, after being heated in accordance with the standard curve ISO 834. In order to determine the
fire reaction properties, the concrete specimens made with recycled rubber aggregates were tested in a cone
calorimeter, where they were exposed to heat fluxes of 25, 50 and 75 kW/m2.
2. Experimental program
2.1. Materials
In the present study, natural aggregates (NA) and recycled tire rubber aggregates (RG) were used. The
NA consisted of coarse and fine crushed limestone aggregates supplied by the company Unibetão. The RG
were shredded mechanically and supplied by BIOSAFE. The concrete was produced using CEM II A-L 42.5
R cement, provided by SECIL.
2.2. Concrete design
The maximum particle dimension was 22.4 mm and no admixtures or additional ingredients were used.
All concrete mixes were produced with an Abrams cone slump value of 125 ± 10 mm, to allow correct
and consistent comparison between them. The desired strength class for the concrete mixes was C 25/30,
which was obtained using a cement dosage of 350 kg/m3 and a water / cement ratio of 0.55.
The mix proportion of the reference concrete was designed using Faury’s method with the objective of
obtaining maximum density. To achieve this, the Faury reference curve was used in order to determine the
percentages of remaining material in each sieve to be used in the concrete mixes (Table 1).
2.3. Specimen preparation
For each composition, 5 cubic specimens (150 mm) and 3 cylindrical specimens (ø150 x 300 mm) were
produced, which, after 24 h, were placed in a wet curing chamber (temperature = 20 ºC, humidity = 100%)
for 74 days. After this period the specimens were transferred to a dry chamber (temperature = 20 ± 2 ºC,
relative humidity = 50 ± 5%), where they were kept for a period of 41 days to minimise the surface humidity
of the specimens, thus limiting the spalling of the concrete when exposed to heat.
Table 2 shows the tests carried out on the hardened concrete, the number of specimens, geometry and di-
mensions, type of curing and the age of testing.
Five additional cubic specimens (150 mm) of each composition were produced for subsequent determina-
tion of the average value of compressive strength at the age of 28 days (cured in the wet chamber).
To test fire reaction, 2 cubic specimens (150 mm) of the C5FC, C10FC and C15FC concrete mixes were
produced and placed in a wet chamber for 65 days. Afterwards, the specimens were cut (with a machine with
Fire behaviour of concrete made with recycled rubber aggregates
3
a diamond saw blade) into 100 × 100 × 10 mm3 slabs, which were placed in a dry chamber for 7 days.
Table 1 - Composition of the reference concrete (RC)
Component Mass (kg/m3)
Natural coarse
aggregates
31.5 - 45.0 0.00
22.4 - 31.5 0.00
16 - 22.4 321.76
11.2 - 16 319.95
8 - 11.2 122.92
5.6 - 8 122.92
4 - 5.6 108.46
Natural fine
aggregates
2 - 4 194.81
1 - 2 168.49
0.5 - 1 105.30
0.25 - 0.5 249.22
0.125 - 0.25 70.20
0.063 - 0.125 0.00
0 - 0.063 0.00
Table 2 - Number, dimensions, type of curing and age of the specimens tested
Test Number of
specimens
Geometry and
dimensions (mm)
Types of cure / duration (days) Age of thermal
exposure (days)
Age of testing
(days) Wet chamber Dry chamber
Compressive
strength 5 Cubes, 150 74 41 115 119
Splitting tensile
strength 3
Cylinders, 150 ×
300 (øxh) 74 41 115 119
2.4. Tests on aggregates
The following tests were carried out on the different aggregates: size grading analysis, in accordance with
EN 933-1 (2000) and EN 933-2 (1999); particle density and water absorption, in accordance with EN 1097-6
(2003); loose bulk density in accordance with EN 1097-3 (2003); Los Angeles abrasion, in keeping with
LNEC E-237 (1970) specifications and shape index, in accordance with EN 933-4 (2002). Table 3 shows the
most relevant results of these tests.
Table 3 - Aggregates test results
Aggregates Coarse
gravel
Fine
gravel Granule
Coarse
sand
Fine
sand RG
Particle dry density (kg/dm3) 2.65 2.65 2.65 2.62 2.58 1.13
Particle saturated surface-dried density (kg/dm3) 2.68 2.68 2.69 2.63 2.58 1.14
Water absorption (%) 0.98 1.27 1.19 0.05 0.09 1.75
Loose bulk density (kg/dm3) 1.43 1.42 1.44 1.54 1.50 0.45
Los Angeles coefficient (%) 31.92 30.84 34.16 - - -
Shape index (%) 10.2 17.9 18.6 - - 7.6/15.2 Note: the shape index test values for the rubber aggregates (RG) refer to RG between 7-9.5 mm and between 4-7 mm, respectively.
As seen in Table 3, the main differences between the properties of the NA and those of the RG have to do
with particle density (wet and saturated surface-dried) and loose bulk density, with RG values much lower
than NA’s. For water absorption, RG achieved slightly higher values than NA - this could be due to the diffi-
culty in carrying out the test procedure, since it requires drying the surface of the aggregates, which is quite
complicated for RG. The shape index test of the different coarse aggregates used in the concrete mixes re-
vealed that the shape of RG is not that different from the shape of NA. However, the shape of RG between 7
Extended Abstract
4
and 9.5 mm in size is significantly rounder than those of NA and the smaller RG.
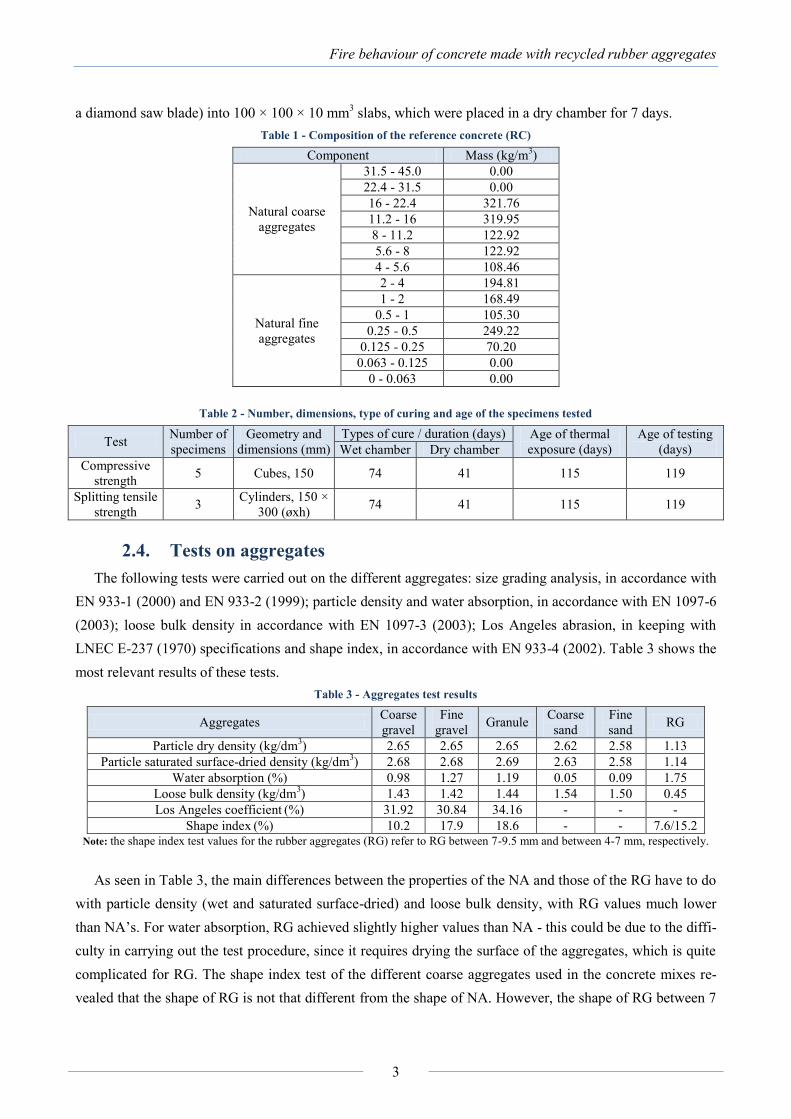
2.5. Tests on fresh concrete
The slump of the different fresh concrete mixes was determined by means of the Abrams cone test (EN
12350-2, 2002), and so was their particle density (EN 12350-6, 2002). Figures 1 and 2 show the main results
obtained in these tests.
Figure 1 - Abrams cone slump test results Figure 2 - Density of the concretes in the fresh state
The slump of the CRG stayed within the established range of 125 ± 10 mm, an essential requirement for a
valid comparison of the remaining concrete properties.
The particle density of CRG decreases linearly with increasing replacement rates of NA by RG, which is
mainly due to the density difference between the NA and the RG.
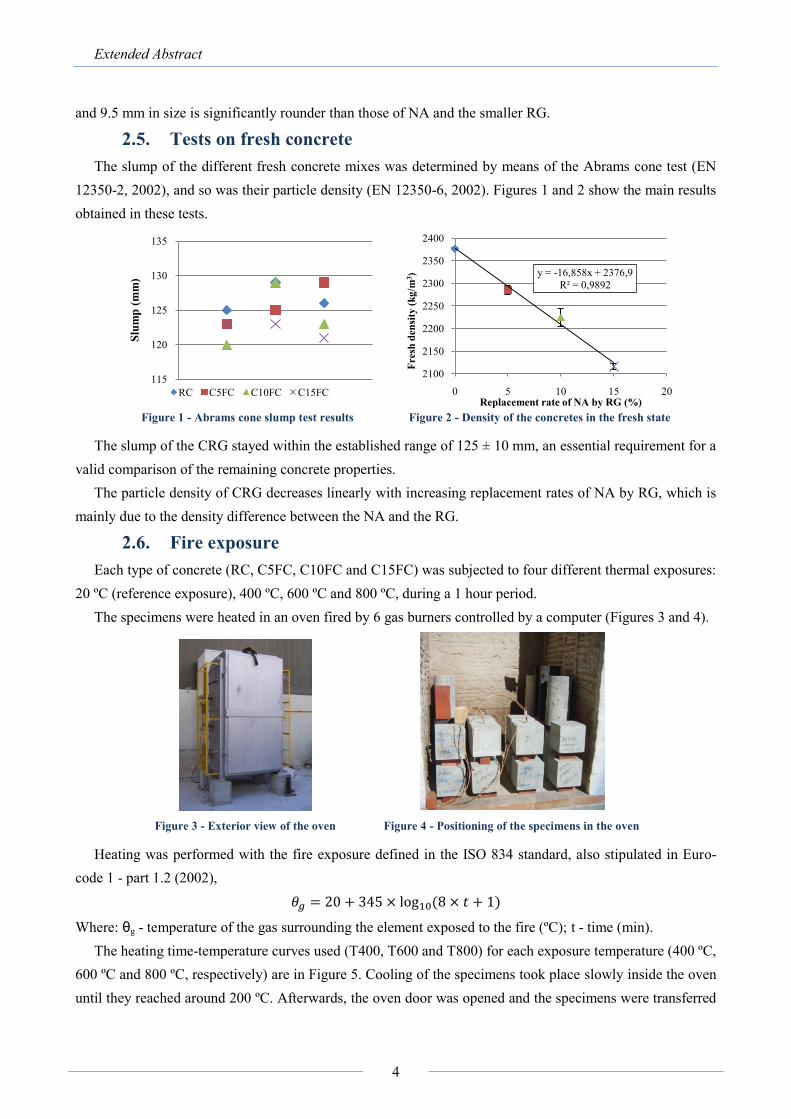
2.6. Fire exposure
Each type of concrete (RC, C5FC, C10FC and C15FC) was subjected to four different thermal exposures:
20 ºC (reference exposure), 400 ºC, 600 ºC and 800 ºC, during a 1 hour period.
The specimens were heated in an oven fired by 6 gas burners controlled by a computer (Figures 3 and 4).
Figure 3 - Exterior view of the oven Figure 4 - Positioning of the specimens in the oven
Heating was performed with the fire exposure defined in the ISO 834 standard, also stipulated in Euro-
code 1 - part 1.2 (2002),
Where: θg - temperature of the gas surrounding the element exposed to the fire (ºC); t - time (min).
The heating time-temperature curves used (T400, T600 and T800) for each exposure temperature (400 ºC,
600 ºC and 800 ºC, respectively) are in Figure 5. Cooling of the specimens took place slowly inside the oven
until they reached around 200 ºC. Afterwards, the oven door was opened and the specimens were transferred
115
120
125
130
135
Slu
mp
(m
m)
RC C5FC C10FC C15FC
y = -16,858x + 2376,9
R² = 0,9892
2100
2150
2200
2250
2300
2350
2400
0 5 10 15 20
Fresh
den
sity
(k
g/m
3)
Replacement rate of NA by RG (%)
Fire behaviour of concrete made with recycled rubber aggregates
5
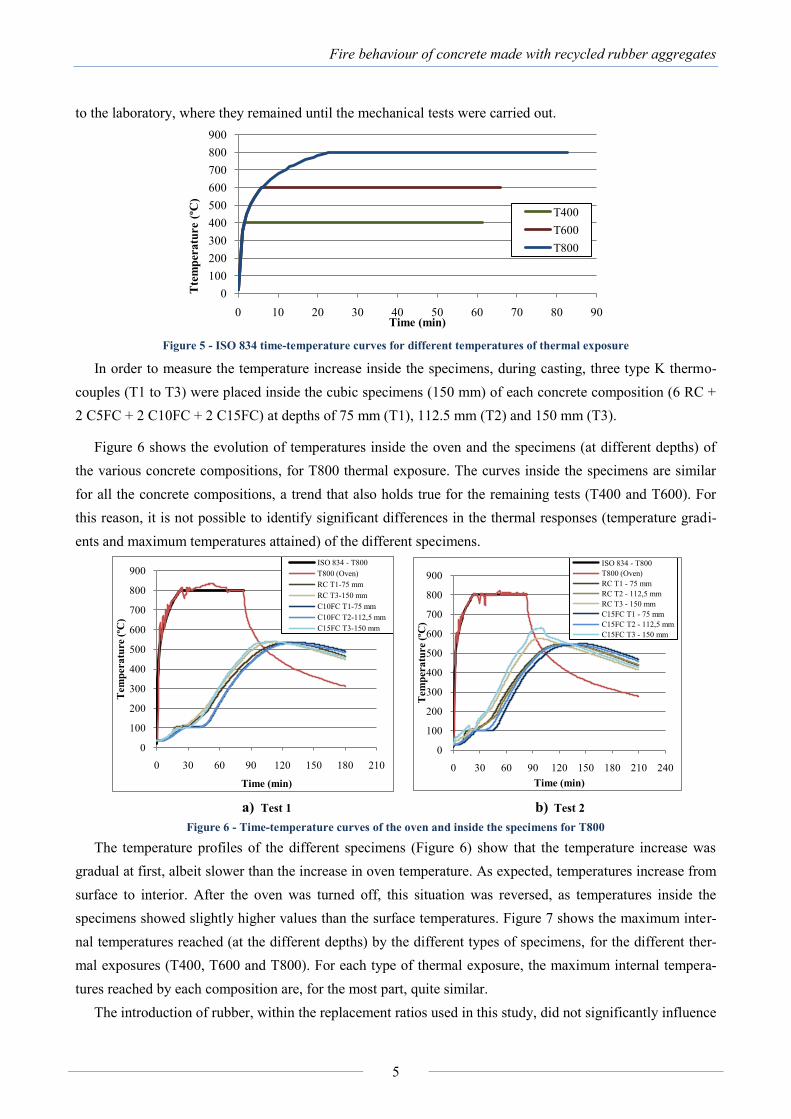
to the laboratory, where they remained until the mechanical tests were carried out.
Figure 5 - ISO 834 time-temperature curves for different temperatures of thermal exposure
In order to measure the temperature increase inside the specimens, during casting, three type K thermo-
couples (T1 to T3) were placed inside the cubic specimens (150 mm) of each concrete composition (6 RC +
2 C5FC + 2 C10FC + 2 C15FC) at depths of 75 mm (T1), 112.5 mm (T2) and 150 mm (T3).
Figure 6 shows the evolution of temperatures inside the oven and the specimens (at different depths) of
the various concrete compositions, for T800 thermal exposure. The curves inside the specimens are similar
for all the concrete compositions, a trend that also holds true for the remaining tests (T400 and T600). For
this reason, it is not possible to identify significant differences in the thermal responses (temperature gradi-
ents and maximum temperatures attained) of the different specimens.
a) Test 1 b) Test 2
Figure 6 - Time-temperature curves of the oven and inside the specimens for T800
The temperature profiles of the different specimens (Figure 6) show that the temperature increase was
gradual at first, albeit slower than the increase in oven temperature. As expected, temperatures increase from
surface to interior. After the oven was turned off, this situation was reversed, as temperatures inside the
specimens showed slightly higher values than the surface temperatures. Figure 7 shows the maximum inter-
nal temperatures reached (at the different depths) by the different types of specimens, for the different ther-
mal exposures (T400, T600 and T800). For each type of thermal exposure, the maximum internal tempera-
tures reached by each composition are, for the most part, quite similar.
The introduction of rubber, within the replacement ratios used in this study, did not significantly influence
0
100
200
300
400
500
600
700
800
900
0 10 20 30 40 50 60 70 80 90
Tte
mp
eratu
re
(ºC
)
Time (min)
T400
T600
T800
0
100
200
300
400
500
600
700
800
900
0 30 60 90 120 150 180 210
Tem
pera
ture (
ºC)
Time (min)
ISO 834 - T800
T800 (Oven)
RC T1-75 mm
RC T3-150 mm
C10FC T1-75 mm
C10FC T2-112,5 mm
C15FC T3-150 mm
0
100
200
300
400
500
600
700
800
900
0 30 60 90 120 150 180 210 240
Tem
pera
ture (
ºC)
Time (min)
ISO 834 - T800
T800 (Oven)
RC T1 - 75 mm
RC T2 - 112,5 mm
RC T3 - 150 mm
C15FC T1 - 75 mm
C15FC T2 - 112,5 mm
C15FC T3 - 150 mm
Extended Abstract
6
the maximum temperatures reached by the materials.
a) T400 b) T600 c) T800
Figure 7 - Maximum internal temperatures reached for each thermal exposure (T400, T600 and T800)
(Note: There were slight problems in the register of temperatures in types RC-T1 for T800, C5FC-T1, T2 and C10FC-T2 for T600)
2.7. Tests on hardened concrete after thermal exposure
To evaluate the post-fire residual mechanical properties of the CRG, compressive strength tests (EN
12390-3, 2003) and splitting tensile strength tests (EN 12390-6, 2002) were carried out.
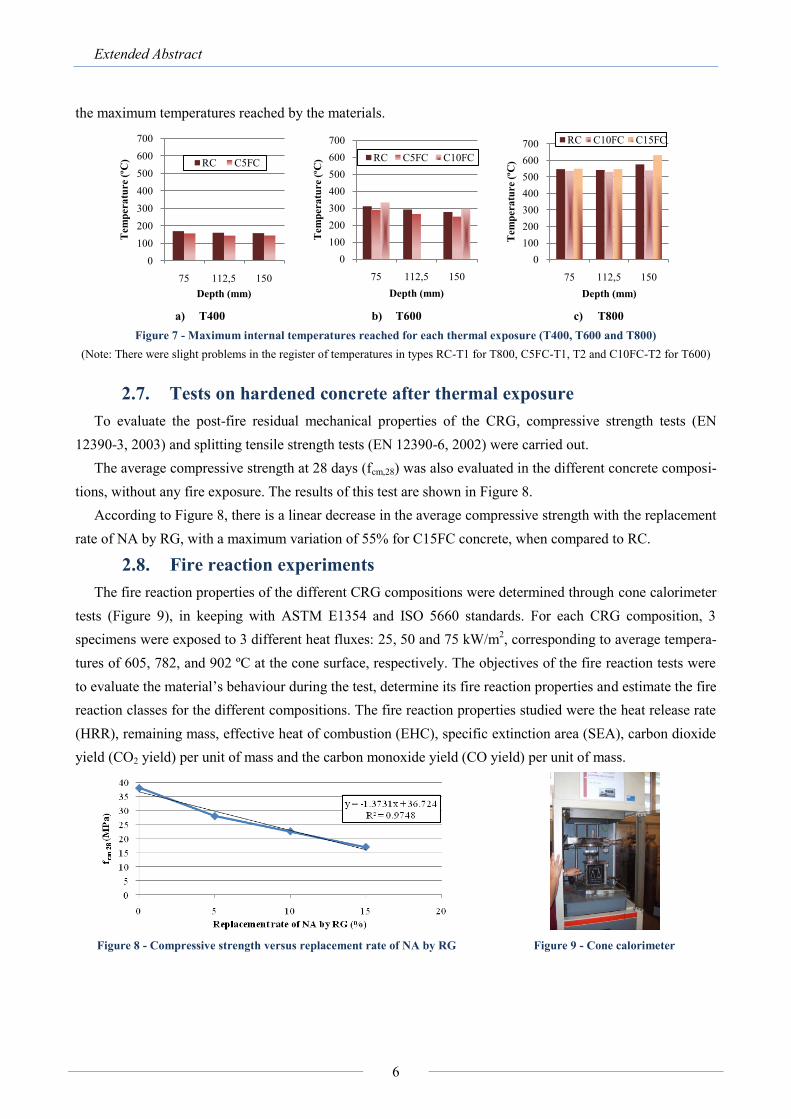
The average compressive strength at 28 days (fcm,28) was also evaluated in the different concrete composi-
tions, without any fire exposure. The results of this test are shown in Figure 8.
According to Figure 8, there is a linear decrease in the average compressive strength with the replacement
rate of NA by RG, with a maximum variation of 55% for C15FC concrete, when compared to RC.
2.8. Fire reaction experiments
The fire reaction properties of the different CRG compositions were determined through cone calorimeter
tests (Figure 9), in keeping with ASTM E1354 and ISO 5660 standards. For each CRG composition, 3
specimens were exposed to 3 different heat fluxes: 25, 50 and 75 kW/m2, corresponding to average tempera-
tures of 605, 782, and 902 ºC at the cone surface, respectively. The objectives of the fire reaction tests were
to evaluate the material’s behaviour during the test, determine its fire reaction properties and estimate the fire
reaction classes for the different compositions. The fire reaction properties studied were the heat release rate
(HRR), remaining mass, effective heat of combustion (EHC), specific extinction area (SEA), carbon dioxide
yield (CO2 yield) per unit of mass and the carbon monoxide yield (CO yield) per unit of mass.
Figure 8 - Compressive strength versus replacement rate of NA by RG Figure 9 - Cone calorimeter
0
100
200
300
400
500
600
700
75 112,5 150
Tem
pera
ture (
ºC)
Depth (mm)
RC C5FC
0
100
200
300
400
500
600
700
75 112,5 150
Tem
pera
ture (
ºC)
Depth (mm)
RC C5FC C10FC
0
100
200
300
400
500
600
700
75 112,5 150
Tem
pera
ture (
ºC)
Depth (mm)
RC C10FC C15FC
Fire behaviour of concrete made with recycled rubber aggregates
7
3. Results and discussion
3.1. Mechanical properties
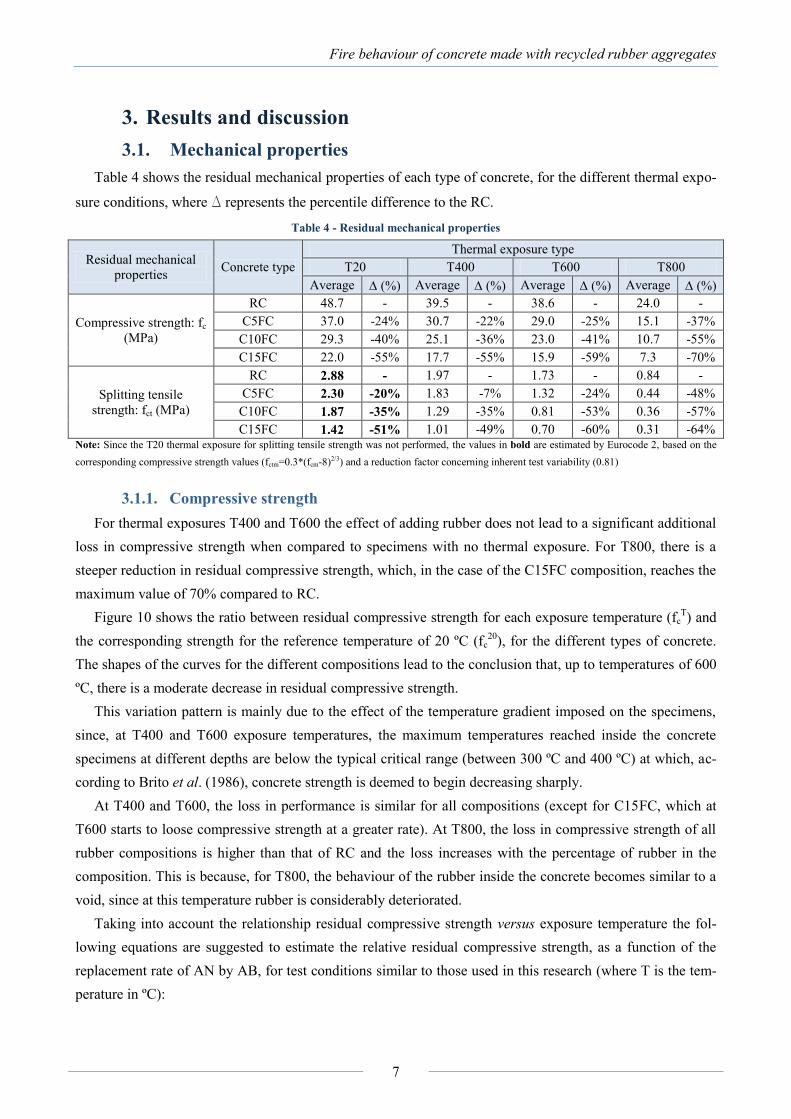
Table 4 shows the residual mechanical properties of each type of concrete, for the different thermal expo-
sure conditions, where D represents the percentile difference to the RC.
Table 4 - Residual mechanical properties
Residual mechanical
properties Concrete type
Thermal exposure type
T20 T400 T600 T800
Average (%) Average (%) Average (%) Average (%)
Compressive strength: fc
(MPa)
RC 48.7 - 39.5 - 38.6 - 24.0 -
C5FC 37.0 -24% 30.7 -22% 29.0 -25% 15.1 -37%
C10FC 29.3 -40% 25.1 -36% 23.0 -41% 10.7 -55%
C15FC 22.0 -55% 17.7 -55% 15.9 -59% 7.3 -70%
Splitting tensile
strength: fct (MPa)
RC 2.88 - 1.97 - 1.73 - 0.84 -
C5FC 2.30 -20% 1.83 -7% 1.32 -24% 0.44 -48%
C10FC 1.87 -35% 1.29 -35% 0.81 -53% 0.36 -57%
C15FC 1.42 -51% 1.01 -49% 0.70 -60% 0.31 -64% Note: Since the T20 thermal exposure for splitting tensile strength was not performed, the values in bold are estimated by Eurocode 2, based on the
corresponding compressive strength values (fctm=0.3*(fcm-8)2/3) and a reduction factor concerning inherent test variability (0.81)
3.1.1. Compressive strength
For thermal exposures T400 and T600 the effect of adding rubber does not lead to a significant additional
loss in compressive strength when compared to specimens with no thermal exposure. For T800, there is a
steeper reduction in residual compressive strength, which, in the case of the C15FC composition, reaches the
maximum value of 70% compared to RC.
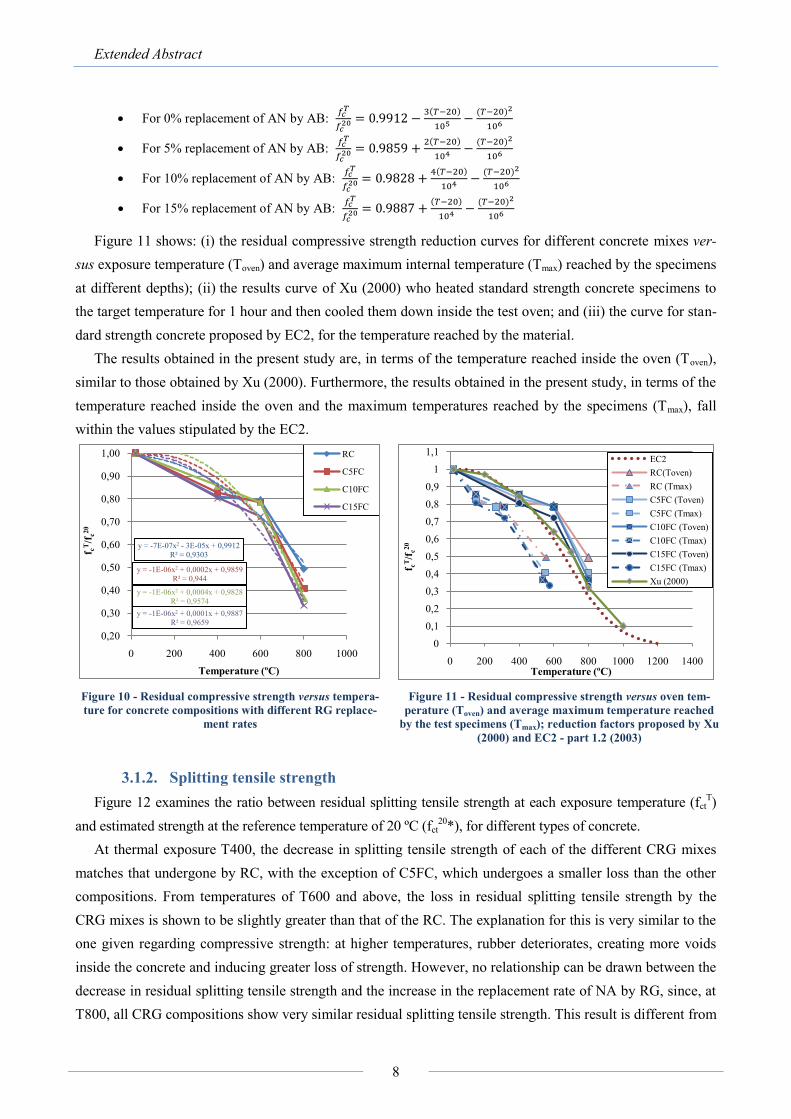
Figure 10 shows the ratio between residual compressive strength for each exposure temperature (fcT) and
the corresponding strength for the reference temperature of 20 ºC (fc20
), for the different types of concrete.
The shapes of the curves for the different compositions lead to the conclusion that, up to temperatures of 600
ºC, there is a moderate decrease in residual compressive strength.
This variation pattern is mainly due to the effect of the temperature gradient imposed on the specimens,
since, at T400 and T600 exposure temperatures, the maximum temperatures reached inside the concrete
specimens at different depths are below the typical critical range (between 300 ºC and 400 ºC) at which, ac-
cording to Brito et al. (1986), concrete strength is deemed to begin decreasing sharply.
At T400 and T600, the loss in performance is similar for all compositions (except for C15FC, which at
T600 starts to loose compressive strength at a greater rate). At T800, the loss in compressive strength of all
rubber compositions is higher than that of RC and the loss increases with the percentage of rubber in the
composition. This is because, for T800, the behaviour of the rubber inside the concrete becomes similar to a
void, since at this temperature rubber is considerably deteriorated.
Taking into account the relationship residual compressive strength versus exposure temperature the fol-
lowing equations are suggested to estimate the relative residual compressive strength, as a function of the
replacement rate of AN by AB, for test conditions similar to those used in this research (where T is the tem-
perature in ºC):
Extended Abstract
8
For 0% replacement of AN by AB:
For 5% replacement of AN by AB:
For 10% replacement of AN by AB:
For 15% replacement of AN by AB:
Figure 11 shows: (i) the residual compressive strength reduction curves for different concrete mixes ver-
sus exposure temperature (Toven) and average maximum internal temperature (Tmax) reached by the specimens
at different depths); (ii) the results curve of Xu (2000) who heated standard strength concrete specimens to
the target temperature for 1 hour and then cooled them down inside the test oven; and (iii) the curve for stan-
dard strength concrete proposed by EC2, for the temperature reached by the material.
The results obtained in the present study are, in terms of the temperature reached inside the oven (Toven),
similar to those obtained by Xu (2000). Furthermore, the results obtained in the present study, in terms of the
temperature reached inside the oven and the maximum temperatures reached by the specimens (Tmax), fall
within the values stipulated by the EC2.
Figure 10 - Residual compressive strength versus tempera-
ture for concrete compositions with different RG replace-
ment rates
Figure 11 - Residual compressive strength versus oven tem-
perature (Toven) and average maximum temperature reached
by the test specimens (Tmax); reduction factors proposed by Xu
(2000) and EC2 - part 1.2 (2003)
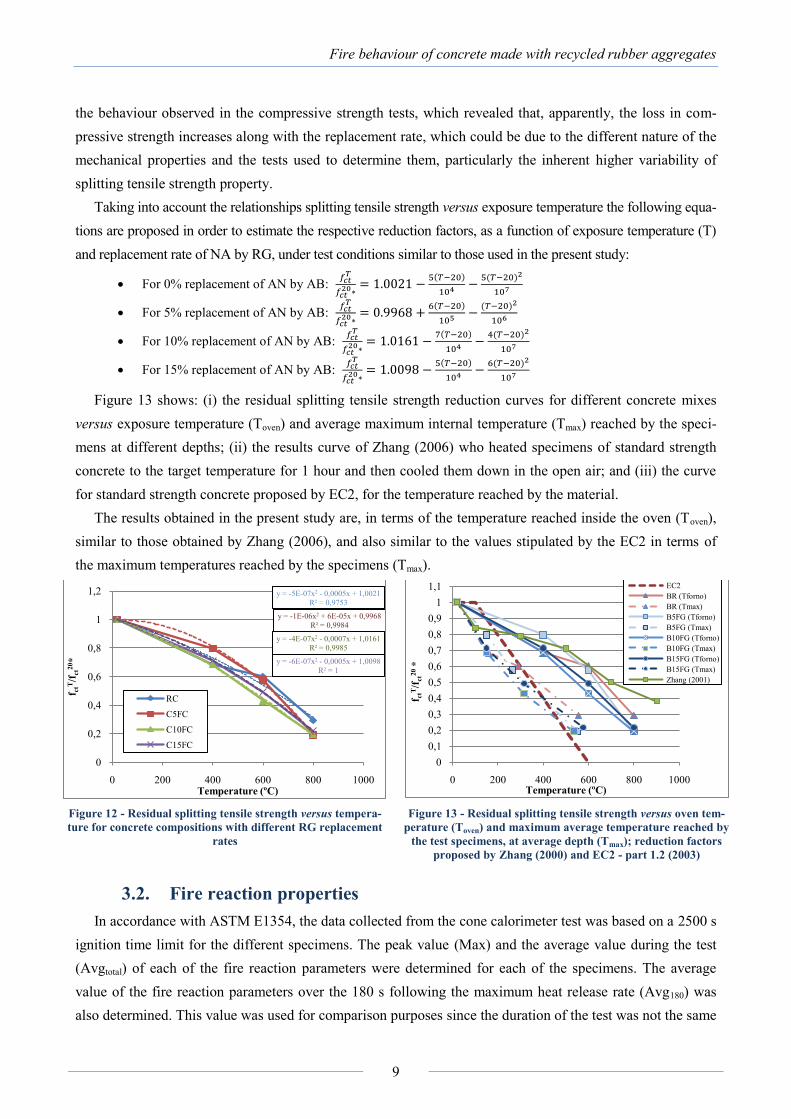
3.1.2. Splitting tensile strength
Figure 12 examines the ratio between residual splitting tensile strength at each exposure temperature (fctT)
and estimated strength at the reference temperature of 20 ºC (fct20
*), for different types of concrete.
At thermal exposure T400, the decrease in splitting tensile strength of each of the different CRG mixes
matches that undergone by RC, with the exception of C5FC, which undergoes a smaller loss than the other
compositions. From temperatures of T600 and above, the loss in residual splitting tensile strength by the
CRG mixes is shown to be slightly greater than that of the RC. The explanation for this is very similar to the
one given regarding compressive strength: at higher temperatures, rubber deteriorates, creating more voids
inside the concrete and inducing greater loss of strength. However, no relationship can be drawn between the
decrease in residual splitting tensile strength and the increase in the replacement rate of NA by RG, since, at
T800, all CRG compositions show very similar residual splitting tensile strength. This result is different from
y = -7E-07x2 - 3E-05x + 0,9912
R² = 0,9303
y = -1E-06x2 + 0,0002x + 0,9859
R² = 0,944
y = -1E-06x2 + 0,0004x + 0,9828
R² = 0,9574
y = -1E-06x2 + 0,0001x + 0,9887
R² = 0,9659
0,20
0,30
0,40
0,50
0,60
0,70
0,80
0,90
1,00
0 200 400 600 800 1000
f cT/f
c2
0
Temperature (ºC)
RC
C5FC
C10FC
C15FC
0
0,1
0,2
0,3
0,4
0,5
0,6
0,7
0,8
0,9
1
1,1
0 200 400 600 800 1000 1200 1400
f cT/f
c2
0
Temperature (ºC)
EC2
RC(Toven)
RC (Tmax)
C5FC (Toven)
C5FC (Tmax)
C10FC (Toven)
C10FC (Tmax)
C15FC (Toven)
C15FC (Tmax)
Xu (2000)
Fire behaviour of concrete made with recycled rubber aggregates
9
the behaviour observed in the compressive strength tests, which revealed that, apparently, the loss in com-
pressive strength increases along with the replacement rate, which could be due to the different nature of the
mechanical properties and the tests used to determine them, particularly the inherent higher variability of
splitting tensile strength property.
Taking into account the relationships splitting tensile strength versus exposure temperature the following equa-
tions are proposed in order to estimate the respective reduction factors, as a function of exposure temperature (T)
and replacement rate of NA by RG, under test conditions similar to those used in the present study:
For 0% replacement of AN by AB:
For 5% replacement of AN by AB:
For 10% replacement of AN by AB:
For 15% replacement of AN by AB:
Figure 13 shows: (i) the residual splitting tensile strength reduction curves for different concrete mixes
versus exposure temperature (Toven) and average maximum internal temperature (Tmax) reached by the speci-
mens at different depths; (ii) the results curve of Zhang (2006) who heated specimens of standard strength
concrete to the target temperature for 1 hour and then cooled them down in the open air; and (iii) the curve
for standard strength concrete proposed by EC2, for the temperature reached by the material.
The results obtained in the present study are, in terms of the temperature reached inside the oven (Toven),
similar to those obtained by Zhang (2006), and also similar to the values stipulated by the EC2 in terms of
the maximum temperatures reached by the specimens (Tmax).
Figure 12 - Residual splitting tensile strength versus tempera-
ture for concrete compositions with different RG replacement
rates
Figure 13 - Residual splitting tensile strength versus oven tem-
perature (Toven) and maximum average temperature reached by
the test specimens, at average depth (Tmax); reduction factors
proposed by Zhang (2000) and EC2 - part 1.2 (2003)
3.2. Fire reaction properties
In accordance with ASTM E1354, the data collected from the cone calorimeter test was based on a 2500 s
ignition time limit for the different specimens. The peak value (Max) and the average value during the test
(Avgtotal) of each of the fire reaction parameters were determined for each of the specimens. The average
value of the fire reaction parameters over the 180 s following the maximum heat release rate (Avg180) was
also determined. This value was used for comparison purposes since the duration of the test was not the same
y = -5E-07x2 - 0,0005x + 1,0021
R² = 0,9753
y = -1E-06x2 + 6E-05x + 0,9968
R² = 0,9984
y = -4E-07x2 - 0,0007x + 1,0161
R² = 0,9985
y = -6E-07x2 - 0,0005x + 1,0098
R² = 1
0
0,2
0,4
0,6
0,8
1
1,2
0 200 400 600 800 1000
f ctT
/fct2
0*
Temperature (ºC)
RC
C5FC
C10FC
C15FC
0
0,1
0,2
0,3
0,4
0,5
0,6
0,7
0,8
0,9
1
1,1
0 200 400 600 800 1000
f ctT
/fct2
0*
Temperature (ºC)
EC2
BR (Tforno)
BR (Tmax)
B5FG (Tforno)
B5FG (Tmax)
B10FG (Tforno)
B10FG (Tmax)
B15FG (Tforno)
B15FG (Tmax)
Zhang (2001)
Extended Abstract
10
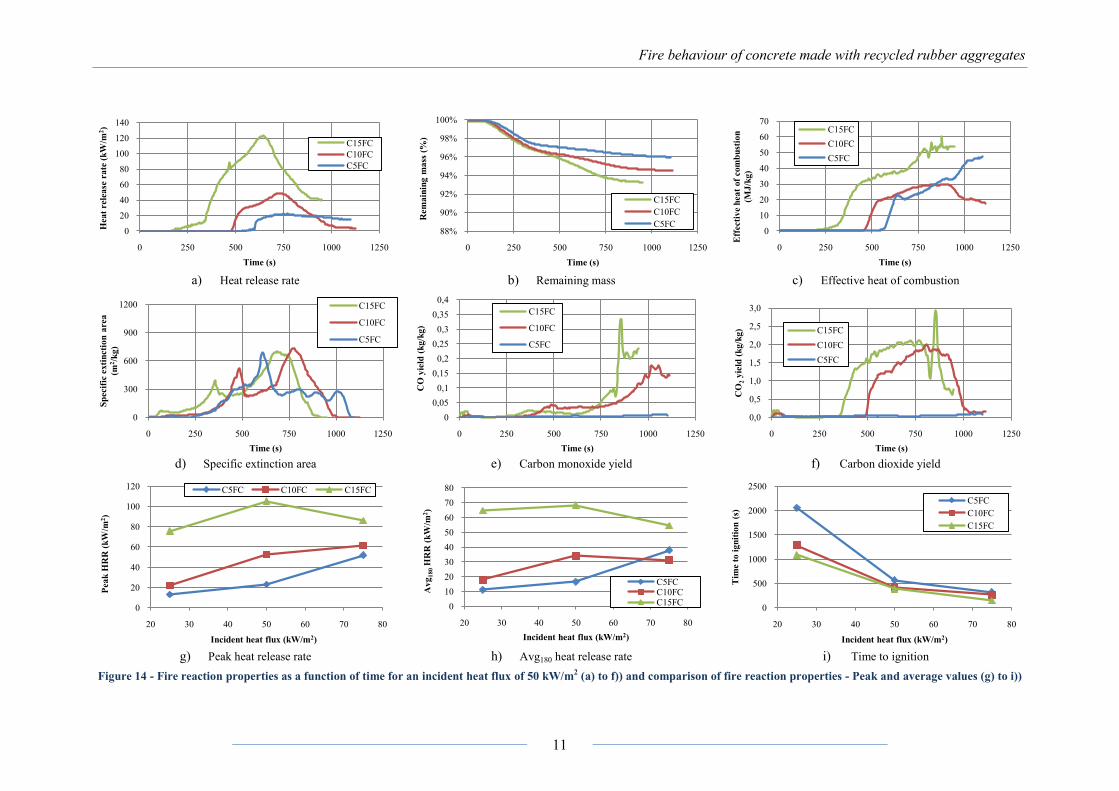
for all specimens. Figure 14 - a) to f) shows the change in the fire reaction properties of the different compo-
sitions over time, for an incident heat flux of 50 kW/m2 (the intermediate flux and the most representative).
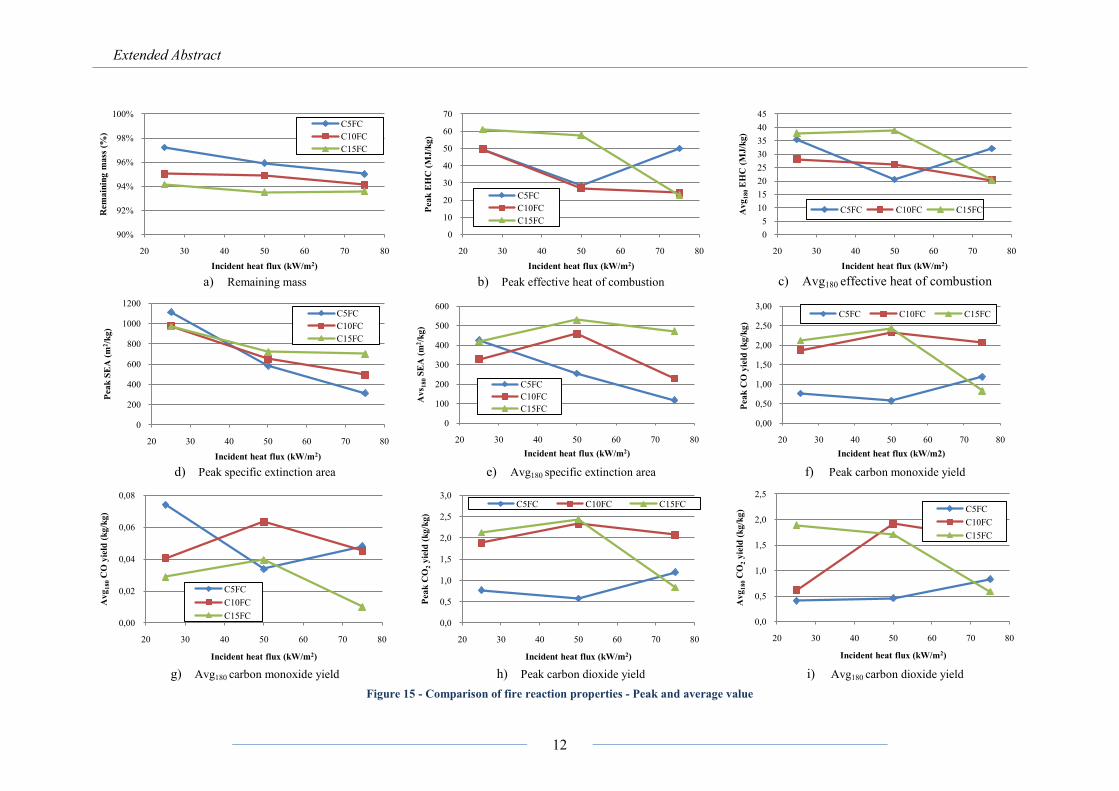
Figures 14 - g) to i) and 15 show the values determined (peak and Avg180) for the different incident heat
fluxes and different CRG compositions.
The joint analysis of these figures allowed the following conclusions to be drawn on the parameters under
study: (i) the time to ignition decreases as the incident heat flux and proportion of rubber content increase;
which was expected since a higher heat flux requires a faster ignition and the presence of rubber contributes
to this, due to its flammability; (ii) the heat release rate (HRR) shows a faster initial increase, particularly
in the compositions with a higher rubber content; the Max and Avg180 values are both higher for C15FC and
C10FC than for C5FC, which leads to conclude that the heat release rate increases with the replacement rate
of RG; (iii) the remaining mass curve decreases with the incident heat flux (since, for higher heat fluxes,
there is more decomposed material) and with the replacement rate of RG; there are periods when the de-
crease in mass is more pronounced, which correspond to the time when the areas of higher RG concentration
ignite; (iv) the effective heat of combustion (EHC) does not suffer significant influence from the type of
incident heat flux or the proportion of RG - the maximum recorded values are higher for the B15FG compo-
sition, but only for fluxes of 25 and 50 kW/m2; there is a correlation between this property and the time of
material ignition, since the EHC values begin to increase at approximately the time of ignition; (v) the spe-
cific extinction area (SEA) gives an indication of the smoke released during the test; the average and maxi-
mum values are both higher for the compositions with a greater proportion of RG, since there is more smoke
released when this material ignites; furthermore, the SEA peak value decreases along with the incident heat
flux; (vi) the carbon monoxide yield (CO) values are relatively low up until ignition, a trend that becomes
more pronounced at heat fluxes of 25 and 50 kW/m2; as the carbon dioxide yield (CO2) begins to decrease
there is a gradual increase in carbon monoxide release, which happens since the combustion reaction be-
comes less complete over time; the analysis of Figures 15 f) and g) shows no influence from either the inci-
dent heat flux or the proportion of RG; (vii) the carbon dioxide yield (CO2) was much lower for the C5FC
composition; however, no evident relationship was found between this property and the incident heat flux.
From the results provided by the cone calorimeter test and using Conetools software (Van Hees et. al
(2002)), a fire reaction class was estimated for the CRG, thus establishing their end use limitations. The
equivalent Portuguese Classification (prior to the current fire prevention legislation, Decree-Law n.º
220/2008 and Ordinance nº1532/2008) was also included. The results are shown in Table 5.
Table 5 - Euroclasses of the tested specimens (according to Conetools results) and corresponding Portuguese classes
Specimens Euroclass Portuguese Class
C5FC A2/B M0/M1
C10FC A2/B M0/M1
C15FC A2/B M0/M1
Fire behaviour of concrete made with recycled rubber aggregates
11
a) Heat release rate b) Remaining mass c) Effective heat of combustion
d) Specific extinction area e) Carbon monoxide yield f) Carbon dioxide yield
g) Peak heat release rate h) Avg180 heat release rate i) Time to ignition
Figure 14 - Fire reaction properties as a function of time for an incident heat flux of 50 kW/m2 (a) to f)) and comparison of fire reaction properties - Peak and average values (g) to i))
0
20
40
60
80
100
120
140
0 250 500 750 1000 1250
Hea
t rele
ase
ra
te (
kW
/m2)
Time (s)
C15FC
C10FC
C5FC
88%
90%
92%
94%
96%
98%
100%
0 250 500 750 1000 1250
Rem
ain
ing
ma
ss (
%)
Time (s)
C15FC
C10FC
C5FC0
10
20
30
40
50
60
70
0 250 500 750 1000 1250
Eff
ecti
ve
hea
t of
com
bu
stio
n
(MJ
/kg
)
Time (s)
C15FC
C10FC
C5FC
0
300
600
900
1200
0 250 500 750 1000 1250
Sp
ecif
ic e
xti
ncti
on
area
(m2/k
g)
Time (s)
C15FC
C10FC
C5FC
0
0,05
0,1
0,15
0,2
0,25
0,3
0,35
0,4
0 250 500 750 1000 1250
CO
yie
ld (
kg
/kg
)
Time (s)
C15FC
C10FC
C5FC
0,0
0,5
1,0
1,5
2,0
2,5
3,0
0 250 500 750 1000 1250
CO
2y
ield
(k
g/k
g)
Time (s)
C15FC
C10FC
C5FC
0
20
40
60
80
100
120
20 30 40 50 60 70 80
Peak
HR
R (
kW
/m2)
Incident heat flux (kW/m2)
C5FC C10FC C15FC
0
10
20
30
40
50
60
70
80
20 30 40 50 60 70 80
Avg
18
0H
RR
(k
W/m
2)
Incident heat flux (kW/m2)
C5FCC10FCC15FC
0
500
1000
1500
2000
2500
20 30 40 50 60 70 80
Tim
e t
o i
gn
itio
n (
s)
Incident heat flux (kW/m2)
C5FC
C10FC
C15FC
Extended Abstract
12
a) Remaining mass b) Peak effective heat of combustion c) Avg180 effective heat of combustion
d) Peak specific extinction area e) Avg180 specific extinction area f) Peak carbon monoxide yield
g) Avg180 carbon monoxide yield h) Peak carbon dioxide yield i) Avg180 carbon dioxide yield
Figure 15 - Comparison of fire reaction properties - Peak and average value
90%
92%
94%
96%
98%
100%
20 30 40 50 60 70 80
Rem
ain
ing
ma
ss (
%)
Incident heat flux (kW/m2)
C5FC
C10FC
C15FC
0
10
20
30
40
50
60
70
20 30 40 50 60 70 80
Pea
k E
HC
(M
J/k
g)
Incident heat flux (kW/m2)
C5FC
C10FC
C15FC
0
5
10
15
20
25
30
35
40
45
20 30 40 50 60 70 80
Av
g1
80
EH
C (
MJ
/kg
)
Incident heat flux (kW/m2)
C5FC C10FC C15FC
0
200
400
600
800
1000
1200
20 30 40 50 60 70 80
Pea
k S
EA
(m
2/k
g)
Incident heat flux (kW/m2)
C5FC
C10FC
C15FC
0
100
200
300
400
500
600
20 30 40 50 60 70 80
Av
s 18
0S
EA
(m
2/k
g)
Incident heat flux (kW/m2)
C5FC
C10FC
C15FC
0,00
0,50
1,00
1,50
2,00
2,50
3,00
20 30 40 50 60 70 80
Pea
k C
O y
ield
(k
g/k
g)
Incident heat flux (kW/m2)
C5FC C10FC C15FC
0,00
0,02
0,04
0,06
0,08
20 30 40 50 60 70 80
Avg
18
0C
O y
ield
(k
g/k
g)
Incident heat flux (kW/m2)
C5FC
C10FC
C15FC0,0
0,5
1,0
1,5
2,0
2,5
3,0
20 30 40 50 60 70 80
Peak
CO
2yie
ld (
kg/k
g)
Incident heat flux (kW/m2)
C5FC C10FC C15FC
0,0
0,5
1,0
1,5
2,0
2,5
20 30 40 50 60 70 80
Av
g1
80
CO
2y
ield
(k
g/k
g)
Incident heat flux (kW/m2)
C5FC
C10FC
C15FC
Fire behaviour of concrete made with recycled rubber aggregates
13
For any of the replacement rates used, the CRG fall under Euroclasses A2 or B (M0 or M1 according to
the former Portuguese classification), and are classified between non-combustible materials (M0) and non-
flammable materials (M1). Therefore, the current legislation regarding fire safety in buildings stipulates that
the main end structural use limitations for CRG are tied to their use in ceilings and stairs and, at a non-
structural level, to wall and ceiling coatings on escape routes, fire-proof enclosures and certain areas that
pose a greater fire hazard (high-risk areas in categories above C).
4. Conclusions
This research allows the following conclusions to be drawn about the fire behaviour of CRG:
1. For exposure temperature of 400 ºC, the loss in performance for CRG was similar to that of RC,
in terms of compressive strength and splitting tensile strength;
2. For exposure temperature of 600 ºC, the reduction in residual compressive strength of CRG was
similar to that of RC, with the exception of composition C15FC, which suffered a steeper loss in residual
compressive strength (with fcT/ fc
20 equal to 0.72 compared to 0.79 for the other mixes). The loss in split-
ting tensile strength was greater in CRG than in RC, notably in compositions C10FC and C15FC (with
fctT/ fct
20 equal to 0.43 and 0.49, respectively, compared to 0.59 for the other mixes);
3. It was at exposure temperature of 800 ºC that CRG compositions underwent the largest decline
in residual strength as compared to that of RC. This is due to the fact that RG deteriorate at higher tem-
peratures, thereby creating a void-like state inside the concrete (which contributes very little to retaining
strength). Residual compressive strength would appear to decrease as RG proportion is increased, con-
trary to what was observed with the splitting tensile strength. This trend may be linked to the different na-
ture and inherent variability of the mechanical properties and of the very tests used to determine them;
4. Most of CRG’s fire reaction properties studied were influenced by the time of ignition. This
property, in turn, is influenced by the incident heat flux and the proportion of RG used. In general, the
proportion of RG was seen to influence the depreciation of the different fire reaction properties (HRR;
remaining mass, SEA and CO2), particularly in the case of higher replacement rates and incident heat
fluxes. The estimated fire reaction classes (A2 or B) reveal that the end use limitations for CRG pertain to
their use in structures of ceilings and stairs and, at a non-structural level, to wall and ceiling coatings in
places that pose a greater risk of having a fire break out and spreading;
5. Consequently, despite the decrease in the CRG’s residual mechanical properties when compared
to RC after thermal exposure at higher temperatures (800 ºC), this is not considered relevant enough to
prevent it from being used in structural applications. The CRG’s fire reaction class shows that fire safety
regulations impose few restrictions on their end use limitations.
5. References
Akasaki, J.; Marques, A.; Ricci, E.; and Trigo, A. (2006) - Mechanical strength of concrete made with recycled rub-
ber subjected to high temperatures (in Portuguese). XXXII South-American Conference on Structural Engineering,
Extended Abstract
14
UNESP, Campinas, Brazil, pp. 10;
ASTM E1354 (2004) - 10a Standard test method for heat and visible smoke release rates for materials and products
using an oxygen consumption calorimeter. American Society for Testing and Materials, West Conshohocken, PA, USA;
Barluenga, G.; Hernández-Olivares, F. (2004) - Fire performance of recycled rubber-filled high-strength concrete.
Cement and Concrete Research, Vol. 34, No. 1, pp. 109-117;
Brito, J. de; Branco, F.; Neves, I. C.; Baptista, A. (1986) - Behaviour of reinforced concrete under the action of fire -
A case study. Paper presented at the conference “Materials 87” (in Portuguese), Braga, Portugal, pp. 2-3;
Eurocode 1 (2002) - Actions on structures - Part 1.2: General actions - Actions on structures exposed to fire, CEN,
Brussels, Belgium;
Eurocode 2 (2003) - Design of concrete structures - Part 1.2: General rules - Structural fire design, CEN, Brussels,
Belgium;
Georgali, B.; Tsakiridis, P. E. (2005) - Microstructure of fire-damaged concrete. A case study, Cement Concrete
Composite, Vol. 4, No. 27, pp. 255-259;
ISO 5660 (2002) - Reaction to fire tests - heat release rate, smoke production and mass loss rate. Part 1: Heat release
rate (cone calorimeter method). International Standards Organization, Geneva, Switzerland;
Khoury, G. A. (2000) - Effect of fire on concrete and concrete structures. Progress in Structural Engineering and Mate-
rials, Vol. 2, No. 4, pp. 429-447;
LNEC E-237 (1970) - Aggregates: Los Angeles abrasion test (in Portuguese), National Laboratory of Civil Engineer-
ing (LNEC), Lisbon, Portugal;
NP EN 933-1 (2000) - Geometric property tests for aggregates: Grading size analysis. Sieving method (in Portuguese),
National Quality Institute (IPQ), Lisbon, Portugal;
NP EN 933-2 (1999) - Geometric property tests for aggregates: Calculation of granulométrica distribution. Testing
sieves, nominal hole size (in Portuguese), National Quality Institute (IPQ), Lisbon, Portugal;
NP EN 933-4 (2002) - Geometric property tests for aggregates: Particle shape determination. Shape index (in Portu-
guese), National Quality Institute (IPQ), Lisbon, Portugal;
NP EN 1097-3 (2000) - Tests for mechanical and physical properties of aggregates: Method to determine density and
voids (in Portuguese), National Quality Institute (IPQ), Lisbon, Portugal;
NP EN 1097-6 (2003) - Tests for mechanical and physical properties of aggregates: Determination of density and water
absorption (in Portuguese), National Quality Institute (IPQ), Lisbon, Portugal;
NP EN 12350-2 (2002) - Testing fresh concrete: Slump test (in Portuguese), National Quality Institute (IPQ), Lisbon,
Portugal;
NP EN 12350-6 (2002) - Testing fresh concrete: Density (in Portuguese), National Quality Institute (IPQ), Lisbon,
Portugal;
NP EN 12390-3 (2003) - Testing hardened concrete: Compressive strength of test specimens (in Portuguese), National
Quality Institute (IPQ), Lisbon, Portugal;
NP EN 12390-6 (2003) - Testing hardened concrete: Tensile splitting strength of test specimens (in Portuguese), Na-
tional Quality Institute (IPQ), Lisbon, Portugal;
Ministry of Internal Administration (2008) - Diary of Republic - I, nº. 220 - 12/11/2008 - Decree-Law No. 220/2008;
Ministry of Internal Administration (2008) - Diary of Republic - I, nº. 250 -29/12/2008 - Decree No. 1532/2008;
Humphrey, D. (1995) - Civil engineering applications of chipped tires, ASCE, Department of Civil and Environmental
Engineering, University of Maine, Maine, USA, pp. 2-20;
Van Hees, P.; Hertzberg, T.; Hansen, A.S. (2002) - Development of a screening method for the SBI and room corner
using the cone calorimeter, SP report, pp. 1.