Final Report Three Gorges Dam in Hubei, Chinazkanemoto/ThreeGorges.pdf · 2014-04-03 · meet...
33
Economic Analysis of Public Policy Professor Yoshitsugu Kanemoto Graduate School of Public Policy, University of Tokyo Final Report Three Gorges Dam in Hubei, China: A Cost and Benefit Analysis Felipe Francisco De Souza Graduate School of Engineering, University of Tokyo Baozhi Gu, Kenji Kurotobi Graduate School of Public Policy, University of Tokyo Yuri Kim Graduate School of Frontier Sciences, University of Tokyo August 2013
Transcript of Final Report Three Gorges Dam in Hubei, Chinazkanemoto/ThreeGorges.pdf · 2014-04-03 · meet...
Economic Analysis of Public Policy
Professor Yoshitsugu Kanemoto
Graduate School of Public Policy, University of Tokyo
Final Report Three Gorges Dam in Hubei, China:
A Cost and Benefit Analysis
Felipe Francisco De Souza Graduate School of Engineering, University of Tokyo
Baozhi Gu, Kenji Kurotobi
Graduate School of Public Policy, University of Tokyo
Yuri Kim Graduate School of Frontier Sciences, University of Tokyo
August 2013
Executive Summary Situated on a canyon known as the Three Gorges in Hubei, China, Yangtze River’s Three Gorges
Dam is the world’s largest power station in terms of installed capacity (22,500 MW). The project
was initiated by the Chinese government in 1994, with the support of different international
cooperation agencies, for three main reasons. First of all, it would generate hydroelectricity to
meet China’s rapidly increasing demand. Second, the Three Gorges Dam would protect millions
of people living along the river from potential floods. And finally, it would transform a 600-
kilometre stretch of the fast-flowing river into a smooth navigable waterway for vessels and
provide business opportunities to western landlocked provinces.
The Chinese government regards this project as a historic engineering, social and economic
success, with the design of sophisticated large turbines, and a move toward limiting greenhouse
gas emissions. However, the dam has been a controversial topic, the reason why a cost and
benefit analysis was developed to understand all possible variables related to this gigantic project
and its complicated development process. For the evaluation of major benefit components,
special care was taken to understand flood control (and dam’s capacity to control 100 years
events); electricity generation (and the reduction of CO2 emissions); and the enhanced shipping
capacity (allowing the transit of large quantities of cargos). For the evaluation of major costs
components, special care was taken to understand the costs related to dam’s construction (and its
maintenance); people’s resettlement and displacement (from rural to urban areas); environmental
degradation (mainly water pollution, sedimentation and ecosystem disruption); loss in
archeological sites (and cultural heritage); and the potential risk caused by earthquakes.
On one hand, the advantage to study the Three Gorges Dam was the large amount of data
and sources available, being possible to evaluate the project according to financial and economic
appraisals and according to four-sensitivity analysis scenarios, two with 5% and two with 10%
discount ratio. On the other hand, some components were difficult to calculate due to unclear or
diverse methodologies, or even subjectivities like social capital losses, production relationships,
culture and kinship networks, and also due to uncertain predictions, like the probability of the
occurrence of an earthquake. As final results, considering maximum benefits and minimum costs,
cost-benefit ratio was 1.79 (10%) and 3.22 (5%), and considering minimum benefits and
maximum costs, ratio was 0.31 (10%) and 0.49 (5%). In case of the financial appraisal, the cost-
benefit ratio was 1.13, which was in the midst of cost-benefit ratio in the both cases.
1
Table of Contents 1. Introduction ............................................................................................................................... 2 2. Major benefit components ....................................................................................................... 4
2.1. Flood control ...................................................................................................................... 4 2.2. Electricity generation ......................................................................................................... 5 2.3. Reduction in CO2 emissions .............................................................................................. 8 2.4. Enhanced shipping capacity ............................................................................................... 9
3. Major cost components........................................................................................................... 11
3.1. Dam construction and maintenance ................................................................................. 11 3.2. People resettlement .......................................................................................................... 12 3.3. People displacement......................................................................................................... 13 3.4. Environmental degradation .............................................................................................. 15 3.4.1. Water pollution ...................................................................................................... 15
3.4.2. Sedimentation ........................................................................................................ 16 3.4.3. Ecosystem disruption ............................................................................................ 16 3.5. Loss in archaeological sites ............................................................................................. 17 3.6. Externalities and risks ...................................................................................................... 19
3.6.1. Potential damage: earthquakes ............................................................................... 19 4. Financial and economic evaluation ....................................................................................... 20
4.1. Financial evaluation ......................................................................................................... 20 4.2. Economic evaluation ........................................................................................................ 21 4.3. Horizon value ................................................................................................................... 21 4.4. Sensitivity analysis........................................................................................................... 21
5. Conclusions .............................................................................................................................. 22 Acknowledgements ..................................................................................................................... 24 References .................................................................................................................................... 25 Appendix I – Maps of the Three Gorges Dam............................................................................. 27 Appendix II – Summary Table on Cost/Benefit Methodology Pros/Cons .................................. 28
2
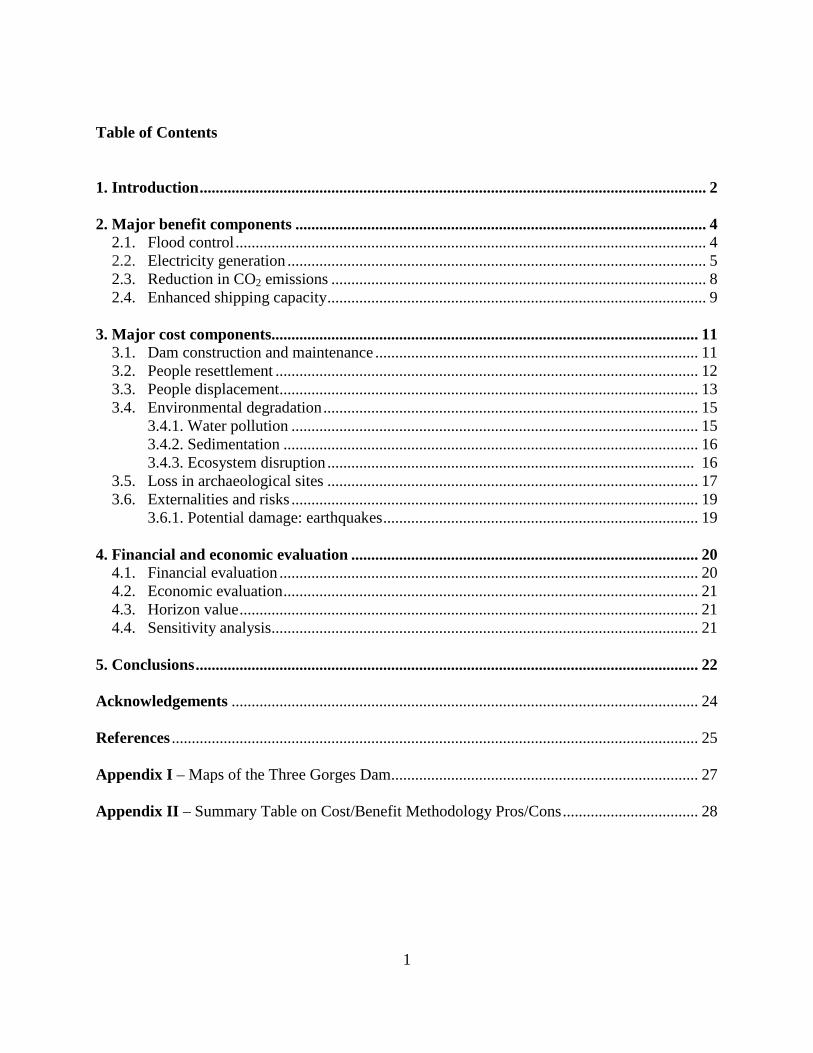
1. Introduction
Three Gorges Dam, located on a canyon known as the Three Gorges along the Yangtze River in
the province of Hubei, China, is the world’s largest hydroelectric power plant in terms of
installed capacity (see Appendix I for the map and the location of the dam). The construction is
divided into three stages, as below.
Phase Year Construction stage Water
level (m)
Preparatory
Phase
1993 66
Phase I
(1994-
1997)
1994 Earthmoving starts; inauguration ceremony. 66
1995 Concrete longitudinal cofferdam building starts; resettlement
program is launched.
66
1996 Xiling bridge, four-line highway from Yichang, and Yichang
airport are into service. Transverse cofferdams building starts.
66
1997 Closure and diversion of the river; about 100,000 people have
been resettled.
66
Phase II
(1998-
2003)
1998 Temporary ship-lock is put into operation. 66
1999 Excavation of the double-lane ship-lock is finished; about
230,000 people have been resettled.
66
2000 About 295,000 people have been resettled. 66
2001 About 325,000 people have been resettled. 66
2002 The diversion channel is closed; left bank concrete pouring
completed, about 640,000 people resettled.
66
2003 The reservoir is filled up to 135 m pool level; first trials with
the double lane ship-lock; the four first generators are
connected to the grid.
135
Phase III
(2004-
2009)
2004 The double-lane ship-lock is put into operation; ten turbines are
already connected to the grid.
139
2005 Left bank powerhouse completed (14 turbines in operation). 139

3
2006 Concrete pouring on the right bank is finished; the reservoir is
filled up to 156 m.
156
2007 Fill the reservoir up to 156 m; ship-lift construction started. 156
2008 The reservoir was filled up to 175 m pool level. 175
2009 26 turbines fully operational; target for completion of the whole
project.
175
O&M 2012 The underground power plant connected to the grid. 175
2014 Ship-lift will put into operation (expected).
175
Table 1. Construction phases of the Three Gorges Dam
Source: Ponseti and López-Pujol (2006, p. 158), reproduced and updated by the authors
Chinese government with the support of international credit agencies for three main
reasons initiated this project. First of all, the Three Gorges Dam would protect millions of people
and their livelihood along the river from potential floods. Second, it would generate about 20
terawatts of hydroelectricity to meet China’s rapidly increasing demand for electricity. Finally, it
would transform a 600-kilometre stretch of the fast-flowing river into a smooth navigable
waterway for large vessels and provide business opportunities to landlocked provinces in the
western China. The project is considered as a symbol of modern engineering combined with
mega scale construction.
Nevertheless, the dam has remained as a controversial topic both within China and outside
the country for several reasons. The project is criticized to incur excruciatingly high investment
so that it can never be covered by current level of tariff, which is unrealistically controlled by the
government. It is also targeted by human rights activists for displacing around 1.2 million people
without proper consideration of economic and social costs that they have to bear. Many
environmental activists claim a huge change in nearby ecosystems would create a huge external
cost. Also, the reservoir that flooded 12 cities, 140 towns, and 1,500 villages, also flooded
invaluable archaeological and cultural sites that can never be recovered. Finally, it has many
risks involved, including landslides and earthquakes.
Therefore, this study seeks to find out the overall cost and benefit of the Three Gorges
Dam by dissecting the project into major benefit components and cost components. Also, it will
4
take into account factors that may influence the performance of the dam such as risks and
externalities. Each benefit and cost component will include brief explanation, problems in
measurement, methodology for monetization, and maximum and minimum value. Furthermore,
pros and cons of the project for each component will be analyzed based on existing literature.
Benefit components will end by presenting the hypothetical ‘without’ case in comparison to the
actual ‘with’ case. Then, after using the appropriate social discount rate within the context, the
net present value of each component will be calculated. Based on this calculation, the financial
and economic evaluation of the project will be conducted to find out the feasibility of the project.
2. Major benefit components
2.1. Flood Control
Flood control is the first purpose of the original plan because Yangtze River has caused some of
China's worst natural flood disasters. In 1954, Yangtze floods killed 30,000 people (Fung 1999).
The heavy rains and flooding along the Yangtze River damaged 100,000 houses, toppled 34,000
houses, inundated 1.13 million hectares of farmland (causing a grain output loss of 880,000 tons),
forced more than 2,000 companies to limit production, killed 5,200 livestock, and induced
economic losses of more than 4.6 Billion Yuan in less than one month 1. Moreover, the change
of river flows is one of factors of droughts and floods, which in turn affect the stability of
agricultural production and water supply 2. Therefore, Three Gorges Dam is expected to control
the river’s flooding capacity “from the present 10-year frequency to 100-year frequency” 3, and
the result would be reduction in the area flooded and the prevention of any consequent loss of
life, social disruption, health impacts and economic losses 4.
Methodology: for the benefit calculation, the general mean annual benefit from flood
control was the key variable. The following is the function of the flood control 5 : FI =
FB (Billion Yuan/Year) (FI indicates the benefit from flood control, and FB shows the mean
annual benefits from flood control). Luk and Whitney (1993) estimated the minimum value of
1 See http://www.irn.org/programs/threeg/991029.central.html 2Allin (2004), p.16 3 Morimoto and Hope (2003), p.3 4 World Commission on Dams (2000) 5 Morimoto and Hope (2003) p.20
5
mean annual benefits from flood control as $0.76 billion Yuan per year. So, the minimum net
present value (NPV) of flood control amounts to $3.48 billion Yuan (with 10% discount ratio) or
8.96 billion Yuan (with 5% discount ratio) 6. The maximum benefit of flood control is assumed
as “if an exceptionally huge flood similar to that of 1870 should occur, the project would reduce
losses caused by inundation by $35 billion Yuan, and also prevent a great number of casualties
caused by burst dikes” (Rulan et al 1997) 7. But, according to the statement of Rulan et al (1997),
the maximum value is assumed similar to the 1870 flood. It implies that the flood, which may
occurs once in 100 years, would happen every year and the average benefit of flood control
would be too large. The Net Present Value of flood control amounts to about 160 billion Yuan
with the discount rate of 10% and 412 billion Yuan with the discount rate of 5%.
Limitations: critics states that the Three Gorges Dam is located at the end of the upper
reaches, controlling only 55% of the Yangtze River; while the Sanmenxia Dam, which is also
designed to control floods in the Yellow River, can control over 92 % of its watershed (Dai,
1994). It means that the Three Gorges Dam would not be able to protect from big floods like
those in 1954 and 1998 (Dai, 1994; McCormack, 2001) 8. Therefore, some authors remain
skeptical if the location of the TGD covers the river major areas that cause flooding. Additionally,
the people in the reservoir area face an increased risk of flooding without any compensation. But,
if compensation were provided, the project's cost would increase by 20 percent 9.
As without TGD case, we can imagine a riverbank through Yangtze River with several
small and middle size dams. These dams might be flexible because even if one of these dams
broke by 10-year frequency flooding, the others can help to manage the flood. So it is expected
to restrict the realm of the area that receives flooding. This scenario with multiple dams can
disperse the risk of flood disaster. However, it is doubtful if the small and medium sized dam can
control the 100-year frequency big flooding like the one in 1870 (so this type of dam doesn't
necessarily clear out the risk of flooding).
2.2. Electricity generation
6 Morimoto and Hope (2003), p.20 7 Morimoto and Hope (2003), p.27 8 Ponseti and Lopez-Pujol (2006), p.163 9 Barber and Grainne (1998), p.42
6
Power generation is officially the second purpose mentioned by the original plan. Skyrocketing
demand for electricity caused by rapid industrialization of the national economy put much
pressure on the construction of thermal power plants which can be built and supply the electricity
in a shorter period. However, due to the limited coal resources of China and the high pollution
associated with coal-burning power plants, there was an increasing importance of developing
alternative sources of energy. The hydropower, viewed as a cleaner source of energy compared
to coal, began to get attention as a middle and long-term solution 10.
The Three Gorges Dam is equipped with 26 sets of hydro turbine generators with a
capacity of 700MW each on the left and right banks. Additionally, it has 6 underground
turbines11. Each turbine is the world’s largest turbine and also all together, the dam is the
world’s largest dam in terms of installed capacity and the actual generation 12. On the first
feasibility study of 1989, the dam was expected to serve about 10% of the total national power
consumption. However, due to the long construction span, the electricity consumption rose
exponentially in China and the power generation from the Three Gorges Dam can only
contribute about 1.7% of the total national consumption in 2011 13.
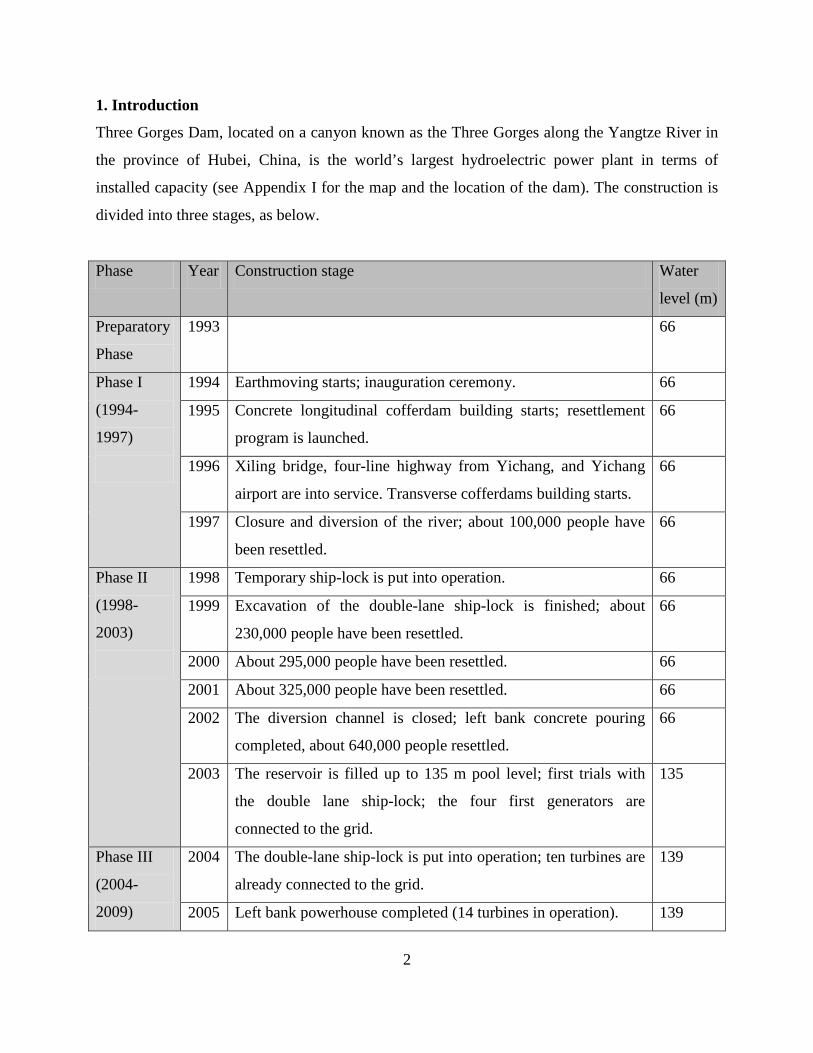
Methodology: For benefit calculation, the annual electricity generation up to 2012 is
collected from the official website of Chinese government 14. The minimum is assumed to be the
2012 level for the rest of the 50 years. The installed capacity of 22.5GW, though it is unrealistic
that a dam can have a capacity factor of 1 producing at its full capacity, is set as the maximum
level 15. Then, the estimated production is multiplied by the onto-grid electricity price of $0.25
Yuan per kWh to be expressed as money value 16. In this subchapter, the direct benefit from the
electricity is calculated for simplicity. The related issues such as social benefit caused by reduced
10 Ponseti and Lopez-Pujol (2006), p. 165 11 Wang (2002) p.374 12 Chang, Liu and Wei (2010), p.4405 13 Annual production of the Three Gorges Dam in 2011 (Zhangjin 2012) is 78.29 Bln KWh. CRI English Retrived from <http://english.cri.cn/6909/2012/01/07/ 1461s675113.htm>. Annual consumption of China (2012) “能源局: 2011年全社会用量累达46928千瓦”. Retrived from <http://www.gov.cn/gzdt/2012-01/14/content_2044324.htm> 14 <http://www.gov.cn/> 15 The efficiency of hydroelectricity plant can be expressed as capacity factor that is the ratio of its actual output over a period of time divided by the full capacity over the same period. 16 Chang, Liu and Wei (2010), p.4405
7
CO2 and potential damage by sedimentation are dealt in the separate subchapter in the latter part
of this research.
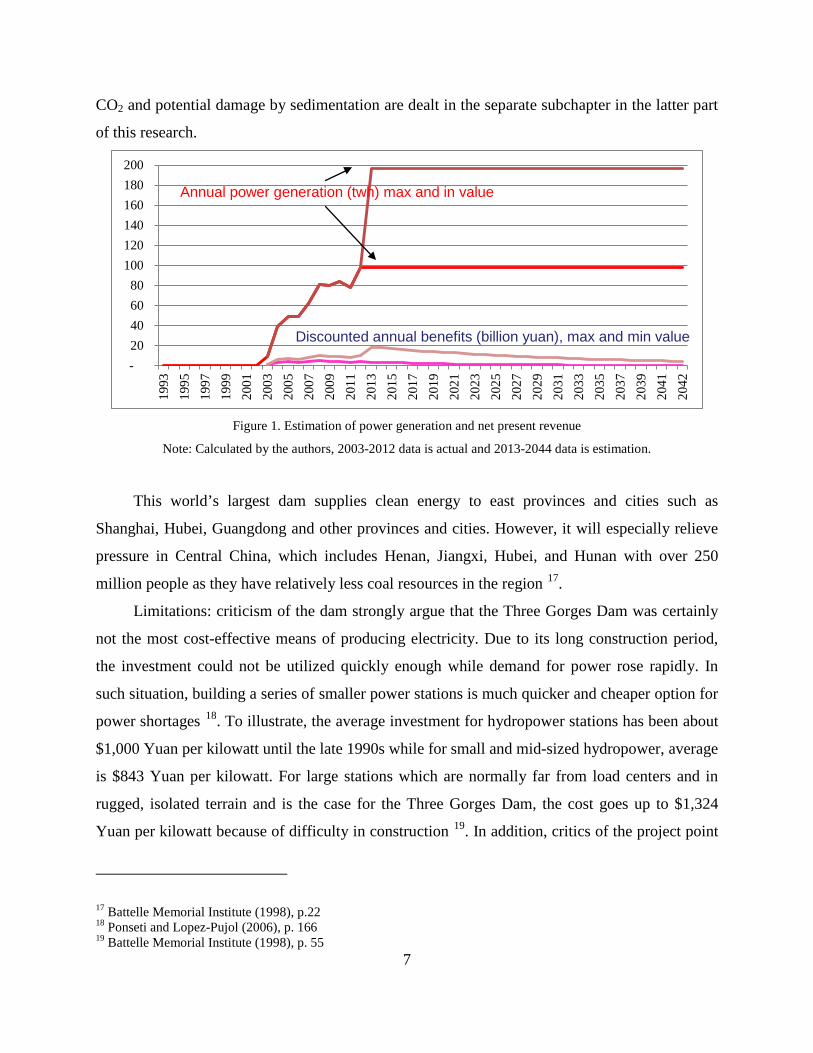
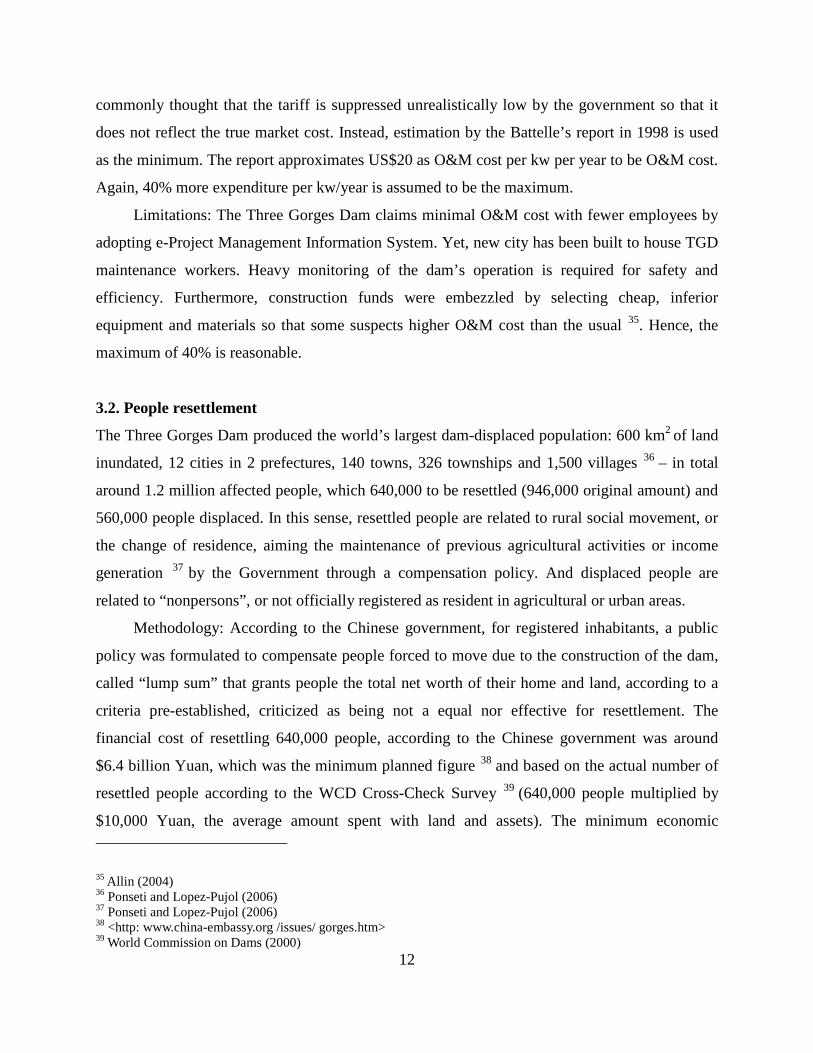
Figure 1. Estimation of power generation and net present revenue
Note: Calculated by the authors, 2003-2012 data is actual and 2013-2044 data is estimation.
This world’s largest dam supplies clean energy to east provinces and cities such as
Shanghai, Hubei, Guangdong and other provinces and cities. However, it will especially relieve
pressure in Central China, which includes Henan, Jiangxi, Hubei, and Hunan with over 250
million people as they have relatively less coal resources in the region 17.
Limitations: criticism of the dam strongly argue that the Three Gorges Dam was certainly
not the most cost-effective means of producing electricity. Due to its long construction period,
the investment could not be utilized quickly enough while demand for power rose rapidly. In
such situation, building a series of smaller power stations is much quicker and cheaper option for
power shortages 18. To illustrate, the average investment for hydropower stations has been about
$1,000 Yuan per kilowatt until the late 1990s while for small and mid-sized hydropower, average
is $843 Yuan per kilowatt. For large stations which are normally far from load centers and in
rugged, isolated terrain and is the case for the Three Gorges Dam, the cost goes up to $1,324
Yuan per kilowatt because of difficulty in construction 19. In addition, critics of the project point
17 Battelle Memorial Institute (1998), p.22 18 Ponseti and Lopez-Pujol (2006), p. 166 19 Battelle Memorial Institute (1998), p. 55
- 20 40 60 80
100 120 140 160 180 200
1993
1995
1997
1999
2001
2003
2005
2007
2009
2011
2013
2015
2017
2019
2021
2023
2025
2027
2029
2031
2033
2035
2037
2039
2041
2042
Annual power generation (twh) max and in value
Discounted annual benefits (billion yuan), max and min value
8
out that so much energy is currently wasted in China so that the immediate solution should be
improving energy services, rather than building new generate plants. In fact, the estimated
amount of electricity saved by increasing efficiency of the system and adjusting the tariff level
mounts up to 270 terawatt-hours. That is nearly four times the output at Three Gorges 20.
As without case, if only electricity generation aspect was considered, which means using
other cheaper means such as coal or smaller dams, to generate power, it could have been much
more cost-effective. Yet, it is unfair to relate the cost of large plants such as the Three Gorges
Dam with the costs for electricity since features like flood control and shipping improvements
were added to the total cost and the allocation of capital investment costs, therefore, it is difficult
to do precise calculation for the electricity part only.
2.3. Reduction in CO2 emissions
China’s thirsty for energy has never been satiated since the economic boom in 1990s. To meet
the increasing demand for energy, there are several alternative ways. Let’s differentiate into two
cases. One case is for energy produced by hydroelectric station, hereafter we call it with case; the
other is for energy produced by other means other than hydroelectric station, hereafter we call it
without case.
As without case, now coal accounts for more than 80% of the energy consumption in
China. The burning of coal to generate electricity produces CO2. According to the current
technological level in China, to generate 1 KWH unit of electricity by burning coal in a
thermoelectric power station, 0.86 kg CO2 is produced and emitted to the atmosphere 21.
As with case, CO2 coming from the electricity generation by hydroelectric station could be
neglected. The operation of TDG will decrease the use of coal to generate electricity, thus
decreasing CO2 emission. The electricity generation by TDG could be divided into 3 periods.
First period is from 2003 to 2006 with average of 50 billion KWH electricity generated per year
when TDG started to generate electricity after the impoundment of the Yangtze River in 2003.
Second period is from 2007 to 2009 with average of 80 billion KWH electricity generated per
year when TDG construction was completed in 2008. Third period is from 2010 to 2044 with
20 Paranjpye (1992) 21 <http://zhidao.baidu.com/question/248505532.html>
9
average of 100 billion KWH electricity generated per year when all the turbines installed in TDG
would be put into operation.
Methodology: To calculate the benefit from reduction in CO2 emission, we assume the
burning of coal would otherwise have generated all the electricity generated by TDG. Then, we
need to know the price of carbon emission (since China is a developing country under Kyoto
Protocol, it shoulders no responsibility to reduce carbon emission; as result, there is no market
and price for carbon emission transactions). Internationally, price in European Union Emissions
Trading Scheme has been fluctuating fiercely in the past several years with the highest as $32
euros per ton in 2006 and lowest $1 euro per ton in 2012. Taking into consideration the
development level in China, we set the shadow price for carbon emission as between $10 Yuan
and $30 Yuan 22. Thus, under the 10% discount rate, the NPV for reduction in carbon emission is
between minimum $5,902,930,032 Yuan and maximum $9,499, 632,086 Yuan.
Limitations: Since there is no market and price for carbon emission in China, we had to use
price in European Union Emissions Trading Scheme as our reference price. This is debatable
because in reality the energy generated by TGD is consumed in China rather than transmitted to
Europe. However, as China is trying to build up its carbon emission market 23, the price of
carbon emission will become more accurate in the future.
2.4. Enhanced shipping capacity
Western part of China is landlocked and rugged and has underdeveloped transportation
infrastructure compared to that of coastal regions in eastern China. Thus, transporting goods
through the Yangtze River, the longest river in China that stretches from the Qinghai-Tibet
Plateau to the Eastern China Sea plays a vital role in the region’s economy. To illustrate, 90
percent of goods transported to Chongqing, the major city in Sichuan province is through water
transportation 24. Although it was the only reasonable and cost effective means of transporting
freight, still there are two factors that made water transportation along the upper Yangtze River
22 <http://finance.stockstar.com/JC2013061800002591.shtml> 23 The first trial carbon emission market was staged in Shenzhen in June 18, 2013 and the price for carbon emission was set at 30 Yuan per ton. 24 Gleick (2009), p.144
10
challenging and costly. First, the Three Gorges are filled with rapids. Second, during the dry
season the water level is too low for large vessels.
With the construction of large Three Gorges dam, the navigation capacity increases for two
reasons. First, the reservoir that is larger than the city of Singapore dramatically increases the
depth of water and allows 10,000 tons vessels to go up the river until Chongqing, located more
than 600 kilometers upstream of the dam (previously, only 3000 ton vessel were allowed). It is
even more valuable during the dry season. Secondly, the project included one of the largest two-
way systems of ship locks in the world and a ship-lift, permitting large quantities of cargo to
move either ways. In fact, 50 million tons of cargo passed through the new lock system up to
Chongqing, up from 18 million tons before the dam in the first year that the ship lock started its
operation in 2006 25.
Methodology: Along with the demand expansion, the official feasibility study asserts the
overall shipping cost to reduce by 30% due to slower river flow. The speed of river decreases to
about one-tenth. Yet, the study acknowledges the variance of shipping capacity depending on
water level. Also, there is a controversy over how much the cost will decrease. Hence, for the
minimum, the lowest estimation of cargo passing times reduction of 25% in costs is assumed.
For maximum, the maximum shipping capacity expected by the official feasibility study is a 37%
of reduction claimed by the company, as for the price fall is applied 26. For both, the shipping
cost of $122.85 Yuan per ton is used for monetization 27. We assumed no change in value during
the construction period of 1994-2003, as the company guarantees the smooth navigation at the
construction site by opening temporary ship locks.
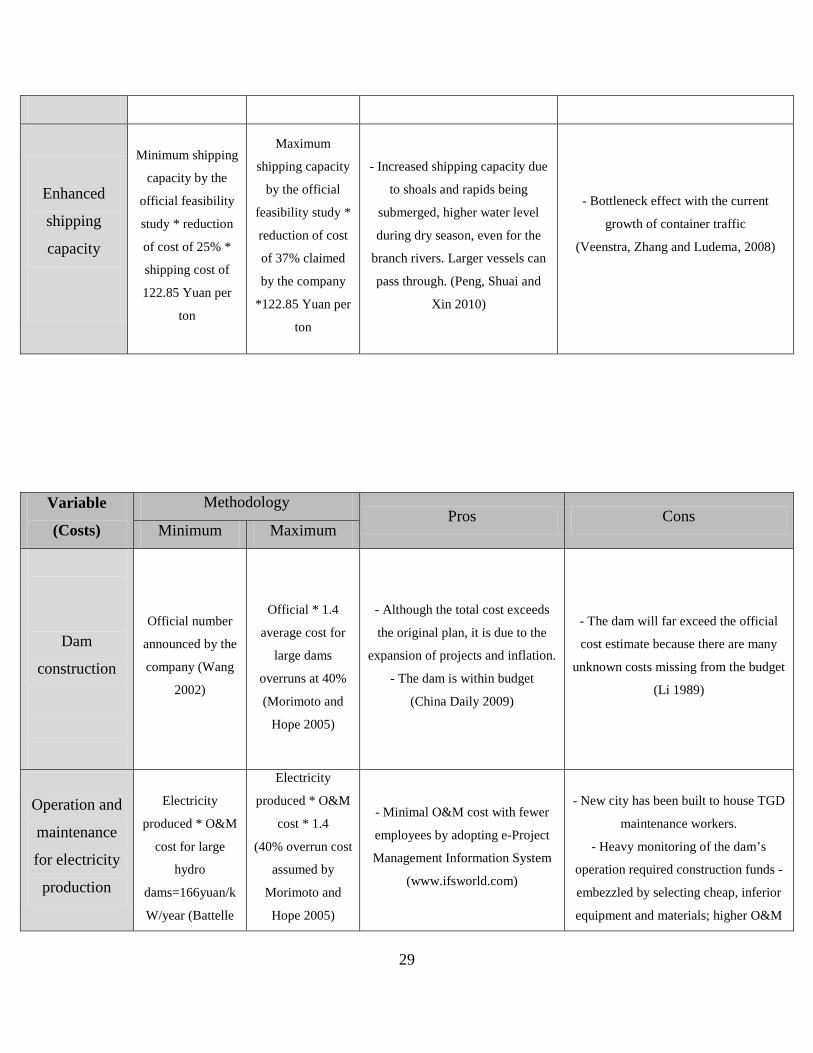
Limitations: Peng et al. (2010) argue that benefits are larger because shipping capacity
increases greatly due to shoals and rapids being submerged, higher water level during dry season,
even for the branch rivers 28. Opponents, however, regard the benefits are much smaller due to
forthcoming bottleneck effect with fast growing container traffic (Veenstra et al., 2008) 29. In
this case, it is difficult to give accurate estimative because the threshold point where bottleneck
25 Gleick (2009), p.144 26 Wang (2002), p.369 27 The most likely is the forecasted transport costs of goods from Central to East on Yangtze in 2005 are 15 USD per ton. It is converted to Chinese Yuan by adopting the exchange rate of 8.19, which is annual average middle exchange rate in 2005. Morimoto and Hope (2004), p.216 28 Peng, Shuai and Xin (2010) 29 Veenstra, Zhang and Ludema (2008)
11
happens is unknown. Therefore, for the calculation, we assumed that there would be no
bottleneck. Also, the possibility of accidents and unexpected delays at the ship lock are ignored,
although it may significantly reduce the benefits.
Without the construction of such navigational facilities, the only alternatives would be
truck cargo which is much more expensive, both in terms of actual cost and social/environmental
costs. Also, the project would stimulate the regional economy by allowing more goods and
services to flow into the region. For example, reduction in freight cost can enhance
competitiveness of producers in the region while for consumers, the retail prices fall and the
consumer surplus may enlarge.
3. Major cost components
3.1. Dam construction and maintenance
Gleick (2009) states that it is no longer possible to estimate the total cost of the Three Gorges
Dam with definitive numbers because of the complexity of the intertwined nature of the
expenditures and expenditures made unofficially 30. China Daily sees that although the total cost
exceeds the original plan of 1989, it is due to the expansion of projects and inflation. The dam is
within the adjusted budget 31.
Methodology: Therefore, for the calculation for minimum, we assume that it is what the
company admits as the cost, which is 55.6% of $204 billion Yuan – i.e. $113 billion Yuan 32. For
maximum, Morimoto and Hope (2005), takes 1.4 as multiplier. This is based on the fact that
large hydropower projects commissioned between 1915 and 1986 financed by the World Bank
show average cost overruns 40% 33. Since the power generation, there must be operation and
maintenance cost incurred. From the tariff rate of $0.25 Yuan/kwh, $0.20 Yuan is said to be cost
of operation, depreciation, financing and taxation 34. $0.2 Yuan per kWh multiplied by the
electricity generated could have been used for the O&M. This method was disregarded since it is
30 Gleick (2009), p.141 31 Three Gorges Project spending within budget (2009, September 14). China Daily. Retrieved from <http://www.chinadaily.com.cn/china/2009-09/14/content_8687672.htm> 32 Wang (2002), p.370 33 Morimoto and Hope (2005), p.215 34 Chang, Liu and Wei (2010), p. 4405
12
commonly thought that the tariff is suppressed unrealistically low by the government so that it
does not reflect the true market cost. Instead, estimation by the Battelle’s report in 1998 is used
as the minimum. The report approximates US$20 as O&M cost per kw per year to be O&M cost.
Again, 40% more expenditure per kw/year is assumed to be the maximum.
Limitations: The Three Gorges Dam claims minimal O&M cost with fewer employees by
adopting e-Project Management Information System. Yet, new city has been built to house TGD
maintenance workers. Heavy monitoring of the dam’s operation is required for safety and
efficiency. Furthermore, construction funds were embezzled by selecting cheap, inferior
equipment and materials so that some suspects higher O&M cost than the usual 35. Hence, the
maximum of 40% is reasonable.
3.2. People resettlement
The Three Gorges Dam produced the world’s largest dam-displaced population: 600 km2 of land
inundated, 12 cities in 2 prefectures, 140 towns, 326 townships and 1,500 villages 36 – in total
around 1.2 million affected people, which 640,000 to be resettled (946,000 original amount) and
560,000 people displaced. In this sense, resettled people are related to rural social movement, or
the change of residence, aiming the maintenance of previous agricultural activities or income
generation 37 by the Government through a compensation policy. And displaced people are
related to “nonpersons”, or not officially registered as resident in agricultural or urban areas.
Methodology: According to the Chinese government, for registered inhabitants, a public
policy was formulated to compensate people forced to move due to the construction of the dam,
called “lump sum” that grants people the total net worth of their home and land, according to a
criteria pre-established, criticized as being not a equal nor effective for resettlement. The
financial cost of resettling 640,000 people, according to the Chinese government was around
$6.4 billion Yuan, which was the minimum planned figure 38 and based on the actual number of
resettled people according to the WCD Cross-Check Survey 39 (640,000 people multiplied by
$10,000 Yuan, the average amount spent with land and assets). The minimum economic
35 Allin (2004) 36 Ponseti and Lopez-Pujol (2006) 37 Ponseti and Lopez-Pujol (2006) 38 <http: www.china-embassy.org /issues/ gorges.htm> 39 World Commission on Dams (2000)
13
appraisal estimated was 47 billion Yuan, based on a value 47% higher on the actual number of
resettled people, according to WCD Survey and among the projects financed by the World Bank
(therefore, 1.47 increase due to the total affected population, plus 5 times the necessary value to
compensate productivity before the dam construction – to replace 400,000mu (1ha=15mu) of
fertile land it would necessary to replace it for 2,000,000mu in low upslope area (640,000 x
10,000 x 1.47 x 5= 47 billion Yuan)). The maximum economic appraisal estimated was 93
billion Yuan 40 estimated as the minimum estimative but with a value 94% higher on the actual
number of resettled people. The NPV of the social cost of resettled people is between minimum
$33,999,004,011 Yuan and maximum $45,188,664,238 Yuan with a discount rate of 10%.
Limitations: There are many studies on how to estimate resettlements and most diverge on
concept and meaning. China’s record of resettlement is not good, and government admitted that
past resettlements have been plagued with “mistakes such as uncoordinated management,
duplicate development, wasteful use of volunteer labor, and limited funds” 41. The government
argued that “resettlement construction and development would spur growth in the area bordering
the reservoir” encouraging development of the region with resettlement funds. But,
fundamentally, the problem was that the best fertile lands were located in the valleys, flooded by
the reservoir, and the government promoted the resettlements in the remaining land, further
uphill, too steep to cultivate properly, and relatively infertile. Also, a factor that contributed to
some of the early challenges with TGD resettlement was local government corruption, which led
to significant resettlement funds ending up in the pockets of government officials, rather than
passing to the resettlers 42.
3.3. People displacement
A displaced person, who has been forced to leave his native place, presents a permanent loss of
social connections and must face several cultural, social and economic challenges. Including
these costs in a CBA is not easy, and requires estimative using market and non-market valuation
studies. In the particular case of Three Gorges Dam, Chinese government apparently had no
intention of providing resettlement benefits to “nonpersons”, who are not officially registered as
40 Morimoto and Hope (2003), p.11 41 Barber and Grainne (1998) 42 Ponseti and Lopez-Pujol (2006)
14
resident in agricultural or urban areas, considered illegal migrants not include in the official
survey. According to the WCD Cross-Check Survey 254,000 people is the total floating and
illegal population (174,000 and 80,000 respectively) affected by the dam construction. Mainly
inhabitants target of orderly involuntary migration: population from upstream to downstream due
to urban flooded or lack of rural land; and, also, 306,000 people target of the resettlement
program that did not receive proper compensation, reaching a total of 560,000 people displaced.
Methodology: for economic appraisal on displaced people it was considered all the
population target of involuntary and government-oriented migration: people non-officially
registered (non-registered and illegal immigrants), and people resettled in urban downstream to
engage in secondary and tertiary activities due to the lack of proper compensation or available
fertile land. In this sense, the difference between resettle and displaced social costs calculation is
the notion of “replacement value”. The difference between “compensation” and “replacement
value” is that the latter equals to market value of total assets and includes intangible assets such
as social capital losses, production relationships, culture and kinship networks 43, which are
difficult to measure or to evaluate without proper survey or additional data. In this sense, for this
research we will consider the set of variables and values for displaced people according to
intangible assets and other analytical social costs provided by other authors as a fixed cost 44.
Therefore, the fixed economic appraisal for the displacement of 560,000 people was estimated in
53.7 billion Yuan, (560,000 x 96,000 fixed cost per capita 45= $53 billion Yuan). The NPV of the
social cost of replaced people is $37,616,848,051 Yuan with a discount rate of 10%.
Limitations: There are innumerous difficulties to evaluate social costs in displacement
scenarios. Pervasive and systematic failure to assess the range of potential negative impacts and
implement adequate mitigation have led to the impoverishment and suffering of thousands,
giving rise to growing opposition to dams by affected communities worldwide. Especially in
case of migration, farmers and fishermen lack skills and techniques to work in industries or other
jobs; and also, government do not implemented complementary policies and infrastructure such
as land provision, household registration, schools and hospitals. Worthy to mention that the
43 Yan, Hugo and Potter (2005) 44 Morimoto and Hope (2003) 45 The given fixed cost per capita includes an approximation of several components, including compensation, replacement land, jobs, housing, health and, especially, training for industries and other city related jobs.
15
worst risk in measure displacement is related to the uncertainties in estimate target population
and the variations in numbers of people who deserve compensation, replacement land, jobs,
housing, and so on. Finally, a gender differentiation should be considered as women bear most of
the social costs as they are unable to achieve occupational mobility in the process of resettlement:
fewer employment opportunities, a gender-segregated labor market, low level of human capital
and social prejudice are principal causes 46.
3.4. Environmental degradation
3.4.1 Water pollution: Since the impoundment in 2003, the water quality behind the TGD has
been deteriorating. On one hand, the dam has detained approximately millions of tons of wastes
that would have otherwise flowed out to sea. In addition, TDG flooded thousands of abandoned
factories, mines, hospitals, and potential toxic waste sites after reaching its designed normal
storage water level of 175 meters. On the other hand, due to the reduced water flow, the self-
purifying function of the river also declined, which contributed to the deterioration of water
quality. Water quality monitoring results demonstrate that after impoundment the pollution
concentration reaches 49.4 mg/L from 11.14 mg/L while pollution zone extends 4 to10 km 47.
The Yangtze River and its tributaries is the main drinking water source of people living in
the Yangtze River basin and Chongqing and Hubei Province are the most directly affected by the
TGD. If the water in Yangtze River became too polluted to drink, a huge amount of money has
to be invested to control the water pollution and improve the water quality, which constitutes
social cost of the TGD.
Methodology: to calculate the social cost of the water pollution by TGD, we use the same
social cost borne by household in China’s Taihu Lake in 2007. Due to the severe proliferation of
blue-green algae in Taihu, households surrounding Taihu Lake had to pay average of $100 Yuan
per year to buy the bottled water for drinking. Survey showed that household would pay $50-100
Yuan per year to eradicate the water pollution. In the TGD case, the households affected in
Chongqing Hubei province are estimated at $20 million. The NPV of the social cost of water
46 Yan, Hugo and Potter (2005) 47 Xiong Zhongfu (2007). “The Effect of Impoundment of TGD on the Water Quality.” (In Chinese)
16
pollution is between minimum $4,579,888,289 Yuan and maximum $9,159,776,579 Yuan with a
discount rate of 10%.
Limitations: due to the time constraint, we can’t conduct a real survey in Chongqing and
Hubei province to find out how much households in these two provinces are willing to pay per
year to combat water pollution caused by the TGD. Hence, the value of WTP we used here may
not be accurate. This could be improved in the future study by field survey.
3.4.2. Sedimentation: Siltation is always a concern for any dam construction and this is
especially true in China because most of China’s rivers are full of muddy water. Because of
reduced water speed behind the dam, the sediments carried by water will settle down and cause
siltation behind the dam. Siltation could eventually cause upstream of Yangtze River
unnavigable, hinder the power generating capacity of the hydroelectric dam, and reduce the
ability of the dam to control the flood during rain season.
The cost incurred by siltation comes from 2 reasons. The first is the reduced capacity of
power generation, shipping, and flood controlling due to the siltation. The second is the cost of
dredging siltation. In 2013, first dredging of the shipping lane was conducted by the China Three
Gorges Corporation (CTGC) after TGD has generated electricity for 10 years.
Methodology: CTGC siltation budget showed that 144, 133, and 177 meters of siltation
were trapped in TGR in 2003, 2004, and 2005, respectively. With normal storage water level of
175m, the total capacity of TDG is 39.3 billion cubic meters. Hence, siltation decreased the
capacity of TDG at an annual rate of between 0.3% (based on 2004 data) and 0.4% (based on
2005 data). The NPV of cost caused by siltation is between minimum $4,637,024,169 Yuan and
maximum $6,706,692,764 Yuan with a discount rate of 10%.
Limitations: the annual decline rate of capacity caused by siltation was based on a single
year observation, thus it may prove to be inaccurate in the long run. In addition, the dredging
cost is not publicized yet, therefore, in our calculation is neglected. With more data on siltation
and dredging available in the future, the calculation will be more accurate.
3.4.3. Ecosystem disruption: The giant hydroelectric dam serves as a physical barrier that
disrupts the river ecosystem and affects biodiversity in the area due to the fragmentation of the
habitats. Some endangered species, such as Baiji dolphin and Chinese Sturgeon, which are only
17
found in Yangtze River, are driven into the brink of extinction because the dam blocks their way
back to the upstream to lag eggs. The downstream of Yangtze River has also been affected.
Decrease in freshwater flow has meant that more saltwater is creeping up the Yangtze,
endangering fish populations already threatened by water pollution and overfishing. There has
also been a loss in sediment and nutrients downstream, a common issue with most dams, which
will cause erosion to river systems, wetlands, and seacoast ecosystems.
Here we choose two representative losses as the cost of dam incurred ecosystem disruption.
First is the cost of extinction of endangered unique species. The second is the loss of commercial
fishery in Yangtze River due to the ecosystem disruption.
Methodology: for the cost of extinction of endangered unique species, we use shadow
prices suggested by BGVW, and make adjustment according to the income level, history and
people’s WTP in China. In 1980s, to save the endangered Giant Panda, government called on
everyone to donate money and the donation per person ranged from $1 to several hundred Yuan.
In this case, $1-10 Yuan per person is appropriate and the total population in China is 1.35
billion. For the cost incurred by loss in commercial fishery, we use Morimoto and Hope (2003)
data to estimate the loss, between $0.04 and $2.7 billion Yuan per year. The NPV of cost caused
by ecosystem is between minimum $6,366,044,722 Yuan and maximum $74,194,190,287 Yuan
with a discount rate of 10%.
Limitations: to determine the true cost of environmental degradation, long-term data is
needed, so that the effect of TGD can be distinguished from effects caused by other factors, such
as the general climate change, human activities, etc. In addition, the cost of erosion to river
systems, wetlands, and seacoast ecosystems is not included in the analysis due to complexity.
3.5. Loss in archaeological sites
Large dams construction have significant adverse effects on cultural heritage through the loss of
archaeological sites (temples, shrines, and sacred elements, such as landscape, artifacts and
buildings) and the submergence and degradation of archaeological resources (plant and animal
remains, burial sites and architectural elements). The Three Gorges area is a rich archaeological
and cultural heritage, documented as settlement since prehistoric times for several ancestral
18
cultures, such as the Daxi (ca. 5000-3200 B.C.), the Chujialing (ca. 3200-2300 B.C.), the
Shijiahe (ca. 2300-1800 B.C.) and the distinctive Ba culture (ca. 2000-220 B.C.) 48.
In this particular case, the dam’s construction have a significant negative effect on the
Yangtze Basin cultural heritage as it became virtually impossible to collect and document all the
archaeological sites threatened by the reservoir after its filling. In 1992, when the Chinese
Congress approved the construction of the Three Gorges Dam, among the panel of 412 experts
involved in the dam approval, no sociologist, cultural anthropologist or archaeologist were
consulted. Before the beginning of the Dam construction (1994), some archaeological campaigns
within the dam construction zone were carried out, mainly focused on aboveground cultural sites
(ancient buildings, stone sculptures, bridges, and cliff paths) and underground sites (habitation
settlements and historical cemetery complexes). In 2000, it was estimated that the area to be
inundated contained at least 1,282 cultural heritage places 49, but some recent researches argues
that the number of unexplored sites can reach 8,000. The Dam construction will imply not only a
material loss, but also an important change in the landscape, and all the information not collected
before the completion of the dam in 2009 will never be recovered.
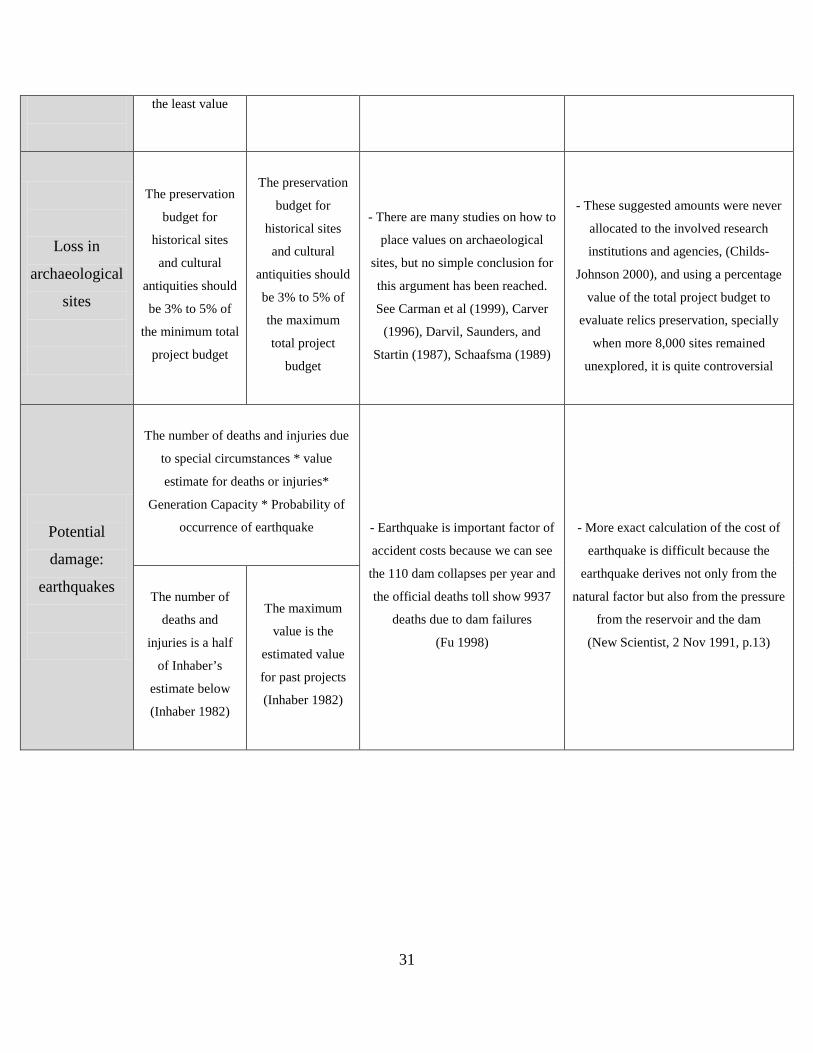
Methodology: According to international standards, the preservation budget for historical
sites and cultural antiquities should be 3% to 5% of the total project budget. Using these
recommended percentages, the budget for relics preservation had to reach an amount of at least
$1.7 billion Yuan when the Three Gorges Dam project was approved in 1992 (the initial budget
for the whole project was estimated in $57 billion Yuan), and about $4 to 5 billion Yuan at the
middle of 1990s, when the total budget of the project raised to $120 billion Yuan 50. These
suggested amounts were never allocated to the involved research institutions and agencies, and
the archaeologists were forced to agree to work with an unrealistic budget, of only about $500
million Yuan, which was clearly insufficient 51. Therefore, using the proposed methodology, as
the minimum project total costs was estimated in $204 billion Yuan, minimum appraisal for loss
in archaeological sites is $6 billion Yuan (5% of 204 billion Yuan) and the maximum appraisal
for loss in archaeological sites is $33 billion Yuan (considering maximum project total costs
48 Ponseti and Lopez-Pujol (2006), pp.173 49 Ponseti and Lopez-Pujol (2006), pp.174 50 Childs-Johnson (2000), p.53 51 Ponseti and Lopez-Pujol (2006), pp.177
19
evaluate in $660 billion Yuan). The NPV of the social cost of loss in archaeological sites is
between minimum $1,223,234,170 Yuan and maximum $6,643,357,629 Yuan with a discount
rate of 10%.
Limitations: The Three Gorges Project illustrates the potential damage to archaeological
sites through the neglect of proper actions. The combined problems of time constraints, under-
budgeting, and a shortage of qualified personnel were seriously hampering the salvation and
preservation of the impressive archaeological and cultural sites in the affected areas 52. There are
many studies on how to place values on archaeological sites, but there’s no simple conclusion for
this argument 53 and use a percentage value of the total project budget to evaluate relics
preservation, specially when more 8,000 sites remained unexplored, it is quite controversial.
3.6. Externalities and risks
3.6.1. Potential damage earthquakes: Special events such as technical failures, terrorism, and
earthquake are very rare cases so that each estimated accident costs will be multiplied by
probability of occurrence of these events. On average, we see around 110 dam collapses per year
and the official deaths toll shows 9937 deaths due to dam failures 54. Therefore, to consider the
accident cost by earthquake, it was used the probability of occurrence of an earthquake and the
cost of the earthquake based on the number of deaths, injuries, and economic impact.
Methodology: is the following 55, cost of earthquake = DDt + IDt + IDt 56, where DDt and
IDt are the number of deaths and injuries based on the amount of power generation capacity. The
maximum value of DDt and IDt are estimated value for past projects 57. Inhaber stated that
injuries per unit energy was 0.0011 – 0.0128 injuries/Mw, and the calculation for death was also
led in the similar way. The minimum values of DDt and IDt are a half of Inhaber’s estimate. So
we need to add the power generation capacity and to convert the number of deaths and injuries
52 World Commission on Dams (2000), pp.117-118 53 See Carman et al (1999); Carver (1996); Darvil, Saunders, and Startin (1987); Schaafsma (1989). 54 See Fu. S (1998) “A profile of dams in China” In: Qing (1998) 55 DDt (or IDt) = (GC*DCR'' (or MCR’’)*VD (or VM))*(P'') (for t>Tc, Million Yuan / Year), IDt = (GC*MCR’’*VM)*(P'') (for t>Tc, Million Yuan / Year): DDt (or IDt) indicates the accident costs in terms of the deaths (or injuries), DMt = ECL*(P'') (for t > Tc, Billion Yuan / Year): DMt indicates the accident costs in terms of economic loss (Morimoto and Hope, 2003) 56 Morimoto and Hope (2003), pp.20-21 57 Inhaber, H. (1982) “Energy Risk Assessment” Gordon & Breach Science Publishers

20
into the amount of money by multiplying the value of the deaths and injuries. The maximum
value of power generation capacity is the current planned installed capacity 58 and the minimum
value of power generation capacity is the energy output of Victoria Dam in Sri Lanka (about
31% lower than the planned figure 59). As for the value estimate for deaths, the maximum value
is $550 million Yuan 60 and the minimum value is the referred to the compensation for the
person who was killed by a construction, $418 million Yuan 61. In terms of the value estimate for
injuries, the minimum value is obtained from regression analysis using data from India and is
$0.03 million Yuan/injury 62, and the maximum value in the developed countries in the past
studies is $3.3 million Yuan/injury 63 . The NPV of cost caused by earthquake is between
minimum of $129,500,495 Yuan and maximum $564,575,195 Yuan with a discount rate of 10%,
and between minimum value of $333,449,648 Yuan and maximum value of $1,453,719,535
Yuan with the discount rate of 5%.
Limitations: Many scientists state that the pressure from the reservoir and the dam on
fragile geographical structures might lead to earthquakes 64. It means that the exact calculation of
cost of earthquake is difficult because the cost entails the cost of earthquakes led by the TGD and
the cost of earthquake originally occurred.
4. Financial and economic evaluation
4.1. Financial evaluation
After considering all the possible variables, the financial evaluation was carried including as
major benefits, electricity and shipping and as major costs, construction and resettlement. The
results of the financial evaluation can be seen in the following summary of financial appraisal
considering 50 years of project duration and discount rate of 10%.
58 CEB (1994) “Environmental Impact assessment for the UKHP.” 59 World Commission on Dams (2000) 60 Viscusi (1993) 61 China News Service 13, October 2000 62 Shanmugam (2000) 63 Shanmugam (2000) 64 New Scientist, 2 Nov 1991, p.13
21
Project Duration 50 years
Discount Rate 10%
Total Net Benefits 141,561,793,752 Yuan
Total Net Costs 124,817,825,558 Yuan
Benefit-Cost Ratio 1.13 Table 2. Summary of Financial Appraisal
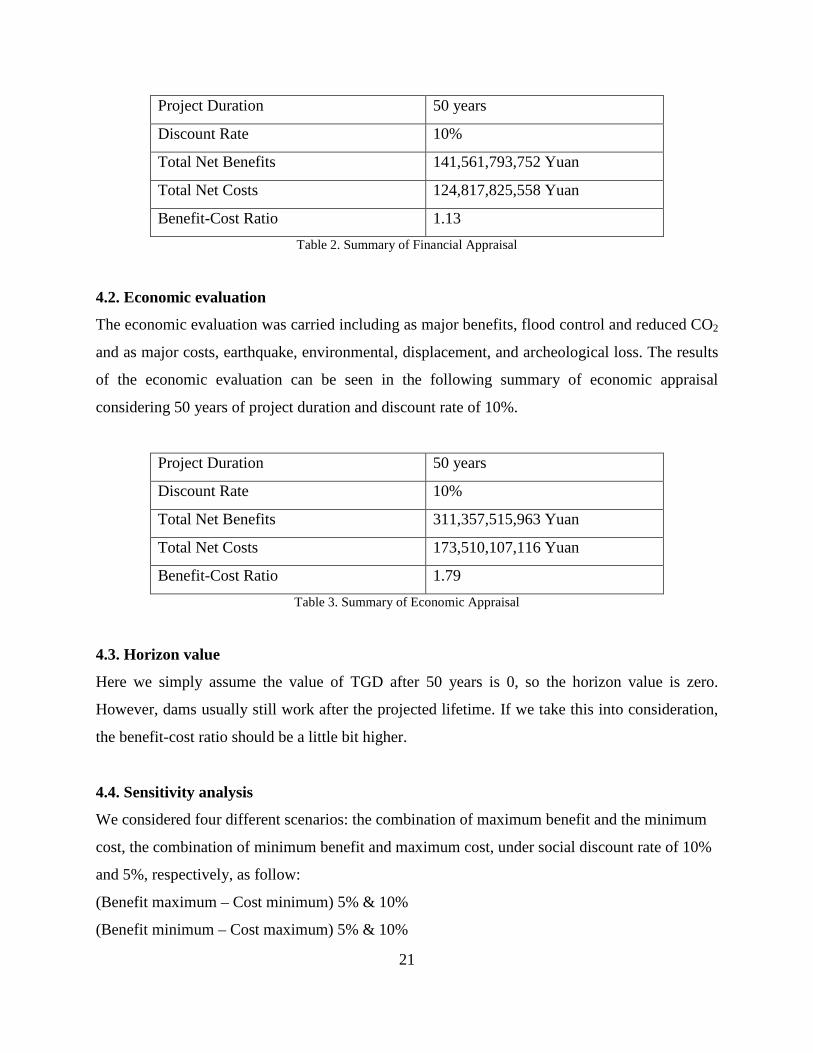
4.2. Economic evaluation
The economic evaluation was carried including as major benefits, flood control and reduced CO2
and as major costs, earthquake, environmental, displacement, and archeological loss. The results
of the economic evaluation can be seen in the following summary of economic appraisal
considering 50 years of project duration and discount rate of 10%.
Project Duration 50 years
Discount Rate 10%
Total Net Benefits 311,357,515,963 Yuan
Total Net Costs 173,510,107,116 Yuan
Benefit-Cost Ratio 1.79 Table 3. Summary of Economic Appraisal
4.3. Horizon value
Here we simply assume the value of TGD after 50 years is 0, so the horizon value is zero.
However, dams usually still work after the projected lifetime. If we take this into consideration,
the benefit-cost ratio should be a little bit higher.
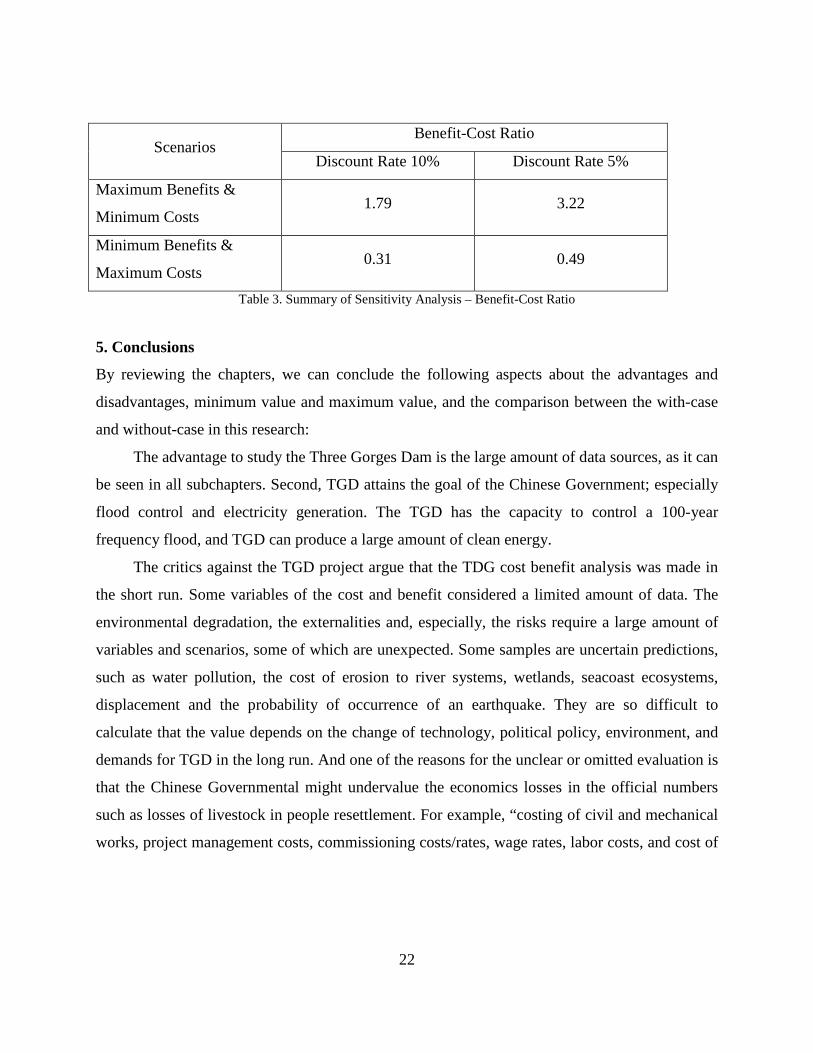
4.4. Sensitivity analysis
We considered four different scenarios: the combination of maximum benefit and the minimum
cost, the combination of minimum benefit and maximum cost, under social discount rate of 10%
and 5%, respectively, as follow:
(Benefit maximum – Cost minimum) 5% & 10%
(Benefit minimum – Cost maximum) 5% & 10%
22
Scenarios Benefit-Cost Ratio
Discount Rate 10% Discount Rate 5%
Maximum Benefits &
Minimum Costs 1.79 3.22
Minimum Benefits &
Maximum Costs 0.31 0.49
Table 3. Summary of Sensitivity Analysis – Benefit-Cost Ratio
5. Conclusions
By reviewing the chapters, we can conclude the following aspects about the advantages and
disadvantages, minimum value and maximum value, and the comparison between the with-case
and without-case in this research:
The advantage to study the Three Gorges Dam is the large amount of data sources, as it can
be seen in all subchapters. Second, TGD attains the goal of the Chinese Government; especially
flood control and electricity generation. The TGD has the capacity to control a 100-year
frequency flood, and TGD can produce a large amount of clean energy.
The critics against the TGD project argue that the TDG cost benefit analysis was made in
the short run. Some variables of the cost and benefit considered a limited amount of data. The
environmental degradation, the externalities and, especially, the risks require a large amount of
variables and scenarios, some of which are unexpected. Some samples are uncertain predictions,
such as water pollution, the cost of erosion to river systems, wetlands, seacoast ecosystems,
displacement and the probability of occurrence of an earthquake. They are so difficult to
calculate that the value depends on the change of technology, political policy, environment, and
demands for TGD in the long run. And one of the reasons for the unclear or omitted evaluation is
that the Chinese Governmental might undervalue the economics losses in the official numbers
such as losses of livestock in people resettlement. For example, “costing of civil and mechanical
works, project management costs, commissioning costs/rates, wage rates, labor costs, and cost of
23
fuel, etc., has been deleted from the government study. Aggregated values do not mean much if
the rates per unit, wage rates of different categories, etc., are not known” 65.
In terms of the minimum value and maximum value, we saw the maximum case and
minimum case of the cost and benefits in each chapter, but some maximum values of the factors
are sometimes over-evaluated because the variables used in the worst or best cases are extreme.
We saw the economic analysis on the basis of discount rate, using minimum or maximum benefit
and cost (minbenefit-maxcost (5 or 10%) and maxbenefit-mincost (5 or 10%)). From the cost
and benefit analysis, it was clear that in the case of minimum benefit and maximum cost the
benefit-cost ratio is 0.31 (10%) and 0.49 (5%). And, in the case of maximum benefit and
minimum cost the benefit-cost ratio is 1.79 (10%) and 3.22 (5%). So the former case of benefit-
cost ratio amounts to above 1, and the latter one is below 1. Finally, we divide the economic
analysis and financial analysis, and find that the benefit-cost ratio in the financial analysis is 1.13,
which is higher than the case of minimum benefit and maximum cost but lower than the case of
maximum benefit and minimum cost.
Considering other economic analysis, the Chinese government applied the standard
discount rate used by the Ministry of Water Resources and Electric Power, 10%, which also the
CYJV (Canadian Yangtze Joint Venture) applied to the expected costs and benefits over a 62-
year period. Considering other similar studies, the World Bank, one of the financiers for this
project, applied a 12% rate of discount in its economic appraisals as it did for the Narmada dams
in India. Applying a 12% discount rate causes a 15% decline in costs and almost 30% decline in
benefits. The net project benefits decline by 59% 66. Also, the CYJV uses the administered rate
of exchange, $3.7 Yuan per U.S. dollar in its economic analysis of the TGD Project, and
included shortage of funds, bottlenecks in management and phases of construction, multiplicity
of decision-making organizations, and technical issues in the CBA of the project. In some cases,
the schedule is delayed due to the factors mentioned above and the cost of the delay can be as
much as 100% or more. CYJV also recognizes that a drastic drop in the exchange rate to about
$6 Yuan per U.S. dollar would increase discounted construction costs by 30% 67. Recent changes
65 Barber and Grainne (1998), p.166 66 Three Gorges Project Proposal, U.S. Three Gorges Working Group, July 1985. 67 Haines, P. (1986) “Canadian Competitiveness and After Sales Service”, an address delivered at the Canadian Export Association’s Annual Consultations with the Canadian International Development Agency, Ottawa, 10-11.
24
in China’s economic policy, especially since the 7th Five Year Plan (1986 – 1990), imply that
such a devaluation of the Yuan is going on rapidly.
In addition, we need to consider the inflation change in accordance with the time, but the
following sentence show the difficulty in estimating inflation: “In the case of the Three Gorges
Project, the CYJV analysis is conducted with reference to mid-1987 prices. Of course, all
analysts are aware of the fact that some prices escalate faster than others, causing relative price
differentials. In China, as in many other countries, project construction costs tend to rise faster
than the price of benefits such as the price of power per unit, or the price of agricultural products.
This has a tendency to reduce net benefits thereby lowering the ratio of benefits to costs” 68. We
need to calculate the change of the value to too many variables, and these factors make a biased
influence on the cost and benefit analysis.
Acknowledgements
This research is attributed to the class “Economic Analysis of Public Policy” undertaken by the
Graduate School of Public Policy, University of Tokyo. Special gratitude and indebt goes to our
supervisor, professor Kanemoto Yoshitsugu, for the fruitful comments on data analysis, and
stimulating encouragement during the research development. We are also grateful to Mr.
Enkhbaatar Tsenguun for all his support as teacher assistance providing us several insightful
suggestions. Finally, we would like to thank our class colleagues George Hageman, Rana Al
Mutawa, Lee Ching Yu Jason, Zhao Yu, Gaye Kim and Marcin Jarzebski, for comments and
questions during our group presentations.
68 Barber and Grainnes (1998), p.170
25
References
Allin, S. (2004) “An Examination of China’s Three Gorges Dam Project Based on the
Framework Presented in the Report of The World Commission on Dams.” Master Thesis at
Virginia Polytechnic Institute and State University.
Barber, M. and R. Grainne (org.) (1998) “Damming the Three Gorges: What Dam-Builders
Don’t Want You To Know. A Critique of the Three Gorges Water Control Project
Feasibility Study.” Probe International, Earthscan Publications Limited, 2nd edition.
Battelle Memorial Institute (1998) “China's Electric Power Options: An Analysis of Economic
and Environmental Costs.” Washington D.C.: Battelle Memorial Institute.
Chang, X. L., X. Liu, and Z. Wei (2010) “Hydropower in China at present and its further
development.” In: Energy, 35(11), 4400-4406.
Childs-Johnson, E. (2000) “The Three Gorges Project: there is no dragon.” In: Brandt, S. A., and
F. Hassan “Dams and Cultural Heritage Management”. Cape Town (South Africa), World
Commission on Dams, p. 52-53.
China, Central People’s Government of the People’s Republic (2012) “能源局: 2011年全社会
用电量累计达46928亿千瓦时.” Detailed information here: <http://www.gov.cn/gzdt/2012-
01/14/content_2044324.htm>
China, Central People’s Government of the People’s Republic (2006) “Three Gorges Dam”.
Detailed information here: (Chinese) <http://www.gov.cn/jrzg/2006-10/18/content_
416256.htm>
Chinese Three Gorges Project Corporation CTGPC (2002) “Flooding on the Yangtze in 1998.”
Detailed information here: (Chinese) <http://www.ctgpc.com.cn/sxslsn/index.php?m
ClassId=003000>
Gleick, P. H. (2009) “Three Gorges Dam Project, Yangtze River, China.” In: Gleick, Peter H.
(Ed.) “The World’s Water Report 2008-2009.” Pacific Institute for Studies in Development,
Environment, and Security. Washington D.C.: Island Press, p. 139-150.
Morimoto, R. and C. Hope (2003) “Applying a CBA Model To The Three Gorges Project In
China.” In: Research Papers in Management Studies, 01.
Morimoto, R. and C. Hope (2004) “Applying a cost-benefit analysis model to the Three Gorges
project in China.” In: Impact Assessment and Project Appraisal, 22(3).
26
Paranjpye, V. (1992) “Economic and Financial Aspects.” In: Barber, Magaret & Ryder, Grainne
(Eds.) “Damming the Three Gorges. Probe International.” Detailed information here:
<http://www.threegorgesprobe.org/pi/documents/three_gorges/damming3g/ch12.html>
Peng, W., C. F. Shuai and X. Xin (2010) “Yangtze River: China's golden waterway.” In:
Proceedings of the ICE-Civil Engineering, 163 (5), 15-18.
Ponseti, M. and J. Lopez-Pujol, (2006) “The Three Gorges Dam Project in China: History and
Consequences.” In: HMiC, 4, 158-187.
Shanmugam, K. R. (2000) “Valuations of Life and Injury Risks: Empirical Evidence from India”.
In: Environmental and Resource Economics.
Veenstra, A. W., M. Zhang, and M. Ludema (2008) “The growth potential of container shipping
on the Yangtze River.” In: Maritime Policy & Management: The flagship Journal of
International Shipping and Port Research, 35(6), 535-549.
Viscusi, W. K. (1993) “The value of Risks to Life and Limb.” In: Journal of Economic
Literature, 31, 1912-1946.
Wang, J. (2002) “Three Gorges Project: the largest water conservancy project in the World.” In:
Public Administration and Development, 22 (5), 369-375.
World Commission on Dams (2000) “Dams and Development: a new framework for decision-
making.” The Report of the World Commission on Dams, London: Earthscan Publishers.
Xie, S., Z. Li, J. Liu, S. Xie, H. Wang and B. R. Murphy (2007) “Fisheries of the Yangtze River
show immediate impacts of the Three Gorges Dam.” In: Fisheries 32(7):343–344.
Xie, P. (2003) “Three Gorges Dam: Risk to Ancient Fish.” In: Science, 302:1149.
Xu, K., J. D. Milliman, Z. Yang, and H. Wang (2006) “Yangtze sediment decline partly from
Three Gorges Dam.” In: EOS 87(19):185-190.
Yan, T. (2008). “Resettlement in the Three Gorges Project.” Hong Kong University Press.
Yan T., Hugo, G., Potter, L. (2005) “Rural women, displacement and the Three Gorges Project.”
In: Development and Change 36(4):711–734.
Yang, S. L., Q. Y. Zhao, and I. M. Belkin (2002) “Temporal Variation in the Sediment Load of
the Yangtze River and the Influences of Human Activities.” In: Journal of Hydrology,
263(1-4), 56-71.
27
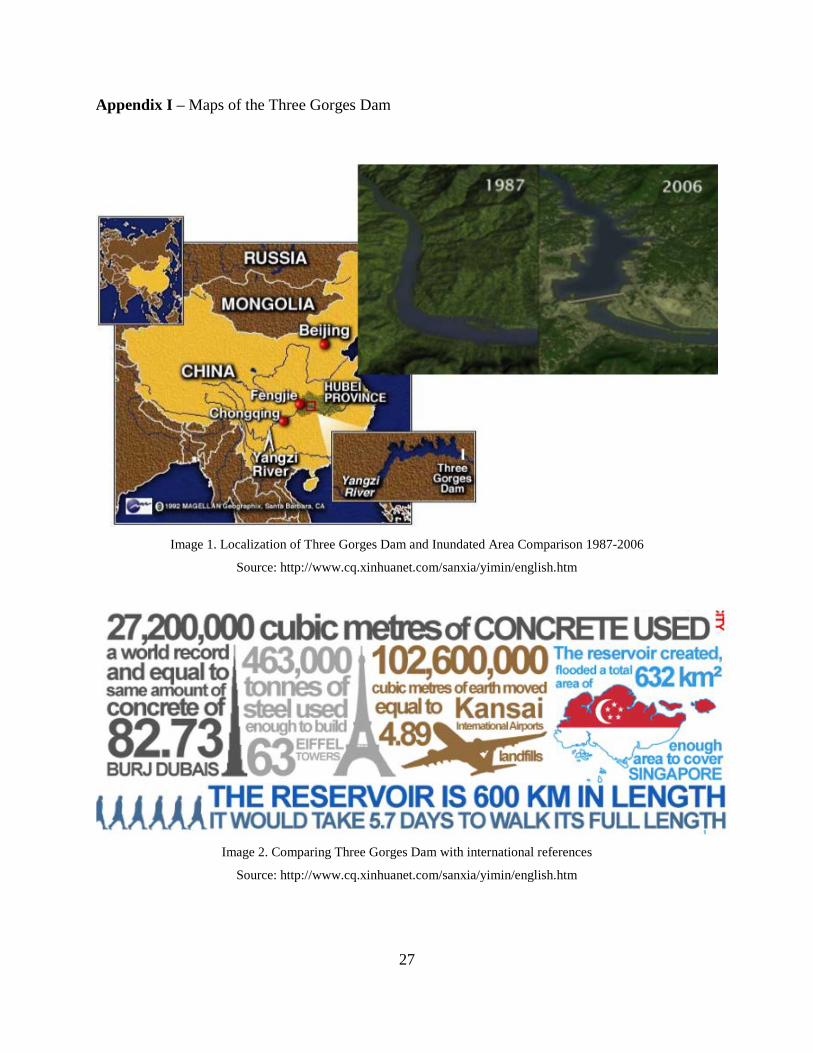
Appendix I – Maps of the Three Gorges Dam
Image 1. Localization of Three Gorges Dam and Inundated Area Comparison 1987-2006
Source: http://www.cq.xinhuanet.com/sanxia/yimin/english.htm
Image 2. Comparing Three Gorges Dam with international references
Source: http://www.cq.xinhuanet.com/sanxia/yimin/english.htm
28
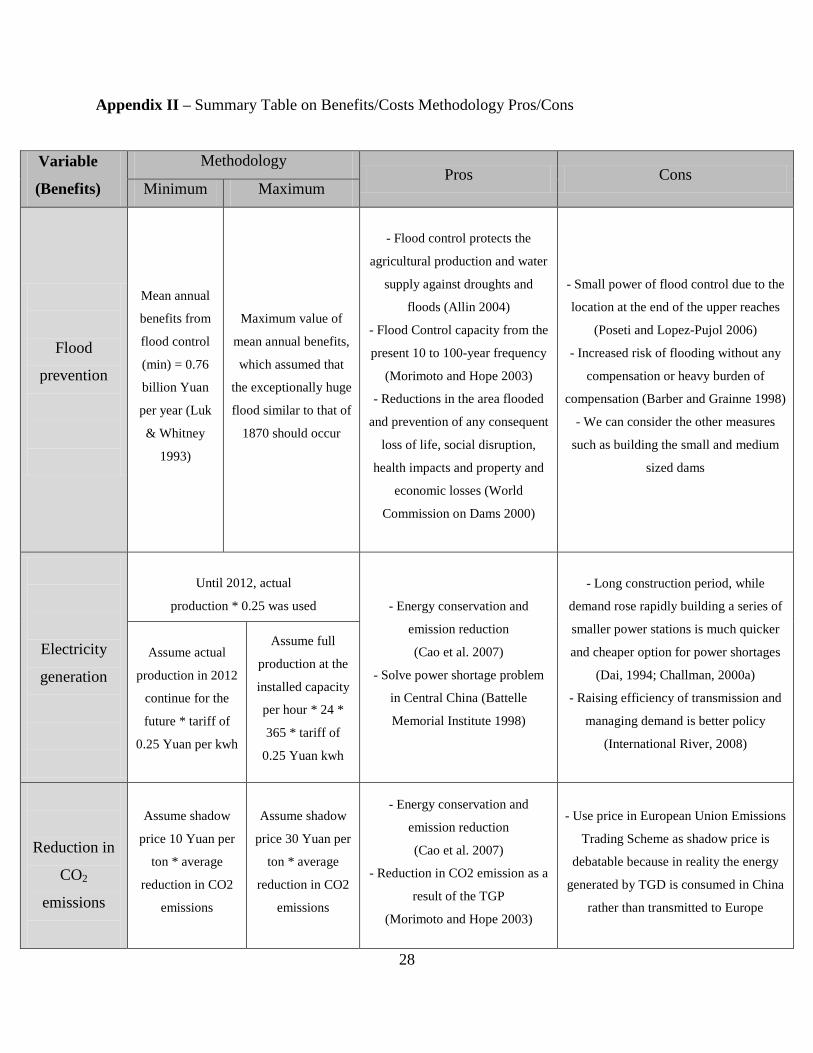
Appendix II – Summary Table on Benefits/Costs Methodology Pros/Cons
Variable
(Benefits)
Methodology Pros Cons
Minimum Maximum
Flood
prevention
Mean annual
benefits from
flood control
(min) = 0.76
billion Yuan
per year (Luk
& Whitney
1993)
Maximum value of
mean annual benefits,
which assumed that
the exceptionally huge
flood similar to that of
1870 should occur
- Flood control protects the
agricultural production and water
supply against droughts and
floods (Allin 2004)
- Flood Control capacity from the
present 10 to 100-year frequency
(Morimoto and Hope 2003)
- Reductions in the area flooded
and prevention of any consequent
loss of life, social disruption,
health impacts and property and
economic losses (World
Commission on Dams 2000)
- Small power of flood control due to the
location at the end of the upper reaches
(Poseti and Lopez-Pujol 2006)
- Increased risk of flooding without any
compensation or heavy burden of
compensation (Barber and Grainne 1998)
- We can consider the other measures
such as building the small and medium
sized dams
Electricity
generation
Until 2012, actual
production * 0.25 was used - Energy conservation and
emission reduction
(Cao et al. 2007)
- Solve power shortage problem
in Central China (Battelle
Memorial Institute 1998)
- Long construction period, while
demand rose rapidly building a series of
smaller power stations is much quicker
and cheaper option for power shortages
(Dai, 1994; Challman, 2000a)
- Raising efficiency of transmission and
managing demand is better policy
(International River, 2008)
Assume actual
production in 2012
continue for the
future * tariff of
0.25 Yuan per kwh
Assume full
production at the
installed capacity
per hour * 24 *
365 * tariff of
0.25 Yuan kwh
Reduction in
CO2
emissions
Assume shadow
price 10 Yuan per
ton * average
reduction in CO2
emissions
Assume shadow
price 30 Yuan per
ton * average
reduction in CO2
emissions
- Energy conservation and
emission reduction
(Cao et al. 2007)
- Reduction in CO2 emission as a
result of the TGP
(Morimoto and Hope 2003)
- Use price in European Union Emissions
Trading Scheme as shadow price is
debatable because in reality the energy
generated by TGD is consumed in China
rather than transmitted to Europe
29
Enhanced
shipping
capacity
Minimum shipping
capacity by the
official feasibility
study * reduction
of cost of 25% *
shipping cost of
122.85 Yuan per
ton
Maximum
shipping capacity
by the official
feasibility study *
reduction of cost
of 37% claimed
by the company
*122.85 Yuan per
ton
- Increased shipping capacity due
to shoals and rapids being
submerged, higher water level
during dry season, even for the
branch rivers. Larger vessels can
pass through. (Peng, Shuai and
Xin 2010)
- Bottleneck effect with the current
growth of container traffic
(Veenstra, Zhang and Ludema, 2008)
Variable
(Costs)
Methodology Pros Cons
Minimum Maximum
Dam
construction
Official number
announced by the
company (Wang
2002)
Official * 1.4
average cost for
large dams
overruns at 40%
(Morimoto and
Hope 2005)
- Although the total cost exceeds
the original plan, it is due to the
expansion of projects and inflation.
- The dam is within budget
(China Daily 2009)
- The dam will far exceed the official
cost estimate because there are many
unknown costs missing from the budget
(Li 1989)
Operation and
maintenance
for electricity
production
Electricity
produced * O&M
cost for large
hydro
dams=166yuan/k
W/year (Battelle
Electricity
produced * O&M
cost * 1.4
(40% overrun cost
assumed by
Morimoto and
Hope 2005)
- Minimal O&M cost with fewer
employees by adopting e-Project
Management Information System
(www.ifsworld.com)
- New city has been built to house TGD
maintenance workers.
- Heavy monitoring of the dam’s
operation required construction funds -
embezzled by selecting cheap, inferior
equipment and materials; higher O&M

30
1998, Table 5.11) (Allin 2004; www.powertechnology)
People
resettlement
The minimum
estimative was
640,000 people
multiplied by
$10,000 Yuan
plus 1.47 on the
actual number of
resettled people,
plus 5 times the
necessary value to
compensate
productivity
The maximum
estimative was
640,000 people
multiplied by
$10,000 Yuan
plus 1.94 on the
actual number of
resettled people,
plus 5 times the
necessary value to
compensate
productivity
- The government argued that
“resettlement construction and
development would spur growth in
the area bordering the reservoir”
encouraging development of the
region with resettlement funds.
(Barber and Grainne 1998)
- China’s record of resettlement is not
good, and government admitted that
past resettlements have been plagued
with “mistakes such as uncoordinated
management, duplicate development,
wasteful labor use, and limited funds”
(Barber and Grainne 1998)
- The problem was that the best fertile
lands were located in the valleys,
flooded by the reservoir, and the
government promoted the resettlements
in the remaining land, uphill, relatively
infertile (Barber and Grainne 1998)
People
displacement
Fixed value based
on secondary
source due to the
difficulty in
evaluate total
assets and
includes
intangible assets
such as social
capital losses,
production
relationships,
culture, etc.
Fixed value based
on secondary
source due to the
difficulty in
evaluate total
assets and
includes
intangible assets
such as social
capital losses,
production
relationships,
culture, etc.
- The calculation included the
notion of “replacement value”. The
difference between “compensation
costs” and “replacement value” is
that the latter equals to market
value of total assets and includes
intangible assets such as social
capital losses, production
relationships, culture and kinship
networks, etc.
(Morimoto and Hope 2003)
- Worst risk in measure displacement is
related to the uncertainties in estimate
target population and the variations in
numbers of people who deserve
compensation, replacement land, jobs,
housing, and so on.
(Morimoto and Hope 2003)
- Gender differentiation was not
considered as women bear most of the
social costs as they are unable to
achieve occupational mobility in the
process of resettlement
(Yan, Hugo and Potter 2005)
Environmental
degradation
The cost break up
into 3 categories,
with each
category having
The cost break up
into 3 categories,
with each
category having
the largest value
- Report by the China Three
Gorges Corporation (CTGC) shows
that environment degradation is
within the initial estimation
(www.ctg.com.cn/)
- To determine the true cost of
environmental degradation, long-term
data is needed, so that the effect of
TGD can be distinguished from effects
caused by other factors
31
the least value
Loss in
archaeological
sites
The preservation
budget for
historical sites
and cultural
antiquities should
be 3% to 5% of
the minimum total
project budget
The preservation
budget for
historical sites
and cultural
antiquities should
be 3% to 5% of
the maximum
total project
budget
- There are many studies on how to
place values on archaeological
sites, but no simple conclusion for
this argument has been reached.
See Carman et al (1999), Carver
(1996), Darvil, Saunders, and
Startin (1987), Schaafsma (1989)
- These suggested amounts were never
allocated to the involved research
institutions and agencies, (Childs-
Johnson 2000), and using a percentage
value of the total project budget to
evaluate relics preservation, specially
when more 8,000 sites remained
unexplored, it is quite controversial
Potential
damage:
earthquakes
The number of deaths and injuries due
to special circumstances * value
estimate for deaths or injuries*
Generation Capacity * Probability of
occurrence of earthquake
- Earthquake is important factor of
accident costs because we can see
the 110 dam collapses per year and
the official deaths toll show 9937
deaths due to dam failures
(Fu 1998)
- More exact calculation of the cost of
earthquake is difficult because the
earthquake derives not only from the
natural factor but also from the pressure
from the reservoir and the dam
(New Scientist, 2 Nov 1991, p.13)
The number of
deaths and
injuries is a half
of Inhaber’s
estimate below
(Inhaber 1982)
The maximum
value is the
estimated value
for past projects
(Inhaber 1982)