ESTRUCTURA BIOFÍSICA DE LA ECONOMÍA ECUATORIANA · - 2 - parameter -number of consumers- despite...
40
Edifici B – Campus de Bellaterra 08193 Cerdanyola del Vallès, Barcelona, Spain Tel.:(+34) 935811203; Fax: (+34) 935812012 http://www.h-economica.uab.es Departament de Geografia, Universitat Autònoma de Barcelona, Edifici B, 08193, Bellaterra (Cerdanyola), Spain e-mail: [email protected] 28/01/2011 Unitat d’Història Econòmica UHE Working Paper 2011_06 Consumer populations and nutritional transition in Spain in the 20th century: A methodology for their reconstruction Francisco Muñoz-Pradas
Transcript of ESTRUCTURA BIOFÍSICA DE LA ECONOMÍA ECUATORIANA · - 2 - parameter -number of consumers- despite...
Edifici B – Campus de Bellaterra 08193 Cerdanyola del Vallès, Barcelona, Spain Tel.:(+34) 935811203; Fax: (+34) 935812012 http://www.h-economica.uab.es
Departament de Geografia, Universitat
Autònoma de Barcelona, Edifici B, 08193, Bellaterra (Cerdanyola), Spain
e-mail: [email protected]
28/01/2011
Unitat d’Història Econòmica UHE Working Paper 2011_06
Consumer populations and nutritional transition
in Spain in the 20th century: A methodology for
their reconstruction
Francisco Muñoz-Pradas
Edifici B – Campus de Bellaterra 08193 Cerdanyola del Vallès, Barcelona, Spain Tel.:(+34) 935811203; Fax: (+34) 935812012 http://www.h-economica.uab.es
Francisco Muñoz-Pradas, 2011
Consumer populations and nutritional transition in Spain in the 20th century: A methodology for their reconstruction UHE Working Paper 2011_06 http://www.h-economica.uab.es/wps/2011_06.pdf
Unitat d’Història Econòmica Departament d’Economia i Història Econòmica
Edifici B, Campus UAB 08193 Cerdanyola del Vallès, Spain
Tel: (+34) 935811203 http://www.h-economica.uab.es
© 2011 by Francisco Muñoz-Pradas and UHE-UAB
- 1 -
Consumer populations and nutritional transition in
Spain in the 20th century: A methodology for their
reconstruction1
Francisco Muñoz-Pradas
Departament de Geografia, Universitat Autònoma de Barcelona, Edifici B, 08193, Bellaterra (Cerdanyola),
Spain
e-mail: [email protected]
Abstract
One feature of the modern nutrition transition is the growing consumption of animal proteins. The most common approach in the quantitative analysis of this change used to be the study of averages of food consumption. But this kind of analysis seems to be incomplete without the knowledge of the number of consumers. Data about consumers are not usually published in historical statistics. This article introduces a methodological approach for reconstructing consumer populations. This methodology is based on some assumptions about the diffusion process of foodstuffs and the modeling of consumption patterns with a log-normal distribution. This estimating process is illustrated with the specific case of milk consumption in Spain between 1925 and 1981. These results fit quite well with other data and indirect sources available showing that this dietary change was a slow and late process. The reconstruction of consumer population could shed a new light in the study of nutritional transitions.
1. Introduction
One feature of the modern nutrition transition is the growing consumption of animal proteins.
Noteworthy amongst these are the contributions of foodstuffs such as meat and milk. In Western
Europe this process was accompanied by changes in the organization of agricultural and livestock
farming, as well as in consumption habits, under the momentum of industrialization and
urbanization2. A quantitative piece of information about consumption patterns is a basic approach in
order to illustrate changes in nutritional status.
However, the study of a nutritional change of this nature comes up against a significant limitation.
An accurate description of this process requires knowledge, not only of the evolution of average
consumption, but also of the number of consumers. If a dietary change is considered in terms of a
process of diffusion, it is therefore essential to take both parameters into account. This second
1 Financial support from the Spanish Ministry of Education. SEJ 2007/60845 Project “Standard of living, health and food:
Spain in historical perspective” and HAR2010-20684-CO2-01 Project “Inequality, Standard of living and Health: Spain 19th - 20th centuries”. This WP is related to a previous WP “Población y Consumo. Una Reconstrucción de las poblaciones consumidoras de Leche en España 1925-1981”. UAB. 2009..Some previous results have been changed due to modifications in some criteria used throughout the estimation procedure. The biggest change has occurred in the distribution of consumption for 1954-55. 2 Popkin, B. M, 1993; Crigg, D,1995
- 2 -
parameter -number of consumers- despite its obvious relevance, is only rarely estimated. The
historical statistics permit a mean consumption to be calculated but not the proportion of consumers
One of the major consequences is the lack of information about patterns of distribution of food
consumption and, then, of the population nutritional status. The hypothesis and the evidence that in
the initial stages of industrialization and urbanization that nutritional status was unequally distributed
has been topic of intensive research. A way of approaching these difficulties has been the
anthropometric perspective, because the pattern of distribution of heights reflects the underlined
effects of levels of food consumption plus other environmental factors3.
The fact that research on the nutritional status of population needs some distributional assumptions
is well illustrated by Fogel’s article on economics of nutrition4. But in terms of empirical research if
individual data on consumption is not available, which is the most common in historical studies, the
basic indicators stem from aggregate statistics and they compute average levels of consumption. In
these cases main differences in indicators are a consequence of the geographical detailed provided
by the published sources. Thus, those levels of consumption can reflect averages from local to
national level. But, beyond all these spatial scales, these averages have the same problem. If some
foodstuff does not have a pattern of universal consumption, the average got from the tabulated data
will not estimate accurately the “true” or effective level of consumption. This is because all average
( X ) is a division of the whole output consumed by the total population (O/P) and, when the number
of consumers is lower than the population as a whole it is easy to see that X -statistical < X -“true”
value. A simple and hypothetical example may illustrate this problem. There are two countries A
and B with the same population, one million inhabitants, but different consumptions levels. In
country A it is about 70 kg per person per year and 130 Kg in country B. If the proportion of
consumers is 50 per cent of the whole population in country A and 100 per cent in B, universal
consumption, it is obvious that effective consumption level would be greater in country A (around
140 Kg) than in country B (130 kg). As the historical process shows, not only do changes in
consumption involve an increase in the consumption per capita of certain products but also a
growing incorporation of new consumers5. Because of these two dimensions researchers must be
very cautious when they are comparing patterns of food consumption between countries. In fact,
without a previous “standardization” (or statistical adjustment) in some basic indicators, such as the
means, any conclusion about differences in levels of consumption will be contaminated by
differences in the number of consumers.
3 Steckel, R. and Floud, R, 1997, p.1-16
4 Fogel, R,1992
5 A historical perspective on these changes in the demand of goods and the behavior of consumers in De Vries, J,2008. See chapter 4.
- 3 -
This article deals with this problem. First of all it is important to warn that despite the simple way the
problem can be set out its solution is not easy. In fact, this article does not provide a complete or
“definitive” solution to this problem. It is going to develop a methodological approach under some
hypothetical and realistic assumptions with the purpose of estimating this consumer population.
Because this kind of population will be different according to the foodstuff consumed this estimating
process will be illustrated with the specific case of milk consumption in Spain. The evolution of the
consumption of this food covers central years in the nutritional transition in this country throughout
the 20th century6.
This article has three main sections. In the first one, the basic problem is introduced as well as
the strategy followed in these pages to resolve it. Then, in the second one, the methodology for
correcting and adjusting the average consumption levels computed from the published statistics is
presented. Finally, in the third section, the methodology is applied to the Spanish data on milk
consumption in order to estimate patterns of consumer population distributions from 1925 to 1981.
The main results will be related to the information available on the evolution of milk consumption in
Spain in the 20th century. The conclusion briefly summarizes the basic principles and results in the
methodological strategy applied with some final remarks on their strengths and weaknesses.
2. Posing the problem and exploring a solution: the case of the evolution of milk consumption in Spain
As it has been indicated in the previous section, the problem and proposed solution will be
illustrated by the evolution of milk consumption in Spain between 1925 and 1981. The choice of
this food can be justified from three factors - a) Milk is one of the food “indicators” of nutritional
transition, because fresh milk is a kind of animal protein. b) As it has been previously pointed out,
changes in milk consumption are placed in the central decades of the Spanish nutritional transition
c) Basic data are provided by consumption statistics from official sources published in relationship
with agriculture and livestock activities. This is not always the same with other foods because the
available data used to be published only as statistics of production.
The main type of animal milk consumed in Spain during the period studied here was cow milk.
Accordingly, the evolution of the percentage of this type of milk can be estimated at between 79 and
91 percent of the total amount consumed between 1925 and 1981. The rest basically consisted of
goat milk. Table 1 shows the mean consumption levels per person and per year and the associated
standard deviation, calculated using the provincial data and the mean consumption levels
6 Cussó, X, 2005. Cussó, X and Garrabou R, 2007.
- 4 -
calculated for the entire Spanish population between 1925 and 1981. These data belong to two
kinds of sources: livestock statistics and household budget surveys7. The first type of statistics
usually provide data about the number and type of livestock, the total amount of production and milk
consumption levels from each province, while the second statistics, by their very nature, offer data
about the quantities consumed and family expenses. In short, the first group pertain, in
chronological order, to the statistics published by the Asociación General de Ganaderos del Reino
(General Association of Livestock Owners of the Kingdom) in 19258, the Censo de la ganadería en
España (Livestock Census in Spain) with data for 19339 and the first data from the new series on
direct human consumption of animal milk published in the Resúmenes estadísticos de la
producción, destino y valor de la leche (Statistical summary of the production, destination and value
of milk) from 1954 and 1955, published by the Ministry of Agriculture10. In terms of the second
group, the data from 1965 and 1981 on the consumption per person per year on a provincial level
correspond to those published in the “Household Budget Surveys”11. As we can see in this
chronology, there is a significant lack of information between 1933 and 1965, this can be explained
by the event of the Spanish Civil War (1936-39) and the post war period that lasted until the mid
1950s. The rationing imposed on the population during this period quite logically made statistics on
consumption unnecessary12. With the exception of the estimates for provincial consumption per
capita provided directly by the results from the Household Budget Surveys (HBS) the remaining
values have been calculated using the consumption data provided by the source and provincial
population corresponding to that year, which were obtained by linear interpolation between the two
censuses that were closest together chronologically. In all cases data have been used at a
provincial scale because this is the way it was collected.
Table 1 distinguishes two features of the evolution of milk consumption in the long term; the
increase in average levels of consumption, and the progressive reduction in provincial differences.
7 The Statistical Yearbooks, published regularly in the 20
th century since 1912, also record data about livestock, production and, to a
lesser extent, annual consumption, and come from the aforementioned livestock statistics.
8 AGGR 1925This involves a publication that is normally dated around 1923. However, according to the bibliography of the Revista de
Higiene y Sanidad Pecuarias (Livestock Health and Hygiene Magazine), published in February 1926, page 138, the actual date of
publication is 1925 (Thanks to Ismael Hernández for facilitating this information)
9 Ministerio de Agricultura 1934
10 Ministerio de Agricultura 1954, 1955
11 INE 1969, 1983
12 Provincial data on provincial production and consumption of milk were published in the first yearbooks after the Spanish Civil War, but
they only covered the years 1941 and 1943. The estimates derived from this data show almost a 50% drop in the production and
consumption of fresh milk. The reduction in head of cattle (beef and goat) approaches 20%. However, it is surprising that in this context,
according to the same data, the production per head of cow milk rose between 1941-1943, compared to 1929-33, by almost 50% and
that of goat’s milk rose by 30% .

- 5 -
The provincial differences become more noticeable in what seems to be a strong period of growth
between 1925 and 1933. Then it progressively decreased towards what suggests improvements in
the mean consumption levels together with a major universalization of these.
TABLE 1
Milk consumption in Spain (1925-1981)
(Litres per person per year)
Mean Mean(1)
Year Consumption Consumption Standard
Total Population Provinces Deviation
1925 36.46 34.05 38.80
1933 63.32 60.99 70.80
1955 65.89 69.87 57.72
1965 79.14 78.49 40.25
1981 128.39 138.30 42.25
(1) Arithmetic mean, all Spanish Provinces.
Source: Asociación General de Ganaderos del Reino,
1925, Ministerio de Agricultura 1934, Ministerio de
Agricultura 1934, Ministerio de Agricultura, 1954 and
1955, Instituto Nacional de Estadística (INE), 1969
INE, 1981.
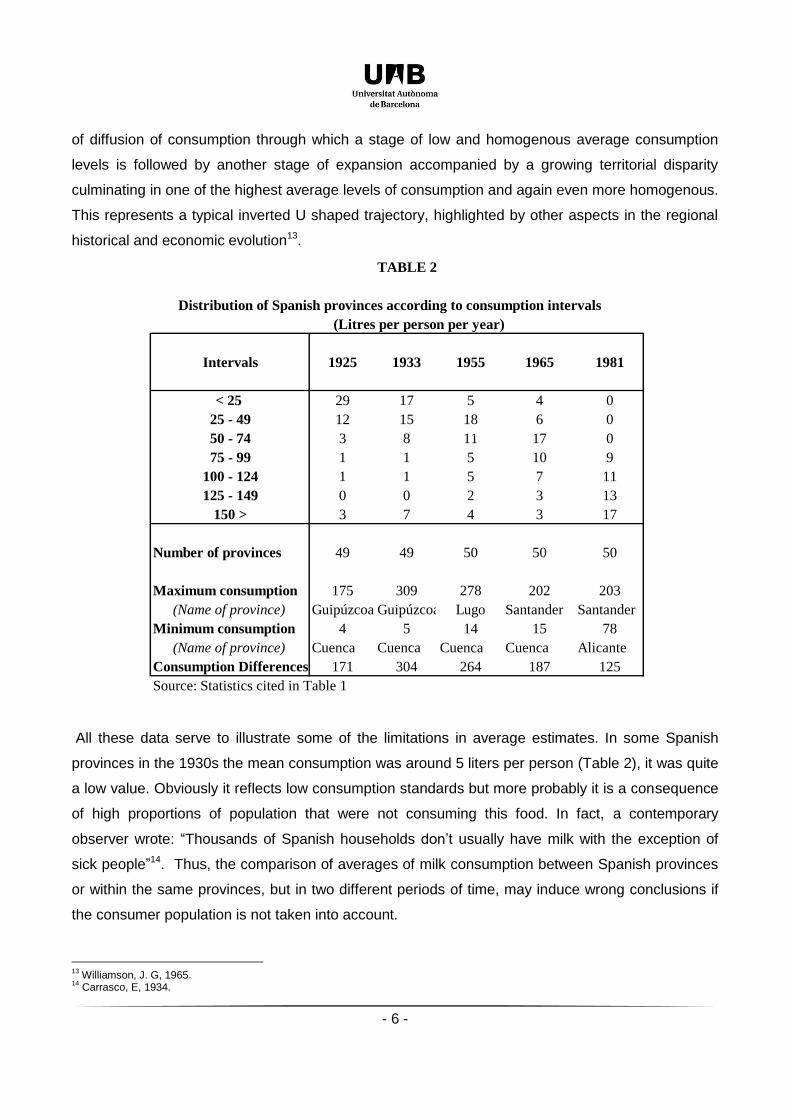
Given that the basic data are provincial, Table 2 offers a panoramic view of the evolution of the
distribution of consumption at this scale between 1925 and 1981, in accordance with some intervals
of consumption and highlights the values of the maximum and minimum consumption levels at each
point and the name of the provinces to which they correspond. The minimum consumption levels in
some Spanish provinces, between 1925 and 1965, were always below 20 liters and in the years
1925 and 1933, they were always below 10 liters, in the same way that on those two dates a
considerable proportion of the provinces had constant levels of consumption that were below 25
and 50 liters per person per year. The data reflect how the distances between minimum and
maximum consumption increases between 1925 and 1933 and then go on to decrease from 1955
onwards. These distances do not only reveal differences in the consumption magnitudes of this
foodstuff, but also the different habits of consumption. Moreover, from a territorial point of view,
which cannot be studied here in detail, these differences between maximum and minimum
consumption levels are very stable. As we can see in Table 2 some provinces reappear throughout
these years in both extremes of distribution. All of this could be interpreted as evidence of a process
- 6 -
of diffusion of consumption through which a stage of low and homogenous average consumption
levels is followed by another stage of expansion accompanied by a growing territorial disparity
culminating in one of the highest average levels of consumption and again even more homogenous.
This represents a typical inverted U shaped trajectory, highlighted by other aspects in the regional
historical and economic evolution13.
TABLE 2
Distribution of Spanish provinces according to consumption intervals
(Litres per person per year)
Intervals 1925 1933 1955 1965 1981
< 25 29 17 5 4 0
25 - 49 12 15 18 6 0
50 - 74 3 8 11 17 0
75 - 99 1 1 5 10 9
100 - 124 1 1 5 7 11
125 - 149 0 0 2 3 13
150 > 3 7 4 3 17
Number of provinces 49 49 50 50 50
Maximum consumption 175 309 278 202 203
(Name of province) Guipúzcoa Guipúzcoa Lugo Santander Santander
Minimum consumption 4 5 14 15 78
(Name of province) Cuenca Cuenca Cuenca Cuenca Alicante
Consumption Differences 171 304 264 187 125
Source: Statistics cited in Table 1
All these data serve to illustrate some of the limitations in average estimates. In some Spanish
provinces in the 1930s the mean consumption was around 5 liters per person (Table 2), it was quite
a low value. Obviously it reflects low consumption standards but more probably it is a consequence
of high proportions of population that were not consuming this food. In fact, a contemporary
observer wrote: “Thousands of Spanish households don’t usually have milk with the exception of
sick people”14. Thus, the comparison of averages of milk consumption between Spanish provinces
or within the same provinces, but in two different periods of time, may induce wrong conclusions if
the consumer population is not taken into account.
13
Williamson, J. G, 1965. 14
Carrasco, E, 1934.
- 7 -
There are other aspects in average estimates to consider. On this point it might be useful to
distinguish between two parameters: the quantities consumed and their frequency. In terms of the
first parameter the most reasonable thing would be to think of some magnitudes that could be
expressed according to the fractions of a basic and viable unit of consumption. With regard to the
second parameter, it would be reasonable to accept that in the case of this foodstuff regular, daily,
occasional or the total lack consumption could occur. The evidence from the data advises taking
these elements into account when analyzing them. For example, if the mean annual consumption
per inhabitant in a province in 1925 is 4 liters (the province of Cuenca in Table 2) this would mean
some 11 ml a day, which is an unrealistic quantity in practical terms. It doesn’t seem likely that the
consumption of a product, in a time when prolonged conservation was not possible, would have
occurred using utensils that were not cups or glasses, the normal size of which, due to their own
design, exceeds such quantities. These modalities of consumption should be expressed in
equivalences, or fractions, of a bowl of milk (250 ml), for example, of a half or a quarter its size.
This way, this level of provincial consumption would only make sense if it meant expressing a
frequency of consumption that was not daily, if, for example, it were once a month, the quantity
would be closer to 250 ml, or as it has already been reasoned in the previous argument, if the
proportion of the non-consumer population was very high.It is obvious that, in the other extreme of
consumption levels, the provinces with more than 150 liters per person per year would involve a
daily consumption close to half a liter of milk.Under this value is highly likely to be almost a
universal pattern of consumption in all the provincial population.
All this previous discussion and the problem to be resolved can be expressed formally:
nConsumptioEffective
c
nConsumptioObserved Xf
XPopulationConsumer
nConsumptio Total1
Population Total
nConsumptio Total__
(1)
The way the problem is set out is how to adjust specific average levels of observed consumption,
computed from published statistics, ( nConsumptioObservedX ), which could even be rather improbable, to
other more realistic ones: the effective consumption levels ( nConsumptioEffectiveX ).In short, this would
mean transforming the likely difference between these two means into an equality as a
consequence of the introduction of a correction factor (fc) into the average consumption level
obtained from the statistics, where such a factor would be the equivalent to the proportion of the

- 8 -
consumer population15. Logically, if the entire population is also the consumer population, this factor
would be equivalent to the unit. This relationship between consumption levels and the proportion of
the existing consumer population for the entire Spanish population would be applied in the same
way to each “j” province, because at this scale the disparity )()( jEffectiveCjObservedC XX would also
be met and the “correction” or adjustment of this could be obtained by estimating the proportion of
the consumer population of each of the provinces.
This expression also illustrates the main difficulty to deal with, which is the presence of two
unknowns. If an estimate of the effective consumption were available then from expression (1),
calculating the consumer population would be straightforward16. The adjustment of observed
consumption to an effective one seems to be an arbitrary solution if it is taken without reference to a
particular food. It involves the need of some assumptions and data about patterns of distribution
and diffusion of consumption in the population. In this case the evolution of milk consumption in
Spain from 1925 to 1981 will illustrate this approach and methodology.
3. Methodology for adjusting the consumption levels and the estimate of the
number of consumers: basic principles and approach
In the first place, it seems necessary to have a statistical model for the distribution of consumption
that would permit us to infer what proportions of the population would consume particular quantities.
On this point, the use of Log-Normal distribution would be the most appropriate one because it has
been used in the formation of various economic activities, including the consumption of different
types of products or services17. This way, the distribution of the consumer population of this
foodstuff could be estimated using the following density function applied to the data of the Spanish
provincial statistics:
15
population Total
populationConsumer cf
because when it is replaced in (1) it guarantees the identity between both sides
of the equality, that is statistical and effective mean consumption.
16 From expression (1) if the total output consumed and the effective consumption per capita are known, the estimate of consumer
population would be :
n.Consumptio TotalPopulationConsumer
.ConsEffectiveX
17 A revision of various applications in economic studies in Raymond Lawrence 1988. In the specific case of historic populations, the
study made by Robert Fogel 1992, assumes this same distribution in the analysis of the nutritional state of the population. A critical
evaluation of this hypothesis in Trevon .D Logan 2006.
- 9 -
2
2ln
2
1exp
2
1)( mx
xxf j
j
j (2)
Where f(xj) corresponds to the total population that consumes a quantity of milk on a daily basis in
province “j”, xj corresponds to the averages of consumption of each “j” province and the two
parameters “m” and “σ” make reference to the averages and standard deviation of the distribution
obtained from all the provincial values. The f(xj) values will describe a theoretical distribution of
consumers for all the Spanish population according to the mean and variance provincial values.
One of the characteristics to remember about this distribution is its asymmetric nature, deviated
towards the left, and therefore, the mean, mode and median do not present identical values18. This
property would be of greater interest if a study of the temporal evaluation of consumption habits
were to be considered, because this leaves the fact that the variations in mean or mode do not have
to be of the same magnitude and therefore follow similar trajectories open to consideration.
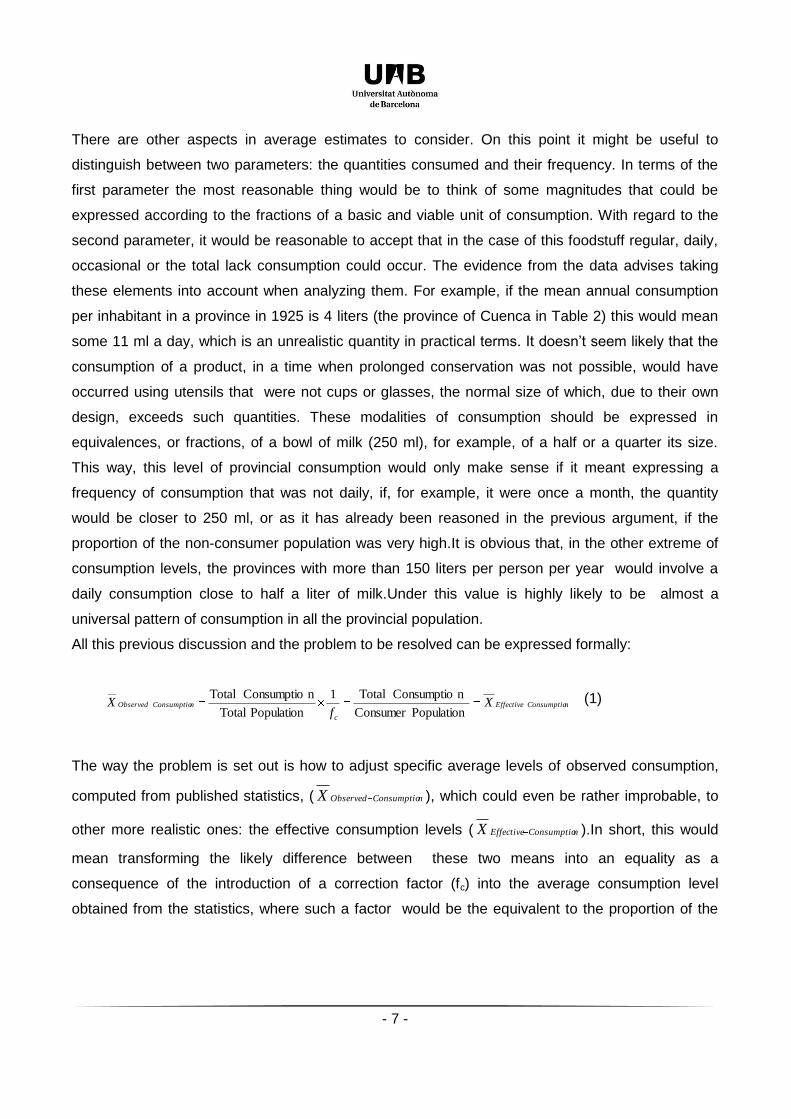
Obviously, it would be better to verify that the statistical model adopted for reconstructing the
distribution of the consumption of this foodstuff were the most appropriate option. For lack of
individual data the only way of confirming this is the provincial values. Table 3 displays the results of
the two statistics that test the hypothesis where the distribution of the logarithms of the
aforementioned provincial consumption averages adjusts itself to the normal distribution19. In any
event, as the significance levels show, the null hypothesis cannot be rejected. Therefore, it seems
reasonable to suppose that the consumption of milk follows this model of distribution.
18
In Log-Normal distribution the median is included between the mode and the mean, closer to the first than to the second. In short, the
median is twice as close to the mean than to the mode.
19 Remember that a random variable follows the log-normal distribution if its logarithm follows the normal distribution. Formerly, therefore,
the null hypothesis to test is ),(log: 2
)(log)(log0 jj xxj NxH , where xj corresponds to the mean consumption of milk for each
province.
- 10 -
TABLE 3
Spain (1925-81)
Distribution of average provincial consumption of milk
Normality Tests
Statistics Statistics
Kolmogorov-Smirnov-Lilliefors Shapiro Wilk
Year D (n) Sig. Level W Sig. Level
1925 0.086 0.200 0.967 0.181
1933 0.091 0.200 0.972 0.295
1955 0.085 0.200 0.983 0.687
1965 0.100 0.200 0.968 0.198
1981 0.112 0.169 0.965 0.156
Source:Statistics cited in Table 1
Moreover, knowledge about patterns of consumption cannot be approached without being
considered, as it has been advised, as a process of diffusion. From a theoretical point of view, the
most basic representation of a process of diffusion is when the people adopting it follow a normal
distribution pattern where the different categories of these people are located 20. Therefore, a
hundred percent of the population included within the function would have been integrated in the
initial stage by 2.5% of the innovators and 13.5% of the early adopters. In this phase the rest of the
population would either have practiced sporadic consumption or they wouldn’t have consumed milk
at all. In the following stage 34 percent of the denominated early majority and 34 percent of the late
majority of adopters would have joined. Consumption as well as its frequency would have become
generalized, and the distance between the sectors consuming more and those consuming less
would have increased. Finally, in the final stage, 16 percent of late adopters would have joined, then
the generalization of consumption would have been accompanied by higher average levels and a
greater uniformity in consumption habits.
The adoption of milk as a foodstuff for daily use in Spain, according to the quantitative and
qualitative information available, should be understood as a process of these characteristics. This is
a foodstuff that for reasons of technology, health and food culture at the end of the 19th and
beginning of the 20th century was an object of restricted consumption, often related to therapeutic
20
Rogers, E M. 2003, p.279-283.
- 11 -
purposes, it went on gradually to form part of the diet of particular social groups and sections of the
population, for example, children and young people21.
It is beyond scope of this article to introduce a detailed account of this diffusion process.
Unfortunately, sources of data are scarce. For example, Medical Surveys22 carried out by medical
doctors in many Spanish localities in the 19th and first half of the 20th centuries used to give most
qualitative than quantitative information about nutritional habits and conditions of the inhabitants23.
More quantitative sources are available in hospitals, but this kind of data have not been always
published24, or in some special surveys. Two documents can be mentioned here. One is the report
written by The Commission on the Reform of Consumption Tax in 190825 (Table 4) and the other
one, a research on the nutritional status of the population living in rural areas of the province of
Jaen (in the region of Andalusia) in the first years of the 30s carried out by the physician F.Jiménez
and the pharmacist M. Jiménez26.
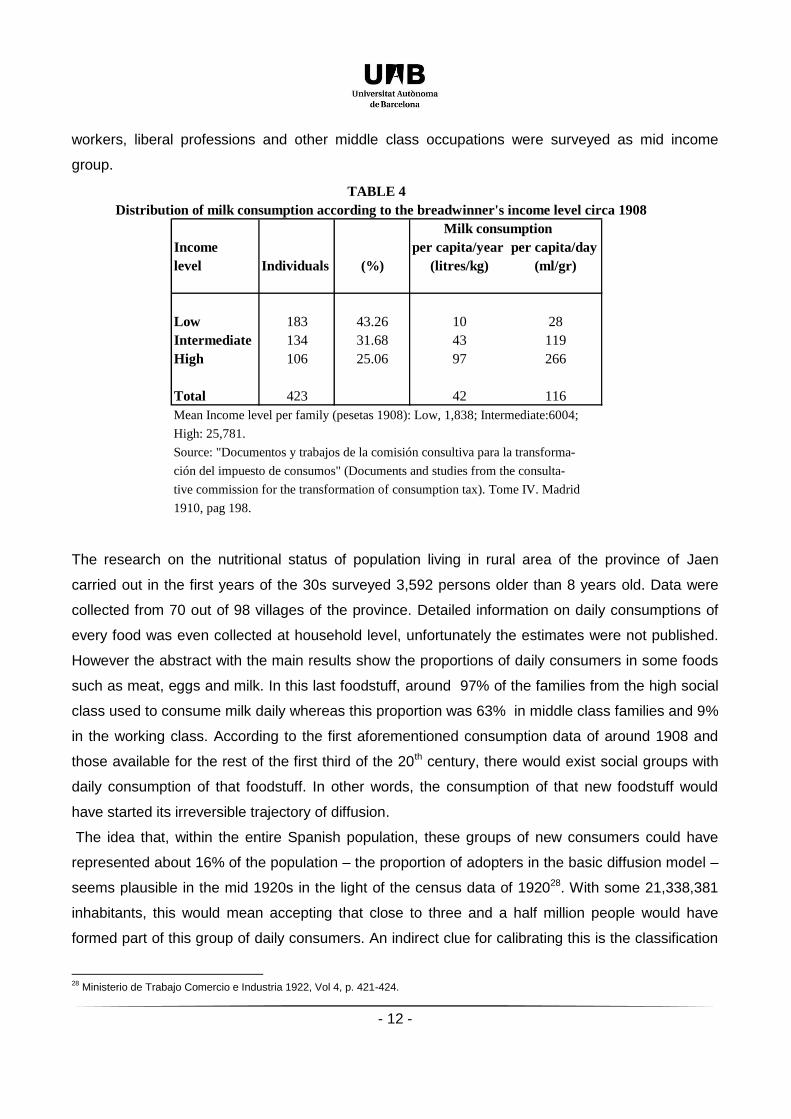
The report from the Commission in 1908 surveyed only 79 families (434 individuals) and this
document can obviously not be considered as something representative of the entire Spanish
population of the time; however it does offer two types of results that are of interest to the present
discussion. On the one hand, an average level of consumption per annual capita of 42 liters would
not be too far above the averages known for the beginning of the 20th century, estimated around 35
or 45 liters (Table 127). On the other hand, this permits an estimate to be made of the social
differences in consumption, depending on the various levels of income of the “breadwinners”, and,
as a result, it illustrates the different modalities of consumption. An aspect of particular interest is
the considerable disparity between the annual (and daily) milk consumption averages from the
social groups of higher and lower income. In the case of the first group this would mean taking
around the equivalent of a quarter of a liter a day, while in the rest of the groups these daily
quantities would be so meager that they could be interpreted as evidence of an irregular or
occasional type of consumption. Additional information in the report shows that the high income
group was composed by entrepreneurs, owners and stockholders, whereas civil servants, service
21
Nicolau-Nos, R, Pujol-Andreu, J and Hernández, I, 2010. 22
These surveys known as “Medical Topographies” or “Medical Geographies”, submitted to the Royal Academy of Medicine were not always published. 23
For example, out of the 45 surveys carried out in Catalonia from 1798 to 1907, only 7 gave quantitative information on milk consumption, R. Nicolau, R, J. Pujol-Andreu, and I. Hernández 2010. 24
References to different amounts of milk consumed in Spanish health centres and hospitals prior to 1936 can be found in R. Nicolau, J Pujol-Andreu, and I Hernández 2007. In the case of data on milk consumption in hospitals, around 200 liters per stay, per year, would be compatible with daily averages situated in the maximum levels of 350 ml adopted here. 25
Documentos y trabajos de la comisión consultiva para la transformación del impuesto de consumos, Vol IV, 198(Documents and works by the consultative commission for the transformation of the consumptions tax). 26
F.Jiménez and F.Jiménez, 1934 27
Cusso estimates a consumption of 36 liters per person per year in 1865 X.Cussó, 2001, p.322 and I. Hernández ,2005, p.156, of 44 liters per person per year in 1917.
- 12 -
workers, liberal professions and other middle class occupations were surveyed as mid income
group.
TABLE 4
Distribution of milk consumption according to the breadwinner's income level circa 1908
Milk consumption
Income per capita/year per capita/day
level Individuals (%) (litres/kg) (ml/gr)
Low 183 43.26 10 28
Intermediate 134 31.68 43 119
High 106 25.06 97 266
Total 423 42 116
Mean Income level per family (pesetas 1908): Low, 1,838; Intermediate:6004;
High: 25,781.
Source: "Documentos y trabajos de la comisión consultiva para la transforma-
ción del impuesto de consumos" (Documents and studies from the consulta-
tive commission for the transformation of consumption tax). Tome IV. Madrid
1910, pag 198.
The research on the nutritional status of population living in rural area of the province of Jaen
carried out in the first years of the 30s surveyed 3,592 persons older than 8 years old. Data were
collected from 70 out of 98 villages of the province. Detailed information on daily consumptions of
every food was even collected at household level, unfortunately the estimates were not published.
However the abstract with the main results show the proportions of daily consumers in some foods
such as meat, eggs and milk. In this last foodstuff, around 97% of the families from the high social
class used to consume milk daily whereas this proportion was 63% in middle class families and 9%
in the working class. According to the first aforementioned consumption data of around 1908 and
those available for the rest of the first third of the 20th century, there would exist social groups with
daily consumption of that foodstuff. In other words, the consumption of that new foodstuff would
have started its irreversible trajectory of diffusion.
The idea that, within the entire Spanish population, these groups of new consumers could have
represented about 16% of the population – the proportion of adopters in the basic diffusion model –
seems plausible in the mid 1920s in the light of the census data of 192028. With some 21,338,381
inhabitants, this would mean accepting that close to three and a half million people would have
formed part of this group of daily consumers. An indirect clue for calibrating this is the classification
28
Ministerio de Trabajo Comercio e Industria 1922, Vol 4, p. 421-424.
- 13 -
of the population by profession. Despite the corresponding problems of interpretation, the total
amount of registered “employers” in agriculture, industry and trade, plus those linked to the
administration, liberal professions and rentiers adds up to almost two million individuals (1,921,917
persons). These groups have a social profile close to the high income group surveyed in the
Commission report of 1908. Around 70% were enumerated as married, if each one of these
people is interpreted as being a breadwinner of a household, when they are multiplied by a number
of members, for example 3 or 3.5, the percentage of potential daily consumers fluctuates between
18 and 22%.
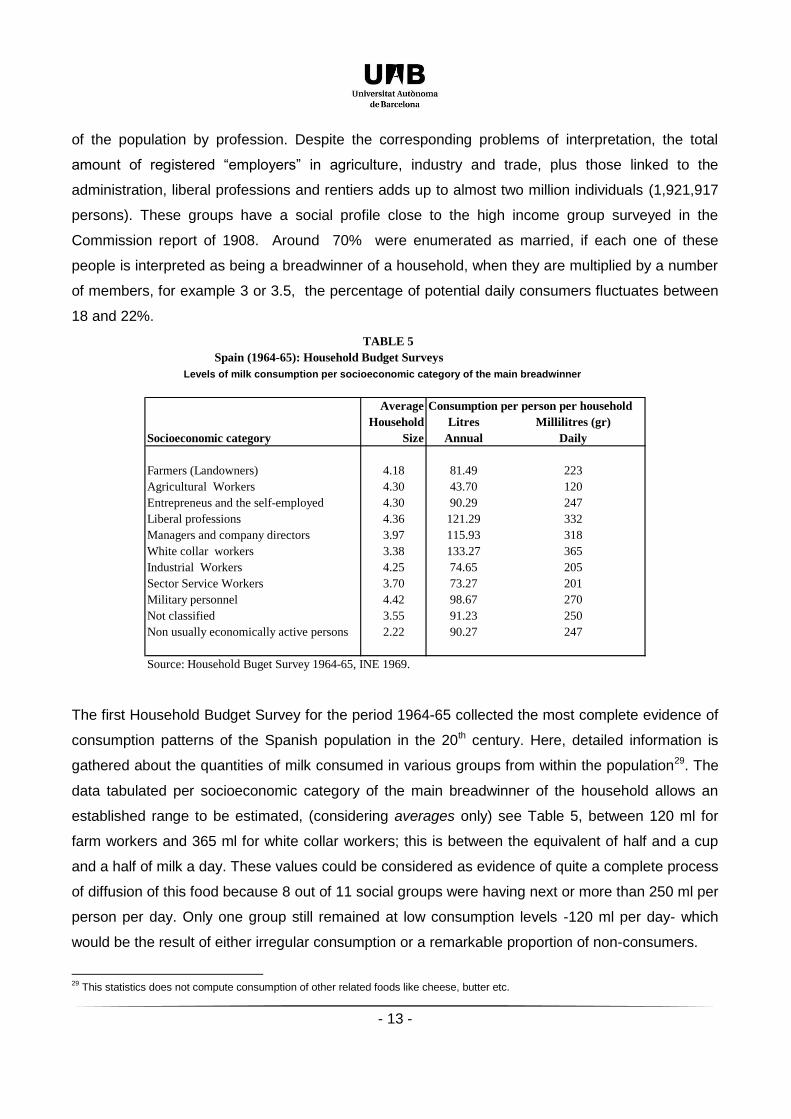
TABLE 5
Spain (1964-65): Household Budget Surveys
Levels of milk consumption per socioeconomic category of the main breadwinner
Average Consumption per person per household
Household Litres Millilitres (gr)
Socioeconomic category Size Annual Daily
Farmers (Landowners) 4.18 81.49 223
Agricultural Workers 4.30 43.70 120
Entrepreneus and the self-employed 4.30 90.29 247
Liberal professions 4.36 121.29 332
Managers and company directors 3.97 115.93 318
White collar workers 3.38 133.27 365
Industrial Workers 4.25 74.65 205
Sector Service Workers 3.70 73.27 201
Military personnel 4.42 98.67 270
Not classified 3.55 91.23 250
Non usually economically active persons 2.22 90.27 247
Source: Household Buget Survey 1964-65, INE 1969.
The first Household Budget Survey for the period 1964-65 collected the most complete evidence of
consumption patterns of the Spanish population in the 20th century. Here, detailed information is
gathered about the quantities of milk consumed in various groups from within the population29. The
data tabulated per socioeconomic category of the main breadwinner of the household allows an
established range to be estimated, (considering averages only) see Table 5, between 120 ml for
farm workers and 365 ml for white collar workers; this is between the equivalent of half and a cup
and a half of milk a day. These values could be considered as evidence of quite a complete process
of diffusion of this food because 8 out of 11 social groups were having next or more than 250 ml per
person per day. Only one group still remained at low consumption levels -120 ml per day- which
would be the result of either irregular consumption or a remarkable proportion of non-consumers.
29
This statistics does not compute consumption of other related foods like cheese, butter etc.
- 14 -
Despite the scarce data available from the beginning of the 20th century, when it is compared with
that of the first Household Budget Survey from 1964-65, the best evidence available would be that
the diffusion of milk consumption in the Spanish population was based, on the one hand, on the
existence of consolidated groups of regular consumers and on the other hand, on the fact that it
socially extended in both the increase in the quantities consumed and in the number of consumers.
It is important to notice that high consumption standards seem to converge to similar levels between
100 and 130 liters per person per year. In this case, these values fit to the historical statistics of high
consuming countries or, even for the most recent periods, to the information collected from surveys
on consumption. Here all the data available seem to suggest that with consumption above 350 ml
per day per person (130 liters per person per year), more than 90% of the population should have
been consuming (always in terms of mean values)30. In the other extreme, data on minimum
consumption do not converge to similar levels. This result could be expected because, as it has
been previously observed, these means would be computing no only irregular –not daily-
consumption but also lack of consumption at all. This last observation suggests that the search for a
“reasonable” level of minimum consumption, under a general pattern of diffusion more than a task
of collecting data would be the result of a simulation exercise. Therefore a simulation exercise could
be put forward based on modeling consumption patterns through a log-normal distribution. The
results should justify the final choice of a minimum average level of consumption related to a
“critical mass” of daily consumers.
Graph 1 presents the different levels of daily consumption that correspond to the first, second
(median) and third quartiles of distributions of consumption. These have been calculated using
some levels that would situate the average consumption per person per year within 25, 35, 45, and
55 liters, and magnitudes of standard deviation of 20, 40 and 60 liters, which cover a large part of
the provincial variations in the observable consumption patterns of the 20th century (see Table 1).
Tables 6A and 6B show the estimates of proportions of consumer populations having more than or
equal to 250 ml and 125 ml a day according to the same values of average consumption and
standard deviation as Graph 1.
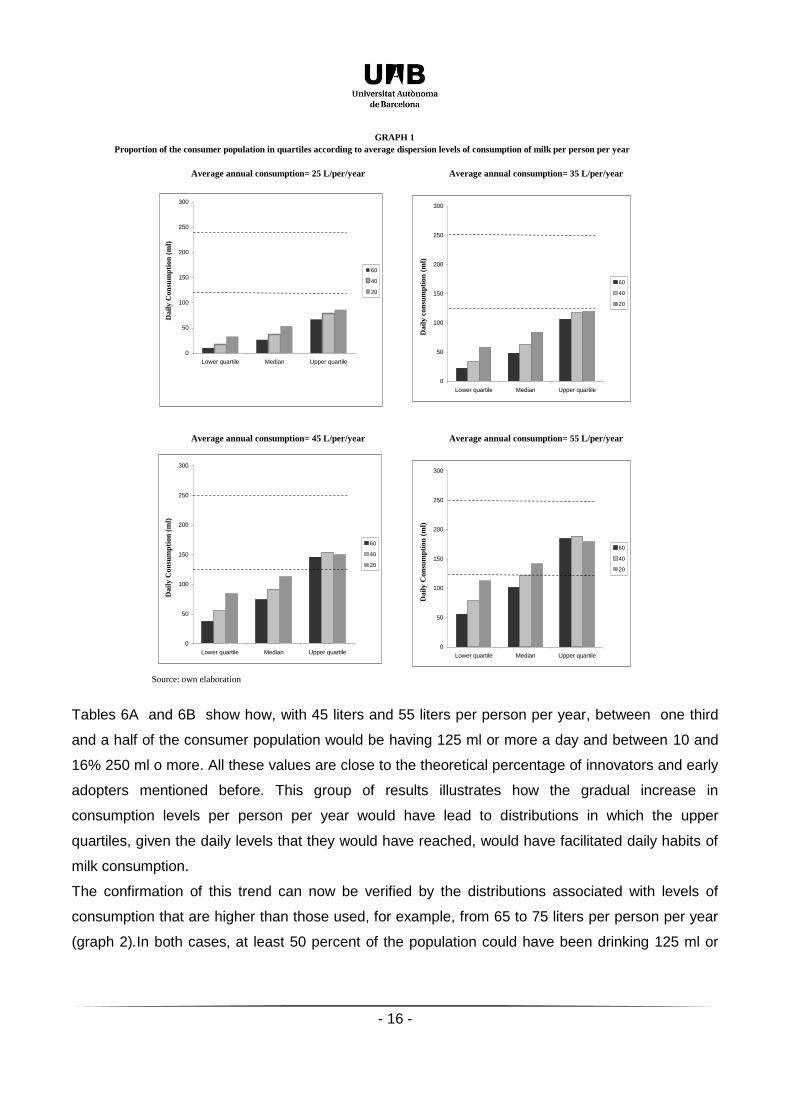
In the lowest levels of consumption, 25 and 35 liters per person per year (Graph 1), distributions
would not have reached average daily quantities which can be fractions of 250 ml, the equivalent to
one cup a day (marking the limits with some discontinuous lines between 125 and 250 ml). These
30
Data from the statistics of the FAO published in 1953, cited in C. Agenjo, 1957, p. 315 indicate that in the five-year period of 1930-34 the countries with consumption levels above 130 litres/inhabitant/year were Austria, Denmark, Ireland, Holland and the United States and those with consumption levels close to 200 litres were Sweden, Switzerland, New Zealand, Norway and Canada. In fact, this would be a high estimate, if the most recent data were taken into account (the data corresponding to the year 2007) which would situate the average consumption per person per year in Spain at around 88 kg, calculating that 96% of the population consume milk on a daily basis (see the report from FENIL ,2008).
- 15 -
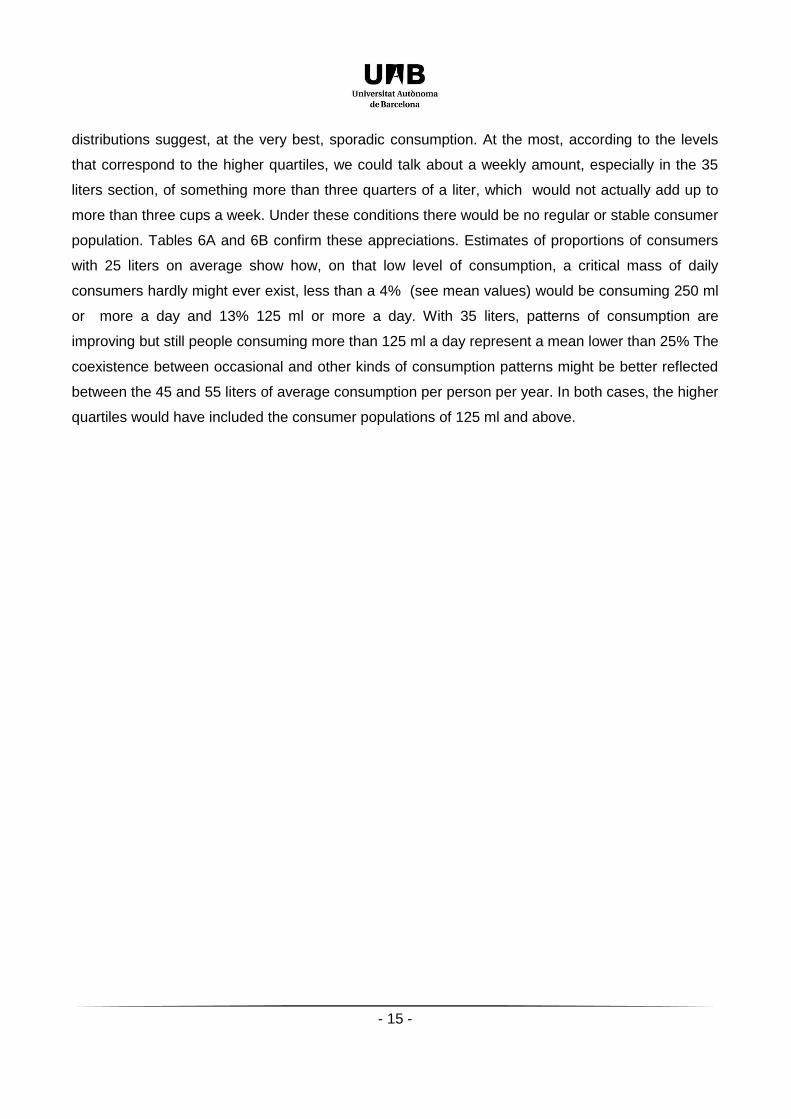
distributions suggest, at the very best, sporadic consumption. At the most, according to the levels
that correspond to the higher quartiles, we could talk about a weekly amount, especially in the 35
liters section, of something more than three quarters of a liter, which would not actually add up to
more than three cups a week. Under these conditions there would be no regular or stable consumer
population. Tables 6A and 6B confirm these appreciations. Estimates of proportions of consumers
with 25 liters on average show how, on that low level of consumption, a critical mass of daily
consumers hardly might ever exist, less than a 4% (see mean values) would be consuming 250 ml
or more a day and 13% 125 ml or more a day. With 35 liters, patterns of consumption are
improving but still people consuming more than 125 ml a day represent a mean lower than 25% The
coexistence between occasional and other kinds of consumption patterns might be better reflected
between the 45 and 55 liters of average consumption per person per year. In both cases, the higher
quartiles would have included the consumer populations of 125 ml and above.
- 16 -
GRAPH 1
Proportion of the consumer population in quartiles according to average dispersion levels of consumption of milk per person per year
Average annual consumption= 25 L/per/year Average annual consumption= 35 L/per/year
Average annual consumption= 45 L/per/year Average annual consumption= 55 L/per/year
Source: own elaboration
0
50
100
150
200
250
300
Lower quartile Median Upper quartile
Da
ily
Co
nsu
mp
tio
n (
ml)
60
40
20
0
50
100
150
200
250
300
Lower quartile Median Upper quartile
Da
ily
co
nsu
mp
tio
n (
ml)
60
40
20
0
50
100
150
200
250
300
Lower quartile Median Upper quartile
Da
ily
Co
nsu
mp
tio
n (
ml)
60
40
20
0
50
100
150
200
250
300
Lower quartile Median Upper quartile
Da
ily
Co
nsu
mp
tio
n (
ml)
60
40
20
Tables 6A and 6B show how, with 45 liters and 55 liters per person per year, between one third
and a half of the consumer population would be having 125 ml or more a day and between 10 and
16% 250 ml o more. All these values are close to the theoretical percentage of innovators and early
adopters mentioned before. This group of results illustrates how the gradual increase in
consumption levels per person per year would have lead to distributions in which the upper
quartiles, given the daily levels that they would have reached, would have facilitated daily habits of
milk consumption.
The confirmation of this trend can now be verified by the distributions associated with levels of
consumption that are higher than those used, for example, from 65 to 75 liters per person per year
(graph 2).In both cases, at least 50 percent of the population could have been drinking 125 ml or
- 17 -
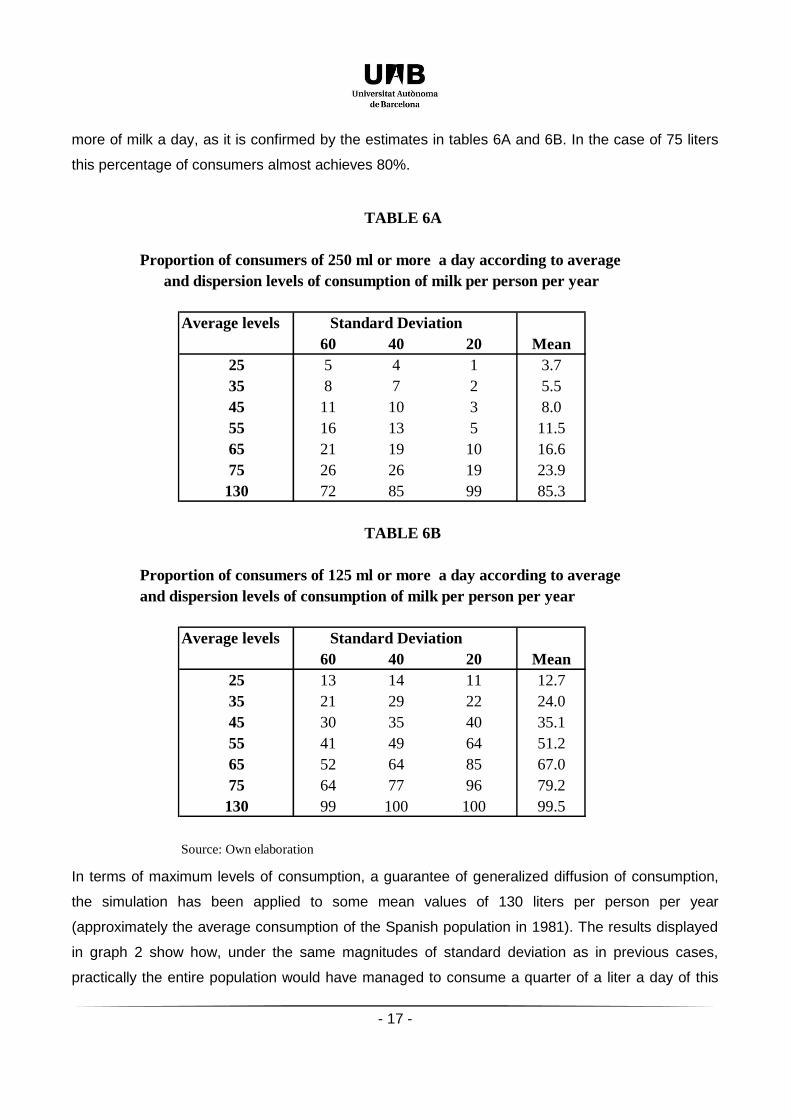
more of milk a day, as it is confirmed by the estimates in tables 6A and 6B. In the case of 75 liters
this percentage of consumers almost achieves 80%.
TABLE 6A
Proportion of consumers of 250 ml or more a day according to average
and dispersion levels of consumption of milk per person per year
Average levels Standard Deviation
60 40 20 Mean
25 5 4 1 3.7
35 8 7 2 5.5
45 11 10 3 8.0
55 16 13 5 11.5
65 21 19 10 16.6
75 26 26 19 23.9
130 72 85 99 85.3
TABLE 6B
Proportion of consumers of 125 ml or more a day according to average
and dispersion levels of consumption of milk per person per year
Average levels Standard Deviation
60 40 20 Mean
25 13 14 11 12.7
35 21 29 22 24.0
45 30 35 40 35.1
55 41 49 64 51.2
65 52 64 85 67.0
75 64 77 96 79.2
130 99 100 100 99.5
Source: Own elaboration
In terms of maximum levels of consumption, a guarantee of generalized diffusion of consumption,
the simulation has been applied to some mean values of 130 liters per person per year
(approximately the average consumption of the Spanish population in 1981). The results displayed
in graph 2 show how, under the same magnitudes of standard deviation as in previous cases,
practically the entire population would have managed to consume a quarter of a liter a day of this
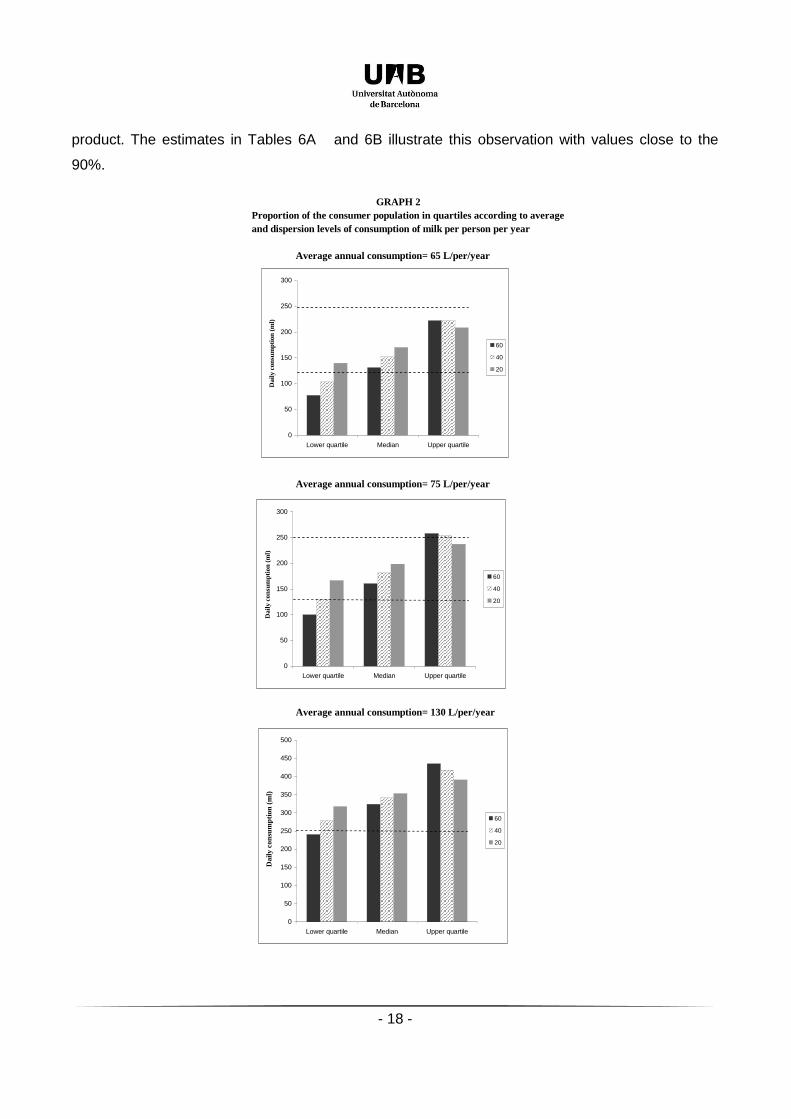
- 18 -
product. The estimates in Tables 6A and 6B illustrate this observation with values close to the
90%.
GRAPH 2
Proportion of the consumer population in quartiles according to average
and dispersion levels of consumption of milk per person per year
Average annual consumption= 65 L/per/year
Average annual consumption= 75 L/per/year
Average annual consumption= 130 L/per/year
0
50
100
150
200
250
300
Lower quartile Median Upper quartile
Da
ily c
on
sum
pti
on
(m
l)
60
40
20
0
50
100
150
200
250
300
Lower quartile Median Upper quartile
Da
ily c
on
sum
pti
on
(m
l)
60
40
20
0
50
100
150
200
250
300
350
400
450
500
Lower quartile Median Upper quartile
Dail
y c
on
sum
pti
on
(m
l)
60
40
20
- 19 -
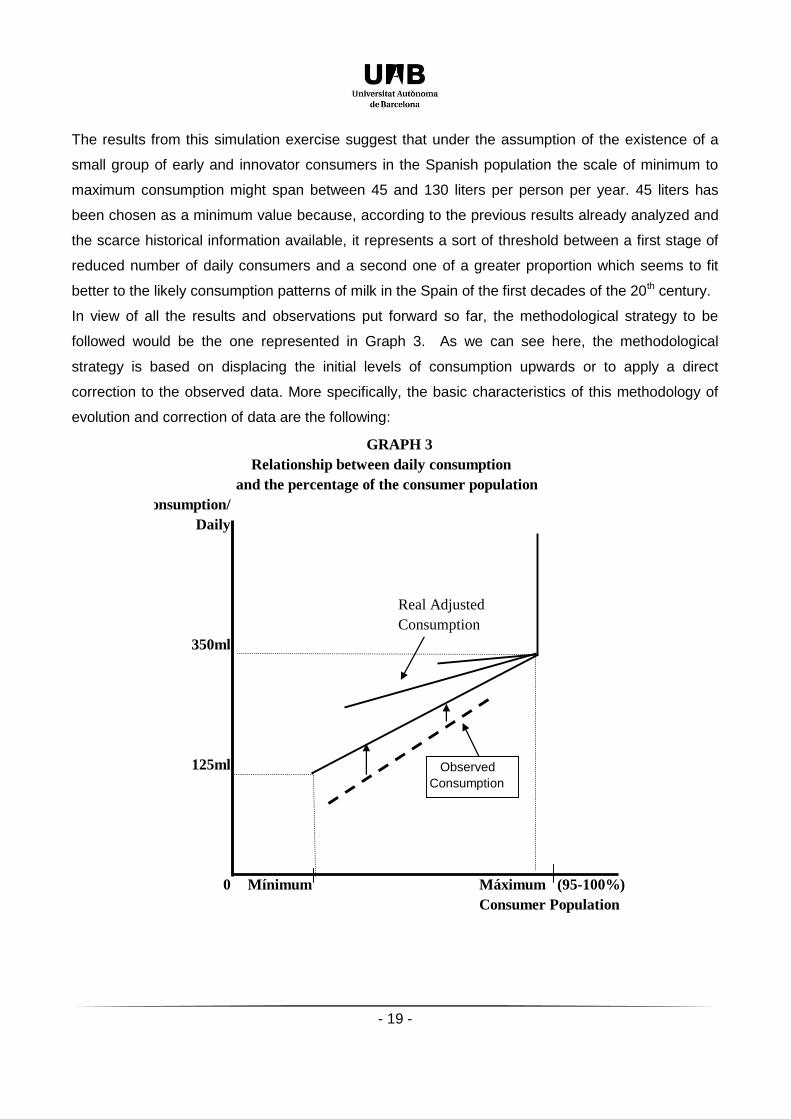
The results from this simulation exercise suggest that under the assumption of the existence of a
small group of early and innovator consumers in the Spanish population the scale of minimum to
maximum consumption might span between 45 and 130 liters per person per year. 45 liters has
been chosen as a minimum value because, according to the previous results already analyzed and
the scarce historical information available, it represents a sort of threshold between a first stage of
reduced number of daily consumers and a second one of a greater proportion which seems to fit
better to the likely consumption patterns of milk in the Spain of the first decades of the 20th century.
In view of all the results and observations put forward so far, the methodological strategy to be
followed would be the one represented in Graph 3. As we can see here, the methodological
strategy is based on displacing the initial levels of consumption upwards or to apply a direct
correction to the observed data. More specifically, the basic characteristics of this methodology of
evolution and correction of data are the following:
GRAPH 3
Relationship between daily consumption
and the percentage of the consumer population
Consumption/
Daily
Real Adjusted
Consumption
350ml
125ml
0 Mínimum Máximum (95-100%)
Consumer Population
Observed
Consumption
- 20 -
a) The scale of variation of consumption is delimited within that of the proportion of the associated
consumer population, between a minimum of 125 ml and a maximum of 350 ml a day or their
equivalents in terms of average levels of 45 or 130 liters per person per year (Annex 1). Adopting
this minimum value means accepting, first, that consumption of this foodstuff was in “discrete” units
equivalent to a cup (250 ml) or half a cup (125 ml); second, there was a group of stable, daily,
consumers of this foodstuff in all the Spanish territory and so in each of its provinces. In terms of the
maximum value, it is understood that there would not be as much of an increase in the number of
consumers as in the quantities consumed when the consumer population was close to the 100%
b) The populations do not reach a universal consumption of this foodstuff. For reasons of
preference or the taste of the consumer or associated digestive diseases a particular percentage of
the population would have been impeded from drinking milk on a regular basis (here this would be
situated between 95-100%)31.
c) As a consequence of the same process of diffusion, the relationship between the average levels
of consumption and the proportion of the consumer population is changeable over time. Therefore,
as graph 3 shows, with the increase in average levels of consumption of the total number of
inhabitants not only would the distance between the minimum and maximum levels decrease, but
its slope would change, tending towards a more horizontal position as an effect of the growing
homogeneity of consumption habits.
4. Applying the methodology: reconstruction of consumer population of milk in Spain (1925-1981)
This approach allows a transformation of the observed to the effective levels of consumption for
each province and from here to follow a path that ends up in the final estimate of the magnitude of
consumer populations, on a provincial scale also. The stages required by the entire procedure will
be illustrated step by step with the reconstruction of consumer population in 1925 (Tables Annex
2A, 2B and 2C), other tables will present summary statistics and indicators for all the years.
1st. The observed consumption average is identified with one that is equivalent to one within the
scale mentioned previously between 125 and 350 ml 32 (see Annex 1 with the table of
31
Data on the population that do not consume certain foodstuffs, in the specific case of milk consumption, is not always collected in
dietary surveys. In the case of Spain, in the entire population only the estimate provided by a survey from the Foro Interalimentario (Interfood forum) of 2006 (see FENIL, 2008) was found, which places the amount of people who never consume milk at 2% of the Spanish population. On the other hand, the biological-anthropological studies on Spanish adult populations detect some rather low percentages compared to Nordic populations made up of lactose positive individuals – individuals who persist in continuing intestinal lactase activity initiated in infancy – of around 45% compared to 95% in the Scandinavian countries.. J. Peña, et al. 2002. Other estimates for Spain situate this amount at 70% , R. Mace, F. Jordan and C.Holden, 2003. 32
The averages of consumption for each province are set in the new scale through the use of linear interpolation.
- 21 -
equivalences). For example, in Table Annex 2.A provinces with less than 5 litres per person per
year in column (2) were replaced by 45 liters in column (3), which is the minimum consumption
adopted according to the discussion on simulations in the previous section. In the opposite extreme
of the consumption scale, those provinces with computed milk consumptions greater than 130 liters
per person per year practically remain unchanged; only get a slight increase in order to introduce
the assumption that there is no universal consumption (a 100% of all the provincial population
consuming this product).
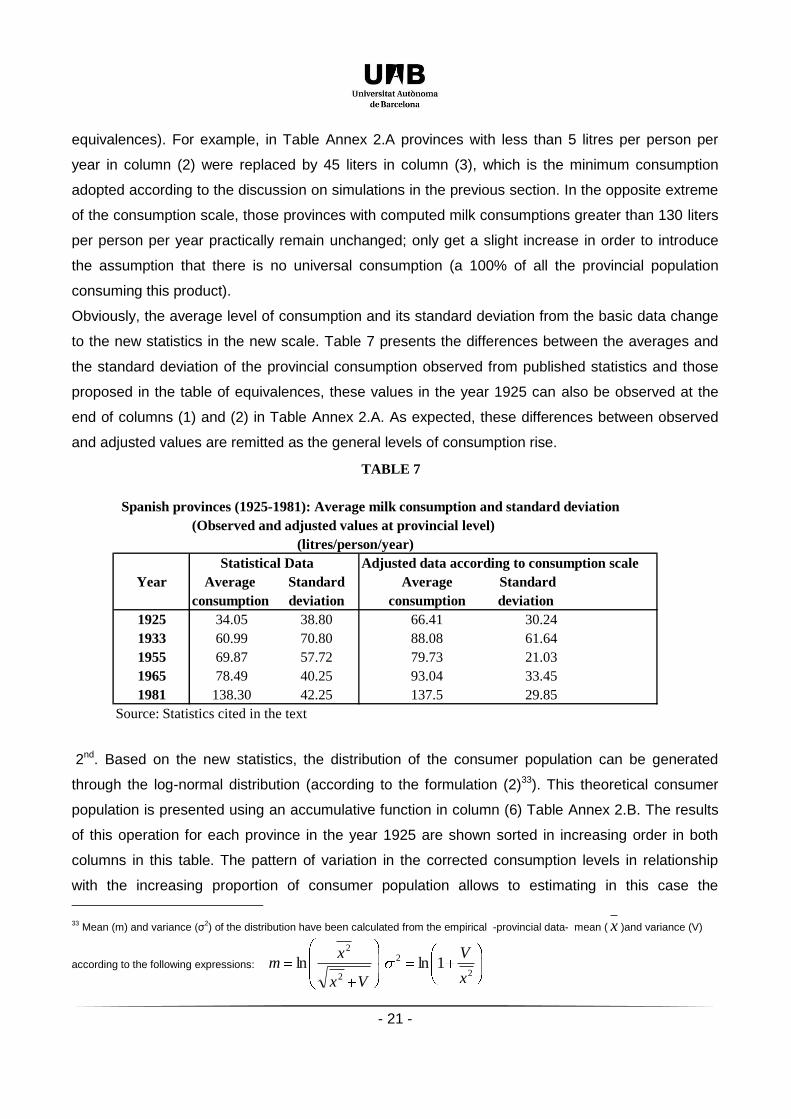
Obviously, the average level of consumption and its standard deviation from the basic data change
to the new statistics in the new scale. Table 7 presents the differences between the averages and
the standard deviation of the provincial consumption observed from published statistics and those
proposed in the table of equivalences, these values in the year 1925 can also be observed at the
end of columns (1) and (2) in Table Annex 2.A. As expected, these differences between observed
and adjusted values are remitted as the general levels of consumption rise.
TABLE 7
Spanish provinces (1925-1981): Average milk consumption and standard deviation
(Observed and adjusted values at provincial level)
(litres/person/year)
Statistical Data Adjusted data according to consumption scale
Year Average Standard Average Standard
consumption deviation consumption deviation
1925 34.05 38.80 66.41 30.24
1933 60.99 70.80 88.08 61.64
1955 69.87 57.72 79.73 21.03
1965 78.49 40.25 93.04 33.45
1981 138.30 42.25 137.5 29.85
Source: Statistics cited in the text
2nd. Based on the new statistics, the distribution of the consumer population can be generated
through the log-normal distribution (according to the formulation (2)33). This theoretical consumer
population is presented using an accumulative function in column (6) Table Annex 2.B. The results
of this operation for each province in the year 1925 are shown sorted in increasing order in both
columns in this table. The pattern of variation in the corrected consumption levels in relationship
with the increasing proportion of consumer population allows to estimating in this case the
33
Mean (m) and variance (σ2) of the distribution have been calculated from the empirical -provincial data- mean ( x )and variance (V)
according to the following expressions:
Vx
xm
2
2
ln2
2 1lnx
V
- 22 -
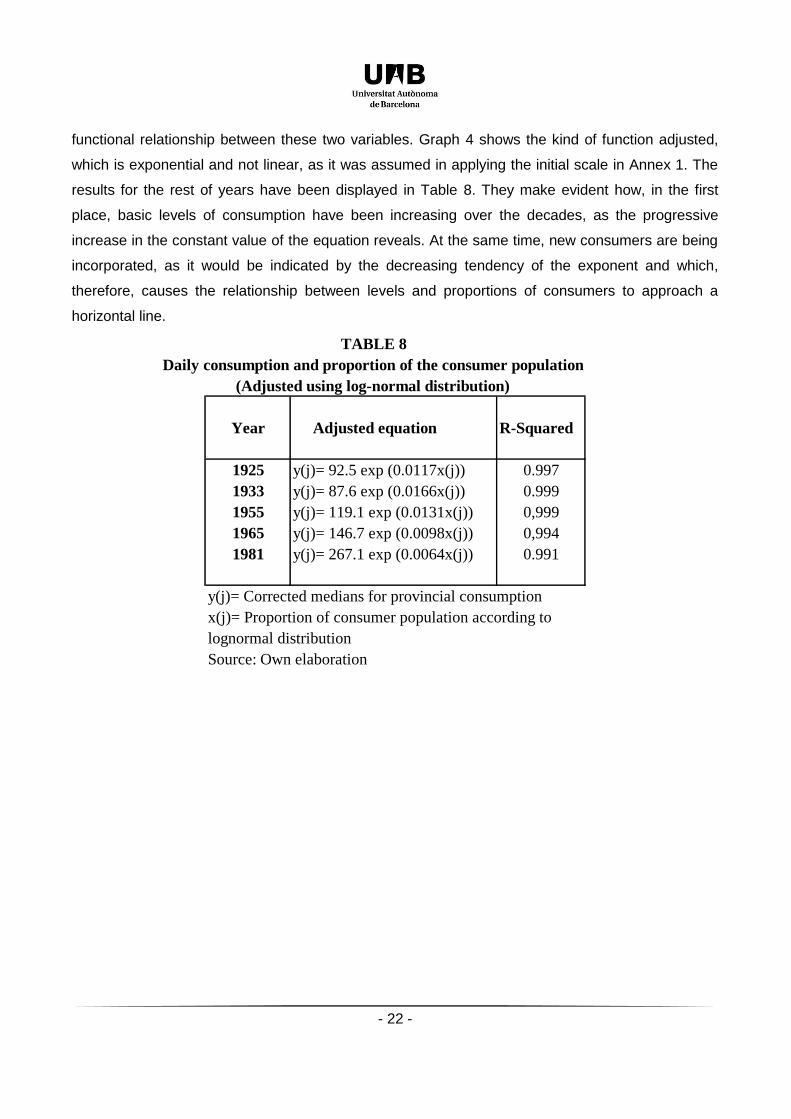
functional relationship between these two variables. Graph 4 shows the kind of function adjusted,
which is exponential and not linear, as it was assumed in applying the initial scale in Annex 1. The
results for the rest of years have been displayed in Table 8. They make evident how, in the first
place, basic levels of consumption have been increasing over the decades, as the progressive
increase in the constant value of the equation reveals. At the same time, new consumers are being
incorporated, as it would be indicated by the decreasing tendency of the exponent and which,
therefore, causes the relationship between levels and proportions of consumers to approach a
horizontal line.
TABLE 8
Daily consumption and proportion of the consumer population
(Adjusted using log-normal distribution)
Year Adjusted equation R-Squared
1925 y(j)= 92.5 exp (0.0117x(j)) 0.997
1933 y(j)= 87.6 exp (0.0166x(j)) 0.999
1955 y(j)= 119.1 exp (0.0131x(j)) 0,999
1965 y(j)= 146.7 exp (0.0098x(j)) 0,994
1981 y(j)= 267.1 exp (0.0064x(j)) 0.991
y(j)= Corrected medians for provincial consumption
x(j)= Proportion of consumer population according to
lognormal distribution
Source: Own elaboration

- 23 -
GRAPH 4
Relantionship between daily consumption and acumulated Spanish provincial population in 1925
y= 92.5 exp( 0.0117x)
R-Sq= 0.997
0
50
100
150
200
250
300
0,00 20,00 40,00 60,00 80,00 100,00
Population Acumulated (percentage)
Dail
y C
om
sum
pti
on
(m
l)
3rd. The slope of the function can be seen in Table 8, it is not of a linear nature. The parameters of
the functions adjusted in this table will be a starting point for the aforementioned readjustment of the
initial scale. Given that the basic data are provincial averages and logically the proportion of the
consumer population is unknown, such parameters can only be applied now to the totals of
provincial populations, organized in hierarchic order (from the smallest to the largest) for each year
studied according to the following formulation:
n
k
k)(j,
Population Total
Popβ
k)C(j,-real αExpX (3)
Where “α” and “β” correspond to the two parameters estimated in Table 8 and the component of the
exponent represent the percentage of accumulated population from each province “j” according to
an established hierarchical order of consumption “k”. In Table Annex 2.C column (9) applies this
procedure to the 1925 data. In this case, the expression (3) applied to the column (8) gives a result
of 101 ml, for example in the case of the province of Almeria (37 liters per person per year)34 .The
34
This estimate is )84.70117.0(0925.0101 e where 0.0925 and 0.0117 are the parameters of the adjusted equation in Table 8 and
7.84 the percentage of accumulated population of Spanish provinces in table A2.C.
- 24 -
result obtained will be the final adjusted provincial consumption average per person per day
(column 9) and per year (column 10)
4th. Once these final corrected levels of consumption have been established, the rest of the
procedure is immediate. Therefore, in the first place, the consumer population can be calculated for
each province according to the expression:
)(
obsj
jest TC
Pop.Consumer jConsEffectiveX
(4)
Where the numerator corresponds to the Total Consumption (TC) of the province “j” according to
the published statistics and the denominator to the effective or adjusted average level of
consumption of the same province, obtained in (3). So, finally, it will be possible to obtain the final
percentage of the total consumer population from the sum of the estimated consumers in each
province, according to expression (4), divided by the total of the Spanish population, for each of the
years under study. In the case of the Spanish consumption for the year 1925, this procedure is
applied in columns (12) and (13) in Annex 2.C. The final estimate of consumer population was 43%
of all the Spanish population and the adjusted level of consumption per person per year was 84,53
liters.
The final results of this procedure are presented in Table 11, corresponding to the percentages of
the consumer population, the observed levels of consumption per capita and those for adjusted
consumption for the entire Spanish population. Finally, the log-normal distribution permits to
calculate the distribution percentage for the consumer population of milk during the various intervals
of consumption for each year, presented in Table 12 and Graph 5. Before the analysis of results it
could be useful to evaluate, through a sensitivity analysis, some of the basic assumptions made in
this reconstruction procedure.
As it has been stated, a central step in this approach is the adjustment made upon the statistical
means with the scale presented in Annex 1. In spite of the final adjustment practiced in the third
step of the procedure it is quite obvious that this initial scale might have strongly conditioned the
results. Table 9 and Table 10 display the results of a sensitivity analysis for the years 1925 to 1965,
before the proportion of consumer populations achieves 95%. This analysis evaluates the effects
caused by a change in the initial scale, particularly in minimum levels of consumption on the final
estimates of consumers and their statistics of consumption (mode, median and mean).Two different
assumptions about the range of variation in the scale of adjustment have been adopted: (A)
Between 35 and 130 liters per person per year and (B) Between 55 and 130 liters per person per

- 25 -
year. These are 10 liters above and below the 45 liters as the minimum consumption level in Annex
1.
TABLE 9
Sensitivity analysis in the estimates of consumer populations
1925, 1933 and 1955
Item 1925 1933 1955 1965
Consumer
population (%) (Table 11) 43 56 59 78
Change in
minimum consumption
Consumer population (%):
(A) 55 liters 39 51 55 72
(B) 35 liters 49 59 63 80
Differences Estimates-(A) 4 5 4 6
(%) 9.04 7.07 6.78 7.69
Differences Estimates-(B) -6 -3 -4 -2
(%) -14.64 -7.98 -6.78 -2.05
Source: Own elaboration
As it could be expected, if minimum consumption had been higher (55 liters), the proportion of
consumers would have been overestimated (Table 9). For example in the year 1933 it would have
been 51 instead of 55%. If minimum consumption had been lower (35 liters), these effects would
have run in the opposite direction. However, differences between estimates shown in table 9
suggest that changes in the initial scale of adjustment do not involve strong variations in the
estimates of population proportions. Most differences are less than 5% and, in general, intervals do
not change appreciations about consumption patterns in each year. For example, an interval of
consumers estimated in 1925 would be between 39 and 49%, always showing that less than half of
the Spanish population did not consume milk. At the end of this period, 1965, a range of variation in
consumer population between 72 and 80% does not modify any basic conclusion about the fact that
three quarters of the population were drinking milk daily.
- 26 -
TABLE 10
Sensitivity analysis in the estimates of statistics of consumption
1925, 1933 and 1955
(daily consumption per person ml/gr)
Item 1925 1933 1955 1965
Mode 131 135 212 226
Median 163 203 258 248
Mean 182 249 284 259
Change in
minimum consumption:
(A) 55 liters Mode 161 157 231 241
Median 188 223 275 257
Mean 204 266 300 266
(B) 35 liters Mode 99 115 190 222
Median 136 184 240 242
Mean 159 234 271 253
Diff Mode-Mode(A) (%) -22.48 -16.70 -8.89 -6.53
Diff Mode-Median(A) (%) -15.13 -9.99 -6.56 -3.90
Diff Mode-Mean(A) (%) -11.69 -6.78 -5.41 -2.60
Diff Mode-Mode(B) (%) 24.46 14.96 10.77 1.96
Diff Mode-Median(B) (%) 16.85 9.14 6.81 2.38
Diff Mode-Mean(B) (%) 12.76 6.08 4.76 2.59
Source: Own elaboration
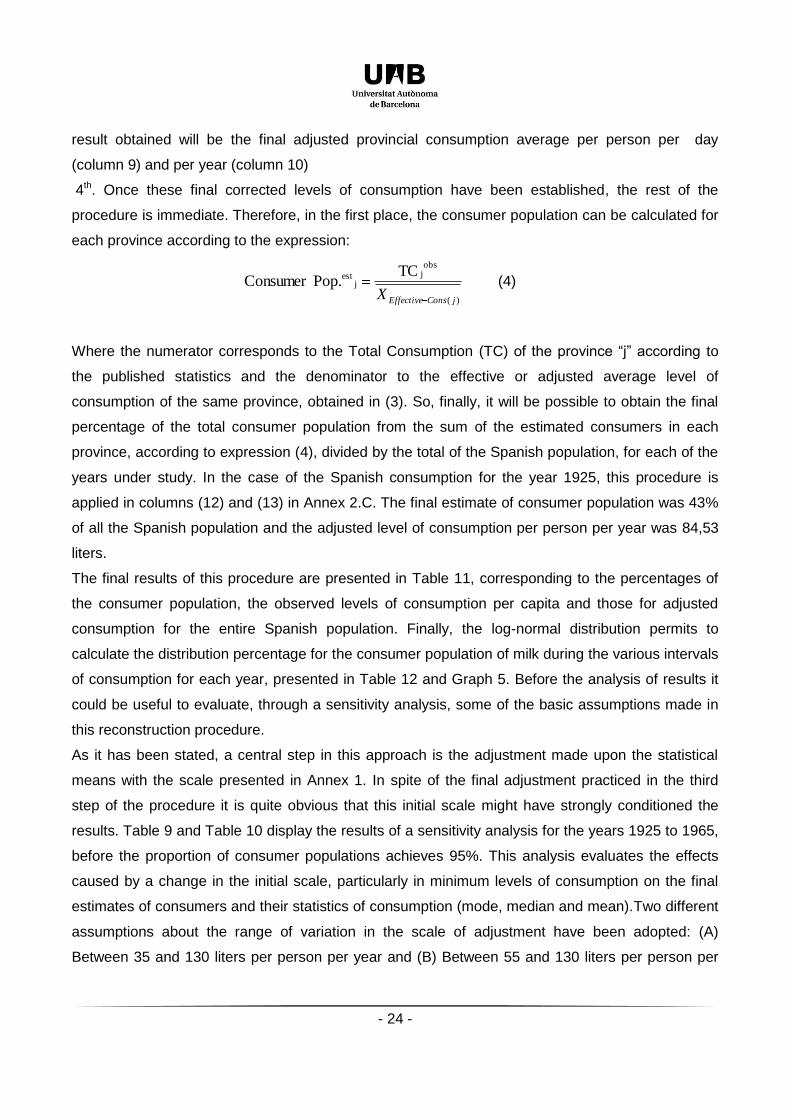
As far as the estimates of basic statistics of consumption is concerned, Table 10 shows how they
change, according to the levels of minimum consumption, in the expected way. The magnitudes of
the statistics are higher with 55 liters instead of 35 liters. In any case, these sets of estimates seem
to converge through along the years when consumption was increasing. Differences between those
minimum levels and the initial scale (45 liters) are greater in the lower consumption levels than in
the higher ones, for example if 1925 and 1933 are compared to 1955 and 1965. Between the three
statistics, the range of variations in the estimates of the mean consumption is lower than the other
- 27 -
two. In absolute values, the error would be around 15% in the worst estimate. Mode seems to be
the statistics with a less accurate estimate, especially in 1925 when the results varied between 99
to 161 ml per person per day. In all these observations Table 10 is showing that the most difficult
consumption patterns to reconstruct are the lower ones, but it is important to notice that in any case,
the rank of variations obtained does not change the conclusions about the probable scale of
consumption. For example, in 1925, all the estimates were far from the daily cup of milk
Two general conclusions can be drawn from all these results. First, that data correction for low
levels of consumption seem more difficult and are subject to greater uncertainty. Second, that this
range of variation around +10/-10 liters around the minimum scale of 45 liters per person per year
does not seem to modify significantly the initial conclusions.
Unfortunately the lack of estimates of proportions of consumers requires testing the validity of the
results in an indirect way. The basic criteria will be to put these results in connection with other
published data on consumption of milk in the Spanish population.
From a more historical perspective it is advisable to remember that animal milk, cow or goat, do not
seem to have been particularly important in the traditional Spanish Mediterranean diet. But, as it
has been mentioned in previous section this foodstuff was incorporated into the diet of the Spanish
population, especially during the first third of the 20th century35. The results obtained from this study
affirm that this process of diffusion was relatively slow and unequal, in terms of its evolution in the
average consumption levels and the number of consumers. These results fit general appreciations
about the difficulties faced by the Spanish agriculture in the first half of the 20th century in
reallocating resources to livestock production and in specializing its production to develop a national
milk market36 .
35
Nicolau-Nos, R, Pujol-Andreu, J and Hernández, I 2010. 36
Simpson, J, 1995, 257-262; Domínguez Martín, R (2003).
- 28 -
TABLE 11
Spain (1925-1981)
Reconstruction of basic statistics indicators of milk consumption of the population
1925 1933 1955 1965 1981
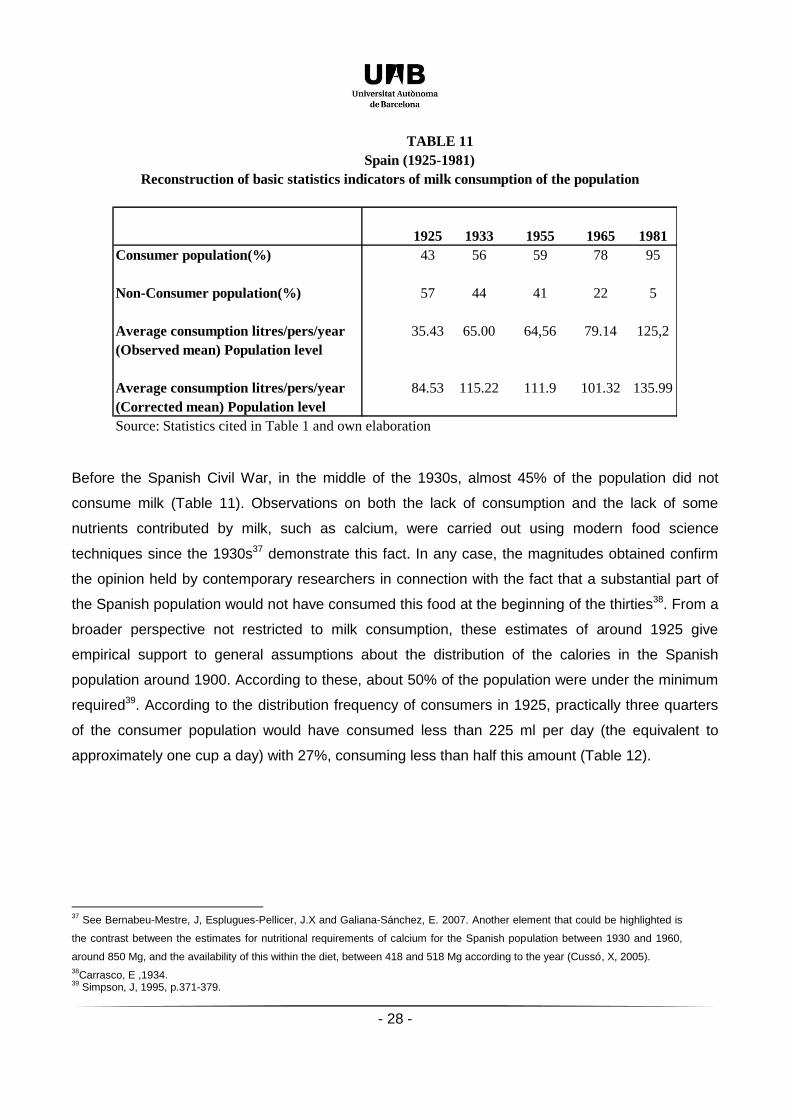
Consumer population(%) 43 56 59 78 95
Non-Consumer population(%) 57 44 41 22 5
Average consumption litres/pers/year 35.43 65.00 64,56 79.14 125,2
(Observed mean) Population level
Average consumption litres/pers/year 84.53 115.22 111.9 101.32 135.99
(Corrected mean) Population level
Source: Statistics cited in Table 1 and own elaboration
Before the Spanish Civil War, in the middle of the 1930s, almost 45% of the population did not
consume milk (Table 11). Observations on both the lack of consumption and the lack of some
nutrients contributed by milk, such as calcium, were carried out using modern food science
techniques since the 1930s37 demonstrate this fact. In any case, the magnitudes obtained confirm
the opinion held by contemporary researchers in connection with the fact that a substantial part of
the Spanish population would not have consumed this food at the beginning of the thirties38. From a
broader perspective not restricted to milk consumption, these estimates of around 1925 give
empirical support to general assumptions about the distribution of the calories in the Spanish
population around 1900. According to these, about 50% of the population were under the minimum
required39. According to the distribution frequency of consumers in 1925, practically three quarters
of the consumer population would have consumed less than 225 ml per day (the equivalent to
approximately one cup a day) with 27%, consuming less than half this amount (Table 12).
37
See Bernabeu-Mestre, J, Esplugues-Pellicer, J.X and Galiana-Sánchez, E. 2007. Another element that could be highlighted is
the contrast between the estimates for nutritional requirements of calcium for the Spanish population between 1930 and 1960,
around 850 Mg, and the availability of this within the diet, between 418 and 518 Mg according to the year (Cussó, X, 2005).
38Carrasco, E ,1934.
39 Simpson, J, 1995, p.371-379.
- 29 -
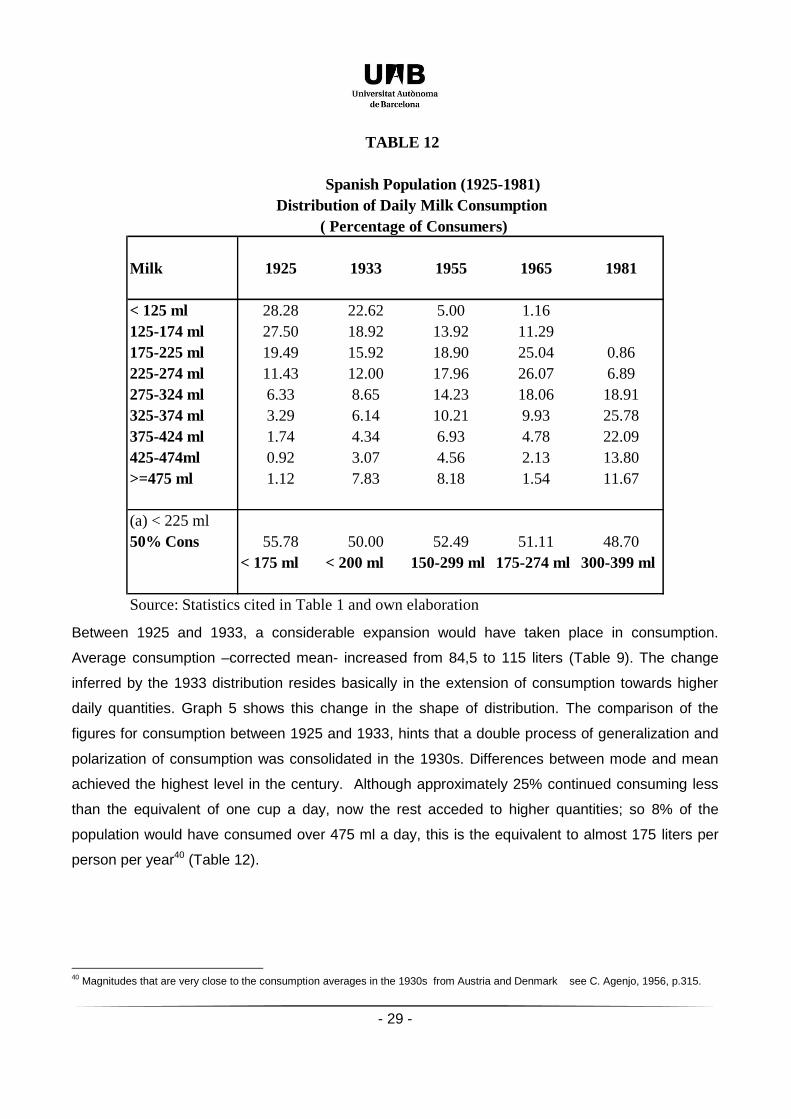
TABLE 12
Spanish Population (1925-1981)
Distribution of Daily Milk Consumption
( Percentage of Consumers)
Milk 1925 1933 1955 1965 1981
< 125 ml 28.28 22.62 5.00 1.16
125-174 ml 27.50 18.92 13.92 11.29
175-225 ml 19.49 15.92 18.90 25.04 0.86
225-274 ml 11.43 12.00 17.96 26.07 6.89
275-324 ml 6.33 8.65 14.23 18.06 18.91
325-374 ml 3.29 6.14 10.21 9.93 25.78
375-424 ml 1.74 4.34 6.93 4.78 22.09
425-474ml 0.92 3.07 4.56 2.13 13.80
>=475 ml 1.12 7.83 8.18 1.54 11.67
(a) < 225 ml
50% Cons 55.78 50.00 52.49 51.11 48.70
< 175 ml < 200 ml 150-299 ml 175-274 ml 300-399 ml
Source: Statistics cited in Table 1 and own elaboration
Between 1925 and 1933, a considerable expansion would have taken place in consumption.
Average consumption –corrected mean- increased from 84,5 to 115 liters (Table 9). The change
inferred by the 1933 distribution resides basically in the extension of consumption towards higher
daily quantities. Graph 5 shows this change in the shape of distribution. The comparison of the
figures for consumption between 1925 and 1933, hints that a double process of generalization and
polarization of consumption was consolidated in the 1930s. Differences between mode and mean
achieved the highest level in the century. Although approximately 25% continued consuming less
than the equivalent of one cup a day, now the rest acceded to higher quantities; so 8% of the
population would have consumed over 475 ml a day, this is the equivalent to almost 175 liters per
person per year40 (Table 12).
40
Magnitudes that are very close to the consumption averages in the 1930s from Austria and Denmark see C. Agenjo, 1956, p.315.
- 30 -
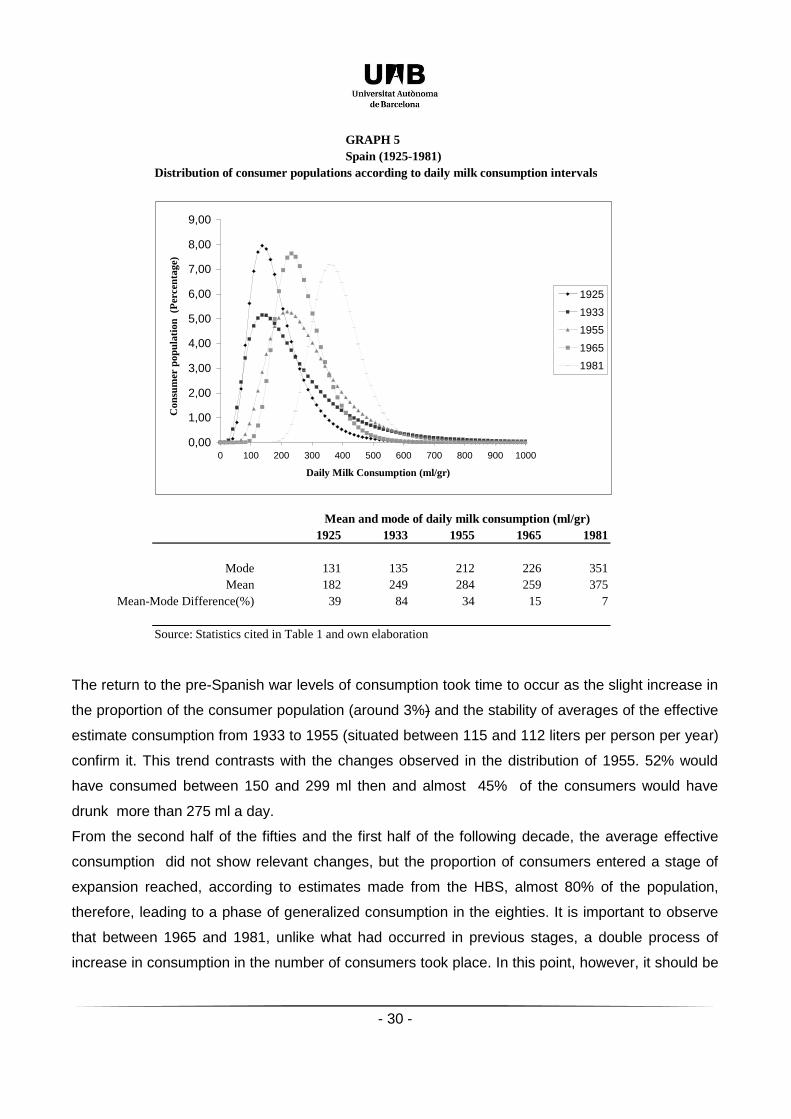
GRAPH 5
Spain (1925-1981)
Distribution of consumer populations according to daily milk consumption intervals
Mean and mode of daily milk consumption (ml/gr)
1925 1933 1955 1965 1981
Mode 131 135 212 226 351
Mean 182 249 284 259 375
Mean-Mode Difference(%) 39 84 34 15 7
Source: Statistics cited in Table 1 and own elaboration
0,00
1,00
2,00
3,00
4,00
5,00
6,00
7,00
8,00
9,00
0 100 200 300 400 500 600 700 800 900 1000
Daily Milk Consumption (ml/gr)
Con
sum
er p
op
ula
tion
(P
erce
nta
ge)
1925
1933
1955
1965
1981
The return to the pre-Spanish war levels of consumption took time to occur as the slight increase in
the proportion of the consumer population (around 3%) and the stability of averages of the effective
estimate consumption from 1933 to 1955 (situated between 115 and 112 liters per person per year)
confirm it. This trend contrasts with the changes observed in the distribution of 1955. 52% would
have consumed between 150 and 299 ml then and almost 45% of the consumers would have
drunk more than 275 ml a day.
From the second half of the fifties and the first half of the following decade, the average effective
consumption did not show relevant changes, but the proportion of consumers entered a stage of
expansion reached, according to estimates made from the HBS, almost 80% of the population,
therefore, leading to a phase of generalized consumption in the eighties. It is important to observe
that between 1965 and 1981, unlike what had occurred in previous stages, a double process of
increase in consumption in the number of consumers took place. In this point, however, it should be
- 31 -
remembered that the average consumption estimated for 1981, close to 136 liters per person per
year was equivalent to that reached by the German population in the 1930s41. The HBS of 1965 and
1981 infer distributions of consumption of very different tendencies to the years 1925 and 1933.
The distribution of 1955 could be described as closer to the patterns of the next than the past years.
Graph 5 shows a displacement to the right and a remarkable increase in the mode. The distribution
of 1965 could contribute evidence of a step forward in the nutritional transition in Spain. Indeed, in
those years a substantial part of those who consumed milk did this in quantities that were close to
the equivalent of one cup a day, 50% of the population would drink between 175 and 275 ml a day,
when in 1955 it was only 37%. In fact, in 1965 around 63% would be consuming more than 225 ml
a day (Table 12). The distributions estimated from the years 1965 and 1981 demonstrate both a
growth and generalization of consumption, the progressive approximation of the mode and average
consumption reveal this fact (Graph 5). From the sixties, together with the regular improvement of
levels of income in Spain, this foodstuff, just like all other animal based foodstuffs, would begin a
trajectory of growing averages of consumption per capita as well as the universalization of milk
consumption
This last characteristic, according to the results obtained, should have been reached in the 1970s.
Milk and products derived from milk were, between 1969 and 1984 a regular proportion, around
55%, of the total animal based foodstuff consumed per person per year, which in terms of its
calcium attributes represented 7 and 9% of the total diet42. Towards 1981, the rise in consumption
was consolidated in levels above 351 ml. So it was necessary to wait until the last decades of the
20th century to witness the growing importance of dairy products in the national diet43.
5. Conclusions
Not only do nutritional transitions involve changes in levels of consumption, but also in numbers of
consumers. The reconstruction of consumer populations is not an easy task because most of the
historical statistics do not publish this kind of data. In countries with statistical yearbooks, the data
available only allow the computation of statistical means at some spatial scale, according to the
administrative units defined in each country. In order to overcome this limitation a methodological
approach has been presented here. This methodology has been illustrated with the case of milk
consumption, because the increase in the use of milk and derivatives, as well as animal proteins in
41
Agenjo, C, 1956,p. 315 42
Rodríguez, F et al. 1996. 43
Varela, G, 2000; Moreno, L.A. et al. 2002.
- 32 -
general constitutes one of the main components of the modern nutritional transition, as it was so in
the Spanish case too. A basic step in the approach implemented in these pages has been the initial
adjustment applied to the observed consumption levels to become effective consumption levels,
where the latter were the main unknown. In order to avoid an arbitrary solution this paper has
presented an approach based on the combination of certain hypothesis about the diffusion of this
food in the Spanish population with some results obtained from simulations of log-normal
distributions. This combination has given a reasoned solution but not a definitive one. This would
explain why these results should be viewed as a reconstruction. Unfortunately these estimates only
can be tested indirectly, but when it has been done they seemed to fit very well in the information
and evidence available about the evolution of Spanish milk consumption in the 20th century.
Basically they stand that, from the point of view of the number of consumers, this was a slow and
late process. Because this is a reconstruction the assumptions made can be a source of error. This
has been evaluated through a sensitivity analysis. The effects of variations in more or less 10 liters
in minimum consumption levels around the adopted scale of adjustment, between 45 and 130 liters,
have shown that the conclusions previously obtained should not be changed significantly.
This kind of reconstruction has some drawbacks to consider. On the one hand, missing more
historical information about consumer habits in the population makes it difficult to evaluate effective
consumption levels; on the other hand, the published statistics used to present two types of
important limitations. First, the data were published according to some administrative units, for
example provinces. In the best cases, consumption means can be estimated but not variances, so
any calculation requires accepting variance at national scale as representative of provincial level.
Second, a lack of information on internal trade underestimates or overestimates levels of
consumption. If all these aspects above mentioned are taken into account this approach could be
extended to other foods involved in the same process of nutritional change. The possibility to
estimate levels and trends in the evolution of consumer populations may shed new light in the study
of the nutritional transition.
References
Agenjo , Cesar, Enciclopedia de la Leche, Madrid, Espasa Calpe, 1956.
Asociación General de Ganaderos del Reino, Leche, queso y manteca. Estadística de la producción en España,
Madrid, 1925
Bernabeu-Mestre, J., Espulgues-Pellicer, J.X and E. Galiana-Sánchez, “Antecedentes históricos de la nutrición
comunitaria en España: Los trabajos de la Escuela Nacional de Salud 1930-1936”, Revista Española de Salud
Pública, 81, 2007, p.451-459.
- 33 -
Carrasco , E. “Lo que se come en España. Interés sanitario de este problema”, Archivos de Medicina, Cirugía y
Especialidades ,XXXVII, 25, 23 June 1934, p. 669-675.
Crigg, David, “The nutritional transition in Western Europe”, Journal of Historical Geography, 22, 1995,p.: 247-261.
Cusssó, Xavier, Alimentació, mortalitat i desenvolupament. Evolució i disparitats regionals a Espanya des de
1860, Doctoral Dissertation, Universitat Autònoma de Barcelona, 2001.
Cussó, Xavier, “El estado nutritivo de la población española 1900-1970. Análisis de las necesidades y
disponibilidades de nutrientes”. Historia Agraria, 36, August, 2005,p. 329-358.
Cussó, Xavier, and Garrabou, Ramon, “La transición nutricional en la España contemporánea: las variaciones en
el consumo de pan, patatas y legumbres”. Investigaciones de Historia Económica, Winter, 2007,p.69-100.
De Vries, Jan, The Industrious Revolution. Consumer Behavior and the Household Economy, 1650 to the Present.
Cambridge. Cambridge University Press, 2008
Domínguez-Martín, Rafael, “La Industria Láctea en España, 1830-1935”, in C. Varicela and V. Di Vittorio (Ed), Las
industrias agroalimentarias en España e Italia durante los siglos XIX y XX, Alicante: Publicaciones Universidad de
Alicante. 2003. p. 457-495
FENIL. Plan de Nutrición, Salud y Comunicación de Productos Lácteos 2007-2010. Madrid : MAPA-FENIL. 2008.
Fogel, Robert W, “Second Thoughts on the European Escape from Hunger: Famines, Chronic Malnutrition, and
Mortality Rates”, In S. R. Osmani (Ed), Nutririon and Poverty, Oxford, Clarendon Press, 1992.p. 243-286.
García-Barbancho, Antonio, “Análisis de la alimentación española”, Anales de Economía, XVIII, 66 and 67, 1960.
p. 73-120, p. 271-367.
Hernández, Ismael La leche en el cambio nutricional de la España contemporánea, 1865-1935. Master Thesis,
Universitat Autònoma de Barcelona, 2005.
Instituto Nacional de Estadística (INE), Encuesta de Presupuestos Familiares, (March 1964- March 1965),Madrid,
1969.
Instituto Nacional de Estadística (INE), Encuesta de Presupuestos Familiares 1980-81, Madrid, 5 vols, 1983.
Lawrence, Raymond, “Applications in Economics and Business”. In E. Crow and K.Shimizu (Ed), Lognormal
distributions. Theory and Applications, New York, Marcel Bekker Inc, 1988, p. 230-264.
Jiménez, F; Jiménez, M “La alimentación en la provincia de Jaén. Deducciones sanitarias”, Archivos de
Medicina, Cirugía y Especialidades XXXVII, Num 19, 12 Mayo 1934, p. 503-506.
Logan, Trevor.D. “Is the Calorie Distribution Log Normal?”. Historical Methods, Summer, 39-3, 2006,p.112-122.
Mace, Ruth. Jordan, Fiona, Holden, Clare. “ Testing evolutionary hypothesis about human biological adaptation
using cross-cultural comparison”. Comparative Biochemestry and Physiology. Part A, 136, 2003, p. 85-94.
Ministerio de Agricultura, Censo de Ganadería en España en 1933, Madrid, 1934.
Ministerio de Agricultura. Resúmenes estadísticos de la produción, destino y valor de la leche,Madrid, 1954 and
1955.
Ministerio de Trabajo, Comercio e Industria, Censo de Población de España. Madrid, Madrid, Tome V,1922.
Moreno, L.A., Sarría, A., and B.M. Popkin.. “The nutrition transition in Spain: A European Mediterranean country”,
European Journal of Clinical Nutrition, 56, 2002,p. 992-1003.
Nicolau , Roser, Pujol-Andreu, Josep and Hernández, Ismael, “El consumo de leche fresca en Cataluña entre
mediados del siglo XIX y 1935: la difusión de un nuevo alimento”, Historia Agraria, 42, August 2007,p. 303-325.
Nicolau , Roser, Pujol-Andreu, Josep and Hernández, Ismael, “Milk, social acceptance of a new food in Europe:
Catalonia, 19th-20th centuries”, Dynamis: Acta Hispanica ad Medicinae Scientiarumque Historiam Illustrandam, 30,
2010, p. 119-140.
- 34 -
Peña, José.A., Alfonso-Sánchez, Miguel A., Garcia-Obregón, Susana and Pérez-Miranda, Ana, “Persistencia de
actividad lactasa en población residente en el País Vasco (Lactase persistente in residing population of the Basque
Country)”, Antropo, 3,2002, p.51-60.
Popkin, Barry, “Nutritional Patterns and Transitions”, Population and Development Review, 19-1, 1993, p. 138-157.
Rodríguez Artalejo, F., Banegas, J.R, Graciani, M.A., Hernández-Vecino, R and Rey Calero, J, “El consumo de
alimentos y nutrientes en España en el período 1940-1988. Análisis de su consistencia con la dieta mediterránea”.
Medicina Clínica, 106, 1996, p.161-168.
Rogers, Everett M, Diffusion of Innovations, Fith edition, New York, The Free Press, 2003.
Simpson, James, Spanish agricultura: the long siesta, 1765-1965, Cambridge, Cambridge University Press, 1995.
Steckel, Robert H. and Floud, Roderick (Ed), Health and welfare during industrialization, Chicago, University of
Chicago Press, 1997.
Varela, Gregorio, “Evolución de la alimentación de los españoles en el pasado siglo XX”, Cuenta y Razón,
114,2000,p. 1-6.
Williamson, Jeffry G., “Regional Inequality and the Process of Nacional Development: A Description of Patterns”,
Economic Development and Cultural Change, 13- 4, 1965, p. 3-52.
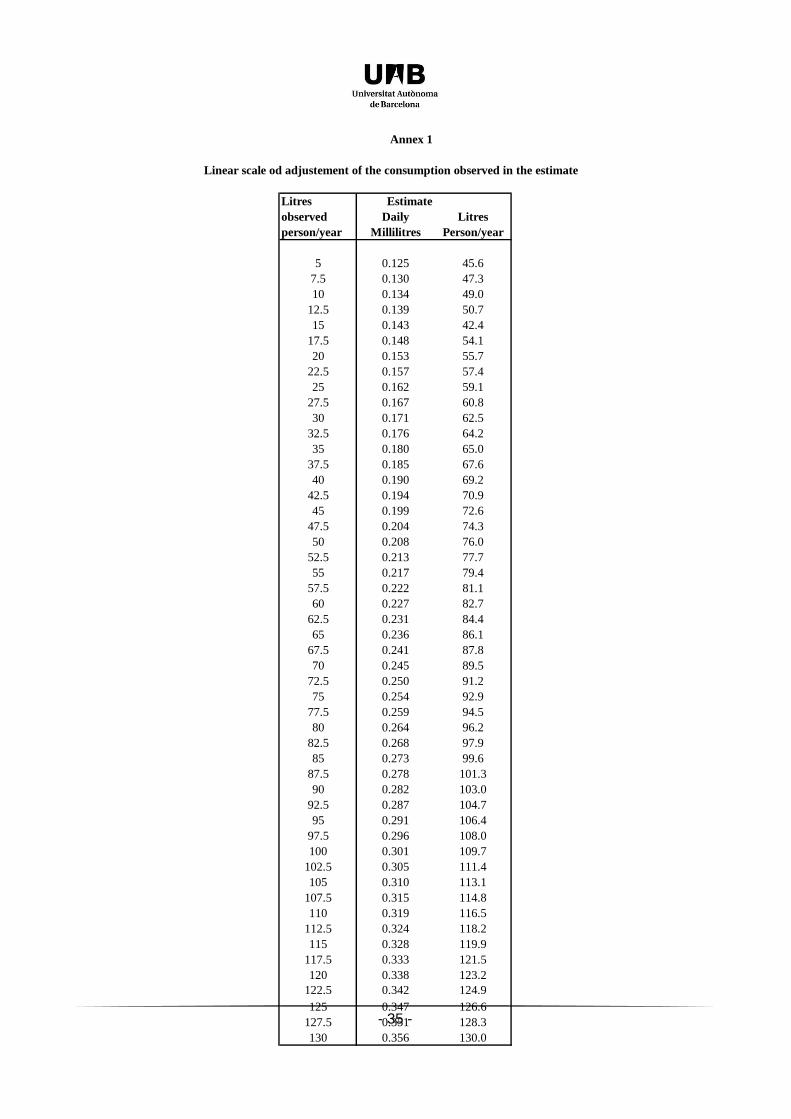
- 35 -
Annex 1
Linear scale od adjustement of the consumption observed in the estimate
Litres Estimate
observed Daily Litres
person/year Millilitres Person/year
5 0.125 45.6
7.5 0.130 47.3
10 0.134 49.0
12.5 0.139 50.7
15 0.143 42.4
17.5 0.148 54.1
20 0.153 55.7
22.5 0.157 57.4
25 0.162 59.1
27.5 0.167 60.8
30 0.171 62.5
32.5 0.176 64.2
35 0.180 65.0
37.5 0.185 67.6
40 0.190 69.2
42.5 0.194 70.9
45 0.199 72.6
47.5 0.204 74.3
50 0.208 76.0
52.5 0.213 77.7
55 0.217 79.4
57.5 0.222 81.1
60 0.227 82.7
62.5 0.231 84.4
65 0.236 86.1
67.5 0.241 87.8
70 0.245 89.5
72.5 0.250 91.2
75 0.254 92.9
77.5 0.259 94.5
80 0.264 96.2
82.5 0.268 97.9
85 0.273 99.6
87.5 0.278 101.3
90 0.282 103.0
92.5 0.287 104.7
95 0.291 106.4
97.5 0.296 108.0
100 0.301 109.7
102.5 0.305 111.4
105 0.310 113.1
107.5 0.315 114.8
110 0.319 116.5
112.5 0.324 118.2
115 0.328 119.9
117.5 0.333 121.5
120 0.338 123.2
122.5 0.342 124.9
125 0.347 126.6
127.5 0.351 128.3
130 0.356 130.0
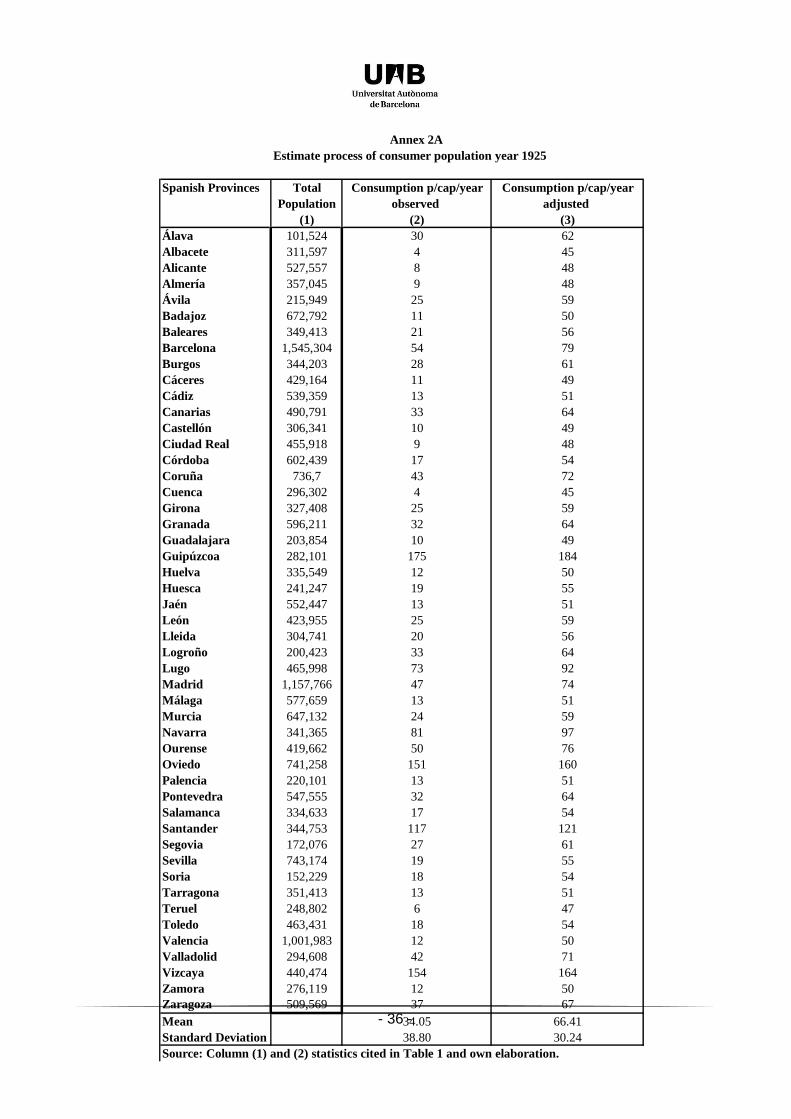
- 36 -
Annex 2A
Estimate process of consumer population year 1925
Spanish Provinces Total Consumption p/cap/year Consumption p/cap/year
Population observed adjusted
(1) (2) (3)
Álava 101,524 30 62
Albacete 311,597 4 45
Alicante 527,557 8 48
Almería 357,045 9 48
Ávila 215,949 25 59
Badajoz 672,792 11 50
Baleares 349,413 21 56
Barcelona 1,545,304 54 79
Burgos 344,203 28 61
Cáceres 429,164 11 49
Cádiz 539,359 13 51
Canarias 490,791 33 64
Castellón 306,341 10 49
Ciudad Real 455,918 9 48
Córdoba 602,439 17 54
Coruña 736,7 43 72
Cuenca 296,302 4 45
Girona 327,408 25 59
Granada 596,211 32 64
Guadalajara 203,854 10 49
Guipúzcoa 282,101 175 184
Huelva 335,549 12 50
Huesca 241,247 19 55
Jaén 552,447 13 51
León 423,955 25 59
Lleida 304,741 20 56
Logroño 200,423 33 64
Lugo 465,998 73 92
Madrid 1,157,766 47 74
Málaga 577,659 13 51
Murcia 647,132 24 59
Navarra 341,365 81 97
Ourense 419,662 50 76
Oviedo 741,258 151 160
Palencia 220,101 13 51
Pontevedra 547,555 32 64
Salamanca 334,633 17 54
Santander 344,753 117 121
Segovia 172,076 27 61
Sevilla 743,174 19 55
Soria 152,229 18 54
Tarragona 351,413 13 51
Teruel 248,802 6 47
Toledo 463,431 18 54
Valencia 1,001,983 12 50
Valladolid 294,608 42 71
Vizcaya 440,474 154 164
Zamora 276,119 12 50
Zaragoza 509,569 37 67
Mean 34.05 66.41
Standard Deviation 38.80 30.24
Source: Column (1) and (2) statistics cited in Table 1 and own elaboration.
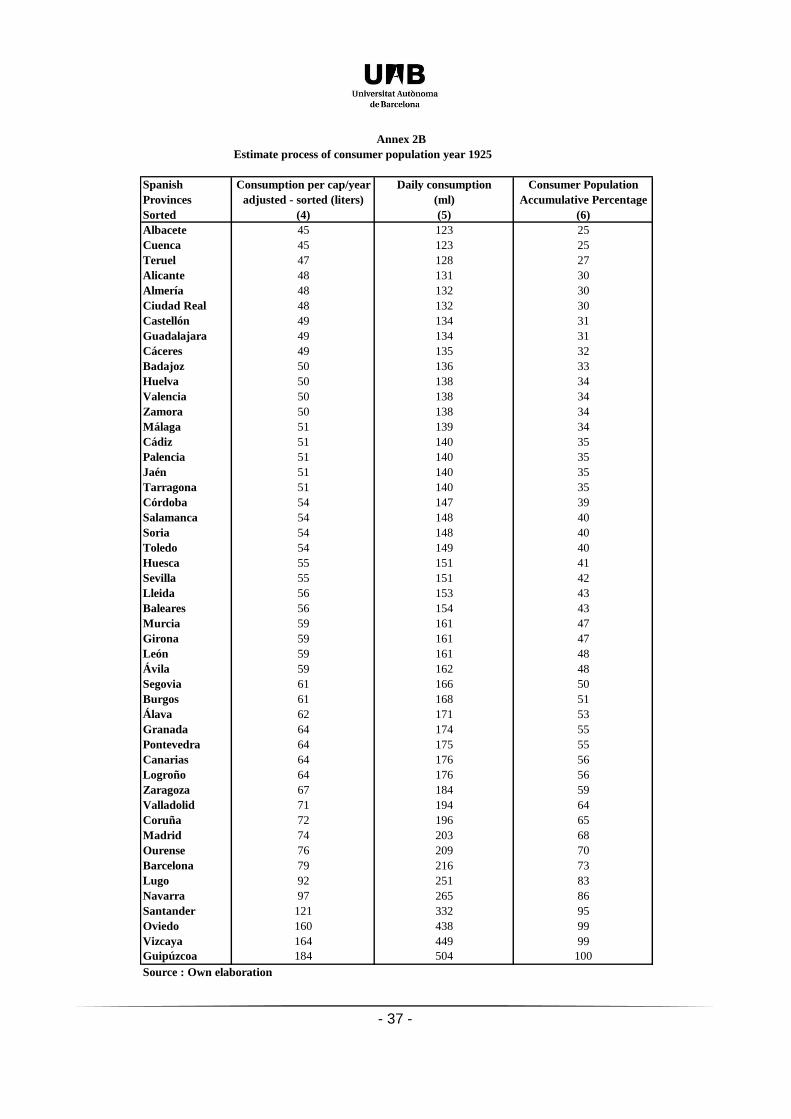
- 37 -
Annex 2B
Estimate process of consumer population year 1925
Spanish Consumption per cap/year Daily consumption Consumer Population
Provinces adjusted - sorted (liters) (ml) Accumulative Percentage
Sorted (4) (5) (6)
Albacete 45 123 25
Cuenca 45 123 25
Teruel 47 128 27
Alicante 48 131 30
Almería 48 132 30
Ciudad Real 48 132 30
Castellón 49 134 31
Guadalajara 49 134 31
Cáceres 49 135 32
Badajoz 50 136 33
Huelva 50 138 34
Valencia 50 138 34
Zamora 50 138 34
Málaga 51 139 34
Cádiz 51 140 35
Palencia 51 140 35
Jaén 51 140 35
Tarragona 51 140 35
Córdoba 54 147 39
Salamanca 54 148 40
Soria 54 148 40
Toledo 54 149 40
Huesca 55 151 41
Sevilla 55 151 42
Lleida 56 153 43
Baleares 56 154 43
Murcia 59 161 47
Girona 59 161 47
León 59 161 48
Ávila 59 162 48
Segovia 61 166 50
Burgos 61 168 51
Álava 62 171 53
Granada 64 174 55
Pontevedra 64 175 55
Canarias 64 176 56
Logroño 64 176 56
Zaragoza 67 184 59
Valladolid 71 194 64
Coruña 72 196 65
Madrid 74 203 68
Ourense 76 209 70
Barcelona 79 216 73
Lugo 92 251 83
Navarra 97 265 86
Santander 121 332 95
Oviedo 160 438 99
Vizcaya 164 449 99
Guipúzcoa 184 504 100
Source : Own elaboration
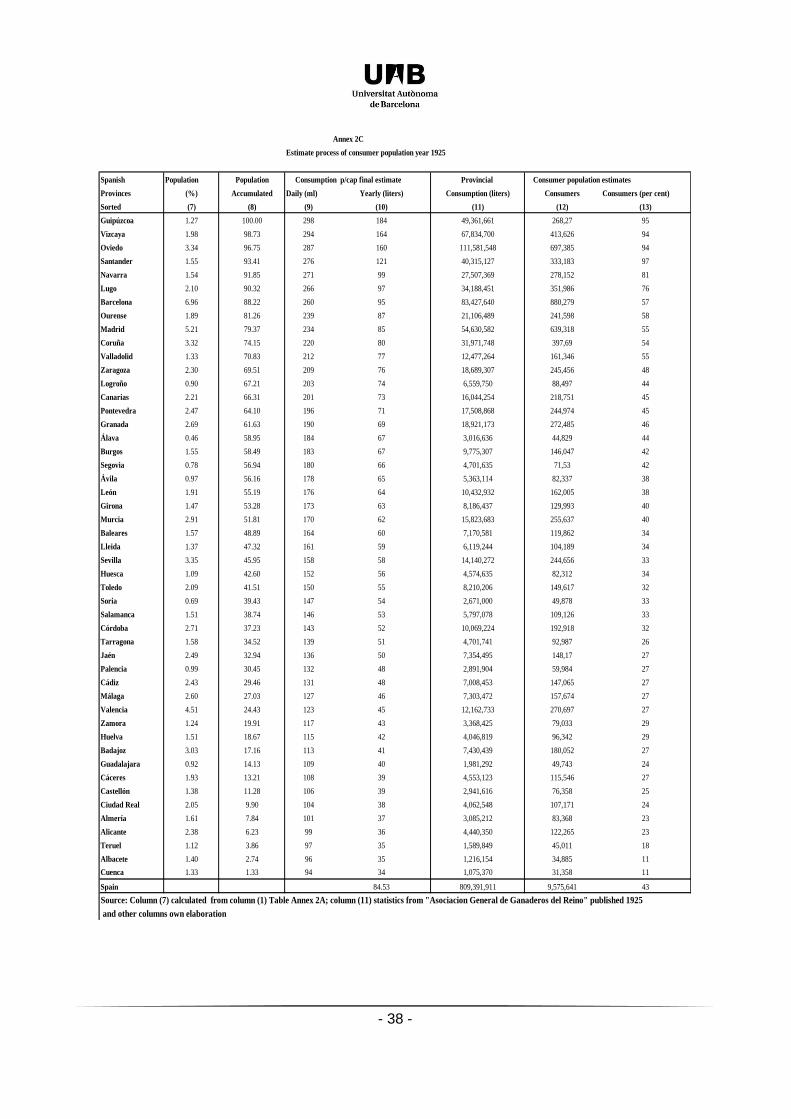
- 38 -
Annex 2C
Estimate process of consumer population year 1925
Spanish Population Population Consumption p/cap final estimate Provincial Consumer population estimates
Provinces (%) Accumulated Daily (ml) Yearly (liters) Consumption (liters) Consumers Consumers (per cent)
Sorted (7) (8) (9) (10) (11) (12) (13)
Guipúzcoa 1.27 100.00 298 184 49,361,661 268,27 95
Vizcaya 1.98 98.73 294 164 67,834,700 413,626 94
Oviedo 3.34 96.75 287 160 111,581,548 697,385 94
Santander 1.55 93.41 276 121 40,315,127 333,183 97
Navarra 1.54 91.85 271 99 27,507,369 278,152 81
Lugo 2.10 90.32 266 97 34,188,451 351,986 76
Barcelona 6.96 88.22 260 95 83,427,640 880,279 57
Ourense 1.89 81.26 239 87 21,106,489 241,598 58
Madrid 5.21 79.37 234 85 54,630,582 639,318 55
Coruña 3.32 74.15 220 80 31,971,748 397,69 54
Valladolid 1.33 70.83 212 77 12,477,264 161,346 55
Zaragoza 2.30 69.51 209 76 18,689,307 245,456 48
Logroño 0.90 67.21 203 74 6,559,750 88,497 44
Canarias 2.21 66.31 201 73 16,044,254 218,751 45
Pontevedra 2.47 64.10 196 71 17,508,868 244,974 45
Granada 2.69 61.63 190 69 18,921,173 272,485 46
Álava 0.46 58.95 184 67 3,016,636 44,829 44
Burgos 1.55 58.49 183 67 9,775,307 146,047 42
Segovia 0.78 56.94 180 66 4,701,635 71,53 42
Ávila 0.97 56.16 178 65 5,363,114 82,337 38
León 1.91 55.19 176 64 10,432,932 162,005 38
Girona 1.47 53.28 173 63 8,186,437 129,993 40
Murcia 2.91 51.81 170 62 15,823,683 255,637 40
Baleares 1.57 48.89 164 60 7,170,581 119,862 34
Lleida 1.37 47.32 161 59 6,119,244 104,189 34
Sevilla 3.35 45.95 158 58 14,140,272 244,656 33
Huesca 1.09 42.60 152 56 4,574,635 82,312 34
Toledo 2.09 41.51 150 55 8,210,206 149,617 32
Soria 0.69 39.43 147 54 2,671,000 49,878 33
Salamanca 1.51 38.74 146 53 5,797,078 109,126 33
Córdoba 2.71 37.23 143 52 10,069,224 192,918 32
Tarragona 1.58 34.52 139 51 4,701,741 92,987 26
Jaén 2.49 32.94 136 50 7,354,495 148,17 27
Palencia 0.99 30.45 132 48 2,891,904 59,984 27
Cádiz 2.43 29.46 131 48 7,008,453 147,065 27
Málaga 2.60 27.03 127 46 7,303,472 157,674 27
Valencia 4.51 24.43 123 45 12,162,733 270,697 27
Zamora 1.24 19.91 117 43 3,368,425 79,033 29
Huelva 1.51 18.67 115 42 4,046,819 96,342 29
Badajoz 3.03 17.16 113 41 7,430,439 180,052 27
Guadalajara 0.92 14.13 109 40 1,981,292 49,743 24
Cáceres 1.93 13.21 108 39 4,553,123 115,546 27
Castellón 1.38 11.28 106 39 2,941,616 76,358 25
Ciudad Real 2.05 9.90 104 38 4,062,548 107,171 24
Almería 1.61 7.84 101 37 3,085,212 83,368 23
Alicante 2.38 6.23 99 36 4,440,350 122,265 23
Teruel 1.12 3.86 97 35 1,589,849 45,011 18
Albacete 1.40 2.74 96 35 1,216,154 34,885 11
Cuenca 1.33 1.33 94 34 1,075,370 31,358 11
Spain 84.53 809,391,911 9,575,641 43
Source: Column (7) calculated from column (1) Table Annex 2A; column (11) statistics from "Asociacion General de Ganaderos del Reino" published 1925
and other columns own elaboration