ECONOMÍA AMBIENTAL - labandeira.eu · n Causas del Deterioro Ambiental: Fallo de Mercado n Cómo...
105
ECONOMÍA AMBIENTAL Xavier Labandeira Universidade de Vigo, Economics for Energy
Transcript of ECONOMÍA AMBIENTAL - labandeira.eu · n Causas del Deterioro Ambiental: Fallo de Mercado n Cómo...

ECONOMÍA AMBIENTAL
Xavier Labandeira
Universidade de Vigo, Economics for Energy


GUIÓN XESUITAS n Qué é o cambio climático? Por qué é preocupante?
n Qué podemos facer?
n Por qué estou aquí?
n Máis alá da ciencia
n Ferramentas para o desafío

‘Spiralling temperatures’
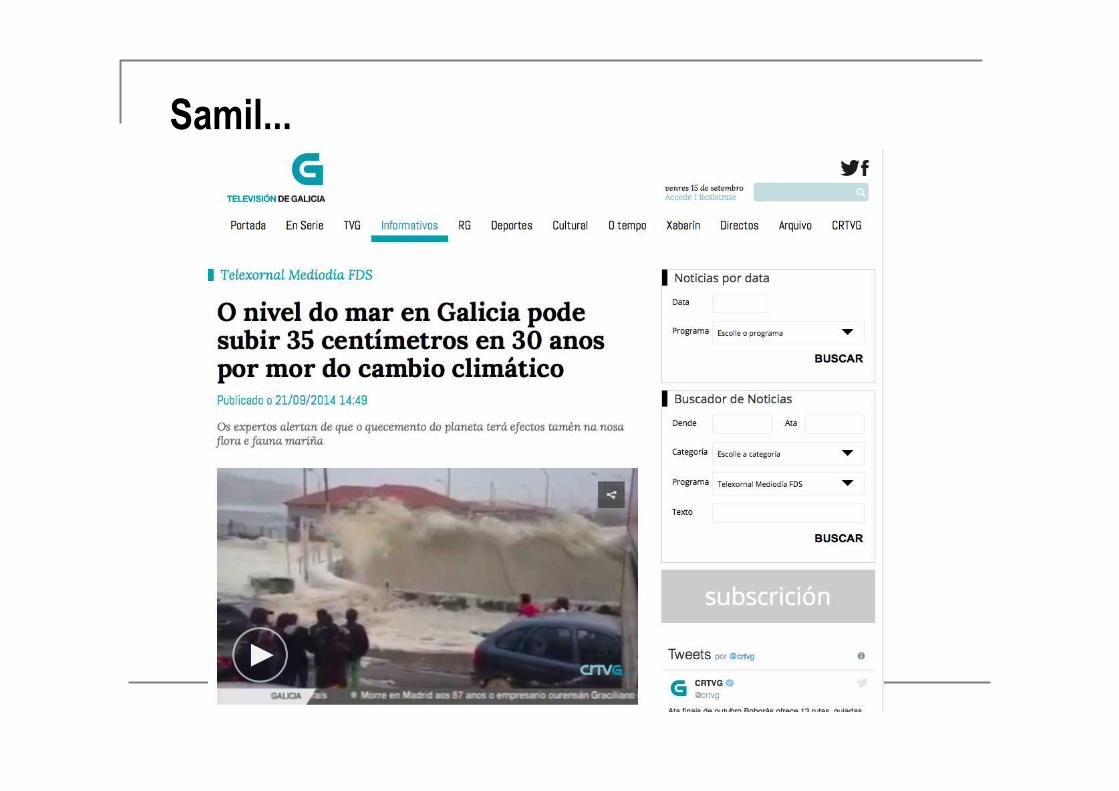
Samil...
Rudimentos do cambio climático n Por qué?
n Impactos e adaptación
n Coordinación internacional
n Mitigación

Por qué estou aquí?


IPCC
O meu traballo académico n (Utilidade social)
n Mitigación, aspectos económicos
n O papel dos prezos nas políticas climáticas
n Interdisciplinariedade
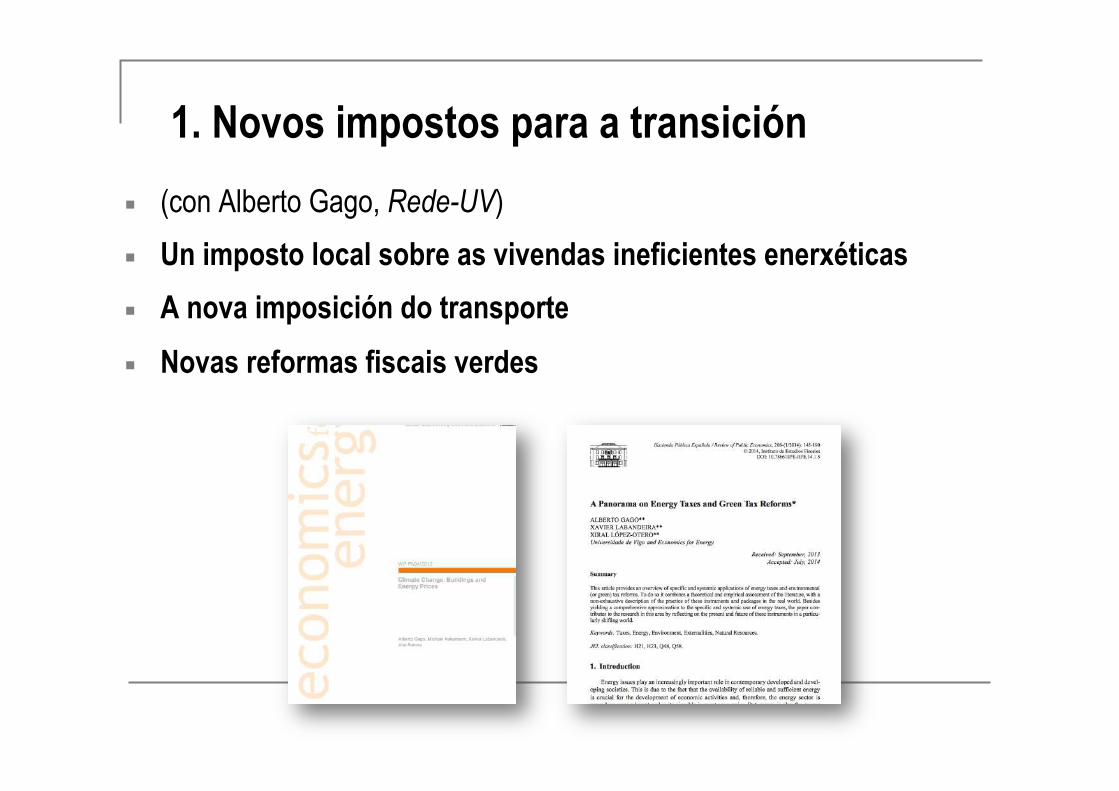
¡ (con Alberto Gago, Rede-UV)
¡ Un imposto local sobre as vivendas ineficientes enerxéticas
¡ A nova imposición do transporte ¡ Novas reformas fiscais verdes
1. Novos impostos para a transición

¡ (con Manuel Fernández, Juan Añel, Laura de la Torre, UV)
¡ Mudanzas de precipitacións e escenarios climáticos
¡ Cambios explotación de encoros, e impacto de efeitos extremos
2. Cambio climático e recursos hidráulicos
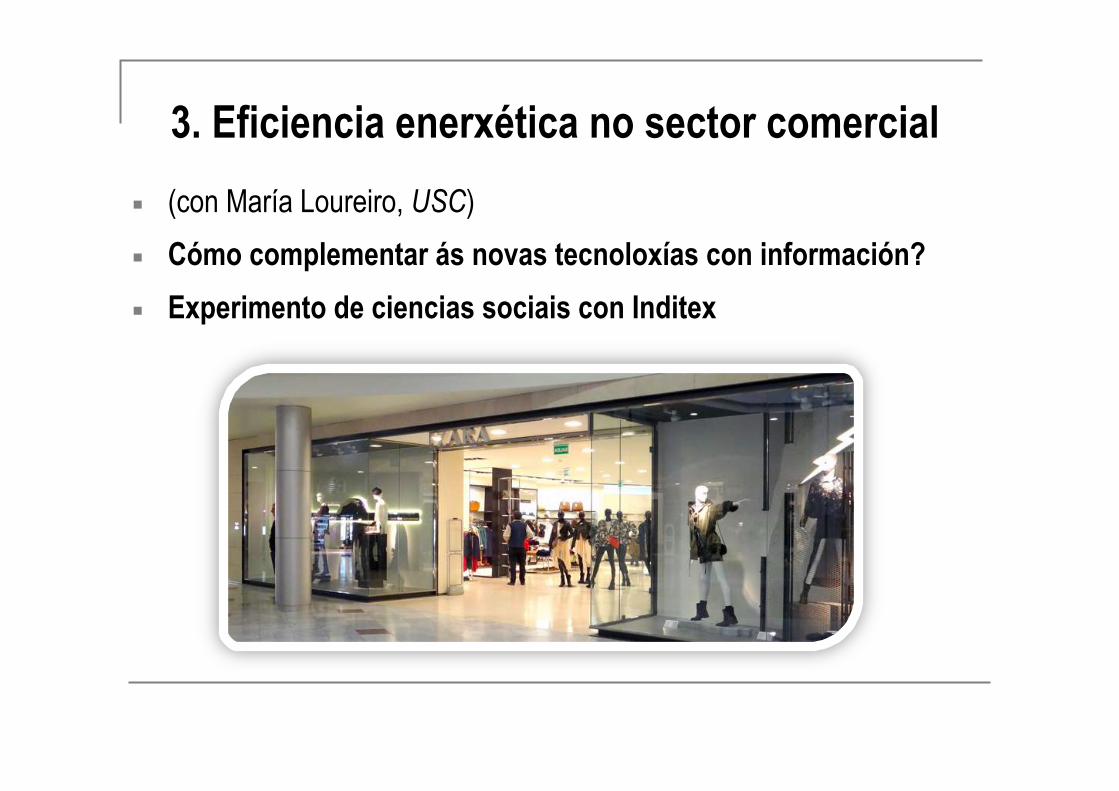
¡ (con María Loureiro, USC)
¡ Cómo complementar ás novas tecnoloxías con información?
¡ Experimento de ciencias sociais con Inditex
3. Eficiencia enerxética no sector comercial
Máis alá da ciencia
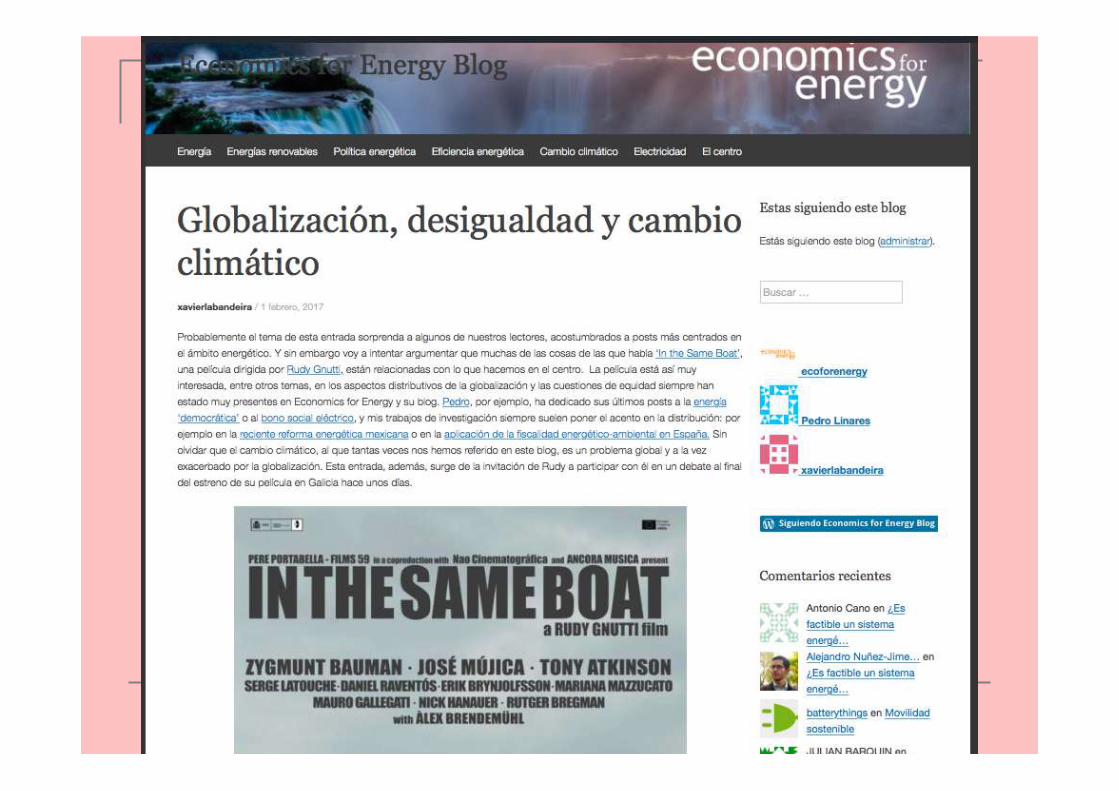
Máis alá da ciencia

ÍNDICE n Economía Ambiental: nociones básicas
n El Fallo de Mercado: bienes públicos y externalidades
n Instrumentos de política ambiental
n Cambio Climático
n Políticas climáticas en la UE
n España…
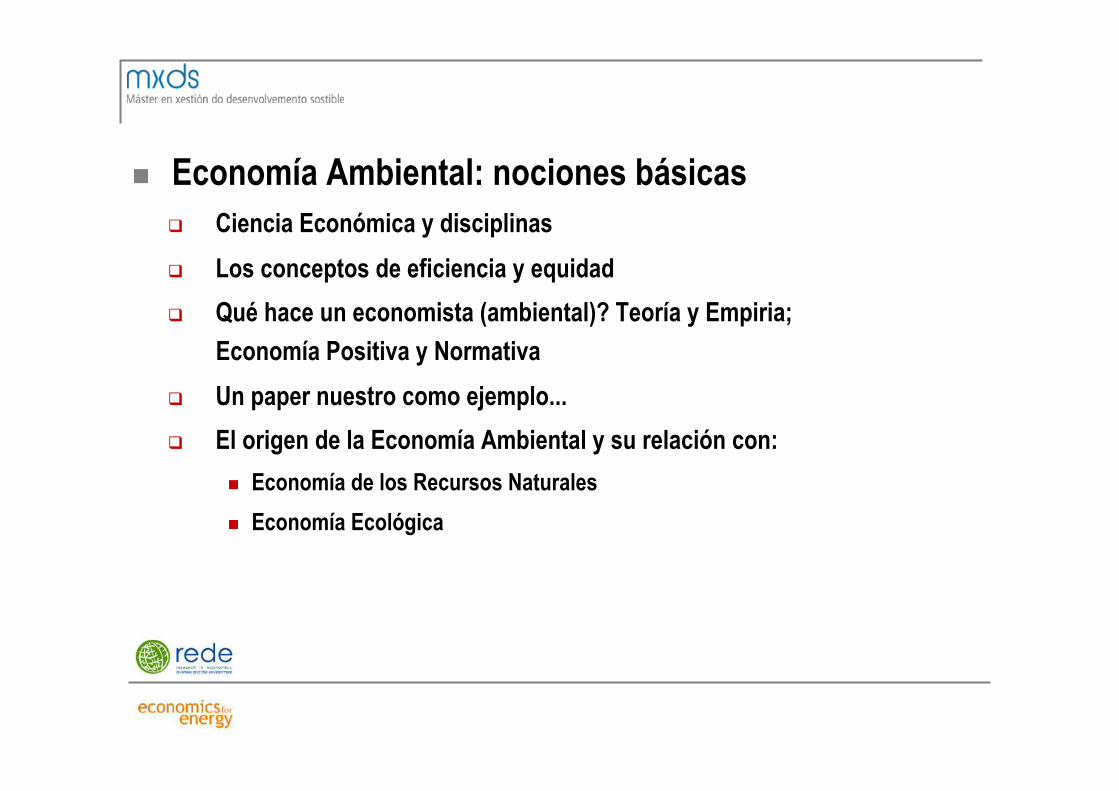
n Economía Ambiental: nociones básicas
q Ciencia Económica y disciplinas
q Los conceptos de eficiencia y equidad
q Qué hace un economista (ambiental)? Teoría y Empiria;
Economía Positiva y Normativa
q Un paper nuestro como ejemplo...
q El origen de la Economía Ambiental y su relación con:
n Economía de los Recursos Naturales
n Economía Ecológica

n Economía Ambiental: nociones básicas
q Las partes de la Economía Ambiental:
n Causas del Deterioro Ambiental: Fallo de Mercado
n Cómo valorar los bienes ambientales?
n Cómo afrontar el fallo de mercado?
n Otra vez: cómo se organiza esta materia y se relaciona con otras...
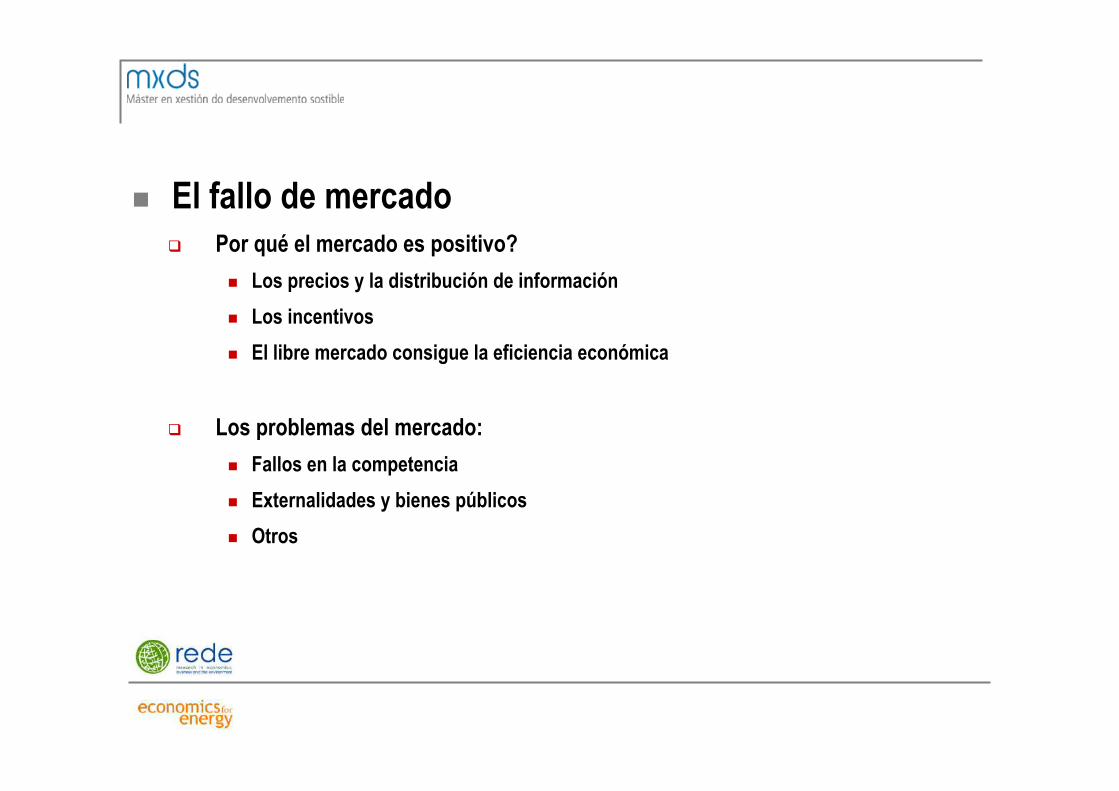
n El fallo de mercado
q Por qué el mercado es positivo?
n Los precios y la distribución de información
n Los incentivos
n El libre mercado consigue la eficiencia económica
q Los problemas del mercado:
n Fallos en la competencia
n Externalidades y bienes públicos
n Otros

n El fallo de mercado
q Concepto de Externalidad
n Definición: efectos no compensados
n Tipos de Externalidad
n Un fallo institucional
q Concepto de bien público
n Bienes privados y comunales
n No rivalidad y no exclusión
n El caso del medio ambiente
n Revelación de preferencias

n La externalidad, de nuevo n Marginalismo, y la valoración del daño
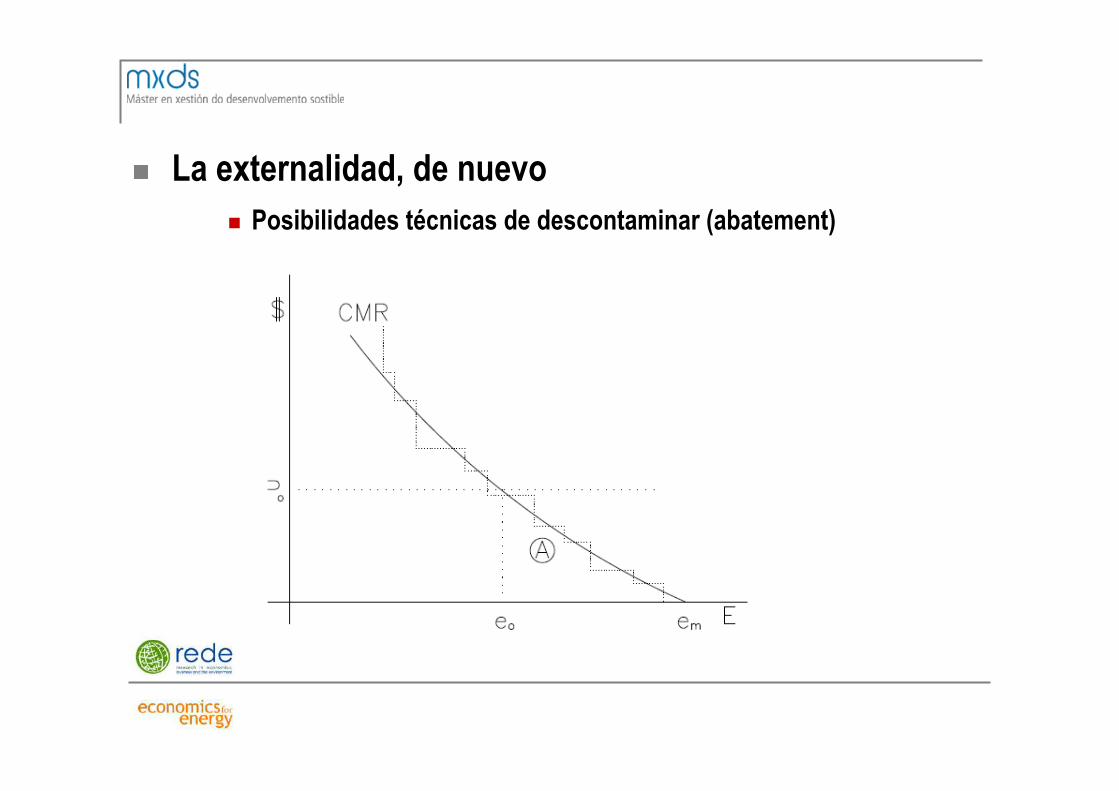
n La externalidad, de nuevo n Posibilidades técnicas de descontaminar (abatement)

n Externalidad: solución negociadora q Aproximación Coasiana, con ventajas... e inconvenientes:
Distribución, costes de transacción, participantes, etc.
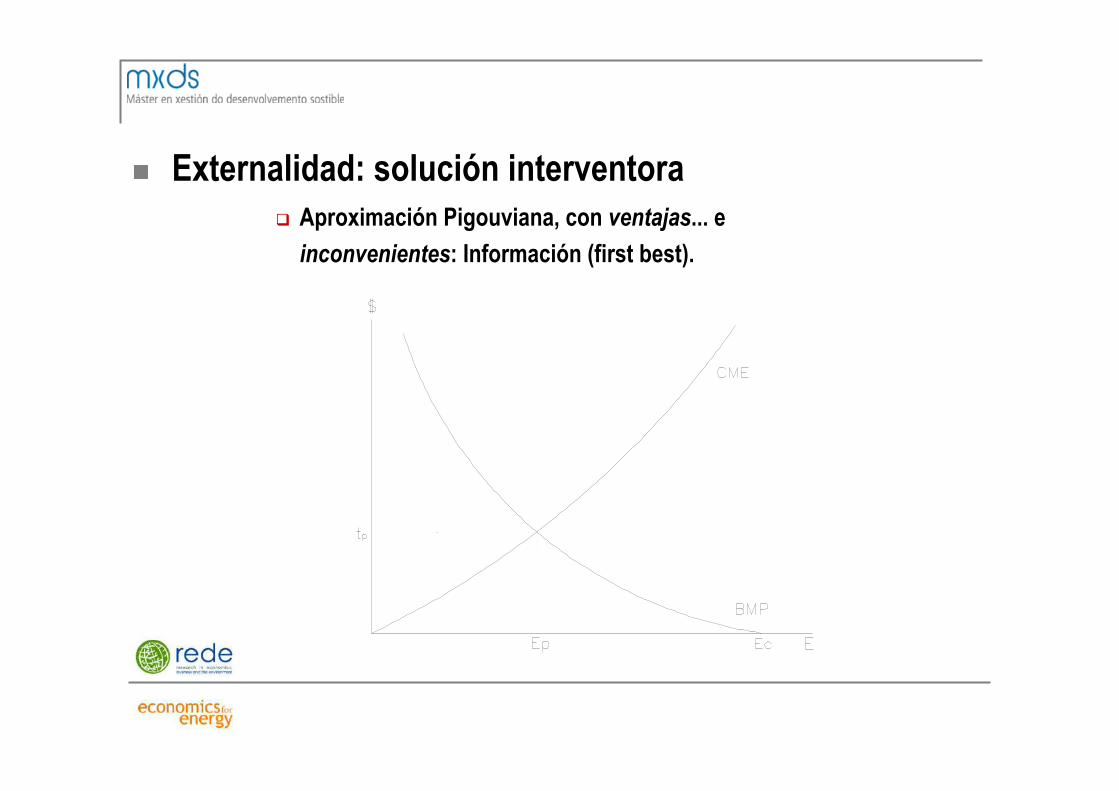
n Externalidad: solución interventora q Aproximación Pigouviana, con ventajas... e
inconvenientes: Información (first best).
n Soluciones del fallo de mercado (second best)
q Previa: Tipos de problemas ambientales (globales,
regionales; uniformes, no uniformes)
q La Política Pública Ambiental (opción
interventora) y sus generaciones:
n Aproximaciones Mandato y Control (MC): 1970s
n Instrumentos económicos o de mercado: 1990s
n Aproximaciones no mandatorias: 2000s
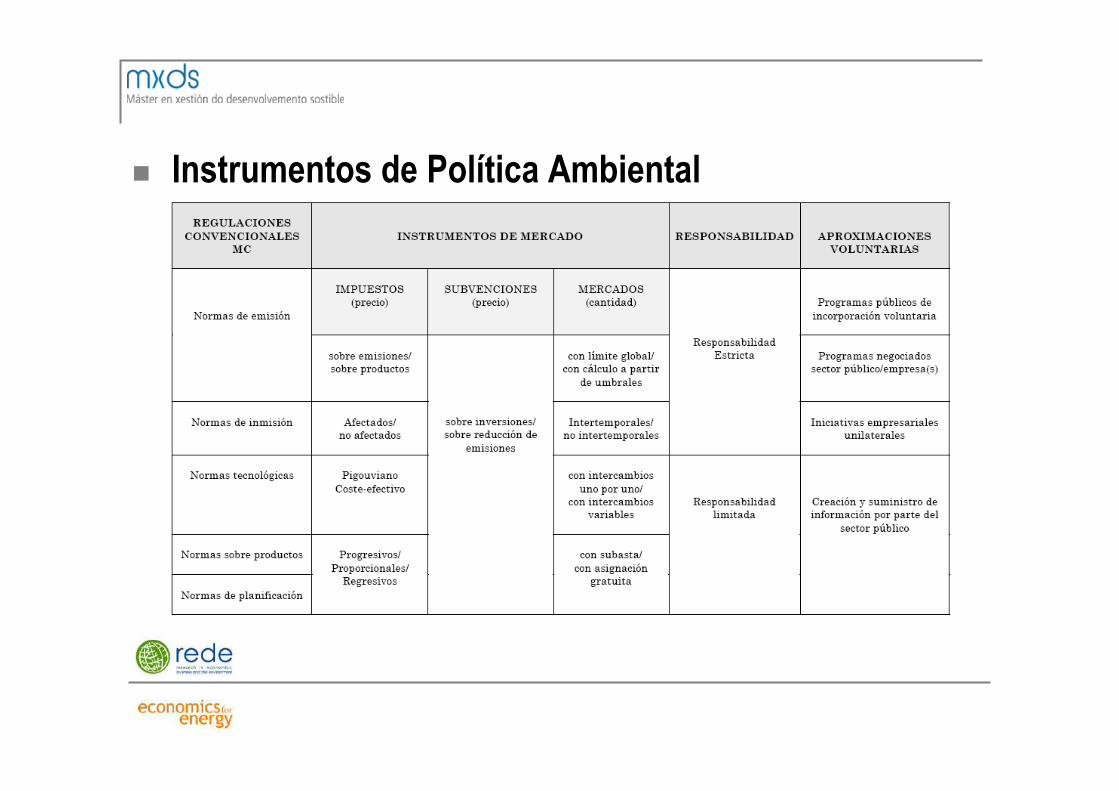
n Instrumentos de Política Ambiental
n Evaluación de instrumentos:
q Efectividad (ambiental)
q Eficiencia económica (corrección fallo de
mercado, coste efectividad)
q Viabilidad
n Administrativa
n Social
q Efectos distributivos
n Por qué son preferibles los instrumentos económicos? n Eficiencia estática (coste-efectividad)
n Eficiencia dinámica (innovación)
n Beneficios adicionales?
q Tipos de instrumentos económicos: q Impuestos (precios)
q Mercados de permisos (cantidades)
q Subvenciones (precios)

n Eficiencia estática Los instrumentos económicos (de precios o cantidades) emulan al mercado en un contexto de información asimétrica
obteniendo la eficiencia estática (Heterogeneidad y número)

n Eficiencia dinámica Los instrumentos económicos (de precios o cantidades) promueven reducciones continuas de emisiones y, en ocasiones, ingresos públicos
llevando a eficiencia dinámica y a posibles beneficios adicionales (doble dividendo)
CAMBIO CLIMÁTICO

Cambio Climático: Aspectos Básicos n Sólidos fundamentos científicos
q Impactos: atribución e eventos extremos
q Incertidumes
n O papel da Economía: eficiencia e equidade
n A Externalidade ‘perfecta’
n Políticas correctoras
q Mitigación
q Adaptación
q Xeo-enxeñaría

Problemas para actuar n Custos hoxe e beneficios futuros
n Problema global en contribucións e impactos
q ‘Free rider’
n Incertidume
n Stock vs Fluxo

Aproximacións Globais n IPCC
n Convención Marco
q COPs
q Protocolos/acordos
n O fracaso de Kioto
n Post-Copenhague
q Xeneralidade
q Abaixo/arriba
q Voluntarismo
q Correccións distributivas

O Acordo de París n Contribucións Nacionais Voluntarias
n Verificación
n Flexibilidade (axuste a 2ºC)
n Axustes distributivos en mitigación e Fondos
n Valoración
q Un paso adiante, pero non está claro que sexa efectivo
q Clave: Políticas nacionais
q Clubes climáticos: Máis efectividade e menos presión sobre competitividade
Qué Políticas Nacionais? n (Adaptación: Pública e Privada)
n Mitigación
q Oferta (Renovables)
q Demanda (Eficiencia enerxética)
q Captura de carbono?
n Instrumentos q PREZOS, Investigación
q Estándares, educación, etc.
n Distribución q Contribucións voluntarias
q Fondos e transferencia tecnolóxica

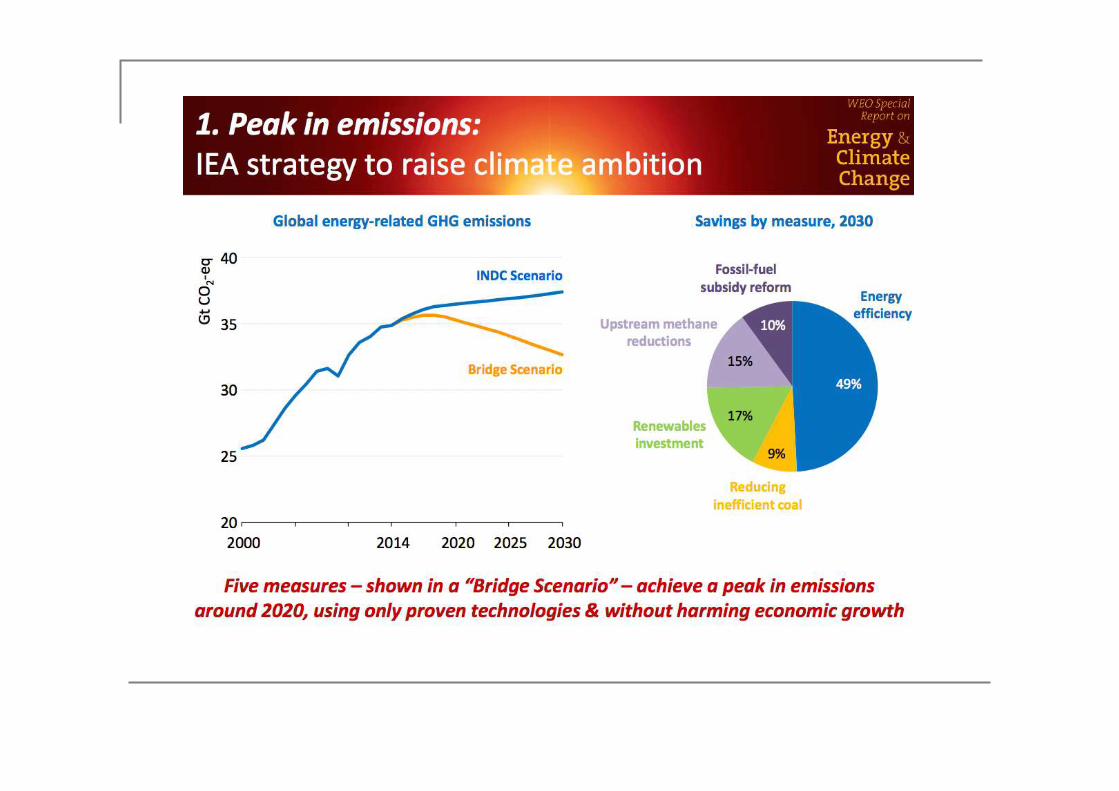
Folla de Ruta n 2030 pico global de emisións
n 2050 Descarbonización do mundo desenvolvido
n Segunda metade de século: Neutralidade de emisións (captura?)
Barreiras ao progreso global n Gañadores e perdedores
n Deixar reservas probadas baixo terra: Destrución de valor
n Recursos para a transformación enerxética: Lock-in
n Preferencias dos cidadáns
n A transformación do mundo emerxente: Stern vs China

13/11/17 20(49Acuerdo de París: El último dislate de Trump | Opinión | EL PAÍS
Página 1 de 3https://elpais.com/elpais/2017/06/02/opinion/1496404691_039741.html
OPINIÓN
MÁS INFORMACIÓN
Trump retira a EEUU del Acuerdo deParís contra elcambio climático
Los expertos temen
Donald Trump anunció ayer con gran parafernalia que EE UU se retiraba del
Acuerdo de París, aunque sus decisiones de desmantelar la política climática
federal trabajosamente construida por la administración Obama, y por tanto no
dar cumplimiento al acuerdo, eran bien conocidas desde enero. La noticia, en
cualquier caso, ha generado una gran preocupación en la comunidad
internacional. En las siguientes líneas intentaré demostrar que esta decisión es
en buena medida inexplicable y potencialmente muy dañina.
Trump apunta fundamentalmente a un acuerdo
desventajoso para EE UU porque se enfrenta a grandes
exigencias que pueden llevar a importantes pérdidas
económicas. Esto es muy discutible: su país es la primera
economía mundial -por tanto, con posibles- y responsable
de buena parte de las emisiones históricas de gases de
efecto invernadero, con un nivel de las emisiones per cápita
de los más elevados del mundo y, sobre todo, sus objetivos
de mitigación dentro del acuerdo son modestos y
fácilmente alcanzables con actuaciones acotadas sobre su
sector energético (más renovables y gas, menos carbón).
Su política climática, con honrosas excepciones a nivel
estatal y local, no alcanza ni de lejos la ambición y
El último dislate de TrumpLa decisión de retirar a EE UU del Acuerdo de París es inexplicable y potencialmente muy dañina
2 JUN 2017 - 14:35 CEST
TRIBUNA ›
XAVIER LABANDEIRA
Líderes mundiales critican la decisión de Trump de abandonar el Acuerdo de París ANDREW HARNIK-AP |VÍDEO:REUTERS-QUALITY

25 years of European climate policies
Xavier Labandeira FSR Climate, EUI; Universidade de Vigo
VII AERNA Conference Aveiro, 5 September 2016
Contents q Why this topic?
q What is European Climate Policy and how to assess it?
q EU ETS
q Renewable support schemes
q Energy efficiency policies
q Energy/carbon taxation
q Constraints and opportunities
q Conclusions and research challenges

Economics of climate policies q (Mitigation and adaptation)
q Efficiency and distribution
q First-best policy: GHG pricing of external damages
q Second best departures
n Exogenous objectives
n Other market failures
n Leakage
n Public revenues
q Sub-optimal prices and
q Interactions and synergies with other policy instruments
(OECD, 2011)

Why this topic (again)? q A very relevant experience (the ‘Grand Policy Experiment’)
n In comparative terms
n Sophisticated (role of Economics) and complex approximation
n Increasing academic literature
n In a moment of intense policy change/debate
q Relevance for post-Paris?
n A prototype?
n Learning by doing for the world? NDCs
q Research needs and challenges

goo.gl/QlvAFg
What is European Climate Policy? q Explicit (eg EU ETS) and implicit instruments (eg RES
promotion)
q EU, national and subnational strategies
n Linked/related or not
How to assess it?
q Complying with its GHG mitigation objectives
q Cost-effectiveness
q Contribution to international agreements (Böhringer, 2014)
q Distributional issues

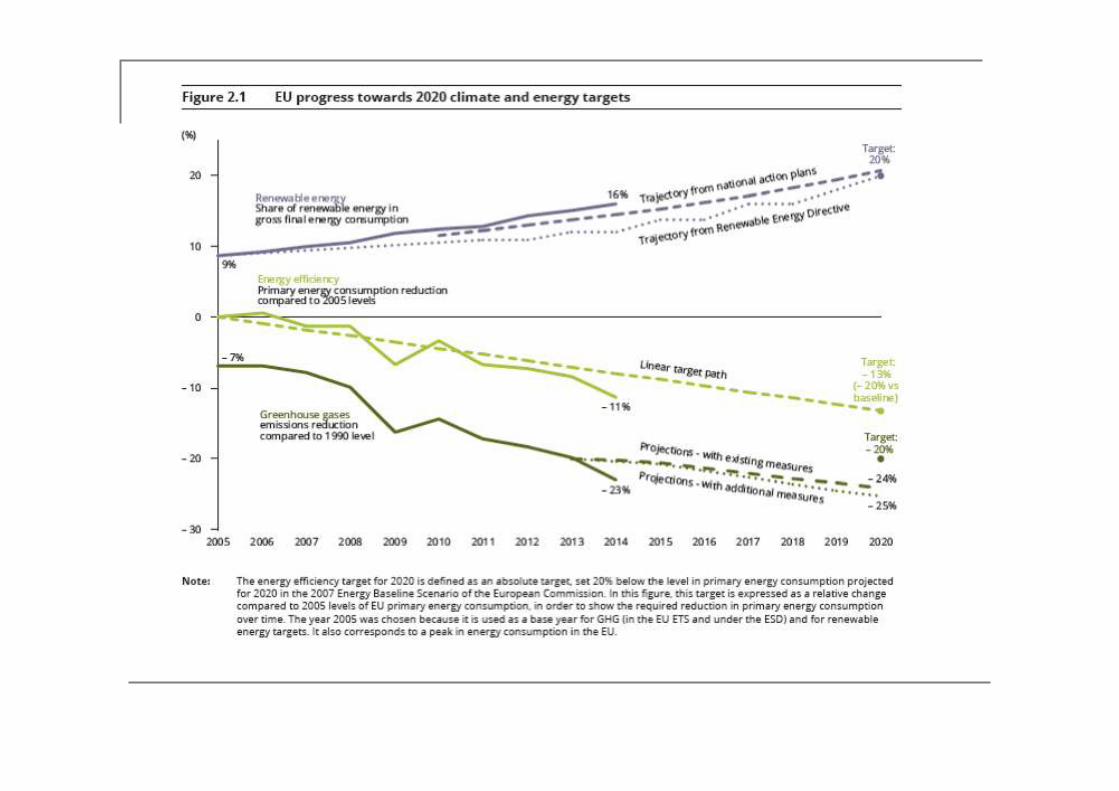
EU GHG emissions at two glances q The roadmap to 2050
q From the origins of EU climate policy to 20-20-20
q 2030 framework for energy and climate
n Targets: -40% GHG, 27% RE consumption, 27% BAU energy savings
n Policies: reformed EU ETS, Energy Union (competitiveness, security)
q Four traditional components of EU climate policies:

Source: OECD
Production and consumption-based emissions, EU-28

EU climate policy: setting and pillars q The roadmap to 2050 (Skaerseth et al., 2016)
q From the origins of EU climate policy to 20-20-20
q 2030 framework for energy and climate
n Targets: -40% GHG, 27% RE consumption, 27% BAU energy savings,
15% energy interconnection, ESD for non-EU ETS
n Policies: reformed EU ETS, Energy Union (competitiveness, security)
q Four traditional components of EU climate policies: n EU ETS
n Renewable support schemes (and CCS)
n Energy efficiency policies
n Energy/carbon taxation n (Transport)
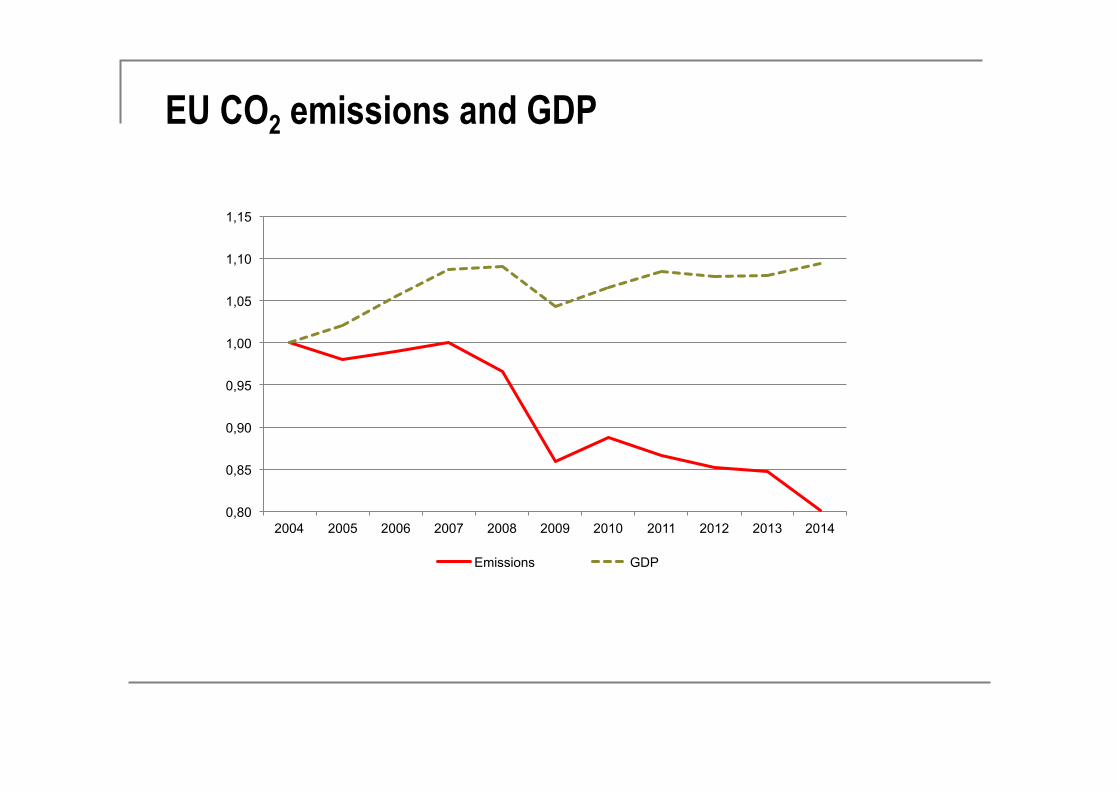
EU CO2 emissions and GDP
0,80
0,85
0,90
0,95
1,00
1,05
1,10
1,15
2004 2005 2006 2007 2008 2009 2010 2011 2012 2013 2014
Emissions GDP

(1) EU ETS
q A market-based approach, after the failure of the tax
q A continuously-reformed 2003 Directive (Learning by Doing)
q A brief history: phases I and II (Ellerman et al., 2015)
q The current phase III: EU cap, benchmarking and supply
q A reformed EU ETS after 2020:
n Declining cap
n Free allocation and benchmarking
n Distributional matters
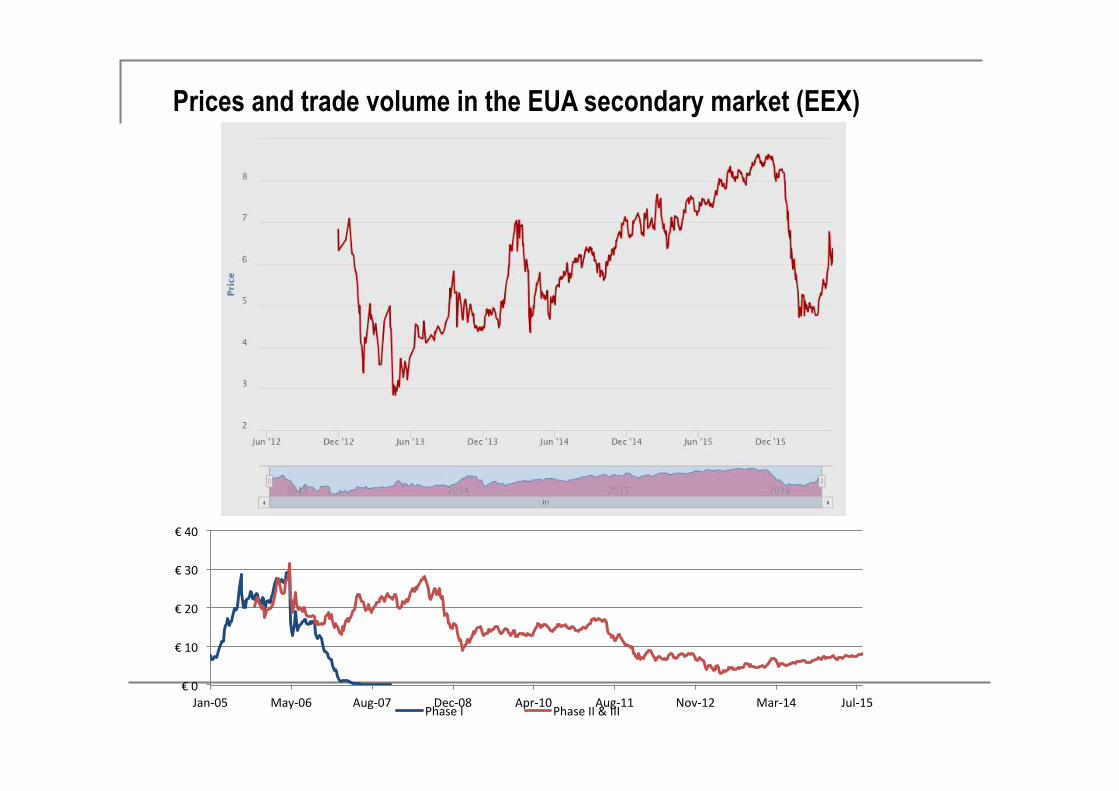
Prices and trade volume in the EUA secondary market (EEX)
€0
€10
€20
€30
€40
Jan-05 May-06 Aug-07 Dec-08 Apr-10 Aug-11 Nov-12 Mar-14 Jul-15PhaseI PhaseII&III
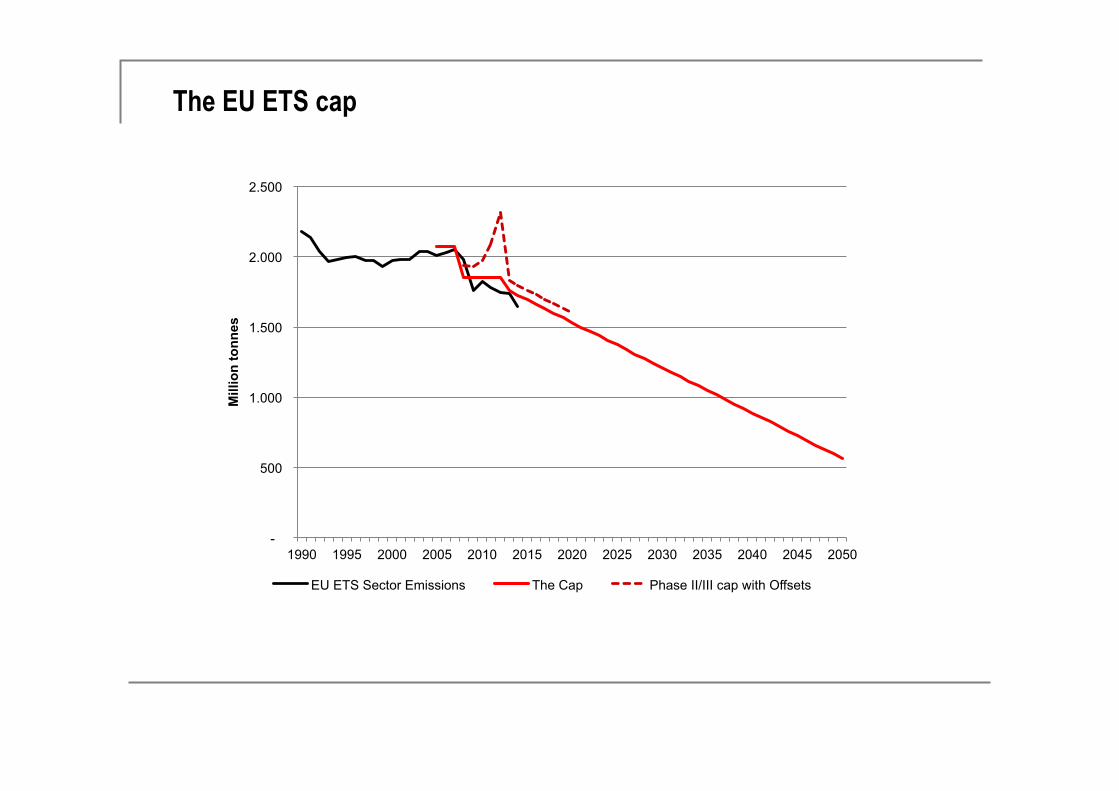
The EU ETS cap
-
500
1.000
1.500
2.000
2.500
1990 1995 2000 2005 2010 2015 2020 2025 2030 2035 2040 2045 2050
Mill
ion
tonn
es
EU ETS Sector Emissions The Cap Phase II/III cap with Offsets

An economic appraisal of the EU ETS
q Environmental effects
n Aggregate emissions (Ellerman and Buchner, 2008; di Maria, 2011)
n Firm-level data (Wagner et al, 2013)
n Power sector (Delarue et al., 2008)
q Competitiveness and leakage
n Firm-level data (Abrell et al., 2011)
n Surveys (Martin et al., 2014)
n Pass-through (Fabra and Reguant, 2014)
q Innovation (Calel and Dechezlepretre, 2015)
q Investment (Borghesi et al, 2012)
The EUA price ‘debate’
q Reasons
q Backloading and MSR
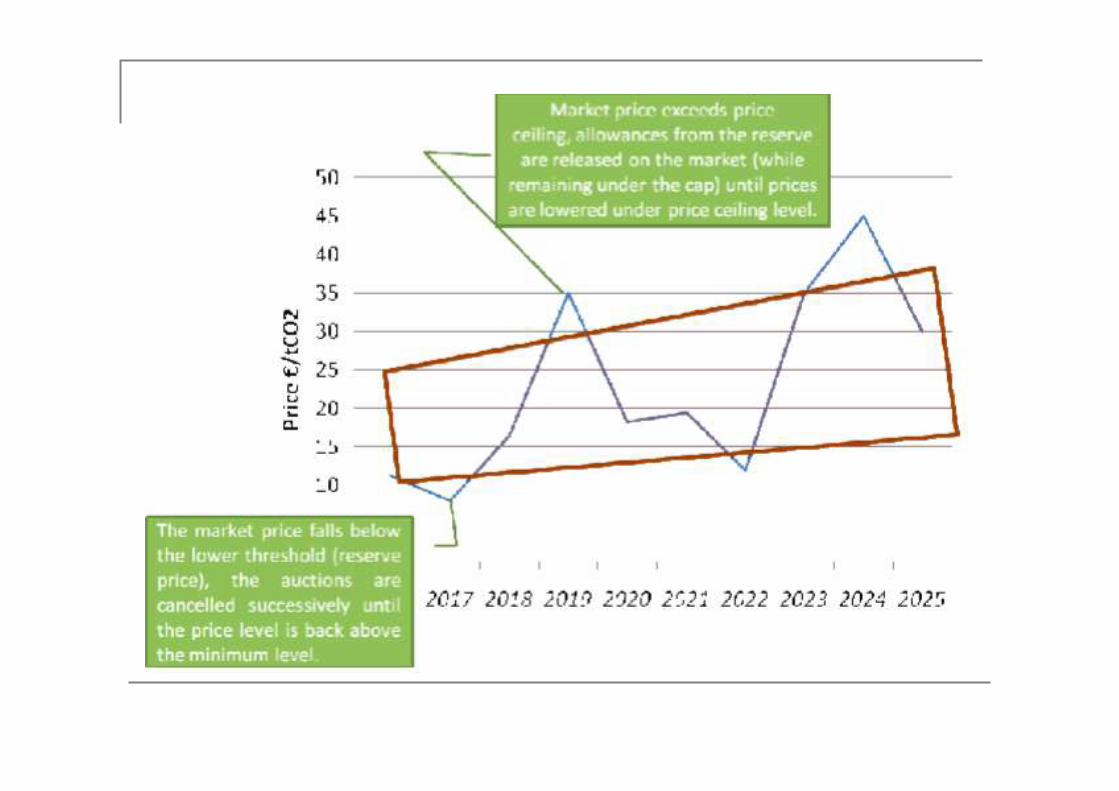
q The French ‘soft collar’ proposal
Distributional issues
q Allocation
q Pass-through
q Compensations among countries

10th Anniversary EU ETS, Florence

LIFE SIDE at FSR Climate: 2016-2018

(2) Renewable Energy
q Directive 2009/28/EC n Mandatory national targets
q Overall share of energy from renewable sources in gross final energy consumption
q Share of renewable energy in transport
n In order to reach the targets, Member States may apply
q Support schemes (investment aid, tax exemptions or reductions, tax refunds, renewable energy obligation support schemes, direct price support). New
Guidelines
q Measures of cooperation between different Member States and with third
countries
q Guidelines for renewable policies (2014/C 200/01)

Source: Steinhilber et al (2011)
Support schemes for RES in Europe

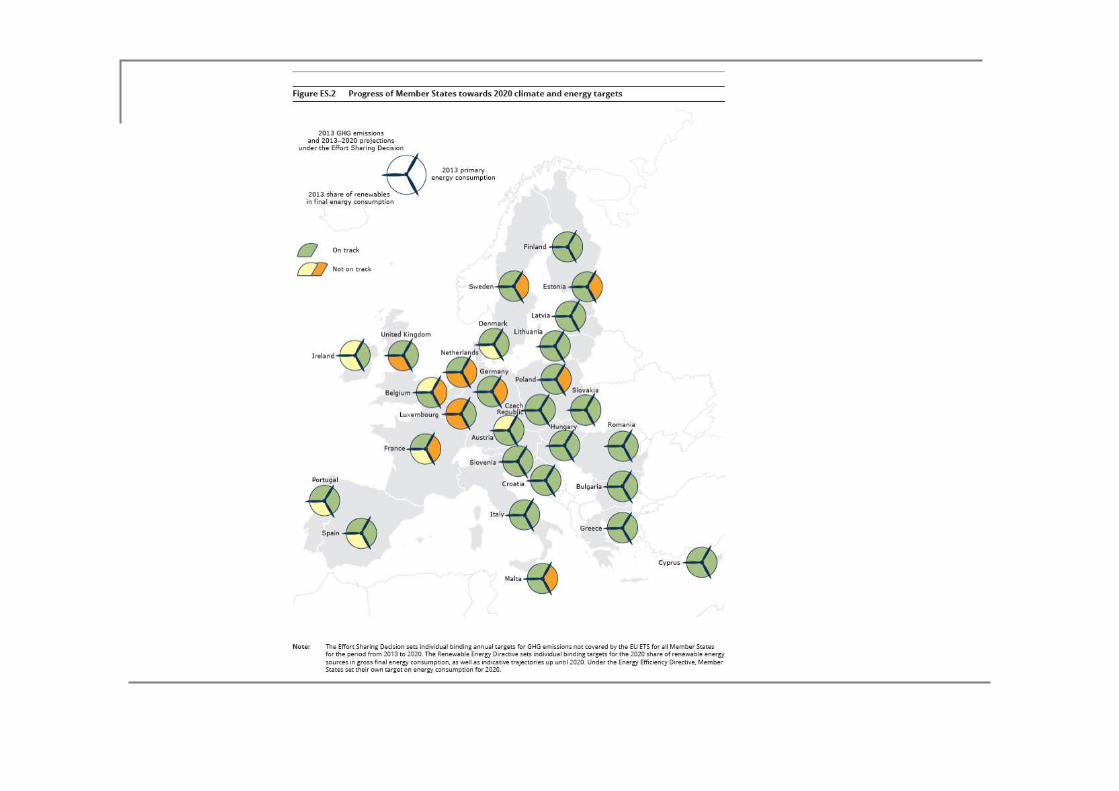
Evaluating experiences q EC (2015). Progress in renewable energy development. However, economic crisis,
administrative and infrastructure barriers and policy and support schemes
disruption are slowing this progress
q EEA (2016) Heterogeneous situation of EU countries: almost 50% need to increase renewable penetration to comply with 2020 objective
q Steinhilber et al (2011). Member States renewables policy in 2003-2010. Performance is rather heterogeneous depending on the final energy sector, the
renewable energy technology and the individual Member State.
A bigger picture q Learning by doing/learning by research
q Picking ‘global’ and effective technologies
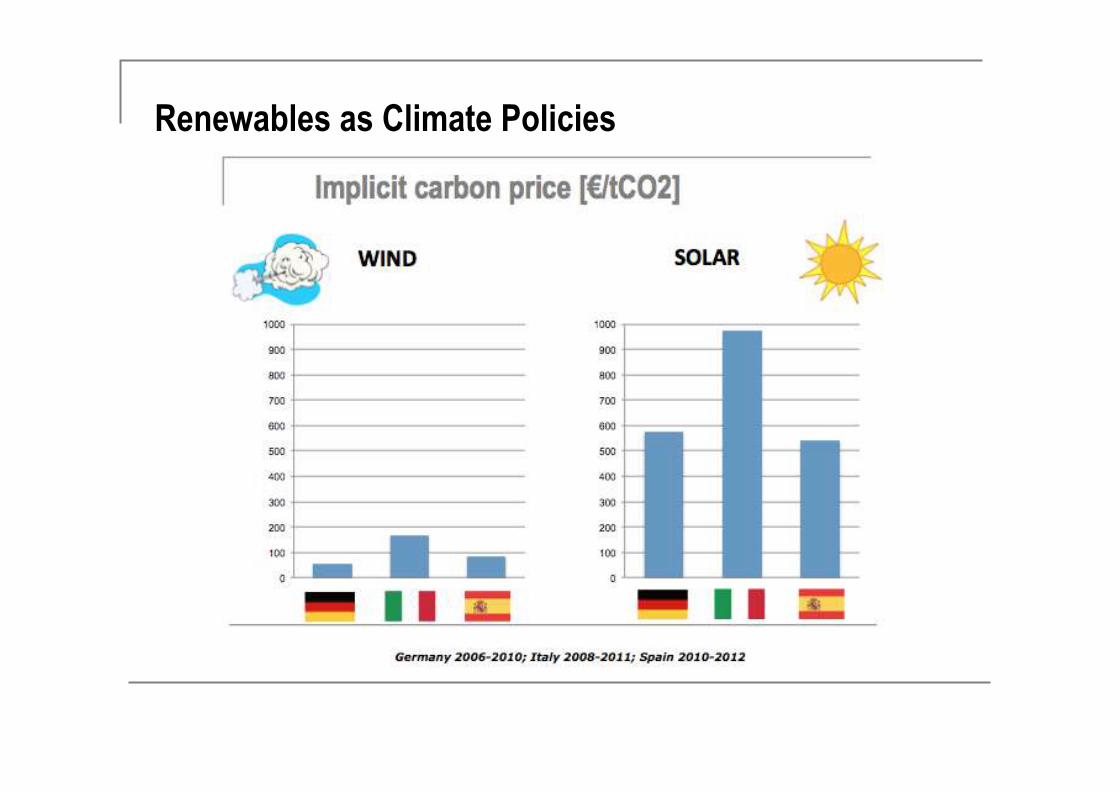
Renewables as Climate Policies
(3) Issues for Energy Efficiency
q Not an end in itself (emissions, energy imports, etc.)
q Complex issue: multiple barriers and conditions
n Energy efficiency gap (buildings and transport)
n Sectoral and country variations (NEEAPs)
q Packages vs collection of single instruments
q New policy approaches: information; nudging
q Energy efficiency and income distribution
q How to evaluate and implement (global) cost-effective options?

Energy
Delivering the
2020 goal
Energy Efficiency Directive
2012/27/EU
Ecodesign Directive
2009/125/EC
Energy Performance of Buildings
Directive 2010/31/EU
Energy Labelling Directive
2010/30/EU
The legal framework
Directive 2012/27/UE n Efficiency in energy use (Filippini et al, 2014; Ó Broin et al, 2015)
q Building renovation
q Energy efficiency obligation schemes
q Energy audits and energy management systems
q Metering and billing information (Ramos et al, 2015)
q Consumer information and empowering programme
n Efficiency in energy supply (Bertoldi et al, 2010)
q Promotion of efficiency in heating and cooling
q Energy transformation, transmission and distribution
n Horizontal provisions
q Availability of qualification, accreditation and certification schemes
q Information and training
q Energy services

Policy developments reported in some 2014 NEEAPs q France
n Doubling of the ambition level of the EE obligation scheme
n Fund fo building refurbishment
n Taxation in the transport sector could bring additional savings
q Germany n Primary energy consumption will be almost 10% lower than target
n Existing measures will be strengthened, including building efficiency requirements,
taxation, advice/awareness-rising and support for investment.
n An important element will be the development of the ESCO
q Italy n Strengthen the minimum standards for the construction of new buildings and the
renovation of existing
n Consolidate tax deductions for the refurbishment of buildings and strengthen incentives
for buildings owned by public bodies
n Stregthen the system of EE certificates (white certificates)

Scoping meeting Energy Efficiency

(4) Energy/carbon taxation
q Current Situation: (Harmonized) energy taxes at national
level
q Proposal for a Council Directive (2011)
n Again, harmonization but higher rates
n CO2 component
n Energy component
q Carbon taxation
q Green tax reforms
q Transport
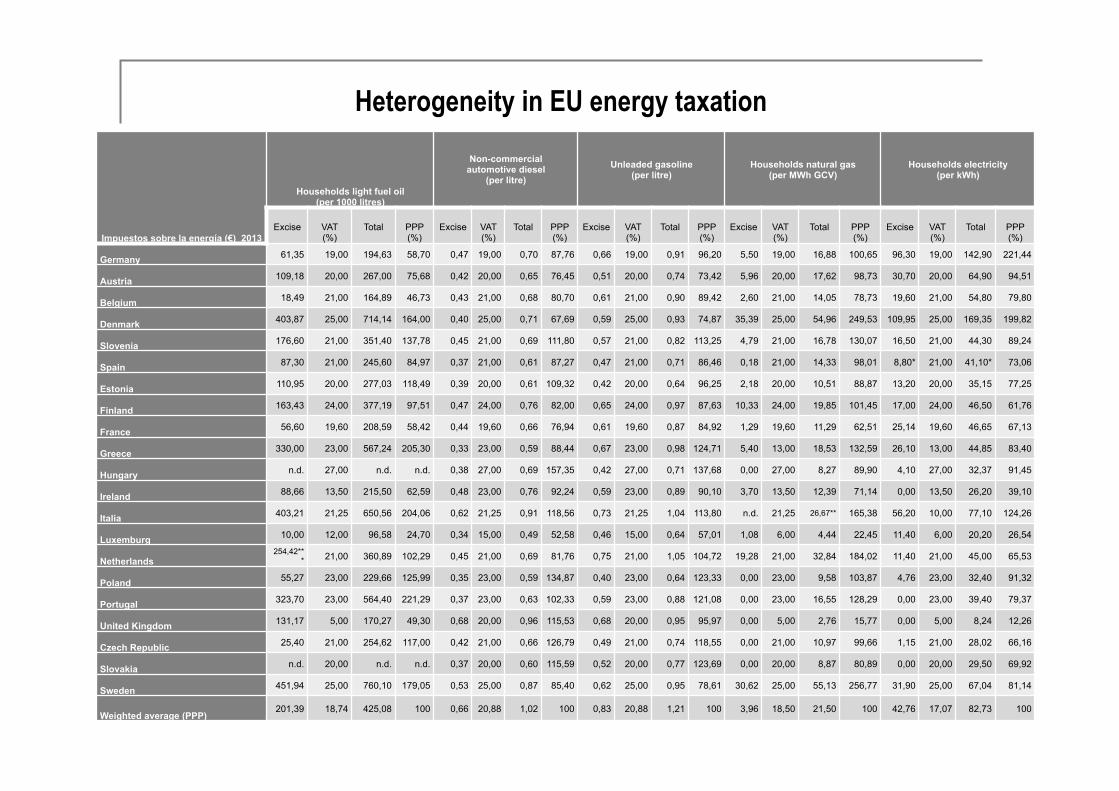
Impuestos sobre la energía (€) 2013
Households light fuel oil (per 1000 litres)
Non-commercial automotive diesel
(per litre) Unleaded gasoline
(per litre) Households natural gas
(per MWh GCV) Households electricity
(per kWh)
Excise
VAT (%)
Total
PPP (%)
Excise
VAT (%)
Total
PPP (%)
Excise
VAT (%)
Total
PPP (%)
Excise
VAT (%)
Total
PPP (%)
Excise
VAT (%)
Total
PPP (%)
Germany 61,35 19,00 194,63 58,70 0,47 19,00 0,70 87,76 0,66 19,00 0,91 96,20 5,50 19,00 16,88 100,65 96,30 19,00 142,90 221,44
Austria 109,18 20,00 267,00 75,68 0,42 20,00 0,65 76,45 0,51 20,00 0,74 73,42 5,96 20,00 17,62 98,73 30,70 20,00 64,90 94,51
Belgium 18,49 21,00 164,89 46,73 0,43 21,00 0,68 80,70 0,61 21,00 0,90 89,42 2,60 21,00 14,05 78,73 19,60 21,00 54,80 79,80
Denmark 403,87 25,00 714,14 164,00 0,40 25,00 0,71 67,69 0,59 25,00 0,93 74,87 35,39 25,00 54,96 249,53 109,95 25,00 169,35 199,82
Slovenia 176,60 21,00 351,40 137,78 0,45 21,00 0,69 111,80 0,57 21,00 0,82 113,25 4,79 21,00 16,78 130,07 16,50 21,00 44,30 89,24
Spain 87,30 21,00 245,60 84,97 0,37 21,00 0,61 87,27 0,47 21,00 0,71 86,46 0,18 21,00 14,33 98,01 8,80* 21,00 41,10* 73,06
Estonia 110,95 20,00 277,03 118,49 0,39 20,00 0,61 109,32 0,42 20,00 0,64 96,25 2,18 20,00 10,51 88,87 13,20 20,00 35,15 77,25
Finland 163,43 24,00 377,19 97,51 0,47 24,00 0,76 82,00 0,65 24,00 0,97 87,63 10,33 24,00 19,85 101,45 17,00 24,00 46,50 61,76
France 56,60 19,60 208,59 58,42 0,44 19,60 0,66 76,94 0,61 19,60 0,87 84,92 1,29 19,60 11,29 62,51 25,14 19,60 46,65 67,13
Greece 330,00 23,00 567,24 205,30 0,33 23,00 0,59 88,44 0,67 23,00 0,98 124,71 5,40 13,00 18,53 132,59 26,10 13,00 44,85 83,40
Hungary n.d. 27,00 n.d. n.d. 0,38 27,00 0,69 157,35 0,42 27,00 0,71 137,68 0,00 27,00 8,27 89,90 4,10 27,00 32,37 91,45
Ireland 88,66 13,50 215,50 62,59 0,48 23,00 0,76 92,24 0,59 23,00 0,89 90,10 3,70 13,50 12,39 71,14 0,00 13,50 26,20 39,10
Italia 403,21 21,25 650,56 204,06 0,62 21,25 0,91 118,56 0,73 21,25 1,04 113,80 n.d. 21,25 26,67** 165,38 56,20 10,00 77,10 124,26
Luxemburg 10,00 12,00 96,58 24,70 0,34 15,00 0,49 52,58 0,46 15,00 0,64 57,01 1,08 6,00 4,44 22,45 11,40 6,00 20,20 26,54
Netherlands 254,42**
* 21,00 360,89 102,29 0,45 21,00 0,69 81,76 0,75 21,00 1,05 104,72 19,28 21,00 32,84 184,02 11,40 21,00 45,00 65,53
Poland 55,27 23,00 229,66 125,99 0,35 23,00 0,59 134,87 0,40 23,00 0,64 123,33 0,00 23,00 9,58 103,87 4,76 23,00 32,40 91,32
Portugal 323,70 23,00 564,40 221,29 0,37 23,00 0,63 102,33 0,59 23,00 0,88 121,08 0,00 23,00 16,55 128,29 0,00 23,00 39,40 79,37
United Kingdom 131,17 5,00 170,27 49,30 0,68 20,00 0,96 115,53 0,68 20,00 0,95 95,97 0,00 5,00 2,76 15,77 0,00 5,00 8,24 12,26
Czech Republic 25,40 21,00 254,62 117,00 0,42 21,00 0,66 126,79 0,49 21,00 0,74 118,55 0,00 21,00 10,97 99,66 1,15 21,00 28,02 66,16
Slovakia n.d. 20,00 n.d. n.d. 0,37 20,00 0,60 115,59 0,52 20,00 0,77 123,69 0,00 20,00 8,87 80,89 0,00 20,00 29,50 69,92
Sweden 451,94 25,00 760,10 179,05 0,53 25,00 0,87 85,40 0,62 25,00 0,95 78,61 30,62 25,00 55,13 256,77 31,90 25,00 67,04 81,14
Weighted average (PPP) 201,39 18,74 425,08 100 0,66 20,88 1,02 100 0,83 20,88 1,21 100 3,96 18,50 21,50 100 42,76 17,07 82,73 100
Heterogeneity in EU energy taxation

Carbon taxes in EU countries
q Finland (1990)
q Netherlands (1990)
q Norway (1991)
q Sweden (1991)
q Denmark (1992)
q UK (2001)
q Ireland (2010)
q France (2014)
Green tax reforms (Gago et al, 2014)
q Multiple dividends?
q The generations
n Scandinavian model
n German model
n Post-crisis applications
Taxing transport
q Multiple externalities
q Constraints of current taxation
q New transport taxes

Evaluating experiences
q EEA (2016) Updated situation on EU energy and environmental taxes
q Martin et al (2014). Climate change levy UK. Strong negative impact on energy intensity and use of electricity
q Hammar et al (2013). Sweden’s CO2 tax. Major impact on fuels used for
heating purposes.
q Lin and Li (2011). Northern European carbon taxes. Stronger
effectiveness of the Finish tax due to exemptions in other countries
q Vollebergh (2008). Energy tax reform in Netherlands. Considerable amount of tax revenue from a green tax base
q Our work for Spain

Scoping meeting Taxation
Summing up on EU climate policy instruments
q (cost) Effectiveness: short-term vs long-term
q Supplementary effects n ‘Low prices’
n Market failures
q Coverage-non coverage by EU ETS
q Other non-GHG objectives (Tinbergen)
q Distribution

Constraints q Competitiveness
q Distributional concerns
q Institutional setting
and Opportunities
q Overcoming constraints through a climate club after Paris?
q Learning by doing for the world?
n EU ETS as a prototype for other systems; and linkage towards a global price
n Rearranging priorities in renewable promotion: R&D, potentials…
n Coordinating policy tools and jurisdictions?

Some normative messages q Targets (Tol, 2012)
q GHG prices
q Instrument mix (Böhringer et al, 2016)
q Distributional issues
q International dimension: the debate on linking and BTA

Research needs and challenges q Beyond Energy and Environmental Economics
q Role of Empirical Economics (Ex ante and Ex post)
n Actual implementations
n Future proposals
n Non-EU ETS and member-state level
n Transport
q Need for experimental approaches

España n Dentro da política climática da UE
n Vulnerabilidade importante
n Grandes potenciais de eficiencia enerxética
n Prezos: fiscalidade enerxética
n Renovables: Desplegue custo-efectivo e Investigación

España Spanish CO2 emissions
0
50
100
150
200
250
300
350
400
450
500
1990 1991 1992 1993 1994 1995 1996 1997 1998 1999 2000 2001 2002 2003 2004 2005 2006 2007 2008 2009 2010 2011 2012
Emisiones de CO2-eq Límite de Kioto Transporte
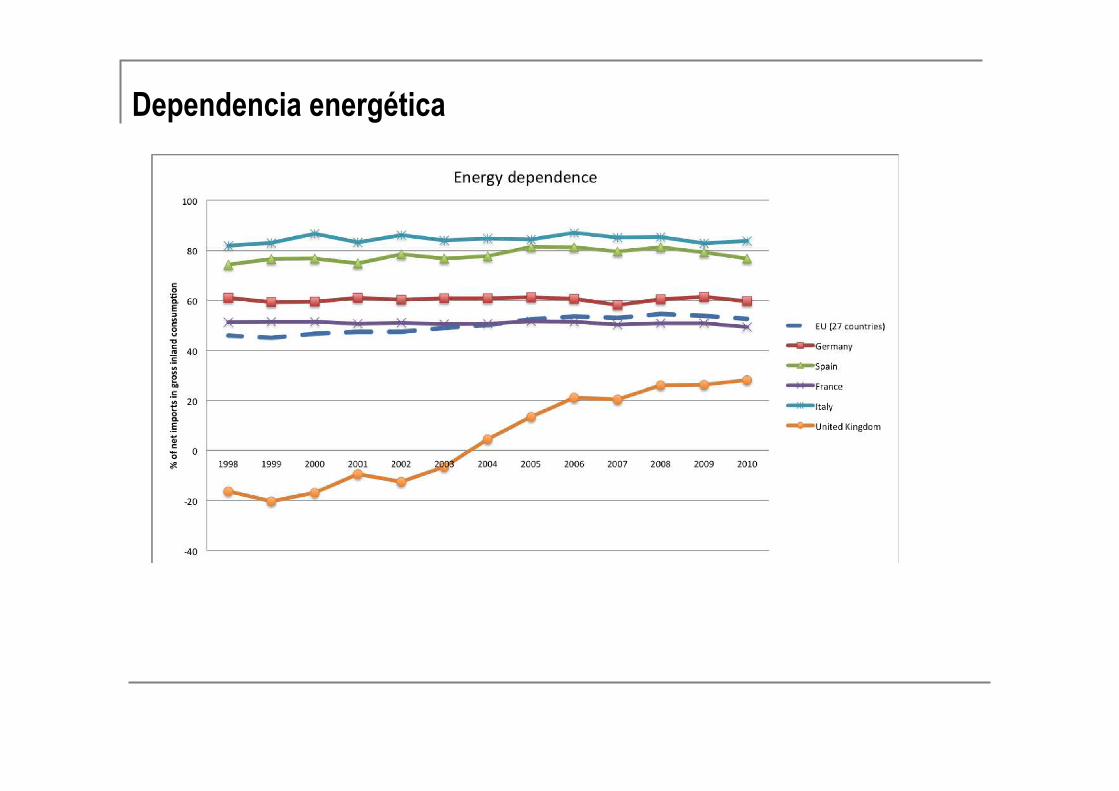
Dependencia energética

Proyecciones oficiales GEI
!"#$%&&'#(%)*+%*%,')'#(%)*-./*.)0121*3455634748*/(9#",%*1*:.;*<"=>&?@#*7838ABC*D%&')'E(*3F48* 3G*
*
!"#$%&'()*)*)+',-"."/01.'2/2&3'405102&%"/'+',.610&%"/'78'
!"#$###
%##$###
%"#$###
&##$###
&"#$###
'##$###
'"#$###
"##$###
%##!
%##%
%##&
%##'
%##"
%##(
%##)
%##*
%##+
%#!#
%#!!
%#!%
%#!&
%#!'
%#!"
%#!(
%#!)
%#!*
%#!+
%#%#
%#%!
%#%%
%#%&
%#%'
%#%"
%#%(
%#%)
%#%*
%#%+
%#&#
92':;<+1
=%/>)'?/2&3'405102&%"/?/2&3'@,4.' + ,.610&%"/'78
,-% ,.' /%- 0123454
6
!##$###
!%#$###
!'#$###
!(#$###
!*#$###
%##$###
%%#$###
%'#$###
%(#$###
%#!!
%#!%
%#!&
%#!'
%#!"
%#!(
%#!)
%#!*
%#!+
%#%#
%#%!
%#%%
%#%&
%#%'
%#%"
%#%(
%#%)
%#%*
%#%+
%#&#
92':;<+1
=%/>)'A/+,?B?/2&3'@,4.' + ,.610&%"/'78
,-% ,.' /%- 0123454
6
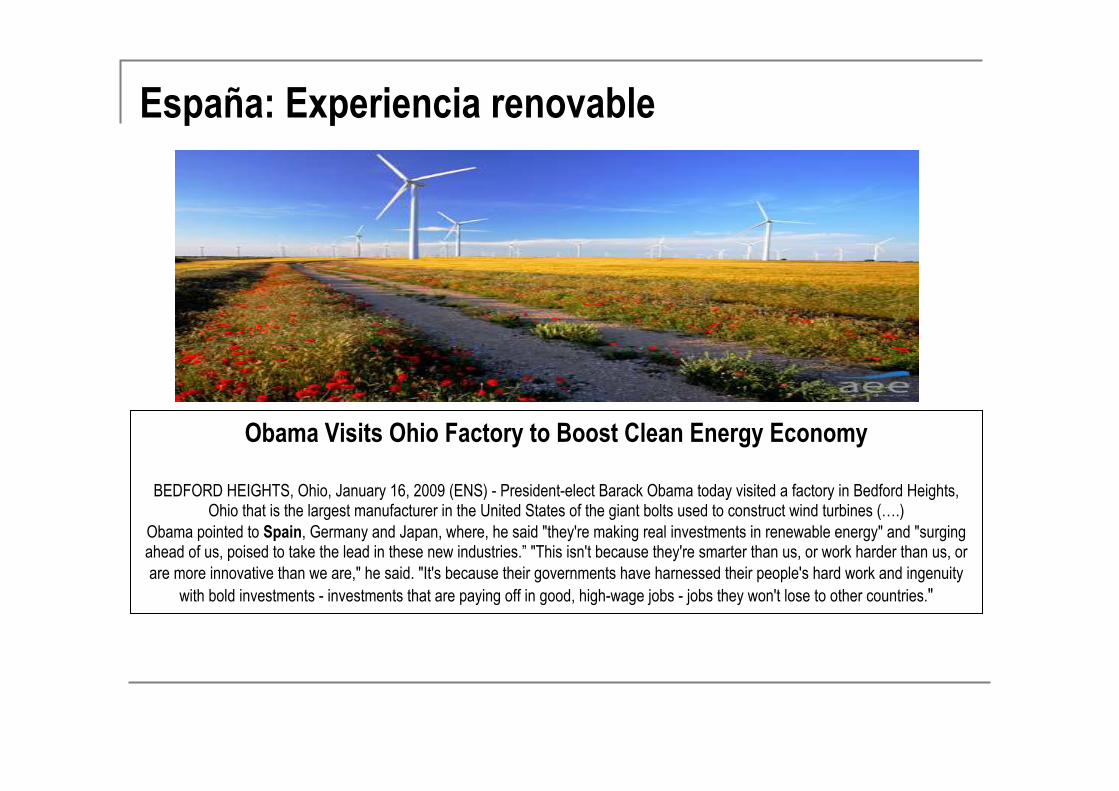
Obama Visits Ohio Factory to Boost Clean Energy Economy
BEDFORD HEIGHTS, Ohio, January 16, 2009 (ENS) - President-elect Barack Obama today visited a factory in Bedford Heights, Ohio that is the largest manufacturer in the United States of the giant bolts used to construct wind turbines (….)
Obama pointed to Spain, Germany and Japan, where, he said "they're making real investments in renewable energy" and "surging ahead of us, poised to take the lead in these new industries.” "This isn't because they're smarter than us, or work harder than us, or are more innovative than we are," he said. "It's because their governments have harnessed their people's hard work and ingenuity
with bold investments - investments that are paying off in good, high-wage jobs - jobs they won't lose to other countries."
España: Experiencia renovable

27/10/13 19:31Renewable Energy in Spain Is Taking a Beating - NYTimes.com
Página 1 de 5http://www.nytimes.com/2013/10/09/business/energy-environment/r…-energy-in-spain-is-taking-a-beating.html?_r=0&pagewanted=print
October 8, 2013
Renewable Energy in Spain Is Taking aBeatingBy ANDRÉS CALA
MADRID — Years of disastrous policies, coupled with the economic crisis, have recast
renewable energy in Spain. Once touted as the embodiment of progress, wealth and
sustainability, the industry is now seen as an unwanted and costly extravagance.
The policy turnaround started in 2010 but picked up momentum with a government decree in
July aimed at closing a widening gap between the cost of electricity generation and what
consumers pay — known as the tariff deficit.
The decree’s impact has all but erased public support for renewable power, raising alarms in the
industry inside and outside Spain.
“We’ve gone from misery to ruin,” said Jaume Margarit, director of the Association of
Renewable Energy Producers.
In essence, the decree aims to stop an unsustainable annual growth of the tariff deficit, which
over the years has built up a cumulative debt of about !26 billion, or $35 billion. In an
embarrassing admission, the government said last month that despite past consumer price
increases for power and attempts at reform, the tariff deficit this year would reach !2.5 billion
to !3 billion.
The call on the government’s coffers has soared as tax revenue has slumped because of the
recession.
While the demand for power has plummeted nearly 6 percent since 2007 because of the slide in
economic activity, the share of mandated renewable output has increased, crowding out cheaper
coal and gas.
More than 27 percent of Spain’s power supply in 2012 came from renewable sources, excluding
big hydroelectric generators, compared with around 13 percent in 2007 — one of the highest
shares in the European Union.
The government’s bid to change course has all but assured legal battles with investors, and has
triggered diplomatic pressure by the United States and the rest of Europe, as well as expressions
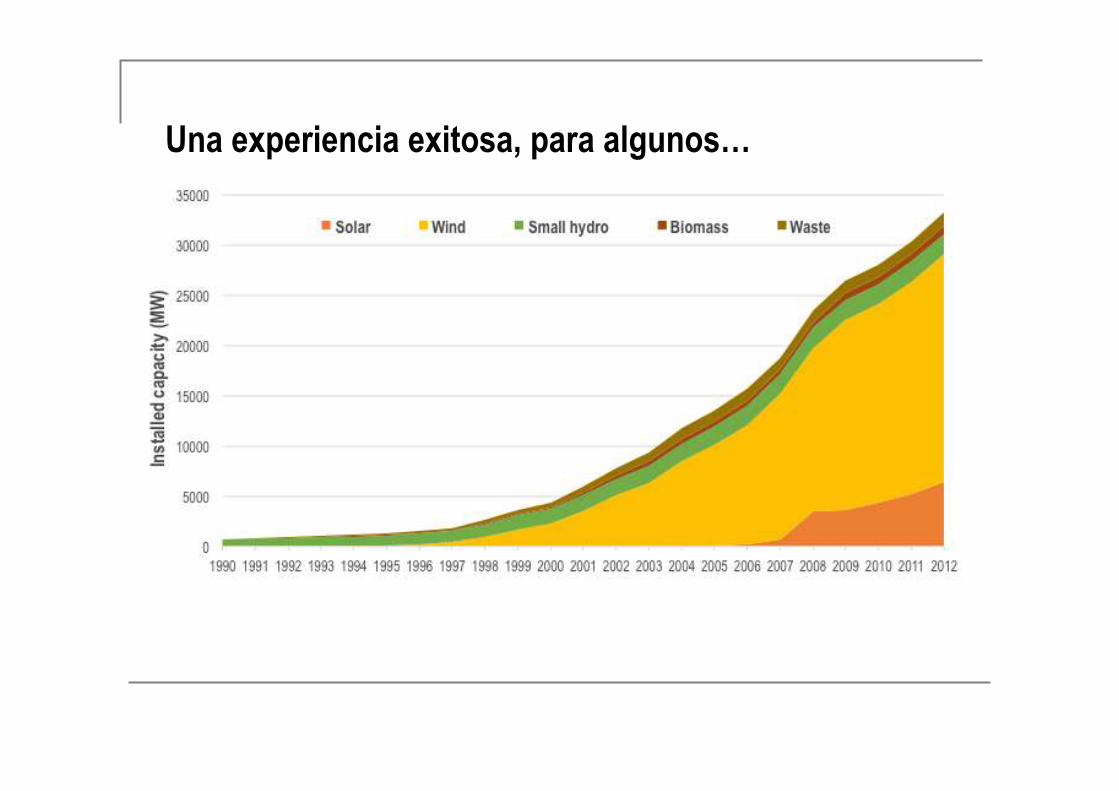
Una experiencia exitosa, para algunos…

Produción eólica, 24/09/2012

Solar FV
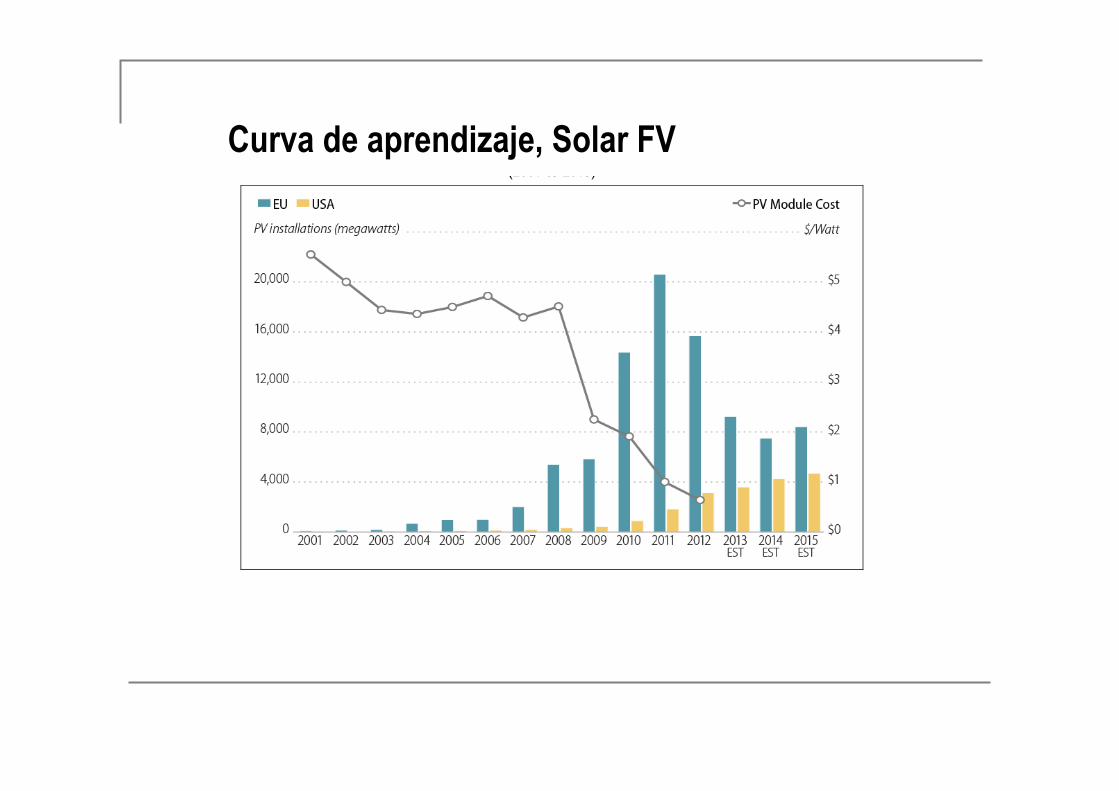
Curva de aprendizaje, Solar FV
European Union Wind and Solar Electricity Policies: Overview and Considerations
Congressional Research Service 34
Figure 6. EU and U.S. Solar PV Installations and PV Module Costs (2001 to 2015)
Source: CRS, PV installation and module cost data from Bloomberg New Energy Finance.
Notes: EST = estimate.
As indicated in Figure 6, EU solar PV installations started increasing in 2004 and peaked in 2011. Solar PV module costs began a rapid decline in 2009, reaching less than $1 per watt in 2012. As module costs came down, U.S. PV installations increased. Annual PV installations in the US are projected to continue rising out to 2015, while EU installations are forecasted to decline in the near term. In essence, as the U.S. solar PV market is growing, U.S. solar PV buyers are now paying much less for PV modules than EU buyers did in the period between 2007 and 2011.
Renewable Electricity Incentives in the EU and U.S. are Similar, but Reversed
Both the EU and the United States offer a number of incentives that support deployment of renewable electricity generation. Some policies are at the EU and U.S. national level and some policies are available only in specific EU member-countries and individual U.S. states. Generally, the European Union sets binding renewable electricity requirements for each member, and each member country provides a unique set of financial incentives to motivate deployment of renewable power systems that will achieve the EU-level targets. In the United States, the federal government provides financial incentives for renewable electricityNproduction tax credits for wind and investment tax credits for solar, for exampleNand some states have established renewable portfolio standards that mandate a certain percentage of electricity be generated from renewable energy sources. As of June 2013, 29 states and the District of Columbia had binding
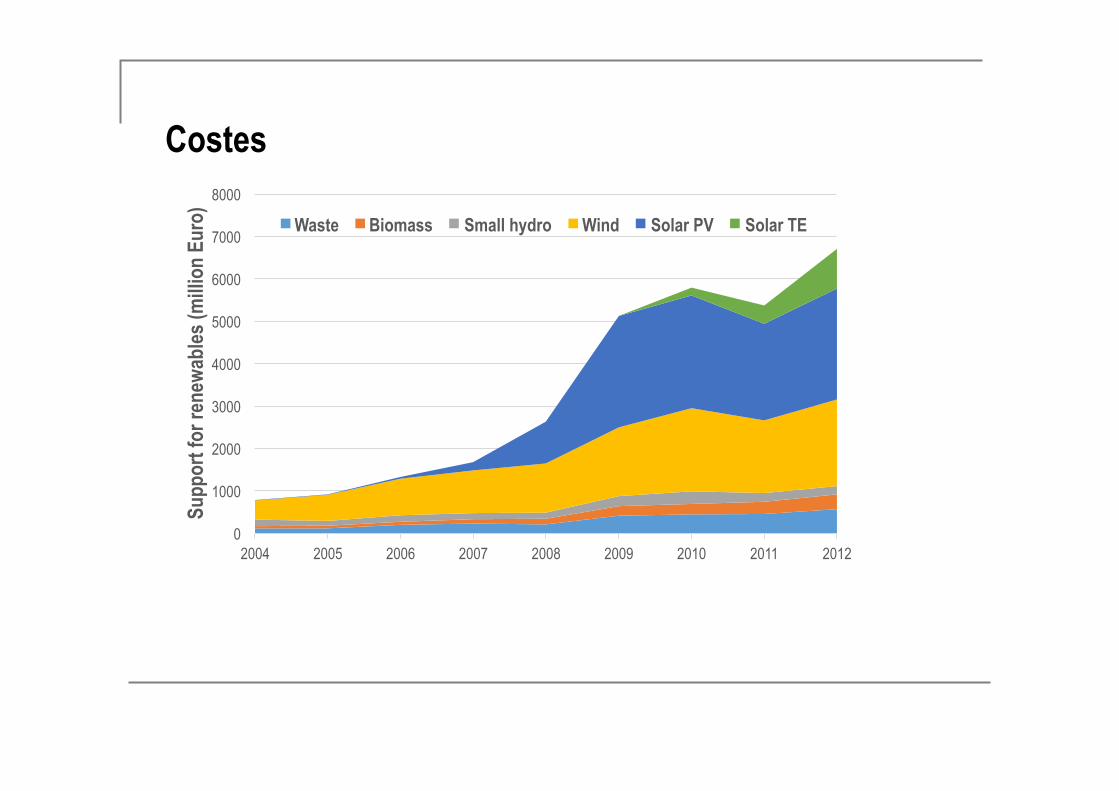
Costes
0
1000
2000
3000
4000
5000
6000
7000
8000
2004 2005 2006 2007 2008 2009 2010 2011 2012
Supp
ort f
or re
new
able
s (m
illio
n Eu
ro)
Waste Biomass Small hydro Wind Solar PV Solar TE
La experiencia renovable española
q Políticas con distinto grado de efectividad
q Elevados costes
q Responden a diversos objetivos
q Importantes efectos distributivos
q Cambios estruturales en el sistema energético
q Deseable evitar oscilaciones

Eficiencia energética en España
Eficiencia energética en España (2)
q De nuevo, objetivos varios
q La importancia del sector residencial y transporte
q Relevancia de la información: certificados energéticos
q Cuestiones distributivas
q Un impuesto sobre la ineficiencia energética de las
viviendas?
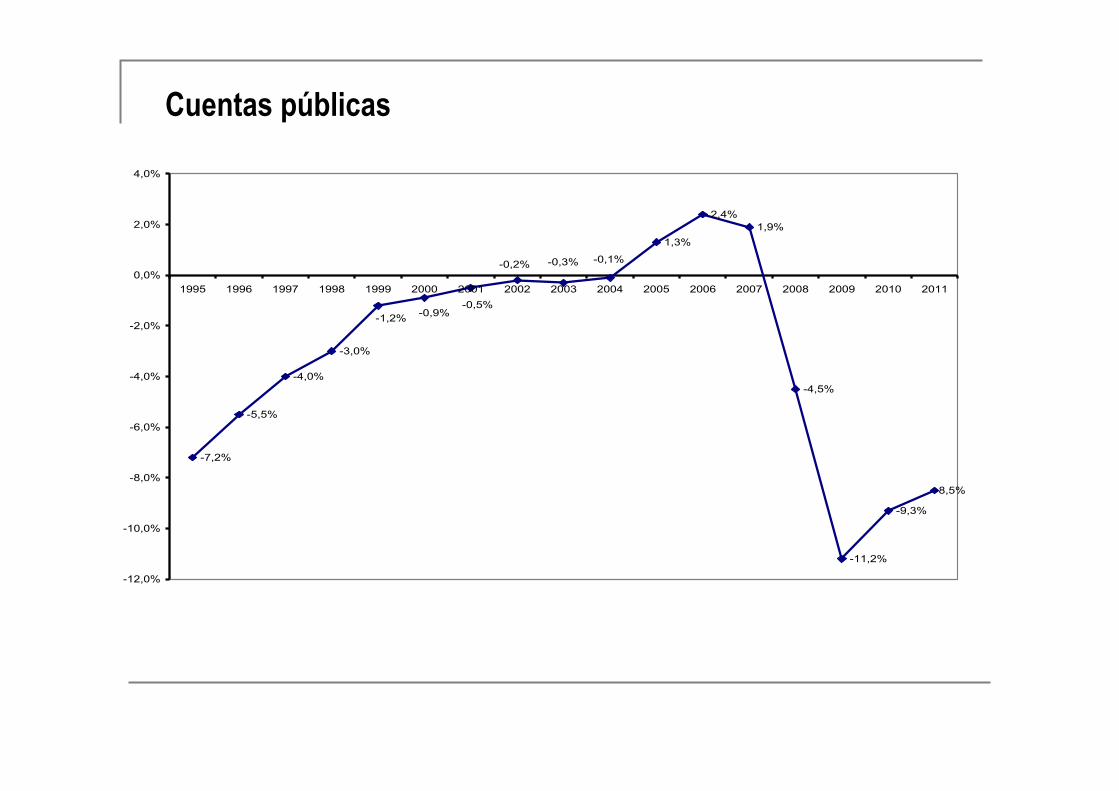
Cuentas públicas
-7,2%
-5,5%
-4,0%
-3,0%
1,3%
2,4%1,9%
-4,5%
-11,2%
-9,3%
-8,5%
-0,1%-0,3%-0,2%
-0,5%-0,9%-1,2%
-12,0%
-10,0%
-8,0%
-6,0%
-4,0%
-2,0%
0,0%
2,0%
4,0%
1995 1996 1997 1998 1999 2000 2001 2002 2003 2004 2005 2006 2007 2008 2009 2010 2011

Evolución ingresos fiscales sobre PIB (2002-2012)
31
36
41
46
51
2002 2003 2004 2005 2006 2007 2008 2009 2010 2011 2012
EU-27 Germany Ireland Greece Spain France Italy Portugal United Kingdom
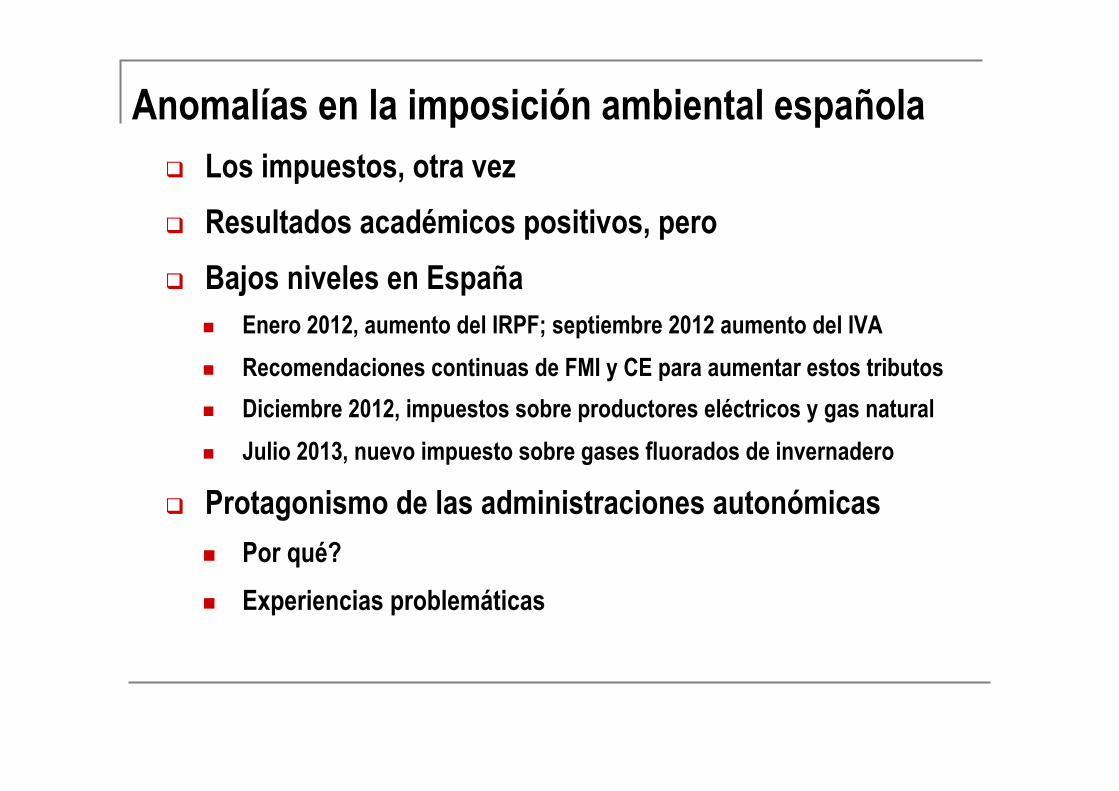
Anomalías en la imposición ambiental española q Los impuestos, otra vez
q Resultados académicos positivos, pero
q Bajos niveles en España n Enero 2012, aumento del IRPF; septiembre 2012 aumento del IVA
n Recomendaciones continuas de FMI y CE para aumentar estos tributos
n Diciembre 2012, impuestos sobre productores eléctricos y gas natural
n Julio 2013, nuevo impuesto sobre gases fluorados de invernadero
q Protagonismo de las administraciones autonómicas
n Por qué?
n Experiencias problemáticas
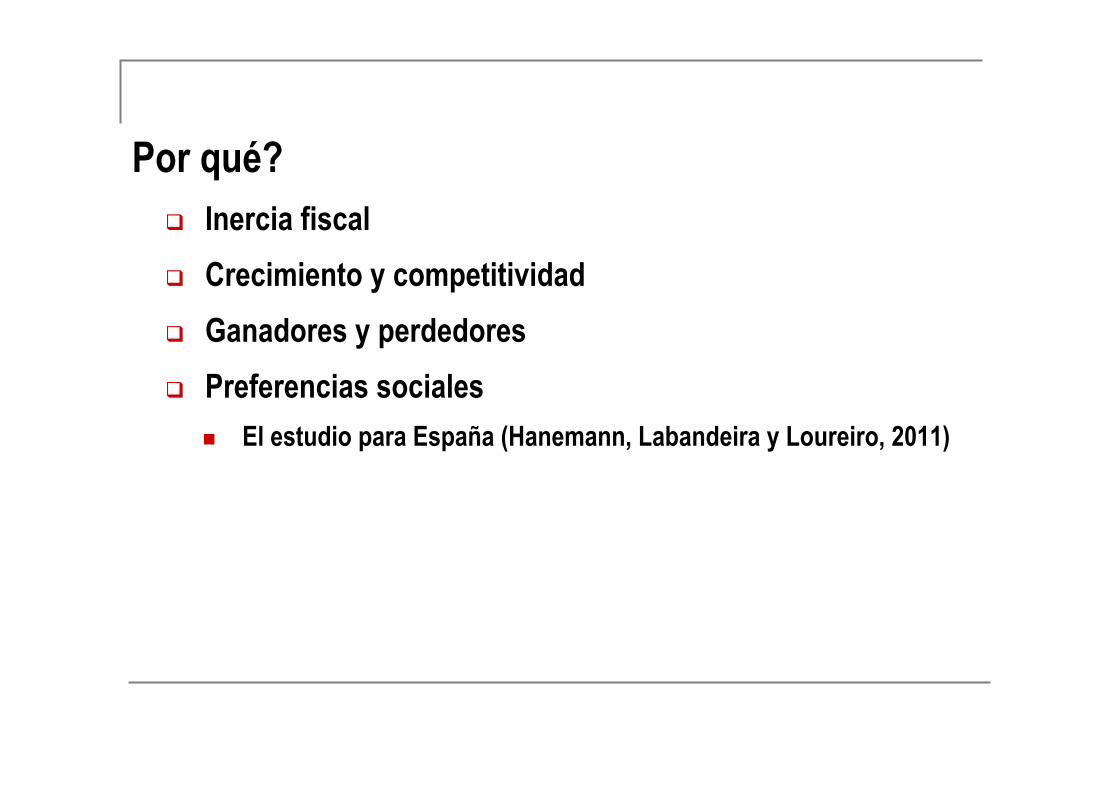
Por qué? q Inercia fiscal
q Crecimiento y competitividad
q Ganadores y perdedores
q Preferencias sociales
n El estudio para España (Hanemann, Labandeira y Loureiro, 2011)

Una simulación q Basada en la propuesta de Directiva sobre
imposición energética armonizada (2011)
q Tendencia a la media europea
q Sin reforma fiscal verde
n Posibles compensaciones distributivas
n Compensaciones a las CCAA?
n Financiación de la eficiencia energética/renovables

Una simulación (2) q Posible aumento recaudatorio de + 11.700 M€ (+90% desde 2010)
q Otros esfuerzos de consolidación en este campo n Grecia: +42% en ingresos fiscales energéticos (2011/2008)
n Italia: +27% (gasolina) y +43% (diesel) entre abril 2011 y junio 2012
q Otros incrementos recadatorios n Zapatero 2010/11: IVA + 5500 M€, IRPF +200 M€
n Rajoy 2012: IVA +7500 M€, IRPF +4000 M€, ‘Ambientales’ 2700 M€
n Nuevo impuesto sobre gases fluorados de efecto invernadero (2013): 300 M€
n Impuestos energético-ambientales autonómicos (2012): 250 M€

Informe Anual 2013 Economics for Energy www.eforenergy.org
13/11/17 20(53La hora del acuerdo contra el cambio climático en España | España | EL PAÍS
Página 1 de 4https://politica.elpais.com/politica/2017/06/04/actualidad/1496588914_964330.html
ESPAÑA
MÁS INFORMACIÓN
El Día Mundial delMedio Ambiente:conectar a laspersonas con lanaturaleza
Rajoy reafirma elcompromiso deEspaña con elAcuerdo de París
España necesita unplan contra elcambio climático
La Eurocámara
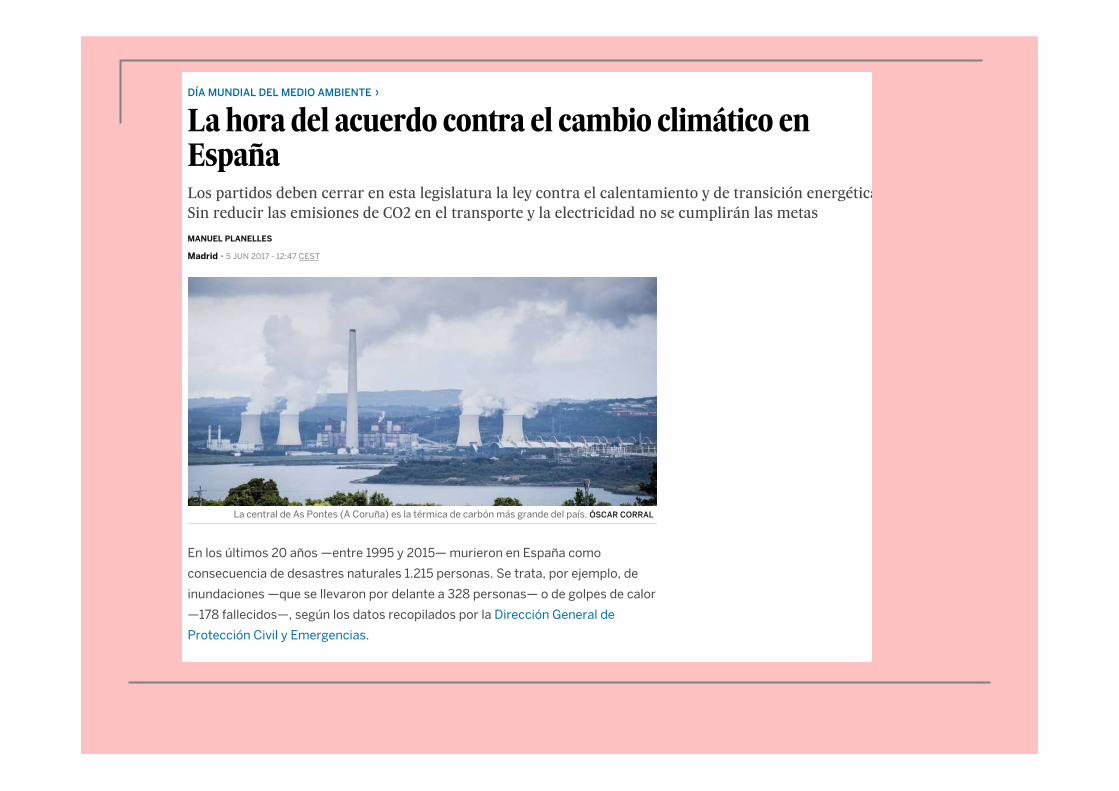
En los últimos 20 años —entre 1995 y 2015— murieron en España como
consecuencia de desastres naturales 1.215 personas. Se trata, por ejemplo, de
inundaciones —que se llevaron por delante a 328 personas— o de golpes de calor
—178 fallecidos—, según los datos recopilados por la Dirección General de
Protección Civil y Emergencias.
La ONU y diversos organismos científicos alertan de que el
cambio climático no solo afecta al aumento de las
temperaturas medias, sino que incrementa el número y la
intensidad de los desastres naturales. Es un efecto más del
calentamiento global, que en España amenaza además con
provocar la desertización de amplias zonas o la
desaparición por la subida del nivel del mar de deltas tan
importantes como el del Ebro.
España se sumó en 2015 al Acuerdo de París, que ya ha
ratificado y donde tiene intención de seguir a pesar de la
espantada de Donald Trump, que quiere sacar del pacto a
EE UU, el país que más ha contribuido históricamente al
cambio climático.
Al estar dentro del Acuerdo de París y de la Unión Europea,
España sabe adónde tiene que llegar: a descarbonizar su
economía, es decir, a conseguir crecer prescindiendo de los
gases de efecto invernadero, generados por la quema de
combustibles fósiles como el carbón y causantes del
La hora del acuerdo contra el cambio climático enEspañaLos partidos deben cerrar en esta legislatura la ley contra el calentamiento y de transición energética.Sin reducir las emisiones de CO2 en el transporte y la electricidad no se cumplirán las metas
Madrid - 5 JUN 2017 - 12:47 CEST
DÍA MUNDIAL DEL MEDIO AMBIENTE ›
MANUEL PLANELLES
La central de As Pontes (A Coruña) es la térmica de carbón más grande del país. ÓSCAR CORRAL
�