Protocolo de Control Forestal Maderable en el Transporte ...
ARTÍCULO / ARTICLE
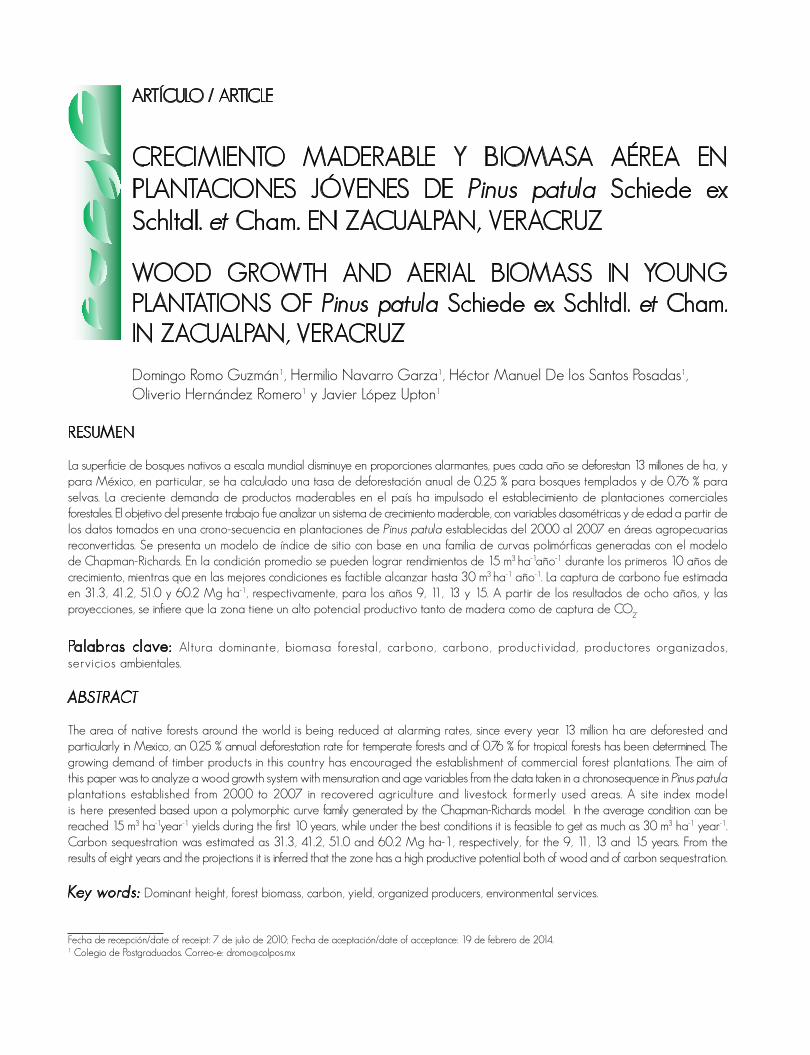
CRECIMIENTO MADERABLE Y BIOMASA AÉREA EN PLANTACIONES JÓVENES DE Pinus patula Schiede ex Schltdl. et Cham. EN ZACUALPAN, VERACRUZ
WOOD GROWTH AND AERIAL BIOMASS IN YOUNG PLANTATIONS OF Pinus patula Schiede ex Schltdl. et Cham. IN ZACUALPAN, VERACRUZ
Domingo Romo Guzmán1, Hermilio Navarro Garza1, Héctor Manuel De los Santos Posadas1, Oliverio Hernández Romero1 y Javier López Upton1
RESUMEN
La superficie de bosques nativos a escala mundial disminuye en proporciones alarmantes, pues cada año se deforestan 13 millones de ha, y para México, en particular, se ha calculado una tasa de deforestación anual de 0.25 % para bosques templados y de 0.76 % para selvas. La creciente demanda de productos maderables en el país ha impulsado el establecimiento de plantaciones comerciales forestales. El objetivo del presente trabajo fue analizar un sistema de crecimiento maderable, con variables dasométricas y de edad a partir de los datos tomados en una crono-secuencia en plantaciones de Pinus patula establecidas del 2000 al 2007 en áreas agropecuarias reconvertidas. Se presenta un modelo de índice de sitio con base en una familia de curvas polimórficas generadas con el modelo de Chapman-Richards. En la condición promedio se pueden lograr rendimientos de 15 m3 ha-1año-1 durante los primeros 10 años de crecimiento, mientras que en las mejores condiciones es factible alcanzar hasta 30 m3 ha-1 año-1. La captura de carbono fue estimada en 31.3, 41.2, 51.0 y 60.2 Mg ha-1, respectivamente, para los años 9, 11, 13 y 15. A partir de los resultados de ocho años, y las proyecciones, se infiere que la zona tiene un alto potencial productivo tanto de madera como de captura de CO
2.
Palabras clave: Altura dominante, biomasa forestal, carbono, carbono, productividad, productores organizados, servicios ambientales.
ABSTRACT
The area of native forests around the world is being reduced at alarming rates, since every year 13 million ha are deforested and particularly in Mexico, an 0.25 % annual deforestation rate for temperate forests and of 0.76 % for tropical forests has been determined. The growing demand of timber products in this country has encouraged the establishment of commercial forest plantations. The aim of this paper was to analyze a wood growth system with mensuration and age variables from the data taken in a chronosequence in Pinus patula plantations established from 2000 to 2007 in recovered agriculture and livestock formerly used areas. A site index model is here presented based upon a polymorphic curve family generated by the Chapman-Richards model. In the average condition can be reached 15 m3 ha-1year-1 yields during the first 10 years, while under the best conditions it is feasible to get as much as 30 m3 ha-1 year-1. Carbon sequestration was estimated as 31.3, 41.2, 51.0 and 60.2 Mg ha-1, respectively, for the 9, 11, 13 and 15 years. From the results of eight years and the projections it is inferred that the zone has a high productive potential both of wood and of carbon sequestration.
Key words: Dominant height, forest biomass, carbon, yield, organized producers, environmental services.
Fecha de recepción/date of receipt: 7 de julio de 2010; Fecha de aceptación/date of acceptance: 19 de febrero de 2014.1 Colegio de Postgraduados. Correo-e: [email protected]
Romo et al., Crecimiento maderable y biomasa aérea...
79
INTRODUCTION
The native forest areas are getting smaller at alarming rates worldwide. Thirteen milIion ha are deforested every year, 4.3 million of which are in South America, which makes it the region with the greatest loss (FAO, 2005). Mas et al. (2002) determined a 0.25 % annual deforestation rate for temperate forests and of 0.76 % for tropical forests as the result of several factors, among which the expansion of the agriculture and livestock border is important, and in a lower dimension, the illegal felling. In addition to this is, there is a growing demand for timber products at an international scale, which increases the pressure upon natural forests (Furones and Leal, 2006). It is estimated that 500 million people, more or less, live in forests and 25 % of the population of the world depend on them for survival (World Bank, 2005). On the face of this problem, forest plantations become relevant as productive systems that, managed in an intensive way and with short turns, make it possible to attain a greater amount of timber of homogeneous quality per surface unit. Therefore, they are an option for productive reconversion, after the traditional land use of livestock, and agriculture are not profitable any more in the short term.
In 1997 The Mexican government created National Program for the Development of Forest Plantations (Prodeplan) the (Programa Nacional para el Desarrollo de Plantaciones Forestales), whose major aim was to support the establishment of 875 000 ha of commercial forest plantations in 25 years, in order to reduce forest product imports, by the creation of optional ways of sustainable development and productive diversification. Among the operational strategies was included the reconversion to forest use of lands that were formerly cleaned for agricultural and livestock purposes, and that could be used for forest plantations (Conafor, 2005).
The creation and consolidation of the Forest Agroproducers of Zacualpan, Veracruz Association (Agroproductores Forestales de Zacualpan, Veracruz) was based on the establishment of forest plantations with Pinus patula Schiede ex Schltdl. et Cham. var. patula and on the support that the National Forest Commission (Conafor) (Comisión Nacional Forestal) gave to plantations and reforestation. The association is made up by 250 members between founders and supporters, who during the 2000-2007 period planted 1 443 ha, which is equivalent to 4.5 % of the total area planted in the state; in addition, they cultivated plants in nurseries, developed plantation systems, pruned some trees and controlled the invasive vegetation. At present, this group promotes new plantations, even though assessments of the timber yield are not made which are useful as the basis to define a scheme of the area that will be planted, as well as to estimate the financial viability of the long-term projects.
The aim of this research study was to describe the characteristics of the place, and to estimate the growth of trees
INTRODUCCIÓN
La superficie de bosques nativos a escala mundial disminuye en proporciones alarmantes. Anualmente, se deforestan 13 millones de ha, de las cuales 4.3 millones corresponden a Sudamérica, lo que la convierte en la región con mayores pérdidas (FAO, 2005). Mas et al. (2002) consignan una tasa de deforestación anual de 0.25 % para bosques templados y de 0.76 % para selvas en México, como consecuencia de múltiples factores entre los que destacan la expansión de la frontera agrícola y ganadera, y en menor grado la tala ilegal. A lo anterior se suma una demanda creciente de productos maderables a nivel internacional, lo que aumenta la presión sobre los bosques naturales (Furones y Leal, 2006). Se estima que 500 millones de personas, aproximadamente, viven en los bosques y 25 % de la población mundial depende de los mismos para su supervivencia (World Bank, 2005). Ante este problema, las plantaciones forestales adquieren relevancia como sistemas productivos que manejados de manera intensiva y con turnos cortos hacen posible obtener una mayor cantidad de madera de calidad homogénea por unidad de superficie. Por ello representan una alternativa de reconversión productiva, una vez que los usos tradicionales de la tierra, ganadería y agricultura han dejado de ser rentables en el corto plazo.
En 1997 el gobierno federal mexicano creó el Programa Nacional para el Desarrollo de Plantaciones Forestales (Prodeplan), cuya finalidad principal fue apoyar el establecimiento de 875 000 ha de plantaciones forestales comerciales en un periodo de 25 años, con el fin de reducir las importaciones, mediante la creación de opciones de desarrollo sustentable y diversificación productiva. Entre sus estrategias operativas se contemplaba la reconversión al uso forestal de terrenos que alguna vez fueron desmontados con fines agropecuarios, y que se pudieran utilizar para el establecimiento de plantaciones forestales (Conafor, 2005).
La creación y consolidación de la Asociación de Agroproductores Forestales de Zacualpan, Veracruz, se sustentó en plantaciones con Pinus patula Schiede ex Schltdl. et Cham. var. patula y en el impulso que la Comisión Nacional Forestal (Conafor) les dio, así como a la reforestación. La asociación cuenta con un total de 250 integrantes entre fundadores y adherentes, quienes durante el periodo 2000-2007 plantaron 1 443 ha, que representa 4.5 % del total plantado en la entidad; además, cultivaron plantas en los viveros, desarrollaron sistemas de plantación, hicieron podas y controlaron la vegetación competidora. A la fecha, esta agrupación continúa promoviendo nuevas plantaciones, aunque no realizan evaluaciones del rendimiento maderable que sirvan de base para definir un esquema de planeación de la superficie por plantar, así como para estimar la viabilidad financiera de los proyectos en el largo plazo.
Rev. Mex. Cien. For. Vol. 5 Núm. 23
80
in early stages and of timber production, as well as the biomass and standing carbon storage of Pinus patula plantations.
MATERIALS AND METHODS
Study area
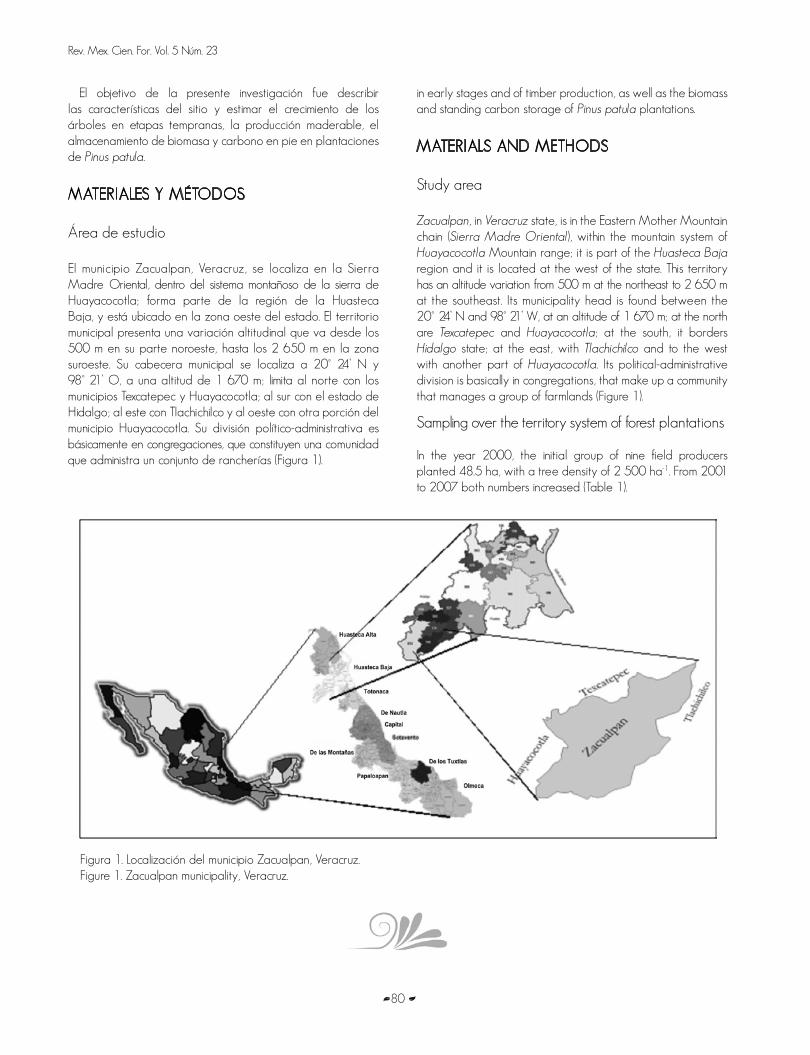
Zacualpan, in Veracruz state, is in the Eastern Mother Mountain chain (Sierra Madre Oriental), within the mountain system of Huayacocotla Mountain range; it is part of the Huasteca Baja region and it is located at the west of the state. This territory has an altitude variation from 500 m at the northeast to 2 650 m at the southeast. Its municipality head is found between the 20° 24’ N and 98° 21’ W, at an altitude of 1 670 m; at the north are Texcatepec and Huayacocotla; at the south, it borders Hidalgo state; at the east, with Tlachichilco and to the west with another part of Huayacocotla. Its political-administrative division is basically in congregations, that make up a community that manages a group of farmlands (Figure 1).
Sampling over the territory system of forest plantations
In the year 2000, the initial group of nine field producers planted 48.5 ha, with a tree density of 2 500 ha-1. From 2001 to 2007 both numbers increased (Table 1).
El objetivo de la presente investigación fue describir las características del sitio y estimar el crecimiento de los árboles en etapas tempranas, la producción maderable, el almacenamiento de biomasa y carbono en pie en plantaciones de Pinus patula.
MATERIALES Y MÉTODOS
Área de estudio
El municipio Zacualpan, Veracruz, se localiza en la Sierra Madre Oriental, dentro del sistema montañoso de la sierra de Huayacocotla; forma parte de la región de la Huasteca Baja, y está ubicado en la zona oeste del estado. El territorio municipal presenta una variación altitudinal que va desde los 500 m en su parte noroeste, hasta los 2 650 m en la zona suroeste. Su cabecera municipal se localiza a 20° 24’ N y 98° 21’ O, a una altitud de 1 670 m; limita al norte con los municipios Texcatepec y Huayacocotla; al sur con el estado de Hidalgo; al este con Tlachichilco y al oeste con otra porción del municipio Huayacocotla. Su división político-administrativa es básicamente en congregaciones, que constituyen una comunidad que administra un conjunto de rancherías (Figura 1).
Figura 1. Localización del municipio Zacualpan, Veracruz.Figure 1. Zacualpan municipality, Veracruz.
Romo et al., Crecimiento maderable y biomasa aérea...
81
Muestreo sobre el s istema territorial de plantaciones forestales
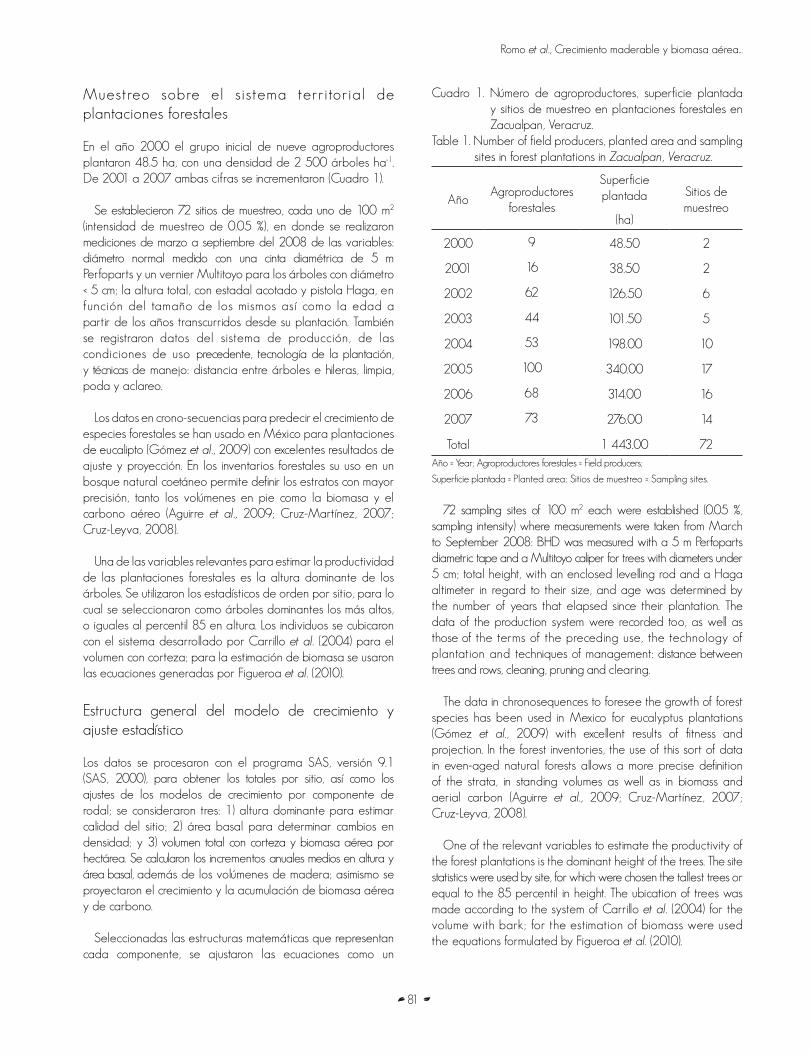
En el año 2000 el grupo inicial de nueve agroproductores plantaron 48.5 ha, con una densidad de 2 500 árboles ha-1. De 2001 a 2007 ambas cifras se incrementaron (Cuadro 1).
Se establecieron 72 sitios de muestreo, cada uno de 100 m2 (intensidad de muestreo de 0.05 %), en donde se realizaron mediciones de marzo a septiembre del 2008 de las variables: diámetro normal medido con una cinta diamétrica de 5 m Perfoparts y un vernier Multitoyo para los árboles con diámetro < 5 cm; la altura total, con estadal acotado y pistola Haga, en función del tamaño de los mismos así como la edad a partir de los años transcurridos desde su plantación. También se registraron datos del sistema de producción, de las condiciones de uso precedente, tecnología de la plantación, y técnicas de manejo: distancia entre árboles e hileras, limpia, poda y aclareo.
Los datos en crono-secuencias para predecir el crecimiento de especies forestales se han usado en México para plantaciones de eucalipto (Gómez et al., 2009) con excelentes resultados de ajuste y proyección. En los inventarios forestales su uso en un bosque natural coetáneo permite definir los estratos con mayor precisión, tanto los volúmenes en pie como la biomasa y el carbono aéreo (Aguirre et al., 2009; Cruz-Martínez, 2007; Cruz-Leyva, 2008).
Una de las variables relevantes para estimar la productividad de las plantaciones forestales es la altura dominante de los árboles. Se utilizaron los estadísticos de orden por sitio, para lo cual se seleccionaron como árboles dominantes los más altos, o iguales al percentil 85 en altura. Los individuos se cubicaron con el sistema desarrollado por Carrillo et al. (2004) para el volumen con corteza; para la estimación de biomasa se usaron las ecuaciones generadas por Figueroa et al. (2010).
Estructura general del modelo de crecimiento y ajuste estadístico
Los datos se procesaron con el programa SAS, versión 9.1 (SAS, 2000), para obtener los totales por sitio, así como los ajustes de los modelos de crecimiento por componente de rodal; se consideraron tres: 1) altura dominante para estimar calidad del sitio; 2) área basal para determinar cambios en densidad; y 3) volumen total con corteza y biomasa aérea por hectárea. Se calcularon los incrementos anuales medios en altura y área basal, además de los volúmenes de madera; asimismo se proyectaron el crecimiento y la acumulación de biomasa aérea y de carbono.
Seleccionadas las estructuras matemáticas que representan cada componente, se ajustaron las ecuaciones como un
Cuadro 1. Número de agroproductores, superficie plantada y sitios de muestreo en plantaciones forestales en Zacualpan, Veracruz.
Table 1. Number of field producers, planted area and sampling sites in forest plantations in Zacualpan, Veracruz.
AñoAgroproductores
forestales
Superficie plantada
(ha)
Sitios de muestreo
2000 9 48.50 2
2001 16 38.50 2
2002 62 126.50 6
2003 44 101.50 5
2004 53 198.00 10
2005 100 340.00 17
2006 68 314.00 16
2007 73 276.00 14
Total 1 443.00 72Año = Year; Agroproductores forestales = Field producers;
Superficie plantada = Planted area; Sitios de muestreo = Sampling sites.
72 sampling sites of 100 m2 each were established (0.05 %, sampling intensity) where measurements were taken from March to September 2008: BHD was measured with a 5 m Perfoparts diametric tape and a Multitoyo caliper for trees with diameters under 5 cm; total height, with an enclosed levelling rod and a Haga altimeter in regard to their size, and age was determined by the number of years that elapsed since their plantation. The data of the production system were recorded too, as well as those of the terms of the preceding use, the technology of plantation and techniques of management: distance between trees and rows, cleaning, pruning and clearing.
The data in chronosequences to foresee the growth of forest species has been used in Mexico for eucalyptus plantations (Gómez et al., 2009) with excellent results of fitness and projection. In the forest inventories, the use of this sort of data in even-aged natural forests allows a more precise definition of the strata, in standing volumes as well as in biomass and aerial carbon (Aguirre et al., 2009; Cruz-Martínez, 2007; Cruz-Leyva, 2008).
One of the relevant variables to estimate the productivity of the forest plantations is the dominant height of the trees. The site statistics were used by site, for which were chosen the tallest trees or equal to the 85 percentil in height. The ubication of trees was made according to the system of Carrillo et al. (2004) for the volume with bark; for the estimation of biomass were used the equations formulated by Figueroa et al. (2010).
Rev. Mex. Cien. For. Vol. 5 Núm. 23
82
sistema de fórmulas aparentemente no correlacionadas, a fin de compensar por variaciones contemporáneas entre las variables medidas y optimizar el uso de los datos (Gómez et al., 2009; Galán et al., 2008).
Modelo de crecimiento en altura dominante
El modelo de crecimiento en la variable altura se ajustó mediante una estructura de valor medio esperado de forma polimórfica, en la que es posible limitar la asíntota del modelo (Diéguez et al., 2006). Bajo el ajuste de mínimos cuadrados, este representa tanto la curva guía como la ecuación de índice de sitio y de proyección de altura. Los datos sugieren que tiene ventajas en las estimaciones de índice de sitio a edades tempranas. El modelo es de la siguiente forma:
Donde: A = Altura dominante promedio del rodal (m) tomada de al menos cinco árboles dominantes por sitio E = Edad en añosβ
0 = Asíntota superior del modelo, limitado a 50 m
Y0 y β
1 = Parámetros a estimar mediante regresión
no lineal 25 = Edad de referencia (años)
Modelo del crecimiento del área basal
Para determinar el crecimiento del área basal en m2 ha-1 (ABHA), se utilizó el modelo:
Donde: A a1= Variable altura dominanteA a2 = Edad
El modelo no es naturalmente asintótico, ya que está ligado a otro que le confiere estas propiedades cuando se proyecta el crecimiento. La naturaleza asintótica se manifiesta cuando se le integran directamente las proyecciones del modelo de altura dominante:
General structure of the growth model and the statistical fit
The data of the assessed variables were analyzed with the SAS 9.1 program (SAS, 2000) to obtain the totals by site, as well as the fit of the growth models by stand. Three growth elements were considered: 1) dominant height to estimate the quality of the site; 2) basal area to estimate density changes; and 3) total volume with bark and aerial biomass by hectare. The mean annual increments in height and basal area were estimated, as well as the timber volumes; in addition, growth, aerial biomass accumulation and carbon were projected too.
Once the mathematical structures for each component were selected, the equations were fit as a formulae system apparently not correlated, in order to compensate for the contemporary variations among the measured variables and to optimize the use of the data (Gómez et al., 2009; Galán et al., 2008).
Growth model in dominant height
The growth model in the height variable was fit by a structure of average value of polymorphic form, where it is possible to limit the asymptote of the model (Diéguez et al., 2006). Under the minimum squares fit, this represents the guide curve and the site index equation and of height projection. Data suggest that they have some advantages in the estimations of site index at early ages. The model is as follows:
Where: A = Average dominant height of the stand (m) taken from five dominant trees of the site, E = Age in yearsβ
0 = Upper asymptote of the model, limited to 50 m
Y0 y β
1 = Parameters to be estimated by non-linear
regression 25 = Reference age (years)
Growth model of the basal area
To determine growth of the basal area in terms of m2 ha-1 (ABHA), the following model was used:
Romo et al., Crecimiento maderable y biomasa aérea...
83
Where: A a1 = Dominant height variableA a2 = Age
The model is not naturally asymptotic since it is linked to another that gives it these properties when growth is projected. The asymptote nature appears when the projections of the model of the dominant height are input directly to it:
In this way, the growth of basal area depends on the growth of the dominant height, and follows a sigmoidal pattern too.
Model of total volume and the aerial biomass by hectare
To estimate growth, the option was a total volume ha-1 model, whose predictive variables were basal area and dominant height in such a way that it is possible to make a fast estimation of the stock and to project growth by means of the variables of site index and density:
Where: VHA= Bark volume in m3 ha-1
γ1 y γ
2 = Parameters to be estimated
The biomass ha-1 was determined by a direct proportion model over the total volume with bark:
Where: B = Total biomass en Mg-1 ha-1
λ0 = Parameter of proportionality between total aerial
biomass and standing trunk volume tobe estimated
Pseudo-data to enclose the growth system
When constructing the growth system of P. patula it was determined that it is possible to make acceptable fittings to the variables; however, when projecting growth upon ages over 10 years old, the result (800 m3 ha-1) is overestimated in the year 11. This results differs from the observations in Huayacocotla, Veracruz and Zacualtipan, Hidalgo. (Carrillo et al., 2004; Cruz, 2007). Nasser et al. (1991) registered stem volumes of 483 m3 ha-1 at 22 years (IMA 21.9 m3 ha-1 year-1) in P. patula; in South Africa, Gillespie (1992) quotes yields estimated between 550 and 600 m3 ha-1 after 25 years in P. patula plantations.
Asi, el crecimiento del área basal depende del crecimiento de la altura dominante, y sigue también un patrón sigmoidal.
Modelo del volumen total y la biomasa por hectárea
Para estimar el crecimiento se optó por un modelo de volumen total ha-1, cuyas variables predictivas fueron el área basal y la altura dominante de modo que sea posible estimar rápidamente las existencias y proyectar el crecimiento mediante las variables de calidad de estación y densidad:
Donde: VHA = Volumen de corteza en m3 ha-1
γ1 y γ
2 = Parámetros por estimar
La biomasa ha-1 se calculó con un modelo de proporción directa sobre el volumen total con corteza:
Donde: B = Biomasa total en Mg-1 ha-1
λ0 = Parámetro de proporcionalidad entre biomasa
aérea total y volumen de fuste en pie por estimar
Pseudo-datos para acotar el sistema de crecimiento Al construir el sistema de crecimiento de P. patula se determinó que es posible realizar ajustes aceptables de las variables; sin embargo, al proyectar el crecimiento en edades superiores a 10 años se sobreestima el resultado (800 m3 ha-1) en el año 11. Este resultado difiere de las observaciones en Huayacocotla, Ver. y Zacualtipan, Hgo. (Carrillo et al., 2004; Cruz, 2007). Nasser et al. (1991) registran rendimientos para volumen de fuste de 483 m3 ha-1 a los 22 años (IMA 21.9 m3 ha-1 año-1) en P. patula; en Sudáfrica, Gillespie (1992) cita rendimientos estimados entre 550 y 600 m3 ha-1 a los 25 años en plantaciones de P. patula.
Dicha situación es por el intervalo de los datos (de 1 a 8 años de edad), como con las condiciones de mortalidad son prácticamente nulas, lo que impide compensar el crecimiento en área basal a edades mayores de 10 años.
Para compensar los ajustes se utilizaron pseudo-datos o datos de acotamiento, que se obtuvieron utilizando las proyecciones propuestas por Santiago (2009) en Zacualtipán, quien se basó en 43 sitios de muestreo permanente de 400 m2 en una cronosecuencia de P. patula de 10 a 25 años y en los resultados de Nasser et al. (1991) y Gillespie (1992). De esta forma es posible situar cuatro puntos teóricos de referencia con árboles de 20 años de edad, con aproximaciones en los componentes
Rev. Mex. Cien. For. Vol. 5 Núm. 23
84
de altura dominante, área basal y volumen con corteza. A esos sitios de referencia se les denomina “pseudo-datos”. Este grupo se incluye en el ajuste a fin de acotar con mayor precisión las proyecciones de rendimiento. El ejercicio pretende reforzar el ajuste y no sustituir los datos observados.
RESULTADOS Y DISCUSIÓN
Ajuste de los datos de las variables para el sistema de crecimiento
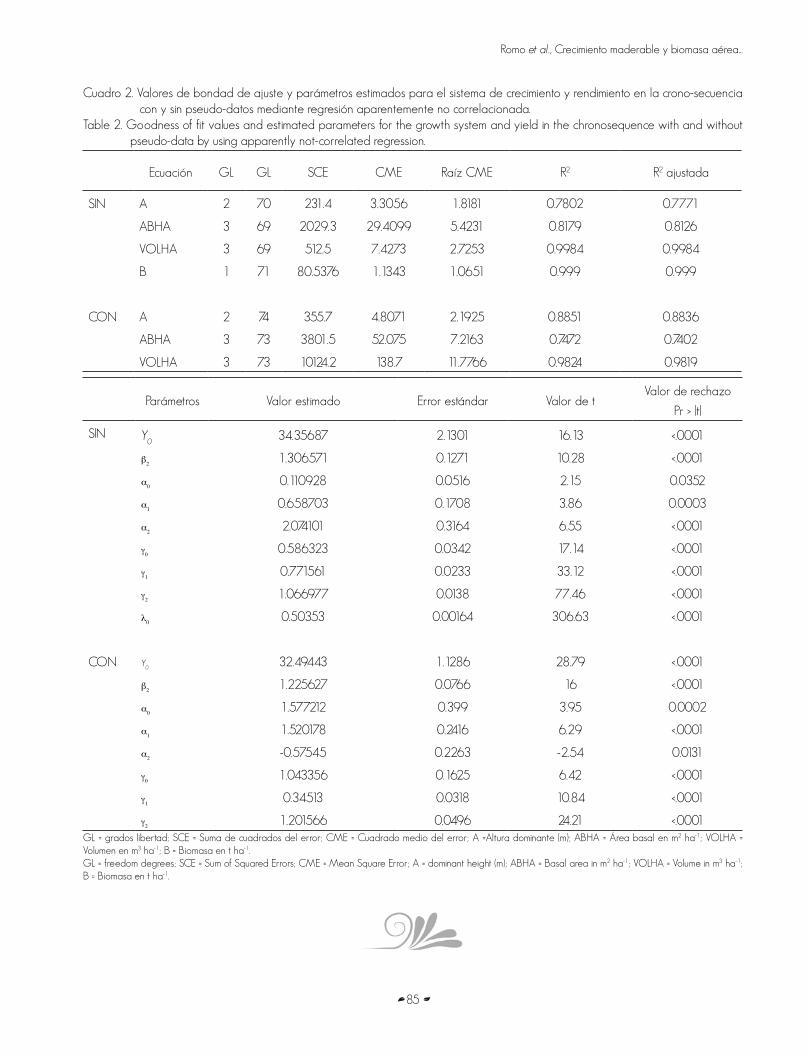
En el Cuadro 2 se presentan los resultados de ajuste del sistema de crecimiento propuesto con pseudo-datos, y sin ellos bajo el enfoque de regresión aparentemente no correlacionada. La proporción de biomasa total-volumen de fuste establecido por el parámetro λ0 es de 503 kg-1 m-3, menor al consignado por Cruz-Martínez (2007), cuya fracción es de 600 kg-1 m-3. Diferencia que se atribuye, en parte, a que los rodales en Zacualpan provienen de plantaciones y los resultados presentados por dicho autor se obtuvieron de rodales naturales, en donde el manejo de la densidad es más difícil, y gran parte de su biomasa se concentra en las ramas. En rodales con alta densidad no es raro, ya que la cantidad de biomasa (ramas y hojas) es mucho menor por efecto de la competencia. Otro factor relevante es la poda como práctica silvícola utilizada en la región, la cual disminuye la cantidad de biomasa en la copa y mejora el ahusamiento de los árboles.
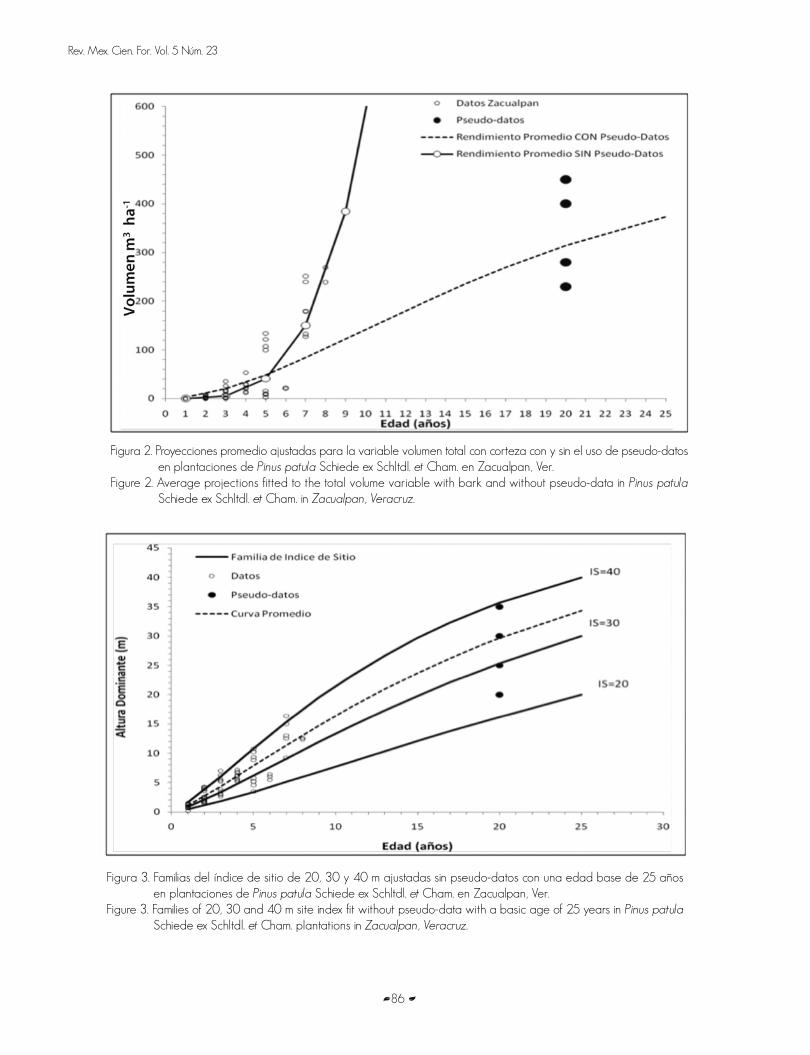
En la Figura 2 se comparan las proyecciones obtenidas con pseudo-datos y sin ellos.
Si bien la adecuación no acotada produce un ajuste favorable para la variable volumen total, dentro del intervalo de los datos es poco probable que mantenga la tendencia cuasi-exponencial observada después del año 10.
Con base en la proyección específica por índice de sitio (Figura 3) y el rendimiento esperado (Cuadro 3, Figura 4) con pseudo-datos, se evidencia que la inclusión de estos permite obtener proyecciones que tienden a un crecimiento asintótico.
Si bien este ajuste puede considerarse “artificial” por la inclusión de los pseudo-datos, el valor estimado 158.3 t ha-1 de biomasa a los 20 años (Cuadro 4) es similar a lo registrado en rodales naturales puros de 21 años (de 166 Mg ha-1)-de P. patula en Zacualtipan, Hgo. (Figueroa, 2010).
De otra forma, y con los datos sin acotar, la productividad estimada a los 20 años hubiera sido superior a 3 000 Mg ha-1, la cual es una estimación falsa.
This situation is due to the range of the data (from 1 to 8 years old), as to the mortality conditions that are almost inexistent, which prevents from balancing growth in the basal area at ages over 10 years old.
To compensate the fittings, pseudo-data or enclosure data were used, that came from the projections proposed by Santiago (2009) in Zacualtipán, who started from 43 permanent sampling sites of 400 m2 in a P. patula chronosequence of 10 to 25 years, and in the results of Nasser et al. (1991) and Gillespie (1992). In this way, it is possible to locate four theoretical reference points with 20 year old trees, with approaches in the dominant height, basal area and volume with bark. This reference points are known as “pseudo-data” and are included in the fit in order to enclose more precisely the yield projections. The exercise pretends to reinforce the fitting and not to substitute the observed data.
RESULTS AND DISCUSSION
Data fitting of the variables for the growth system
In Table 2 are shown the results of the growth system proposed with pseudo-data, and with them, under the not-correlated regression focus. The relation total biomass-stem volume defined by the λ0 parameter is 503 kg m-3, lower than that of Cruz-Martínez (2007), whose fraction is 600 kg m-3. This difference is partly attributed to the fact that the stands in Zacualpan come from plantations and the results of this author came from natural stands, where density management is more difficult and most of its biomass is concentrated in the branches. In stands with high density this is not unusual since the biomass amount (branches and leaves) is much smaller as a consequence of competition. Another important factor is pruning as a forestry practice used in the region, which lowers the amount of biomass in the canopy and improves the thinning of trees.
In Figure 2 are compared the projections obtained with and without pseudo-data.
If the non- enclosed adequacy produces a favorable fit for the total volume variable, in a data range it is unlikely that it keeps is almost-exponential trend that is observed after the 10th year.
Based on the specific projection of the site index (Figure 3) and the expected yield (Table 3, Figure 4) with pseudo-data. It is observed that by including them, projections that tend to an asymptotical growth can be obtained.
Even if this fitting can be considered artificial by the incorporation of pseudo-data, the estimated 158.3 t ha-1 biomass of 20 years (Table 4) is similar to what has been observed in pure natural stands of 21 years (166 Mg ha-1) of P. patula in Zacualtipan, Hidalgo. (Figueroa, 2010).
Romo et al., Crecimiento maderable y biomasa aérea...
85
Cuadro 2. Valores de bondad de ajuste y parámetros estimados para el sistema de crecimiento y rendimiento en la crono-secuencia con y sin pseudo-datos mediante regresión aparentemente no correlacionada.
Table 2. Goodness of fit values and estimated parameters for the growth system and yield in the chronosequence with and without pseudo-data by using apparently not-correlated regression.
Ecuación GL GL SCE CME Raíz CME R2 R2 ajustada
SIN A 2 70 231.4 3.3056 1.8181 0.7802 0.7771
ABHA 3 69 2029.3 29.4099 5.4231 0.8179 0.8126
VOLHA 3 69 512.5 7.4273 2.7253 0.9984 0.9984
B 1 71 80.5376 1.1343 1.0651 0.999 0.999
CON A 2 74 355.7 4.8071 2.1925 0.8851 0.8836
ABHA 3 73 3801.5 52.075 7.2163 0.7472 0.7402
VOLHA 3 73 10124.2 138.7 11.7766 0.9824 0.9819
Parámetros Valor estimado Error estándar Valor de tValor de rechazo
Pr > |t|
SIN Y0
34.35687 2.1301 16.13 <.0001
b2
1.306571 0.1271 10.28 <.0001
a0
0.110928 0.0516 2.15 0.0352
a1
0.658703 0.1708 3.86 0.0003
a2
2.074101 0.3164 6.55 <.0001
γ0
0.586323 0.0342 17.14 <.0001
γ1
0.771561 0.0233 33.12 <.0001
γ2
1.066977 0.0138 77.46 <.0001
λ0
0.50353 0.00164 306.63 <.0001
CON Y0
32.49443 1.1286 28.79 <.0001
b2
1.225627 0.0766 16 <.0001
a0
1.577212 0.399 3.95 0.0002
a1
1.520178 0.2416 6.29 <.0001
a2
-0.57545 0.2263 -2.54 0.0131
γ0
1.043356 0.1625 6.42 <.0001
γ1
0.34513 0.0318 10.84 <.0001
γ2
1.201566 0.0496 24.21 <.0001GL = grados libertad; SCE = Suma de cuadrados del error; CME = Cuadrado medio del error; A =Altura dominante (m); ABHA = Área basal en m2 ha-1; VOLHA = Volumen en m3 ha-1; B = Biomasa en t ha-1.GL = freedom degrees; SCE = Sum of Squared Errors; CME = Mean Square Error; A = dominant height (m); ABHA = Basal area in m2 ha-1; VOLHA = Volume in m3 ha-1; B = Biomasa en t ha-1.
Rev. Mex. Cien. For. Vol. 5 Núm. 23
86
Figura 3. Familias del índice de sitio de 20, 30 y 40 m ajustadas sin pseudo-datos con una edad base de 25 años en plantaciones de Pinus patula Schiede ex Schltdl. et Cham. en Zacualpan, Ver.
Figure 3. Families of 20, 30 and 40 m site index fit without pseudo-data with a basic age of 25 years in Pinus patula Schiede ex Schltdl. et Cham. plantations in Zacualpan, Veracruz.
Figura 2. Proyecciones promedio ajustadas para la variable volumen total con corteza con y sin el uso de pseudo-datos en plantaciones de Pinus patula Schiede ex Schltdl. et Cham. en Zacualpan, Ver.
Figure 2. Average projections fitted to the total volume variable with bark and without pseudo-data in Pinus patula Schiede ex Schltdl. et Cham. in Zacualpan, Veracruz.
Romo et al., Crecimiento maderable y biomasa aérea...
87
Si se usa la concentración promedio de carbono sugerida por Figueroa (2010) de 50.77 % por unidad de biomasa, es posible estimar la cantidad de carbono en pie (Cuadro 4). Resultados similares se han obtenido para rodales naturales de Pinus patula en Zacualtipan, Hgo. (Aguirre et al., 2009; Cruz-Leyva, 2008, Figueroa et al., 2010). Durante la construcción de modelos siempre es caso, los pseudo-datos tuvieron doble finalidad, por un lado, acotar el modelo, y por otro hacerlo útil como herramienta de manejo.
In this way and with the data without enclosure, the estimated productivity at 20 years would have been over 3 000 Mg ha-1, which is a false estimation.
If the average carbon concentration suggested by Figueroa (2010) of 50.77 % by biomass unit is used, it is possible to estimate the amount of standing carbon (Table 4). Similar results have been obtained for Pinus patula natural stands in
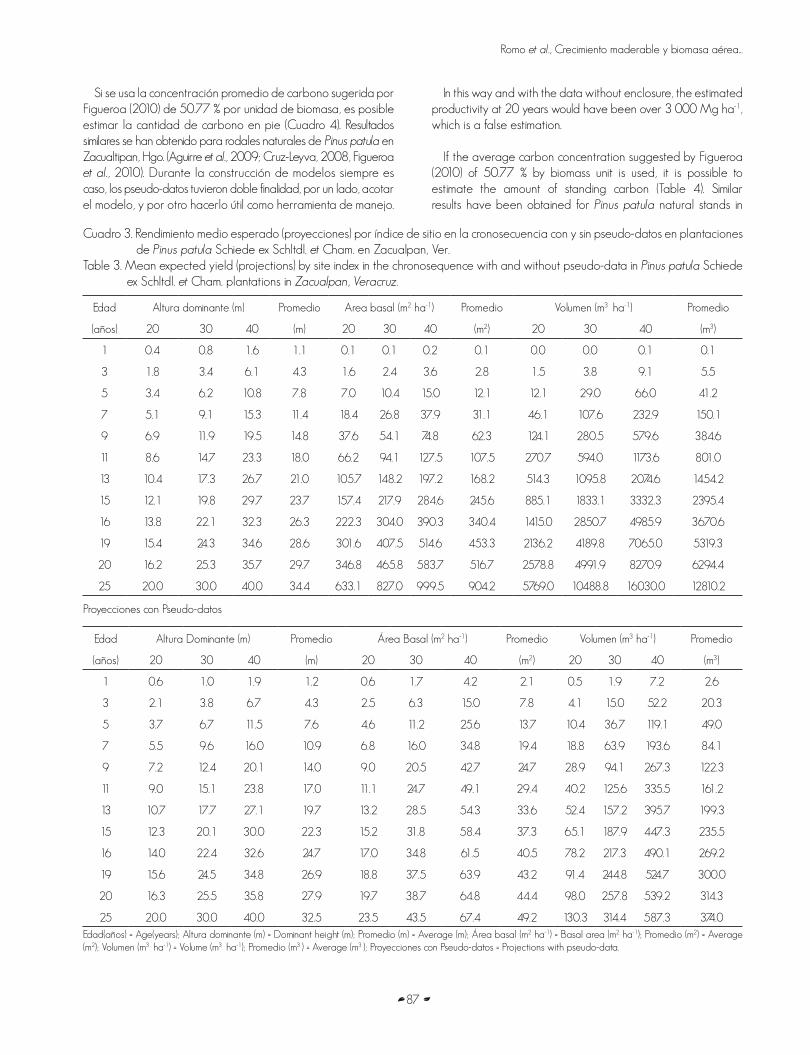
Cuadro 3. Rendimiento medio esperado (proyecciones) por índice de sitio en la cronosecuencia con y sin pseudo-datos en plantaciones de Pinus patula Schiede ex Schltdl. et Cham. en Zacualpan, Ver.
Table 3. Mean expected yield (projections) by site index in the chronosequence with and without pseudo-data in Pinus patula Schiede ex Schltdl. et Cham. plantations in Zacualpan, Veracruz.
Edad Altura dominante (m) Promedio Area basal (m2 ha-1) Promedio Volumen (m3 ha-1) Promedio
(años) 20 30 40 (m) 20 30 40 (m2) 20 30 40 (m3)
1 0.4 0.8 1.6 1.1 0.1 0.1 0.2 0.1 0.0 0.0 0.1 0.1
3 1.8 3.4 6.1 4.3 1.6 2.4 3.6 2.8 1.5 3.8 9.1 5.5
5 3.4 6.2 10.8 7.8 7.0 10.4 15.0 12.1 12.1 29.0 66.0 41.2
7 5.1 9.1 15.3 11.4 18.4 26.8 37.9 31.1 46.1 107.6 232.9 150.1
9 6.9 11.9 19.5 14.8 37.6 54.1 74.8 62.3 124.1 280.5 579.6 384.6
11 8.6 14.7 23.3 18.0 66.2 94.1 127.5 107.5 270.7 594.0 1173.6 801.0
13 10.4 17.3 26.7 21.0 105.7 148.2 197.2 168.2 514.3 1095.8 2074.6 1454.2
15 12.1 19.8 29.7 23.7 157.4 217.9 284.6 245.6 885.1 1833.1 3332.3 2395.4
16 13.8 22.1 32.3 26.3 222.3 304.0 390.3 340.4 1415.0 2850.7 4985.9 3670.6
19 15.4 24.3 34.6 28.6 301.6 407.5 514.6 453.3 2136.2 4189.8 7065.0 5319.3
20 16.2 25.3 35.7 29.7 346.8 465.8 583.7 516.7 2578.8 4991.9 8270.9 6294.4
25 20.0 30.0 40.0 34.4 633.1 827.0 999.5 904.2 5769.0 10488.8 16030.0 12810.2
Proyecciones con Pseudo-datos
Edad Altura Dominante (m) Promedio Área Basal (m2 ha-1) Promedio Volumen (m3 ha-1) Promedio
(años) 20 30 40 (m) 20 30 40 (m2) 20 30 40 (m3)
1 0.6 1.0 1.9 1.2 0.6 1.7 4.2 2.1 0.5 1.9 7.2 2.6
3 2.1 3.8 6.7 4.3 2.5 6.3 15.0 7.8 4.1 15.0 52.2 20.3
5 3.7 6.7 11.5 7.6 4.6 11.2 25.6 13.7 10.4 36.7 119.1 49.0
7 5.5 9.6 16.0 10.9 6.8 16.0 34.8 19.4 18.8 63.9 193.6 84.1
9 7.2 12.4 20.1 14.0 9.0 20.5 42.7 24.7 28.9 94.1 267.3 122.3
11 9.0 15.1 23.8 17.0 11.1 24.7 49.1 29.4 40.2 125.6 335.5 161.2
13 10.7 17.7 27.1 19.7 13.2 28.5 54.3 33.6 52.4 157.2 395.7 199.3
15 12.3 20.1 30.0 22.3 15.2 31.8 58.4 37.3 65.1 187.9 447.3 235.5
16 14.0 22.4 32.6 24.7 17.0 34.8 61.5 40.5 78.2 217.3 490.1 269.2
19 15.6 24.5 34.8 26.9 18.8 37.5 63.9 43.2 91.4 244.8 524.7 300.0
20 16.3 25.5 35.8 27.9 19.7 38.7 64.8 44.4 98.0 257.8 539.2 314.3
25 20.0 30.0 40.0 32.5 23.5 43.5 67.4 49.2 130.3 314.4 587.3 374.0Edad(años) = Age(years); Altura dominante (m) = Dominant height (m); Promedio (m) = Average (m); Área basal (m2 ha-1) = Basal area (m2 ha-1); Promedio (m2) = Average (m2); Volumen (m3 ha-1) = Volume (m3 ha-1); Promedio (m3 ) = Average (m3 ); Proyecciones con Pseudo-datos = Projections with pseudo-data.
Rev. Mex. Cien. For. Vol. 5 Núm. 23
88
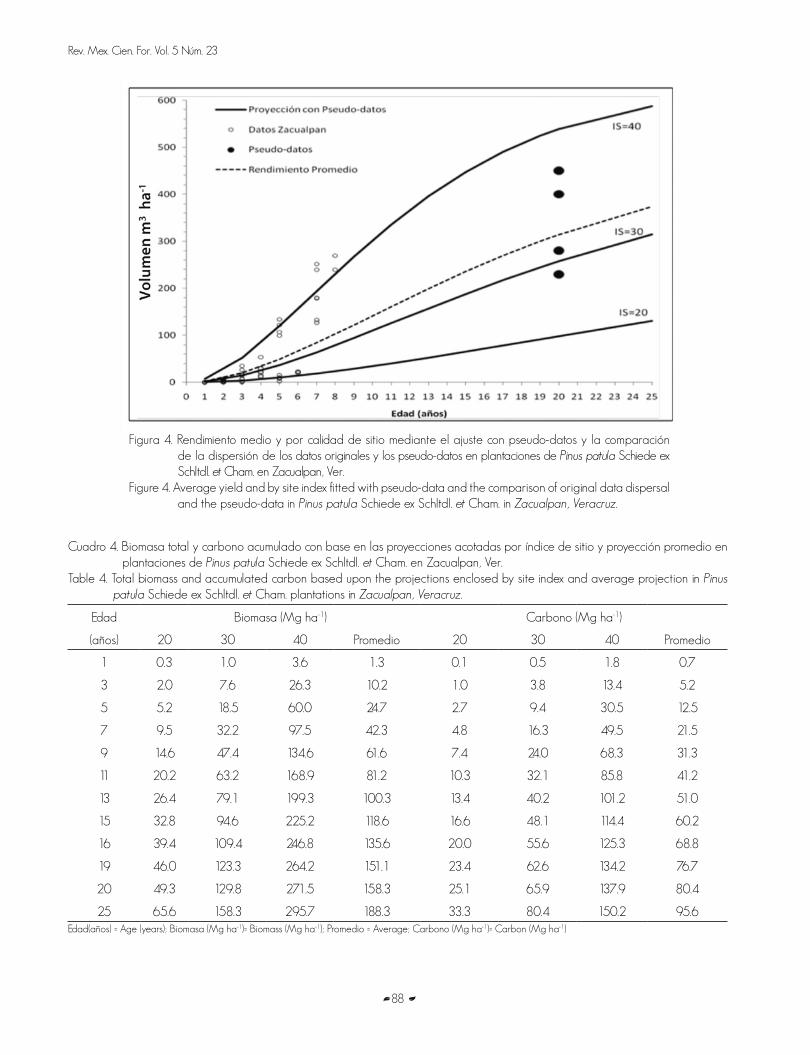
Figura 4. Rendimiento medio y por calidad de sitio mediante el ajuste con pseudo-datos y la comparación de la dispersión de los datos originales y los pseudo-datos en plantaciones de Pinus patula Schiede ex Schltdl. et Cham. en Zacualpan, Ver.
Figure 4. Average yield and by site index fitted with pseudo-data and the comparison of original data dispersal and the pseudo-data in Pinus patula Schiede ex Schltdl. et Cham. in Zacualpan, Veracruz.
Cuadro 4. Biomasa total y carbono acumulado con base en las proyecciones acotadas por índice de sitio y proyección promedio en plantaciones de Pinus patula Schiede ex Schltdl. et Cham. en Zacualpan, Ver.
Table 4. Total biomass and accumulated carbon based upon the projections enclosed by site index and average projection in Pinus patula Schiede ex Schltdl. et Cham. plantations in Zacualpan, Veracruz.
Edad Biomasa (Mg ha-1) Carbono (Mg ha-1)
(años) 20 30 40 Promedio 20 30 40 Promedio
1 0.3 1.0 3.6 1.3 0.1 0.5 1.8 0.7
3 2.0 7.6 26.3 10.2 1.0 3.8 13.4 5.2
5 5.2 18.5 60.0 24.7 2.7 9.4 30.5 12.5
7 9.5 32.2 97.5 42.3 4.8 16.3 49.5 21.5
9 14.6 47.4 134.6 61.6 7.4 24.0 68.3 31.3
11 20.2 63.2 168.9 81.2 10.3 32.1 85.8 41.2
13 26.4 79.1 199.3 100.3 13.4 40.2 101.2 51.0
15 32.8 94.6 225.2 118.6 16.6 48.1 114.4 60.2
16 39.4 109.4 246.8 135.6 20.0 55.6 125.3 68.8
19 46.0 123.3 264.2 151.1 23.4 62.6 134.2 76.7
20 49.3 129.8 271.5 158.3 25.1 65.9 137.9 80.4
25 65.6 158.3 295.7 188.3 33.3 80.4 150.2 95.6Edad(años) = Age (years); Biomasa (Mg ha-1)= Biomass (Mg ha-1); Promedio = Average; Carbono (Mg ha-1)= Carbon (Mg ha-1)
Romo et al., Crecimiento maderable y biomasa aérea...
89
El sistema de crecimiento presentado es una versión preliminar de lo que deberá ser un modelo que incluya el efecto de las prácticas silvícolas aplicadas en la región: limpias, podas y aclareos. El sistema permite realizar inferencias sobre el potencial de la zona para el establecimiento de plantaciones de Pinus patula, si se considera que el incremento promedio para volumen total con corteza alcanza 15 m3 ha-1 año-1; mientras que para los mejores sitios el valor es de 30 m3 ha-1 año-1.
Los pseudo-datos se han utilizado en estudios relacionados con la construcción de modelos de índice de sitio (Cieszewski, 2003; Cieszewski et al., 2007) y es una forma alternativa para probar modelos teóricos y nuevas ecuaciones.
Para lograr estimaciones precisas a nivel local es necesario contar con un sistema de crecimiento, cuyos datos procedan de sitios de remediciones, los cuales son caros y de difícil mantenimiento. Sirva como ejemplo que, a partir de los datos de la crono-secuencia es posible obtener el inventario de las 1 443 ha. En este caso, bajo inventario estratificado por edad (Shiver y Borders, 1996) se estiman 38 169 m3 de madera en pie, con una precisión de 95 % de confiabilidad estadística. Dicha información se puede actualizar mediante un inventario con mayor intensidad, con remediaciones o con el uso de un sistema de crecimiento. Las dos últimas opciones son más económicas y rápidas, a pesar de que se requiere personal capacitado en el manejo de datos
La superficie de plantaciones de Pinus patula en Zacualpan aumenta anualmente; por lo tanto es urgente disponer de herramientas para su manejo que favorezcan la incorporación de prácticas silvícolas sencillas de evaluar y de fácil seguimiento para los técnicos.
Los resultados del ajuste del sistema de crecimiento con pseudo-datos contribuyen en forma empírica, apoyándose con parámetros de referencia para la definición del modelo de crecimiento más pertinente.
La proyección de la producción de biomasa a 25 años, con 188.3 t ha-1, es aproximada a la registrada en plantaciones vecinas (166.6 t ha-1) (Cuadro 4).
La estimación del almacenaje de carbono a 25 años fue de 95.6 t ha-1; esta información es útil para valorar la importancia ambiental de esta función, así mismo un elemento concreto para procurar financiamiento por servicios ambientales.
El uso de los pseudo-datos para la construcción del modelo tuvieron una doble finalidad, por un lado acotarlo, y por otro hacerlo útil. Los resultados de crecimiento son considerados aceptables y base para un buen potencial. El trabajo de investigación es pionero en la región para la generación de información de referencia para proyectos similares en marcha y futuros.
Zacualtipan, Hidalgo. (Aguirre et al., 2009; Cruz-Leyva, 2008, Figueroa et al., 2010). During the construction of models there is always a concern about the use or the bad use of their results. In this case, pseudo-data had double ending, since, on the one hand, to enclose the model, and on the other, to make it useful as a management tool.
The growth system shown here is a previous version of what must be a model that allows the inclusion of the effect of the forestry practices applied in the region: cleaning, pruning and clearing. This system favors to make inferences about the potential of the zone to establish Pinus patula plantations, if it is considered that the average increment for total volume with bark gets 15 m3 ha-1 year-1, while for the best value sites, it is 30 m3 ha-1 year-1.
Pseudo-data have been used in studies related to site index model construction (Cieszewski, 2003; Cieszewski et al., 2007) and it is an alternative way to test theoretical models and new equations.
To accomplish precise estimations at a local level, it is necessary to count with a growth system, whose information comes from re-measurement sites; however, they are expensive and of difficult management. For example, from the chronosequence data, it is possible to obtain the inventory of the 1 443 ha. In this case, under a stratified inventory by age (Shiver and Borders, 1996) 38 169 m3 of standing timber are estimated, with a 95 % precision of statistical reliability. Such information can be updated by an inventory with greater intensity, with re-measurements or with the use of a growth system. The two last options are more economical and fast, in spite of needing trained personnel in data analysis.
The Pinus patula plantation area in Zacualpan increases every year, which make it urgent to count with management tools that allow to include forestry practices easy to assess and of easy monitoring by the technicians.
Results of fitting the growth system with pseudo-data help, in an empirical way, supporting it on reference parameters, to define the most convenient growth model.
The projection of biomass production after 25 years, with 188.3 t ha-1 is near that reported for neighboring plantations
(166.6 t ha-1) (Table 4).
The estimation of carbon store after 25 years was 95.6 t ha-1; this information is useful to evaluate the environmental importance of this function, as well as a specific element to obtain financial resources for environmental services.
The use of pseudo-data for the construction of the model had a double purpose, to enclose it and to make it useful.
Rev. Mex. Cien. For. Vol. 5 Núm. 23
90
CONCLUSIONES
Los resultados obtenidos al ajustar la crono-secuencia sugieren que la región de Zacualpan tiene un alto potencial de producción de madera de pino a partir de plantaciones forestales comerciales (PFC). Si se toma en cuenta que entre los planes de la CIFZA está una superficie meta de 8 000 ha de PFC para 2020, esta superficie es capaz de producir de acuerdo con el presente estudio un total de 120 000 m3 de madera en rollo al año. La capacidad instalada actual de la industria regional absorbe entre 90 y 150 m3 al día.
Finalmente, se busca que las herramientas generadas sean utilizadas por tomadores de decisiones para establecer las mejores estrategias de política y empresariales en la región. De otra forma se corre el riesgo de que la inversión de recursos y tiempo quede subutilizada con las consecuentes pérdidas que ello implica.
AGRADECIMIENTOS
A la Asociación de Agroproductores Forestales de Zacualpan, S. P .R. de R. L. y de la Cadena Integradora Forestal de Zacualpan, S. A de R. L., quienes proporcionaron apoyos para la elaboración del trabajo de investigación. A los propietarios de las plantaciones por el apoyo brindado para realizar la presente investigación.
REFERENCIAS
Aguirre S., C. A., J. R. Valdez L., G. Ángeles P., H. M. De los Santos P., R. Haapanen y A. I. Aguirre S. 2009. Mapeo de carbono arbóreo aéreo en bosques manejados de Pinus patula en Hidalgo, México. Agrociencia 43: 209-220.
Carrillo A., F., M. Acosta M., G. Tenorio G. y F. Becerra L. 2004. Tabla de volumen para Pinus patula Schl. et Cham. en el estado de Hidalgo. INIFAP, Campo Experimental Valle de México. Folleto Técnico No. 2. Texcoco, Edo. de Méx. México.16 p.
Cieszewski, C. J. 2003. Developing a well-behaved dynamic site equation using a modified Hossfeld IV function Y3 = (axm)/(c + xm–1), a simplified Mixed-model and scant subalpine Fir data. For. Sci. 49 (4): 539-554.
Cieszewski, C. J., M Strub and M. Zasada. 2007. New dynamic site equation that fits best the Schwappach data for Scotts pine (Pinus sylvestris L.) in Central Europe. For. Ecol. and Manage. 243 (1): 83-93.
Comisión Nacional Forestal (Conafor). 2005. Plan Estratégico Forestal para México 2025. Guadalajara, Jal. México pp. 35-38.
Cruz L., I. A. 2008. Modelado espacial de los recursos forestales en el ejido de Atopixco, estado de Hidalgo. Tesis de Maestría en Ciencias. Colegio de Postgraduados. Montecillo, Edo. de Méx. México. 116 p.
Cruz M., Z. 2007. Sistema de ecuaciones para estimación y partición de biomasa aérea en Atopixco, Zacualtipan, Hidalgo, México. Tesis de Maestría en Ciencias. Universidad Autónoma Chapingo. Texcoco, Edo. de Méx. México. 39 p.
Diéguez A., U., H. E. Burkhart and R. L. Amateis. 2006. Dynamic site model for loblolly pine (Pinus taeda L.) plantations in the United States. For. Sci. 52 (3): 262-272.
Food and Agriculture Organization (FAO). 2005. Evaluación de los recursos forestales mundiales: 15 resultados clave. Organización de las Naciones Unidas para la Agricultura y la Alimentación. Roma, Italia. 160 p.
Figueroa N., C. M., A. Velázquez-Martínez, G. Ángeles-Pérez, y H. M. de los
Growth results can be considered acceptable and a basis for a good potential. This research study is a pioneer in the region for the generation of reference information for similar running and future projects.
CONCLUSIONS
The results after fitting the chronosequence suggest that Zacualpan region has a high pine timber production potential from commercial forest plantations (PFC, for its acronym in Spanish). If it is taken into account that in the plans of CIFZA is a goal area of 8 000 ha of PFC for 2020, it can produce, according to our study, a total of 120 000 m3 of annual roundwood. The installed capacity of the regional industry absorbs between 90 and 150 m3 a day.
Finally, what is sought is that those generated tools are used by decision makers to establish the best policy and business strategies in the region. Otherwise, there is a risk that resource and time investment becomes under-used with the resulting loss that it implies.
ACKNOWLEDGEMENTS
To the Asociación de Agroproductores Forestales de Zacualpan, S. P .R. de R. L. and to the Cadena Integradora Forestal de Zacualpan, S. A de R. L., as to the owners of the plantations who provided support for making this research study.
End of the English version
Romo et al., Crecimiento maderable y biomasa aérea...
91
Santos-Posadas. 2010. Estimación de la biomasa en un bosque bajo manejo de Pinus patula Schl. et Cham. en Zacualtipán, Hidalgo. Revista Mexicana de Ciencias Forestales 1 (1): 105-112.
Furones F., L. y L. Leal R. 2006. Bosques y sociedad en países en desarrollo. Centro Tecnológico Forestal de Catalunya, Solsona. Cataluña, España. 150 p.
Galán L., R., H. M. De los Santos P. y J. I. Valdez H. 2008. Crecimiento y rendimiento maderable de Cedrela odorata L. y Tabebuia donell-smithii Rose en Santiago Chacalapa, Pochutla, Oaxaca. Madera y Bosques 14(2): 65-82.
Gillespie, A. J. R. 1992. Pinus patula Schiede and Deppe. Patula pine. Pinaceae. Pine family. USDA. SO-ITF-SM-54. Forest Service, Southern Forest Experiment Station, Institute of Tropical Forestry. New Orleans, LA. 5 p.
Gómez T., J., H. M. De los Santos P., A. M. Fierros G. y J. R. Valdez L. 2009. Modelos de crecimiento en altura dominante para Eucalyptus grandis y E. urophylla en María Lombardo, Oaxaca, México. Fitotecnia Mexicana 31(2): 161-169.
Mas, J. F., A. Velázquez, J. L. Palacio, G. Bocco, A. Peralta and J. Prado. 2002. Assessing forest resources in Mexico. Wall-to-wall land use/cover mapping. Photogramm. Eng. Rem. S. 68(10): 966-968.
Nasser, S. M., S. A. O. Chamshama and S. Iddi. 1991. Survival, growth, yield and wood density of three Pinus patula provenances at Lushoto, Tanzania. J. Trop. For. Sci. 5 (3): 353-360.
Santiago G., W. 2009. Sistema de crecimiento y rendimiento para Pinus patula de Zacualtipán, Hidalgo, México. Tesis de Maestría en Ciencias. Programa Forestal. Colegio de Postgraduados. Montecillos, Edo. de Méx. México. 98 p.
Shiver, B. D and B. E. Borders. 1996. Sampling techniques for forest resource inventories. John Wiley & Sons. New York, NY. USA. 356 p.
Statistics Analysis System (SAS). 2000. Version 9.1 software. SAS Institute Inc., Cary, NC. USA. s/p.
World Bank (ed.). 2005 The World’s Forests. Finance and Development. Washington, DC. USA. p. 31.