Climate Change and Water Access Vulnerability in the Human … · Vol. 4 Núm. 1 enero-abril 2013...
28
14 REALIDAD, DATOS Y ESPACIO REVISTA INTERNACIONAL DE ESTADÍSTICA Y GEOGRAFÍA El acceso al agua en los asentamientos humanos de Méxi- co está siendo impactado por el cambio climático, lo cual pone en riesgo su desarrollo humano y crecimiento eco- nómico. Poco se ha estudiado este fenómeno a escala urbano-regional. Desde la aproximación vulnerabilidad al cambio climático se propone un índice compuesto para estudiar este fenómeno en la Zona Metropolitana de Mérida, Yucatán, México. Basado en fuentes secunda- rias generadas por confiables instituciones mexicanas, el resultante índice de vulnerabilidad de acceso al agua (WAVI, por sus siglas en inglés) permite la identificación y priorización de esta vulnerabilidad y los factores que contribuyen a ésta en los asentamientos humanos de la zona estudiada. Los resultados de la aplicación del WAVI muestran cómo este tipo de vulnerabilidad varía dentro de la zona de estudio y sugieren que este fenómeno se intensificará en relación con factores sociales. Palabras clave: Yucatán, cambio climático, vulnerabili- dad, asentamientos humanos e índices compuestos. Climate Change and Water Access Vulnerability in the Human Settlement Systems of Mexico: The Merida Metropolitan Area, Yucatan Mauricio Domínguez Aguilar, Federico Dickinson Bannack y Ana García de Fuentes Climate change affects water access in the human set- tlements of México, thus threatening their human de- velopment and economic growth. There has not been paid enough attention to this phenomenon at the ur- ban-regional scale. The vulnerability approach to cli- mate change is used to propose a compound index for studying this phenomenon in the Merida Metropolitan Area, Yucatan state, Mexico. Based in secondary-sources data generated by trustworthy Mexican institutions, the resulting Water Access Vulnerability Index (WAVI) allows identification and prioritization of this vulnerability and the factors contributing to it in the human settlements of the study area. WAVI results show that this kind of vulnerability vary within the study area and suggest that this phenomenon will intensify in relation to social factors. Keywords: Climate change vulnerability, Water, Hu- man settlements, Secondary-sources data, Compound indexes.
Transcript of Climate Change and Water Access Vulnerability in the Human … · Vol. 4 Núm. 1 enero-abril 2013...

14 REALIDAD, DATOS Y ESPACIO REVISTA INTERNACIONAL DE ESTADÍSTICA Y GEOGRAFÍA
El acceso al agua en los asentamientos humanos de Méxi-co está siendo impactado por el cambio climático, lo cual pone en riesgo su desarrollo humano y crecimiento eco-nómico. Poco se ha estudiado este fenómeno a escala urbano-regional. Desde la aproximación vulnerabilidad al cambio climático se propone un índice compuesto para estudiar este fenómeno en la Zona Metropolitana de Mérida, Yucatán, México. Basado en fuentes secunda-rias generadas por confiables instituciones mexicanas, el resultante índice de vulnerabilidad de acceso al agua (WAVI, por sus siglas en inglés) permite la identificación y priorización de esta vulnerabilidad y los factores que contribuyen a ésta en los asentamientos humanos de la zona estudiada. Los resultados de la aplicación del WAVI muestran cómo este tipo de vulnerabilidad varía dentro de la zona de estudio y sugieren que este fenómeno se intensificará en relación con factores sociales.
Palabras clave: Yucatán, cambio climático, vulnerabili-dad, asentamientos humanos e índices compuestos.
Climate Change and Water Access Vulnerability in the
Human Settlement Systems of Mexico:
The Merida Metropolitan
Area, YucatanMauricio Domínguez Aguilar, Federico Dickinson Bannacky Ana García de Fuentes
Climate change affects water access in the human set-tlements of México, thus threatening their human de-velopment and economic growth. There has not been paid enough attention to this phenomenon at the ur-ban-regional scale. The vulnerability approach to cli-mate change is used to propose a compound index for studying this phenomenon in the Merida Metropolitan Area, Yucatan state, Mexico. Based in secondary-sources data generated by trustworthy Mexican institutions, the resulting Water Access Vulnerability Index (WAVI) allows identification and prioritization of this vulnerability and the factors contributing to it in the human settlements of the study area. WAVI results show that this kind of vulnerability vary within the study area and suggest that this phenomenon will intensify in relation to social factors.
Keywords: Climate change vulnerability, Water, Hu-man settlements, Secondary-sources data, Compound indexes.

15Vol. 4 Núm. 1 enero-abril 2013
1. Introduction
Water is an essential component for the proper functioning of human settlements. Water access is crucial to human development and economic growth (Parkin 1982; Rich 1982). In nature, water availability is governed by environmental phenom-ena. Many of these phenomena are beginning to reflect climate change impacts, frequently threat-ening water availability for humans (IPCC 2007). However environmental factors may influence wa-ter availability, water access is primarily determined by social factors. Millions of people worldwide face water access problems (UN-HABITAT 2006b). These and many other authors address water access from a social perspective, yet their explicative effective-ness within urban-regional contexts is being tested as climate change affects significantly water access in human settlements. An alternative for study of
this challenge is the vulnerability approach to cli-mate change (James, Osvaldo et al. 2001).
Human settlements are dynamic, complex so-cio-ecological systems which arise from the in-teraction of socio-economic and environmental processes on various scales; cities are a physi-cal manifestation of these interactions (Sanchez 2007). This perspective is fundamental for the developing of urban studies using the vulnerabil-ity approach to climate change. Research utiliz-ing this approach is rare in developing countries, Mexico being no exception. It is even rarer at the urban-regional scale; that is, considering the com-plete human settlement system and not just one city or some neighborhoods within it.
In this study we used the vulnerability approach to climate change in order to evaluate water
Mural de Luis Covarrubias. Museo Nacional de Antropología. Sala Maya Arqueológica. México, DF.
Foto
graf
ía: M
auric
io C
ovar
rubi
as F
lore
s.

16 REALIDAD, DATOS Y ESPACIO REVISTA INTERNACIONAL DE ESTADÍSTICA Y GEOGRAFÍA
access in the human settlement system known as the Merida Metropolitan Area (MMA). No specific method exists to evaluate water access with this approach, so we proposed a method for this kind of evaluation. It employed a strong quantitative emphasis and was designed to 1) define vulnera-bility levels for a given human settlement system; 2) map this vulnerability and locate priority areas, and 3) identify and prioritize the contributing fac-tors to water access vulnerability in the system.
1.1. The Merida Metropolitan Area (MMA)
Located in Yucatan state, MMA is one of the 55 metropolitan areas in Mexico (SEDESOL, CONAPO et al. 2004). MMA encompass 288 locations in the municipalities of Conkal, Kanasin, Merida, Progre-so, Ucu and Uman. Overall, the MMA covers 1 978 km2 and had a population of 947 194 inhabitants in 2005; the most populous of the six municipali-ties was Merida, capital city of Yucatan state (INEGI 2005). In a recent report, the MMA was divided into two main sub-zones: a contiguous urban or conur-bation sub-zone (from here on referred to as the conurban sub-zone) and a peripheral-urban sub-zone (from here on referred to as the peri-urban sub-zone) (OMY 2011). The conurban sub-zone is formed by 19 locations (i.e. 6.25% of the regional total) but contained 89.27% of regional population. In contrast, the peri-urban sub-zone contains 269 locations but only had 101 601 inhabitants in 2005. This dual structure in regional population and po-pulation center concentration-dispersion is a result of the “metropolization” process in the MMA. Even though this process has begun at least 40 years ago, it has become more accelerated recently, with important roles played by transformations in the region’s productive and economic bases. Growth rates over these 40 years have varied, but three major patterns have occurred between 2000 and 2005: 1) the city of Merida has continued to grow, although at lower rates; 2) coastal population cen-ters have stabilized, with some indications of ex-pulsion, and 3) conurban sub-zone population has grown steadily while growth in the peri-urban sub-zone has been heterogeneous (Domínguez 2009).
The regional metropolization process has been accompanied by the appearance or exacerbation of environmental problems affecting water ac-cess, such as pollution of the local aquifer (the only permanent natural water source for the regional population), and land use substitution. Urban de-velopment in the area has not been homogeneous, as it can be seen in certain water access indicators: 10.75% of households in the MMA have no access to the public drinkable water system;1 68.49% have no flushing toilet;2 and only 1.82% are con-nected to a public sewage system3 (INEGI 2005). Among other factors, this unequal water accessi-bility in MMA is related to the control that some actors exert on public budget, as well as both wa-ter and land rights (Domínguez 2008).
Two climatic regimes can be identified within the MMA —a semi-arid climate on the coast and a sub-humid one in the remaining area. However, the real difference between these two regimes is the amount of rainfall, since temperature (approx. 26° C average annual temperature) is almost uniform across the MMA (García, López et al. 2000). Regional substrate is a karstic plain with high permeability, porosity and dissolution. It has no surface drain-ages or water bodies, and the only water source is the aquifer. Recharged by rainfall, this aquifer con-sists of a layer of freshwater flowing south to north and a deeper saltwater layer. It is highly productive, but also extremely vulnerable to anthropogenic pollution and saltwater intrusion (Marín and Perry 1994; Graniel et al. 1998; González-Herrera and Pé-rez 1999; Escolero, Marín et al. 2000; Escolero 2002). Current saltwater intrusion in the region is more re-lated to anthropogenic activities in the coast, and it also represents one of the most dangerous threats of climate change due to future sea level rise. Other expected climate-change impacts in the region are an increase in the hurricane frequency and a rainfall variation (Bates, Kundzewicz et al. 2008; Orellana, Espadas et al. 2009).
1 In this context, access consists of a connection to the public drinkable water system insi-
de the household, or at least at the edge of the property.
2 This assumes the toilet is inside the dwelling and can be flushed directly or manually.
3 Public sewage systems are defined as providing adequate wastewater treatment and
disposal.

17Vol. 4 Núm. 1 enero-abril 2013
2. Theory and calculations
2.1. Climate change vulnerability
The concept of vulnerability evolved from risk re-search (Cutter 2001). A number of definitions ex-ist for vulnerability (Cutter 1996), although most vulnerability research can be classified as address-ing physical or social risk. Physical risk, also called “exposure” in Intergovernmental Panel on Climate Change (IPCC) terminology, encompasses phys-ic-environmental characteristics and processes, which increase the risk of experiencing damage. Social risk, also known as “social susceptibility” or “social sensitivity” (IPPC), helps to understand how a diversity of social aspects intervene in creating the myriad results arising from exposure of a socio-ecological system to different types of risk (Cutter 1996; Schmidtlein, Deutsch et al. 2008).
Within climate-change research, vulnerability has expanded to become a more complete concept by encompassing the exposure and sensitivity of a socio-ecological system to the impacts of climate change, as well as the system’s adaptive capacity. That is, its ability to resist, recover from and even take advantage of the effects caused by change (James, Osvaldo et al. 2001). This acknowledges climate-change vulnerability as an interactive phe-nomenon requiring an understanding of how en-vironmental processes function within an unequal socio-economic and political context at different scales (Kasperson, Kasperson et al. 2001; Turner II, Kasperson et al. 2003; Hahn, Riederer et al. 2009). Socio-ecological systems have differential sensi-tivity to disturbances and are dynamic in terms of their adaptive capacities and the strategies imple-mented in response to disturbances. These abilities and strategies are based on social, economic, insti-tutional and political structures (Turner II, Kasper-son et al. 2003).
An approach to climate-change vulnerability consists in evaluating it from current climate per-spective (Jones et al. 2007 mentioned in Carter, Jo-nes et al. 2007). This approach is useful in the uncer-tain context within which socio-ecological systems
are currently developing. It helps in the process of risk detection, improves decision-making and can even function as a development framework (O'Brien, Leichenko et al. 2004).
Within the methodological approaches used to study vulnerability are compound indexes (Hahn, Riederer et al. 2009). Measurement meth-ods are being developed actively within vulner-ability research, and are clearly influenced by the way the analyzed system is conceived (Turner II, Kasperson et al. 2003). Vulnerability depends heavily on context and scale (Downing and Pat-wardhan 2005).
2.2 Conceptualizing water access in human settlements from a focus on
climate-change vulnerability, and developing the Water Access Vulnerability Index (WAVI)
Water is used by different sectors in urban con-texts, but the present study focuses on domestic use; that is, water access for the general popula-tion. Climate change impacts are generating a new risk dimension affecting the already complexity of water-access phenomenon. In this new situation, the entire socio-ecological system represented by the extended human settlement, becomes vulnerable. Study of water access within the con-text of climate change requires integrating con-cepts such as the IPCC climate-change vulnerabil-ity concept, which is understood as the function of the character, magnitude and rate of climate varia-tions to which a system is exposed, as well as that system’s sensitivity and adaptive capacity (James, Osvaldo et al. 2001).
Among the methodological alternatives in vul-nerability research, we chose to address water ac-cess by building a compound index to integrate social and environmental factors deemed as rele-vant in appropriate literature, as well as important aspects of MMA. Existing compound indices were reviewed during the design process, including the Livelihood Vulnerability Index (LVI) (Hahn, Riederer
18 REALIDAD, DATOS Y ESPACIO REVISTA INTERNACIONAL DE ESTADÍSTICA Y GEOGRAFÍA
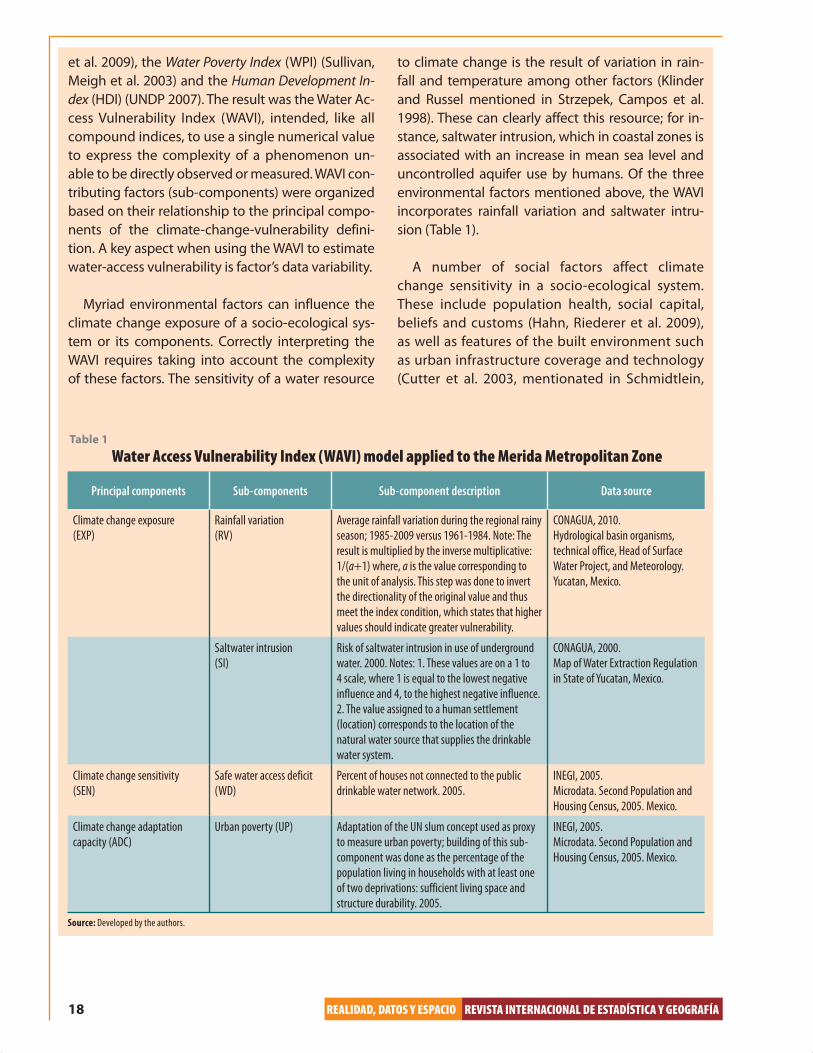
et al. 2009), the Water Poverty Index (WPI) (Sullivan, Meigh et al. 2003) and the Human Development In-dex (HDI) (UNDP 2007). The result was the Water Ac-cess Vulnerability Index (WAVI), intended, like all compound indices, to use a single numerical value to express the complexity of a phenomenon un-able to be directly observed or measured. WAVI con-tributing factors (sub-components) were organized based on their relationship to the principal compo-nents of the climate-change-vulnerability defini-tion. A key aspect when using the WAVI to estimate water-access vulnerability is factor’s data variability.
Myriad environmental factors can influence the climate change exposure of a socio-ecological sys-tem or its components. Correctly interpreting the WAVI requires taking into account the complexity of these factors. The sensitivity of a water resource
to climate change is the result of variation in rain-fall and temperature among other factors (Klinder and Russel mentioned in Strzepek, Campos et al. 1998). These can clearly affect this resource; for in-stance, saltwater intrusion, which in coastal zones is associated with an increase in mean sea level and uncontrolled aquifer use by humans. Of the three environmental factors mentioned above, the WAVI incorporates rainfall variation and saltwater intru-sion (Table 1).
A number of social factors affect climate change sensitivity in a socio-ecological system. These include population health, social capital, beliefs and customs (Hahn, Riederer et al. 2009), as well as features of the built environment such as urban infrastructure coverage and technology (Cutter et al. 2003, mentionated in Schmidtlein,
Principal components Sub-components Sub-component description Data source
Climate change exposure
(EXP)
Rainfall variation
(RV)
Average rainfall variation during the regional rainy
season; 1985-2009 versus 1961-1984. Note: The
result is multiplied by the inverse multiplicative:
1/(a+1) where, a is the value corresponding to
the unit of analysis. This step was done to invert
the directionality of the original value and thus
meet the index condition, which states that higher
values should indicate greater vulnerability.
CONAGUA, 2010.
Hydrological basin organisms,
technical office, Head of Surface
Water Project, and Meteorology.
Yucatan, Mexico.
Saltwater intrusion
(SI)
Risk of saltwater intrusion in use of underground
water. 2000. Notes: 1. These values are on a 1 to
4 scale, where 1 is equal to the lowest negative
influence and 4, to the highest negative influence.
2. The value assigned to a human settlement
(location) corresponds to the location of the
natural water source that supplies the drinkable
water system.
CONAGUA, 2000.
Map of Water Extraction Regulation
in State of Yucatan, Mexico.
Climate change sensitivity
(SEN)
Safe water access deficit
(WD)
Percent of houses not connected to the public
drinkable water network. 2005.
INEGI, 2005.
Microdata. Second Population and
Housing Census, 2005. Mexico.
Climate change adaptation
capacity (ADC)
Urban poverty (UP) Adaptation of the UN slum concept used as proxy
to measure urban poverty; building of this sub-
component was done as the percentage of the
population living in households with at least one
of two deprivations: sufficient living space and
structure durability. 2005.
INEGI, 2005.
Microdata. Second Population and
Housing Census, 2005. Mexico.
Table 1
Water Access Vulnerability Index (WAVI) model applied to the Merida Metropolitan Zone
Source: Developed by the authors.

19Vol. 4 Núm. 1 enero-abril 2013
Deutsch et al. 2008). In the present study, the WAVI incorporated just one social factor to evaluate wa-ter-access sensitivity in the MMA. Called “safe water access deficit”, it adapts the “safe water” concept of the United Nations (Schäfer, Werchota et al. 2007) to local infrastructure coverage, thus describing the existing deficit in basic drinkable water infrastruc-ture in the settlements within the metropolitan area (Table 1). In the future will be important to statisti-cally prove and incorporate in the WAVI other fac-tors such as quantity and quality of the drinkable water service since having the basic infrastructure doesn’t necessarily mean that all the community have an effective access to this resource. In the MMA case it was impossible to incorporate these two last factors because data wasn’t available at the appro-priate scale.
Diverse social factors also affect a socio-ecologi-cal system’s climate-change-adaptation capacity. These can include the political-institutional frame-work, within which resource access rights are vital (Adger, Agrawala et al. 2007), and infrastructure as-signment via public programs (Domínguez 2008). Poverty is another key factor influencing adapta-tion capacity and is considered a complex, multi-dimensional phenomenon (Fields 2005). Research into poverty has produced various theories and approaches; for instance, “urban poverty” is per-ceived as a distinct form of poverty (FIPU 1996). A physical manifestation of “urban poverty” is housing deprivations, which helps in “slum” differentiation. The UN has defined five dimensions of housing deprivations for “slums”: structure durability; living space; safe water access; sanitation access; and se-cure tenure (UN-HABITAT 2006a). The WAVI incor-porated only one factor to evaluate human settle-ment adaptive capacity; this is an adaptation of the UN “slum” concept used here to indirectly measure “urban poverty” in the MMA (Table 1).
In meeting the objectives of the present study (Section 1), and following the practice of other indices (Ebert, Kerle et al. 2009), statistical evalua-tions were done to test the predictive relevance of the variables used to measure the social and en-vironmental sub-components. As a result, some
factors initially considered in the design process were eliminated, even though they are reported as significant in the related literature.4 Only those WAVI sub-components shown to have a signifi-cant correlation were used.5 The same procedure was applied to test the index’s principal compo-nents, which exhibited significant correlations.6 This makes the WAVI a much more trustworthy index. As has been done with other indices (Sul-livan, Meigh et al. 2003; Hahn, Riederer et al. 2009), the WAVI was designed to allow for possible future adjustments by using a balanced approximation of average weights in which each sub-compo-nent contributes equally to the index value, even though the principal components contain differ-ing numbers of sub-components.
The WAVI sub-components represent the nega-tive dimension of the measured social and envi-ronmental factors. This was done to ensure that the results provided a specific, organized repre-sentation of the factors requiring attention (pri-marily from different levels of government) to reduce water-access vulnerability in the human settlements of the appointed region.
The WAVI was designed to focus analysis on current vulnerability rather than on future vulner-ability. This was done because development of ad-equate climate-change adaptive capacities largely depends on the attention paid by a society to cur-rent vulnerability (Carter, Jones et al. 2007).
One of the goals in developing the WAVI was that it would be easily adaptable to other region-al urban contexts in Mexico —or other countries nearby—WAVI being perfectible over time. Some authors have criticized the use of secondary source data, claiming it limits measurement of the ana-lyzed phenomena and is not consistently available (Hahn, Riederer et al. 2009). This is true in some
4 The contributing factors eliminated from the WAVI model were toilet in household; va-
riation in drinkable water coverage; rights to health services; and ethnicity.
5 Correlations between the WAVI and its sub-components: R2WAVI-index RV
= 0.568; R2
WAVI-index SI = 0.457; R2
WAVI-index WD = 0.332; and R2
WAVI-index UP = 0.417.
6 Correlations between the WAVI and its principal components: R2WAVI-EXP
= 0.68; R2
WAVI-SEN = 0.332; and R2
WAVI-ADC = 0.417.
20 REALIDAD, DATOS Y ESPACIO REVISTA INTERNACIONAL DE ESTADÍSTICA Y GEOGRAFÍA
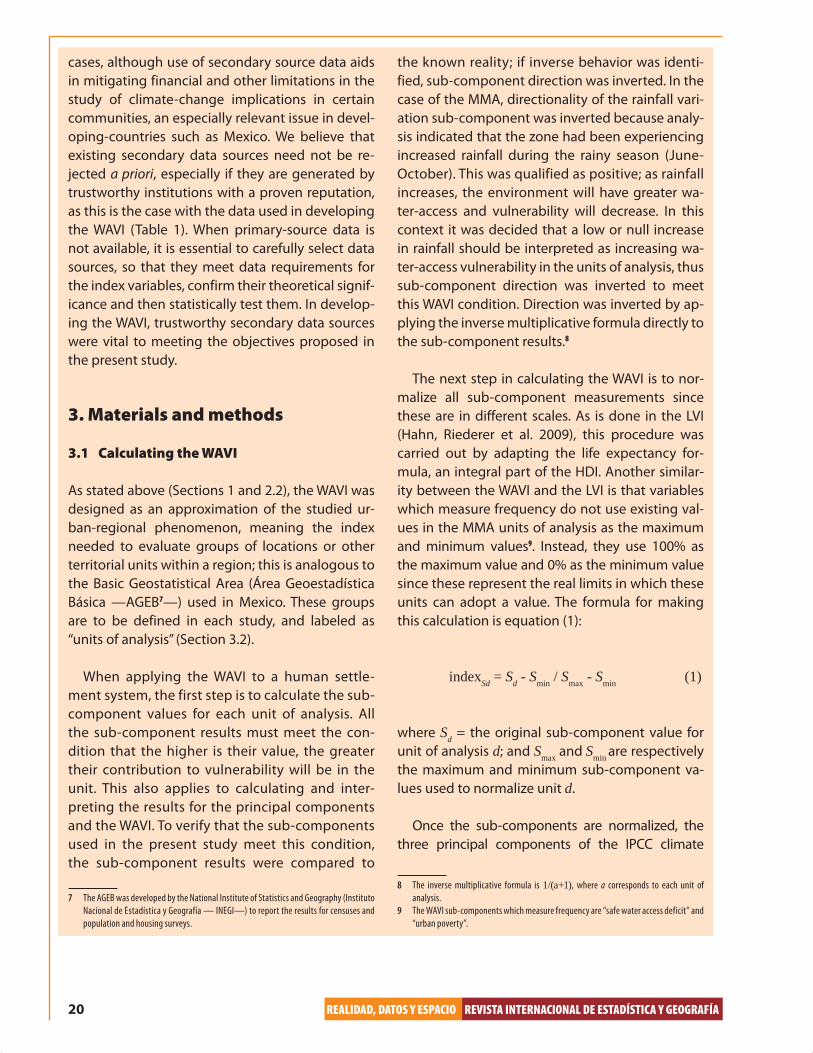
cases, although use of secondary source data aids in mitigating financial and other limitations in the study of climate-change implications in certain communities, an especially relevant issue in devel-oping-countries such as Mexico. We believe that existing secondary data sources need not be re-jected a priori, especially if they are generated by trustworthy institutions with a proven reputation, as this is the case with the data used in developing the WAVI (Table 1). When primary-source data is not available, it is essential to carefully select data sources, so that they meet data requirements for the index variables, confirm their theoretical signif-icance and then statistically test them. In develop-ing the WAVI, trustworthy secondary data sources were vital to meeting the objectives proposed in the present study.
3. Materials and methods
3.1 Calculating the WAVI
As stated above (Sections 1 and 2.2), the WAVI was designed as an approximation of the studied ur-ban-regional phenomenon, meaning the index needed to evaluate groups of locations or other territorial units within a region; this is analogous to the Basic Geostatistical Area (Área Geoestadística Básica —AGEB7—) used in Mexico. These groups are to be defined in each study, and labeled as “units of analysis” (Section 3.2).
When applying the WAVI to a human settle-ment system, the first step is to calculate the sub-component values for each unit of analysis. All the sub-component results must meet the con-dition that the higher is their value, the greater their contribution to vulnerability will be in the unit. This also applies to calculating and inter-preting the results for the principal components and the WAVI. To verify that the sub-components used in the present study meet this condition, the sub-component results were compared to
7 The AGEB was developed by the National Institute of Statistics and Geography (Instituto
Nacional de Estadística y Geografía — INEGI—) to report the results for censuses and
population and housing surveys.
the known reality; if inverse behavior was identi-fied, sub-component direction was inverted. In the case of the MMA, directionality of the rainfall vari-ation sub-component was inverted because analy-sis indicated that the zone had been experiencing increased rainfall during the rainy season (June-October). This was qualified as positive; as rainfall increases, the environment will have greater wa-ter-access and vulnerability will decrease. In this context it was decided that a low or null increase in rainfall should be interpreted as increasing wa-ter-access vulnerability in the units of analysis, thus sub-component direction was inverted to meet this WAVI condition. Direction was inverted by ap-plying the inverse multiplicative formula directly to the sub-component results.8
The next step in calculating the WAVI is to nor-malize all sub-component measurements since these are in different scales. As is done in the LVI (Hahn, Riederer et al. 2009), this procedure was carried out by adapting the life expectancy for-mula, an integral part of the HDI. Another similar-ity between the WAVI and the LVI is that variables which measure frequency do not use existing val-ues in the MMA units of analysis as the maximum and minimum values9. Instead, they use 100% as the maximum value and 0% as the minimum value since these represent the real limits in which these units can adopt a value. The formula for making this calculation is equation (1):
indexSd
= Sd - S
min / S
max - S
min (1)
where Sd = the original sub-component value for
unit of analysis d; and Smax
and Smin are respectively
the maximum and minimum sub-component va-lues used to normalize unit d.
Once the sub-components are normalized, the three principal components of the IPCC climate
8 The inverse multiplicative formula is 1/(a+1), where a corresponds to each unit of
analysis.
9 The WAVI sub-components which measure frequency are “safe water access deficit” and
“urban poverty”.

21Vol. 4 Núm. 1 enero-abril 2013
change vulnerability definition are calculated for each unit of analysis (James, Osvaldo et al. 2001). Each principal component is calculated separately using equation (2), which represents the average of the number of sub-components contained within it:
Md = � ni=1 index
Sdi / n (2)
where Md = one of the three principal components
for unit of analysis d; indexSdi = sub-components nor-malized by i, which integrate the principal compo-nent d; and n = the number of sub-components in principal component d.
Finally, once the three principal components are calculated for each unit of analysis, they are ave-raged with a weighted procedure to produce their WAVI value, using equation (3):
WAVId = � 3i = 1 w
Mi M
di / � 3i = 1 w
Mi (3)
where WAVId = Water Access Vulnerability Index
for unit of analysis d; and wMi = each principal component’s weight, determined by the number of sub-components it contains.
3.2 Units of analysis in the MMA
In 2005, there were 288 locations within the MMA (INEGI 2005), of which 78 were included in the present study. These correspond to the 78 locations with complete data that were used to develop the four WAVI model sub-components.10 However, the WAVI was calculated for many more units of analysis because these 78 identified locations were subdivided into two groups based on availability of AGEB data. AGEB data provides more detail for
10 The 210 locations in the MMA for which the WAVI could not be calculated are mostly
small, disperse settlements, which represent barely 0.14% of total MMA population.
Calculating the sub-components for these locations was not possible due to census data
confidentiality (INEGI).
evaluating the studied phenomenon inside the MMA locations with this level of disaggregation.11 The WAVI was calculated for a total of 529 units of analysis: 71 locations and 451 AGEB.
3.3 Analysis procedures for urban-regional water-access vulnerability levels and distribution among human settlements and the contribution of social and environmental factors
In indices such as the LVI (Hahn, Riederer et al. 2009), scale results have been defined, although methods are not included to define vulnerability levels between units of analysis. This shortcoming reduces the practical possibilities of using the in-dex-generated data to make concrete decisions aimed at diminishing vulnerability in any given re-gional population. The WAVI represents progress in this sense because it sets a scale results12 and it also includes a method to calculate vulnerability levels. To do this, the natural breaks (Jenks) classification method is applied, due to its ability to optimize the best arrangement for the values in a given number of classes by reducing variance within classes and maximizing it between them (Jenks 1967; McMas-ter 1997).
Analysis of water-access vulnerability levels and their territorial distribution within the MMA was done at the units of analysis scale. Evaluation of the contributing factors to this vulnerability was done by selecting case studies among the units of analy-sis with medium to high vulnerability; these were catalogued as “priority areas” in the MMA (Section 1). Case study definition was done by applying three selection criteria to these areas: 1) Their location in-side the conurban/peri-urban zoning proposed by OMY (OMY 2011). In an effort to generate a more detailed territorial view of these factors through
11 The data for seven locations in the MMA were broken down: Kanasin, Merida and Uman
(each belonging to the municipality of the same name); and Progreso, Chelem, Chicxu-
lub and Chuburna (all within Progreso municipality).
12 WAVI scale range from zero (lowest vulnerability) to one (highest vulnerability). The
same range applies to the sub-components and principal components.
22 REALIDAD, DATOS Y ESPACIO REVISTA INTERNACIONAL DE ESTADÍSTICA Y GEOGRAFÍA
out the MMA and in response to an exploratory exercise which identified behavioral variations in some socio-demographic variables between certain sub-zones, the location criterion was com-plemented with an additional sub-zone location classification. 2) Homogeneous zones13 were de-limited for those locations with data broken down by AGEB. 3) A random sample of locations was taken of the disperse settlements to ensure they were representative of all the MMA priority areas. A total of 19 case studies were chosen and their sub-component,14 principal component and WAVI values calculated. For these 19 cases, the natural breaks method was applied to their indexed sub-component and principal component results to evaluate the contributions of the social and envi-ronmental factors included in the WAVI.15
4. Results
4.1 Vulnerability levels and territorial distribution
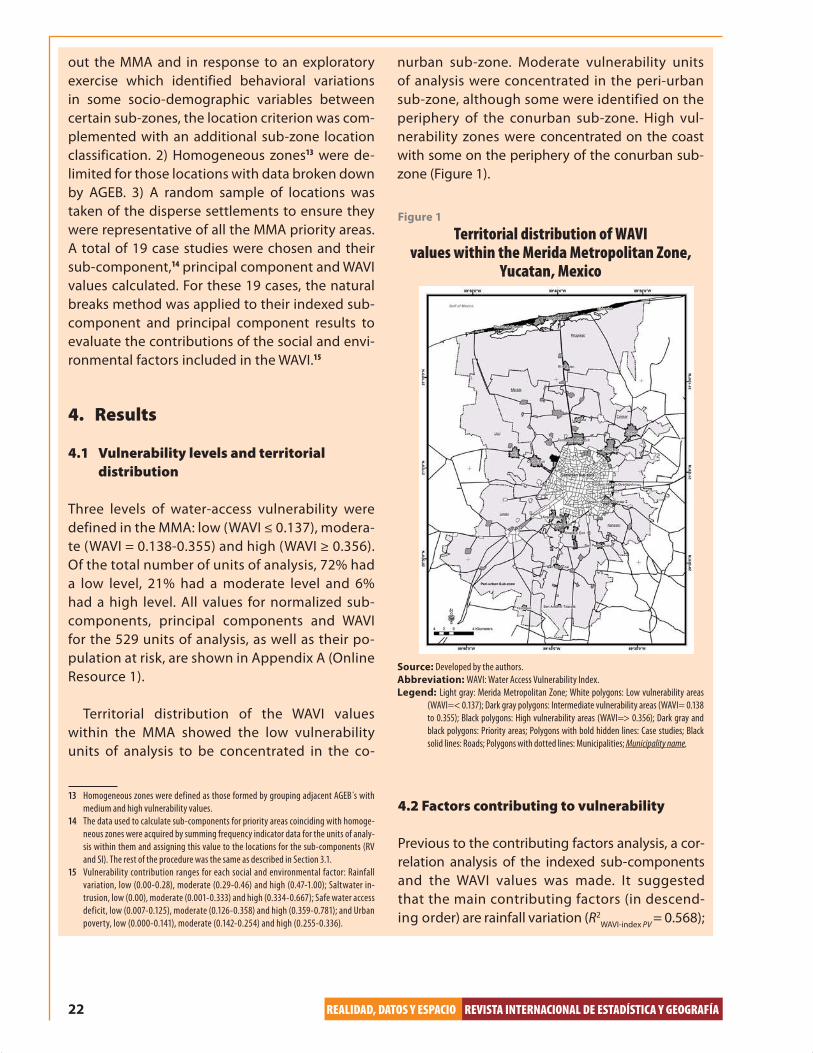
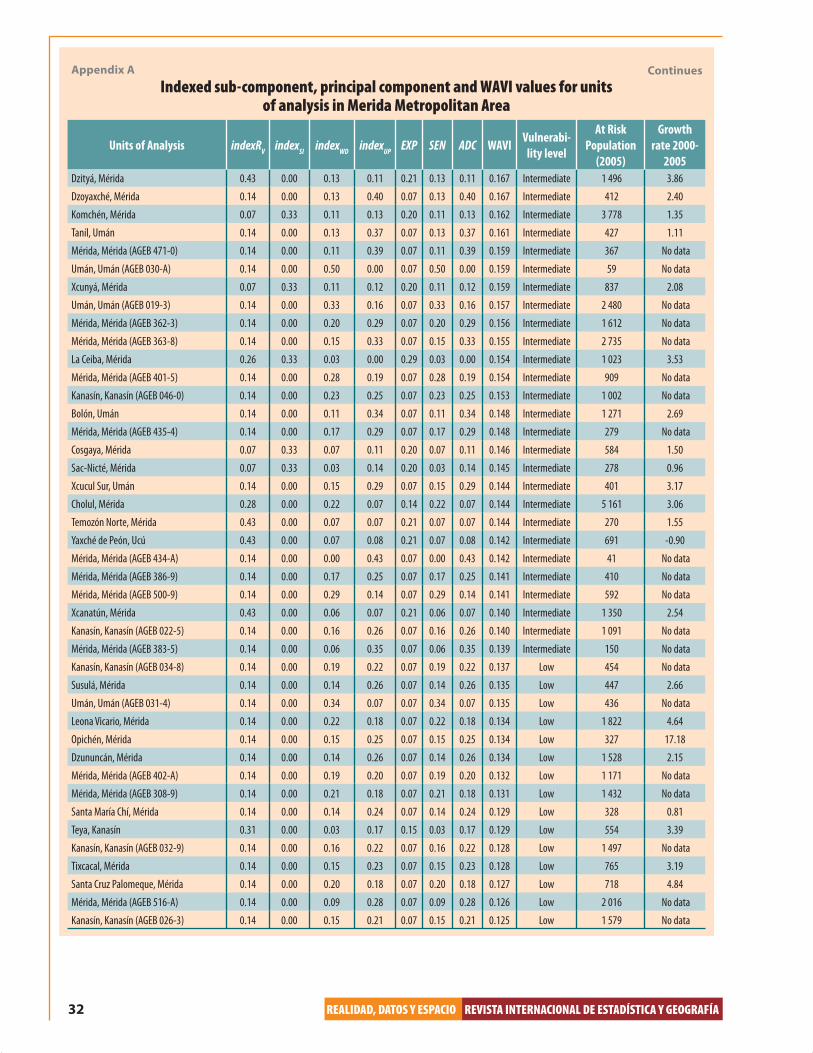
Three levels of water-access vulnerability were defined in the MMA: low (WAVI ≤ 0.137), modera-te (WAVI = 0.138-0.355) and high (WAVI ≥ 0.356). Of the total number of units of analysis, 72% had a low level, 21% had a moderate level and 6% had a high level. All values for normalized sub-components, principal components and WAVI for the 529 units of analysis, as well as their po-pulation at risk, are shown in Appendix A (Online Resource 1).
Territorial distribution of the WAVI values within the MMA showed the low vulnerability units of analysis to be concentrated in the co-
13 Homogeneous zones were defined as those formed by grouping adjacent AGEB s with
medium and high vulnerability values.
14 The data used to calculate sub-components for priority areas coinciding with homoge-
neous zones were acquired by summing frequency indicator data for the units of analy-
sis within them and assigning this value to the locations for the sub-components (RV
and SI). The rest of the procedure was the same as described in Section 3.1.
15 Vulnerability contribution ranges for each social and environmental factor: Rainfall
variation, low (0.00-0.28), moderate (0.29-0.46) and high (0.47-1.00); Saltwater in-
trusion, low (0.00), moderate (0.001-0.333) and high (0.334-0.667); Safe water access
deficit, low (0.007-0.125), moderate (0.126-0.358) and high (0.359-0.781); and Urban
poverty, low (0.000-0.141), moderate (0.142-0.254) and high (0.255-0.336).
nurban sub-zone. Moderate vulnerability units of analysis were concentrated in the peri-urban sub-zone, although some were identified on the periphery of the conurban sub-zone. High vul-nerability zones were concentrated on the coast with some on the periphery of the conurban sub-zone (Figure 1).
Figure 1
Territorial distribution of WAVI values within the Merida Metropolitan Zone,
Yucatan, Mexico
Source: Developed by the authors.
Abbreviation: WAVI: Water Access Vulnerability Index.
Legend: Light gray: Merida Metropolitan Zone; White polygons: Low vulnerability areas
(WAVI=< 0.137); Dark gray polygons: Intermediate vulnerability areas (WAVI= 0.138
to 0.355); Black polygons: High vulnerability areas (WAVI=> 0.356); Dark gray and
black polygons: Priority areas; Polygons with bold hidden lines: Case studies; Black
solid lines: Roads; Polygons with dotted lines: Municipalities; Municipality name.
4.2 Factors contributing to vulnerability
Previous to the contributing factors analysis, a cor-relation analysis of the indexed sub-components and the WAVI values was made. It suggested that the main contributing factors (in descend-ing order) are rainfall variation (R2
WAVI-index PV = 0.568);

23Vol. 4 Núm. 1 enero-abril 2013
saltwater intrusion (R2WAVI-index SI = 0.457); urban pover-
ty (R2WAVI-index UP = 0.417); and safe water-access deficit
(R2WAVI-index WD = 0.332).
The contributing factors to vulnerability for the 19 case studies (defined in section 3.3) are shown in Table 2; their analysis by sub-zone level indicate that rainfall variation mostly makes low contribu-tions in the South Conurban Sub-zone, and high
contributions in the Coast Sub-zone, while mo-derately contribute in the other three sub-zones. Saltwater intrusion mostly generated high contri-butions to vulnerability in the Coast Sub-zone, and low contributions in the rest. Finally, safe water ac-cess deficit and urban poverty contributing factors have a diverse behavior through MMA sub-zones, even though there is a tendency to moderate va-lues (Table 2).
Table 2
WAVI indexed sub-component values for 19 study cases (priority areas) in the Merida Metropolitan Area
Priority Area Study Cases by Sub-zone
indexRV indexSI indexWD indexUP
At Risk Population
(2005)
Priority Area Type
Locations (total) AGEB´s (total)
North Conurban Sub-zone
14 658 - 16
Cholul Exit,
Mérida0.290 0.000 0.262 0.075 5 499
Temozón-Dzityá Exit,
Mérida.0.425 0.000 0.781 0.114 451
Caucel Exit,
Mérida0.425 0.000 0.231 0.135 6 860
North Peri-urban Sub-zone
26 483 23 -
Ucú, Ucú 0.425 0.000 0.230 0.141 2 360
Conkal, Conkal 0.425 0.000 0.172 0.087 6 620
La Ceiba, Mérida 0.256 0.333 0.008 0.000 1 023
El Paraíso, Progreso 0.000 0.667 0.466 0.247 285
South Conurban Sub-zone
17 314 - 35
West Airport, Mérida 0.138 0.000 0.339 0.254 1 432
South Airport, Mérida 0.138 0.000 0.230 0.336 7 509
Xmatkuil Exit, Mérida 0.463 0.000 0.470 0.238 1 434
Kanasín-Mérida
Overlap 1, Kanasín0.138 0.000 0.309 0.281 1 137
Kanasín-Mérida w
Overlap 2, Kanasín0.138 0.000 0.358 0.232 1 905
Continues

24 REALIDAD, DATOS Y ESPACIO REVISTA INTERNACIONAL DE ESTADÍSTICA Y GEOGRAFÍA
Table 2
WAVI indexed sub-component values for 19 study cases (priority areas) in the Merida Metropolitan Area
Priority Area Study Cases by Sub-zone
indexRV indexSI indexWD indexUP
At Risk Population
(2005)
Priority Area Type
Locations (total) AGEB´s (total)
South Peri-urban Sub-zone
15 438 19 -
San Antonio Tzacalá,
Mérida0.463 0.000 0.007 0.290 618
San José Tzal,
Mérida0.463 0.000 0.125 0.214 3 092
San Pedro Chimay,
Mérida0.463 0.000 0.076 0.319 1 012
Yaxcopoil; Umán 0.463 0.000 0.047 0.214 1 102
Coast Sub-zone 45 311 - 51
Progreso, Progreso 1.000 0.000 0.022 0.087 35 519
Chuburná-Chelem, Progreso 1.000 0.667 0.052 0.176 3 061
Chicxulub, Progreso 1.000 0.667 0.095 0.140 5 052
Source: Developed by the authors.
Abbreviations: WAVI: Water Access Vulnerability Index; indexRV
: Rainfall variation indexed sub-component; indexSI
: Saltwater intrusion indexed sub-component; indexWD
: Safe water access
deficit indexed sub-component; indexUP
: Urban poverty indexed sub-component; AGEB: Área Geoestadística Básica (Basic Geostatistical Area). Names in underlined italics within sub-
zones indicate municipalities.
Notes: Contribution levels to vulnerability of indexed sub-components. Rainfall variation: low (0.00 to 0.28), moderate (0.29 to 0.46), high (0.47 to 1.00); Saltwater intrusion: low (0.00),
moderate (0.001 to 0.333), high (0.334 to 0.667); Safe water access deficit: low (0.007 to 0.125), moderate (0.126 to 0.358), high (0.359 to 0.781); and Urban poverty: low (0.000 to 0.141),
moderate (0.142 to 0.254), high (0.255 to 0.336).
Concludes
5. Discussion
5.1 Water-access vulnerability in the MMA
A number of different social and environmental factors have been linked to water access in socie-ties, but contextualizing this phenomenon with-in the vulnerability approach to climate change and the present study area suggested that not all of these factors have the same potential usefulness in evaluating this phenomenon. Indeed, the analy-sis raised doubts about the explicative relevancy of some, at least from a statistical-quantitative per-spective and within the MMA. The WAVI aided in identifying and prioritizing the factors contributing to water-access vulnerability in the MMA (Sections 2.2 and 2.4), but also helped to define vulnerability
levels among the region’s human settlements, ana-lyze the territorial distribution of this vulnerability and identify priority areas.
The most vulnerable population was that living in the priority areas, and accounted for 12.58% of total MMA population. This may be a small per-centage compared to the population living in low vulnerability areas, but it nonetheless represents 119 157 people, a substantial portion of the popu-lation in 2005.
Interpretation of the MMA WAVI results in terms of the IPCC climate-change vulnerability definition components suggested the presence of differen-tial sensitivity between human settlements (Turn-er II, Kasperson et al. 2003), as well as different levels
25Vol. 4 Núm. 1 enero-abril 2013
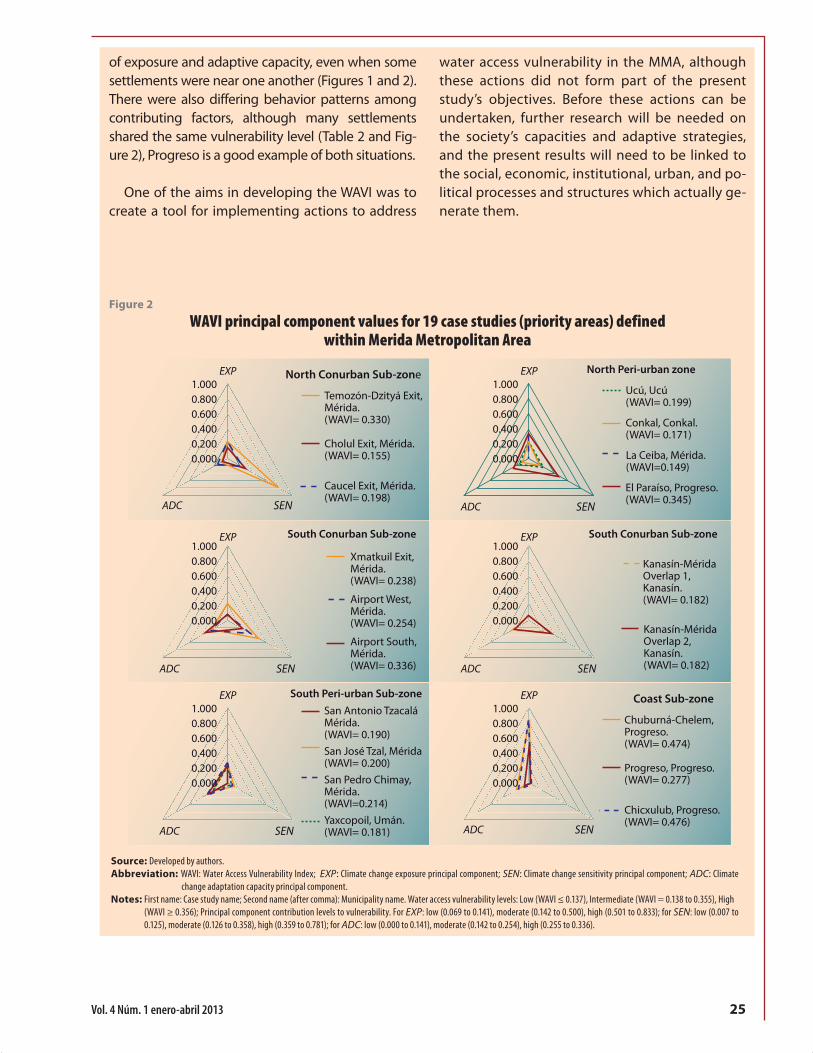
of exposure and adaptive capacity, even when some settlements were near one another (Figures 1 and 2). There were also differing behavior patterns among contributing factors, although many settlements shared the same vulnerability level (Table 2 and Fig-ure 2), Progreso is a good example of both situations.
One of the aims in developing the WAVI was to create a tool for implementing actions to address
water access vulnerability in the MMA, although these actions did not form part of the present study’s objectives. Before these actions can be undertaken, further research will be needed on the society’s capacities and adaptive strategies, and the present results will need to be linked to the social, economic, institutional, urban, and po-litical processes and structures which actually ge-nerate them.
Figure 2
WAVI principal component values for 19 case studies (priority areas) defined within Merida Metropolitan Area
Source: Developed by authors.
Abbreviation: WAVI: Water Access Vulnerability Index; EXP: Climate change exposure principal component; SEN: Climate change sensitivity principal component; ADC: Climate
change adaptation capacity principal component.
Notes: First name: Case study name; Second name (after comma): Municipality name. Water access vulnerability levels: Low (WAVI ≤ 0.137), Intermediate (WAVI = 0.138 to 0.355), High
(WAVI ≥ 0.356); Principal component contribution levels to vulnerability. For EXP: low (0.069 to 0.141), moderate (0.142 to 0.500), high (0.501 to 0.833); for SEN: low (0.007 to
0.125), moderate (0.126 to 0.358), high (0.359 to 0.781); for ADC: low (0.000 to 0.141), moderate (0.142 to 0.254), high (0.255 to 0.336).
1.0000.8000.6000.4000.2000.000
Coast Sub-zoneEXP
ADC SEN
Chuburná-Chelem, Progreso.(WAVI= 0.474)
Progreso, Progreso.(WAVI= 0.277)
Chicxulub, Progreso.(WAVI= 0.476)
1.0000.8000.6000.4000.2000.000
North Conurban Sub-zoneEXP
ADC SEN
Temozón-Dzityá Exit, Mérida.(WAVI= 0.330)
Cholul Exit, Mérida.(WAVI= 0.155)
Caucel Exit, Mérida.(WAVI= 0.198)
1.0000.8000.6000.4000.2000.000
North Peri-urban zoneEXP
ADC SEN
Ucú, Ucú(WAVI= 0.199)
Conkal, Conkal.(WAVI= 0.171)
La Ceiba, Mérida.(WAVI=0.149)
El Paraíso, Progreso.(WAVI= 0.345)
1.0000.8000.6000.4000.2000.000
South Conurban Sub-zoneEXP
ADC SEN
Kanasín-MéridaOverlap 1,Kanasín.(WAVI= 0.182)
Kanasín-MéridaOverlap 2,Kanasín.(WAVI= 0.182)
1.0000.8000.6000.4000.2000.000
South Conurban Sub-zoneEXP
ADC SEN
Airport West,Mérida.(WAVI= 0.254)
Xmatkuil Exit,Mérida.(WAVI= 0.238)
Airport South,Mérida.(WAVI= 0.336)
1.0000.8000.6000.4000.2000.000
South Peri-urban Sub-zoneEXP
ADC SEN
San Antonio TzacaláMérida.(WAVI= 0.190)San José Tzal, Mérida(WAVI= 0.200)San Pedro Chimay, Mérida.(WAVI=0.214)Yaxcopoil, Umán.(WAVI= 0.181)

26 REALIDAD, DATOS Y ESPACIO REVISTA INTERNACIONAL DE ESTADÍSTICA Y GEOGRAFÍA
5.2 WAVI benefits and limitations
The WAVI is an effective way of evaluating water-ac-cess vulnerability from a climate-change perspective at the complete human-settlement system scale, an underutilized scale in studies of this phenomenon. When applied to the MMA, the WAVI identified the effects of concrete social and environmental factors. However, the most outstanding aspects of the WAVI are its focus and flexibility in studying this phenomenon, which will allow its adaptation to different regional contexts over time, and may even make it a promising model for evaluating the climate-change vulnerability of other social phe-nomena in human settlements.
This index specifies and breaks down the areas of weakness and opportunity within each human-settlement system that requires further attention to reduce water access vulnerability. Using this as-pect will help in designing effective climate change vulnerability programs. The WAVI also uses existing secondary-data sources developed by trustworthy institutions —in this case at federal level. Other authors may disregard these sources (Hahn, Rie-derer et al. 2009), but in developing the WAVI they were not eliminated a priori since the problem is not the data source per se but incorrect selection of sources and/or variables, deficient theoretical jus-tification, and inadequate statistical proofing. Using secondary data sources also reduces the cost and time needed to generate vulnerability evaluations, a key advantage when generating a critical mass of climate-change vulnerability research in develop-ing countries such as Mexico.
One limiting factor encountered during WAVI development was the difficulty in including some phenomena relevant to water-access vulnerabili-ty in the index. This was a challenge for a num-ber of reasons, including data availability; for ins-tance, factors considered initially such as natural water source quality were eliminated from the MMA analysis for lack of sufficient data. As a way of compensating for this limiting factor and allo-wing for future inclusion of other relevant factors in human settlement systems yet to be studied,
the WAVI can incorporate new factors without af-fecting its scientific rigor. One aspect to consider, however, is that the presence of differences be-tween contributing factors used to evaluate more than one human-settlement system may create difficulty in results comparison. This challenge can be overcome through expert opinion.
A limiting factor intrinsic to the WAVI model used to study the MMA is that its sub-components (i.e. rainfall variation and saltwater intrusion) were normalized via maximum and minimum values applicable only in the study area. As stated by Hahn and Vincent, this presents a challenge to comparing the present results with those from other human settlement systems, even if exactly the same sub-components were used (Vincent 2007; Hahn, Riederer et al. 2009). Another poten-tially limiting factor mentioned by these authors is that the sub-components were averaged within the principal components, therefore ignoring variance in these phenomena inside the MMA. To counterbalance this effect, we field-checked data and generated tables and thematic maps to ob-serve some aspects of this variability (Section 4.2).
Finally, as a compound index the WAVI could be qualified as an over-simplification of the studied phenomenon (Vincent 2007). Despite this possibil-ity, we believe that the WAVI is the most adequate possible model for evaluating the water access phenomenon in the study area (Sections 2.2, and 3.1 to 3.3). Indeed, the idea behind building an index is precisely the use of a numerical value to express the complexity of a phenomenon which would be difficult or impossible to directly observe and/or measure.
6. Conclusions
WAVI was influenced by the IPCC vulnerability approach to climate change (James, Osvaldo et al. 2001), the urban-regional scale adopted from the outset and our conception of the studied so-cio-ecological system’s structure and functioning (Turner II, Kasperson et al. 2003; Downing and Pat-

27Vol. 4 Núm. 1 enero-abril 2013
wardhan 2005). MMA is a complex socio-ecologi-cal system in which climate change impacts, and the consequent associated vulnerabilities, operate in specific ways that can be differentiated from those in other systems, be it for their physico-en-vironmental and/or socio-spatial characteristics. This clearly highlights the need for climate-change researchers to understand how the environmental processes involved in this phenomenon operate differentially depending on context and scale (Kas-person, Kasperson et al. 2001; Turner II, Kasperson et al. 2003; Hahn, Riederer et al. 2009).
Water access has been widely studied as a so-cial phenomenon, but climate-change impacts create the need to develop new approaches. We are conscious of some of the model’s limitations and the need to continue developing it in the fu-ture, but we believe it to be a promising proposal for quantitatively addressing this phenomenon at the complete human-settlement system scale, one that is rarely used in climate-change vulnera-bility research.
Water-access vulnerability within MMA is more intense on the coast and in the peri-urban sub-zone than inside the conurban sub-zone. Howev-er, the contributing factors vary throughout the study area. Using the components of the climate-change vulnerability definition, it can be said that the coastal population are more vulnerable due to climate-change exposure, while the peri-urban population are vulnerable due to their limited adaptive capacity and sensitivity. Over time, the dynamism of these factors (Turner II, Kasperson et al. 2003), will probably increase vulnerability levels and/or the impacts from social contribut-ing factors will become more generalized. These factors will include those used now in the WAVI as well as others.
Concrete actions aimed at reducing the current status of water-access vulnerability in the human settlements of the MMA did not form part of the present study objectives, but the results repor-ted here can help to generate actions towards this goal.
Acknowledgements: The authors thank Dr. Ro-meo De Coss Gómez of Centro de Investigación y de Estudios Avanzados, Unidad Mérida for assis-tance in building the mathematical index; Dr. Julia Pacheco Ávila, Dr. Roger Orellana Lanza and Celene Espadas Manrique for sharing their knowledge on the physico-environmental dimension of water; and José Luis Acosta Rodríguez (Consejo Nacional de Agua —CONAGUA—, Yucatan Peninsula Basin) for providing meteorological data. They also thank María José Escalante Garma, Mariel Estefanía Fran-co Peraza and Rafael Eduardo Montejo Rubio for assistance with processing raw data and cartogra-phic information. This research was conducted as part of a post-doctoral internship by MDA at the Human Ecology Department, of Centro de Inves-tigación y de Estudios Avanzados, Unidad Mérida, and was financed by the Consejo Nacional de Cien-cia y Tecnología de México (CONACYT).
References
Adger, N., S. Agrawala et al. (2007). "Assessment of adaptation practices,
options, contraints and capacity". Climate change 2007–Impacts,
adaptation and vulnerability. Contribution of working group II to the
fourth assessment report of the IPCC. Cambridge, New York, Melbourne,
Madrid, Cape Town, Singapore, São Paolo, Delhi, Cambridge University
Press: 717-743.
Bates, B., Z. Kundzewicz et al., Eds. (2008). "Climate change and water.
Technical paper of the Intergovernamental Panel on Climate Change".
Geneva, IPCC Secretariat.
Carter, T. R., R. N. Jones et al. (2007). "New assessment methods and the
characterisation of future conditions". Climate change 2007–Impacts,
adaptation and vulnerability. Contribution of working group II to the
fourth assessment report of the IPCC. Cambridge, New York, Melbourne,
Madrid, Cape Town, Singapore, São Paolo, Delhi, Cambridge University
Press: 133-171.
Cutter, S. (1996). "Vulnerability to environmental hazards." Pro in Hum Geogr
20(4): 529-539.
Cutter, S. (2001). "American hazardscapes. The regionalization of hazards and
disasters". Washington, DC, Joseph Henry Press.
Domínguez, M. (2008). "El acceso al agua en el México urbano de principios del
siglo XXI. Un enfoque socio-ambiental aplicado en la Zona Conurbada
de Mérida". Facultad de Filosofía y Letras/Instituto de Geografía. México
DF, Universidad Nacional Autónoma de México. Doctorado en Geografía: 82.

28 REALIDAD, DATOS Y ESPACIO REVISTA INTERNACIONAL DE ESTADÍSTICA Y GEOGRAFÍA
Domínguez, M. (2009). "Atlas para el desarrollo de las regiones del estado de
Yucatán, 2009". Mérida, Yucatán, Secretaría de Desarrollo Urbano y Medio
Ambiente. Gobierno del Estado de Yucatán.
Downing, T. E. and A. Patwardhan (2005). "Assessing vulnerability for climate
change adaptation. Adaptation policy frameworks for climate change:
Developing strategies, policies and measures". B. Lim, E. Spanger-Siegfried,
I. Burton, M. Malone and S. Huq. Cambridge and New York, Cambridge
University Press: 67-90.
Ebert, A., N. Kerle et al. (2009). "Urban social vulnerability assessment with
physical proxies and spatial metrics from air- and spaceborme and GIS
data." Nat Hazards 48(2): 275-294.
Escolero, O. (2002). "Development of a protectio strategy of karst limestone
aquifers: The Merida, Yucatan, Mexico case study." Water Resources
Management 16: 351-367.
Escolero, O., L. Marín et al. (2000). "Delimitation of a hydrogeological reserve
for a city within a karstic aquifer: the Merida, Yucatan example." Landsc and
Urban Plan 51: 53-62.
Fields, S. (2005). "Why Africa's climate change burden is greater." Environ
Health Perspect 113: A534-A537.
FIPU (1996). "Urban poverty: A world challenge. The Recife declaration. Paris",
Foro Internacional de Pobreza Urbana.
García, E., J. L. López et al. (2000). "Climas de la Península de Yucatán". Atlas
de procesos territoriales de Yucatán. Mérida, Universidad Autónoma de
Yucatán.
González-Herrera, R. and J. Pérez (1999). "Condiciones hidráulicas de la zona
costera Santa Clara-Chuburná, Yucatán, México." Ingeniería Hidráulica en
México XIV(1): 51-59.
Graniel, C. et al. (1998). "Effects of urbanization on groundwater resources of
Merida, Yucatan, Mexico." Environ Geol 37: 303-312.
Hahn, M., A. Riederer et al. (2009). "The Livelihood Vulnerability Index. A
pragmatic approach to assessing risk from climate variability and change-
A case study in Mozambique." Glob Environ Chang 19(1): 74-88.
INEGI (2005). "II Conteo de Población y Vivienda 2005". México, Instituto
Nacional de Estadística y Geografía.
IPCC (2007). "Cambio climático 2007: Informe síntesis. Contribución de los
grupos de trabajo I, II y III al cuarto informe de evaluación del grupo
intergubernamental de expertos sobre cambio climático". Ginebra, Suiza.
James, M., C. Osvaldo et al., Eds. (2001). "Climate change 2001: Impacts,
adaptation, and vulnerability. Contribution of working group II to the third
assessment report of the Intergovernamental Panel on Climate Change".
Cambridge, UK, Cambridge University Press.
Jenks, G. (1967). "The data model concept in statistical mapping." International
Yearbook of Cartography 7: 186-190.
Kasperson, J., R. Kasperson et al. (2001). "Introduction: Global environmental
risk and society". Global environmental risk. J. Kasperson and R. Kasperson.
New York, United Nations University Press: 1-48.
Marín, L. and E. Perry (1994). "The hydrogeology and contamination potential
of northwestern Yucatan, Mexico." Geofísica Internacional 33(4): 619-623.
McMaster, R. (1997). "In memoriam: George F. Jenks (1916-1996)." Cartogr and
Geogr Inf Sci 24(1): 56-59.
O'Brien, K., U. Leichenko et al. (2004). "Mapping vulnerability to multiple
stressors: Climate change and globalization in India." Glob Environ Chang
14: 303-313.
OMY (2011). "Informe. Primera encuesta metropolitana 2010". Mérida, Centro
de Investigación y de Estudios Avanzados del IPN Unidad Mérida: 58.
Orellana, R., C. Espadas et al. (2009). "Atlas. Escenarios de cambio climático en la
Península de Yucatán". Centro de Investigación Científica de Yucatán, AC.
Parkin, A. (1982). "Centralization, bureaucracy, and urban studies. A
comparative perspective". The politics of urban public services. R. Rich.
Lexington, Masachusets, Lexington Books DC. Heath and Company: 221-
237.
Rich, R. (1982). "The political economy of urban services distribution". The
politics of urban public services. R. Rich. Lexington, Masachusetts, Lexington
Books DC. Heath and Company: 1-15.
Sanchez, R. (2007). "Urbanización, cambios globales en el ambiente y
desarrollo sustentable en América Latina". Urbanización, cambios globales
en el ambiente y desarrollo sustentable en América Latina. R. S. R. y. A.
Bonilla. San José dos Campo, Brasil, IAI: 8-31.
Schäfer, D., R. Werchota et al. (2007). "MDG monitoring for urban water supply
and sanitation: Catching up with reality in sub-Sahara Africa". Eschborn,
Deutsche Gesellschaft für Technische Zusammenarbeit (GTZ) GmbH.
Schmidtlein, M. C., R. C. Deutsch et al. (2008). "A sensitivity analysis of social
vulnerability index". Risk Analysis 28(4): 1099-1114.
SEDESOL, CONAPO et al. (2004). "Delimitación de las zonas metropolitanas
de México". México, Secretaría de Desarrollo Social, Consejo Nacional de
Población e Instituto Nacional de Estadística y Geografía.
Strzepek, K., M. Campos et al. (1998). "Chapter 6. Water resources". Handbook
on methods for climate change impact assessment and adaptation strategies,
United Nations Environment Programme and vrije Universitiet Amsterdam: 141-177.
Sullivan, C., J. Meigh et al. (2003). "The water poverty index: Development and
application at the community scale". Natural Resour Forum 27: 189-199.
Turner II, B., R. Kasperson et al. (2003). "A framework for vulnerability analysis
in sustainability science." Proceedings of the National Academy of Science of
the United States of America 100(14): 8074-8079.
UN-HABITAT (2006a). "The state of the world's cities report 2006/2007. 30
years of shaping the Habitat Agenda", United Nations Human Settlements
Programme.
UN-HABITAT (2006b). "Meeting development goals in small urban centers.
Water and sanitation in the world’s cities 2006". London, Earthscan.
UNDP (2007). "Technical note 1. Human development report 2007/2008.
Fighting climate change: Human solidarity in a divided world".
Vincent, K. (2007). "Uncertainty in adaptive capacity and the importance of
scale". Glob Environ Chang 17: 12-24.

29Vol. 4 Núm. 1 enero-abril 2013
Appendix A
Indexed sub-component, principal component and WAVI values for units of analysis in Merida Metropolitan Area
Units of Analysis indexRV indexSI indexWD indexUP EXP SEN ADC WAVI Vulnerabi-lity level
At Risk Population
(2005)
Growth rate 2000-
2005Chicxulub, Progreso (AGEB 039-5) 1.00 0.67 1.00 0.80 0.83 1.00 0.80 0.867 High 20 No data
Chicxulub, Progreso (AGEB 040-8) 1.00 0.67 0.50 0.38 0.83 0.50 0.38 0.635 High 52 No data
Chicxulub, Progreso (AGEB 041-2) 1.00 0.67 0.50 0.33 0.83 0.50 0.33 0.625 High 21 No data
Chelem, Progreso (AGEB 017-9) 1.00 0.67 0.50 0.25 0.83 0.50 0.25 0.604 High 20 No data
Chicxulub, Progreso (AGEB 042-7) 1.00 0.67 0.60 0.00 0.83 0.60 0.00 0.567 High 26 No data
Chicxulub, Progreso (AGEB 026-8) 1.00 0.67 0.36 0.20 0.83 0.36 0.20 0.557 High 106 No data
Chelem, Progreso (AGEB 021-5) 1.00 0.67 0.08 0.46 0.83 0.08 0.46 0.551 High 44 No data
Chicxulub, Progreso (AGEB 043-1) 1.00 0.67 0.41 0.10 0.83 0.41 0.10 0.546 High 100 No data
Chelem, Progreso (AGEB 016-4) 1.00 0.67 0.17 0.33 0.83 0.17 0.33 0.542 High 21 No data
Mérida, Mérida (AGEB 476-3) 0.14 0.00 1.00 1.00 0.07 1.00 1.00 0.534 High 6 No data
Chelem, Progreso (AGEB 018-3) 1.00 0.67 0.00 0.43 0.83 0.00 0.43 0.524 High 32 No data
Chelem, Progreso (AGEB 070-9) 1.00 0.67 0.08 0.28 0.83 0.08 0.28 0.506 High 354 No data
Progreso, Progreso (AGEB 079-A) 1.00 0.00 0.00 1.00 0.50 0.00 1.00 0.500 High 9 No data
Chicxulub, Progreso (AGEB 038-0) 1.00 0.67 0.13 0.20 0.83 0.13 0.20 0.500 High 54 No data
Chelem, Progreso (AGEB 054-A) 1.00 0.67 0.06 0.25 0.83 0.06 0.25 0.496 High 630 No data
Chicxulub, Progreso (AGEB 025-3) 1.00 0.67 0.11 0.18 0.83 0.11 0.18 0.491 High 1 248 No data
Chicxulub, Progreso (AGEB 065-8) 1.00 0.67 0.13 0.16 0.83 0.13 0.16 0.489 High 173 No data
Chicxulub, Progreso (AGEB 066-2) 1.00 0.67 0.04 0.15 0.83 0.04 0.15 0.464 High 587 No data
Chicxulub, Progreso (AGEB 056-9) 1.00 0.67 0.05 0.13 0.83 0.05 0.13 0.461 High 1 248 No data
Chicxulub, Progreso (AGEB 086-A) 1.00 0.67 0.00 0.17 0.83 0.00 0.17 0.458 High 61 No data
Chelem, Progreso (AGEB 069-6) 1.00 0.67 0.05 0.11 0.83 0.05 0.11 0.456 High 706 No data
Chelem, Progreso (AGEB 055-4) 1.00 0.67 0.03 0.11 0.83 0.03 0.11 0.452 High 1 184 No data
Kanasín, Kanasín (AGEB 042-2) 0.14 0.00 1.00 0.67 0.07 1.00 0.67 0.451 High 11 No data
Kanasín, Kanasín (AGEB 044-1) 0.14 0.00 0.67 1.00 0.07 0.67 1.00 0.451 High 10 No data
Chicxulub, Progreso (AGEB 057-3) 1.00 0.67 0.04 0.08 0.83 0.04 0.08 0.447 High 1 356 No data
Chelem, Progreso (AGEB 022-A) 1.00 0.67 0.00 0.00 0.83 0.00 0.00 0.417 High 13 No data
Chelem, Progreso (AGEB 084-0) 1.00 0.67 0.00 0.00 0.83 0.00 0.00 0.417 High 13 No data
Kanasín, Kanasín (AGEB 030-A) 0.14 0.00 1.00 0.50 0.07 1.00 0.50 0.409 High 24 No data
Kanasín, Kanasín (AGEB 045-6) 0.14 0.00 0.96 0.50 0.07 0.96 0.50 0.399 High 101 No data
Mérida, Mérida (AGEB 487-1) 0.14 0.00 0.96 0.41 0.07 0.96 0.41 0.377 High 177 No data
Mérida, Mérida (AGEB 475-9) 0.14 0.00 0.88 0.44 0.07 0.88 0.44 0.364 High 103 No data
Progreso, Progreso (AGEB 061-A) 1.00 0.00 0.02 0.43 0.50 0.02 0.43 0.362 High 559 No data
Chuburná, Progreso (AGEB 091-0) 1.00 0.00 0.00 0.44 0.50 0.00 0.44 0.361 High 26 No data
El Paraíso, Progreso 0.00 0.67 0.51 0.25 0.33 0.51 0.25 0.355 Intermediate 285 1.16
Continues

30 REALIDAD, DATOS Y ESPACIO REVISTA INTERNACIONAL DE ESTADÍSTICA Y GEOGRAFÍA
Appendix A
Indexed sub-component, principal component and WAVI values for units of analysis in Merida Metropolitan Area
Units of Analysis indexRV indexSI indexWD indexUP EXP SEN ADC WAVI Vulnerabi-lity level
At Risk Population
(2005)
Growth rate 2000-
2005Kanasín, Kanasín (AGEB 033-3) 0.14 0.00 0.95 0.29 0.07 0.95 0.29 0.344 Intermediate 81 No data
Kanasín, Kanasín (AGEB 041-8) 0.14 0.00 0.60 0.60 0.07 0.60 0.60 0.334 Intermediate 29 No data
Mérida, Mérida (AGEB 447-7) 0.14 0.00 1.00 0.14 0.07 1.00 0.14 0.320 Intermediate 94 No data
Mérida, Mérida (AGEB 498-A) 0.14 0.00 1.00 0.13 0.07 1.00 0.13 0.316 Intermediate 49 No data
Chuburná, Progreso (AGEB 090-6) 1.00 0.00 0.07 0.19 0.50 0.07 0.19 0.314 Intermediate 635 No data
Progreso, Progreso (AGEB 027-2) 1.00 0.00 0.25 0.00 0.50 0.25 0.00 0.313 Intermediate 27 No data
Progreso, Progreso (AGEB 087-4) 1.00 0.00 0.07 0.15 0.50 0.07 0.15 0.307 Intermediate 499 No data
Mérida, Mérida (AGEB 345-A) 0.14 0.00 0.89 0.17 0.07 0.89 0.17 0.300 Intermediate 196 No data
Chuburná, Progreso (AGEB 089-3) 1.00 0.00 0.01 0.17 0.50 0.01 0.17 0.295 Intermediate 1 041 No data
Progreso, Progreso (AGEB 053-5) 1.00 0.00 0.04 0.13 0.50 0.04 0.13 0.294 Intermediate 3 212 No data
Mérida, Mérida (AGEB 387-3) 0.14 0.00 0.71 0.32 0.07 0.71 0.32 0.292 Intermediate 230 No data
Progreso, Progreso (AGEB 073-2) 1.00 0.00 0.01 0.15 0.50 0.01 0.15 0.289 Intermediate 1 030 No data
Noc Ac, Mérida 0.43 0.33 0.15 0.24 0.38 0.15 0.24 0.289 Intermediate 437 2.20
Progreso, Progreso (AGEB 063-9) 1.00 0.00 0.03 0.12 0.50 0.03 0.12 0.289 Intermediate 1 109 No data
Mérida, Mérida (AGEB 492-2) 0.14 0.00 1.00 0.00 0.07 1.00 0.00 0.284 Intermediate 6 No data
Mérida, Mérida (AGEB 497-5) 0.14 0.00 0.89 0.11 0.07 0.89 0.11 0.284 Intermediate 62 No data
Progreso, Progreso (AGEB 076-6) 1.00 0.00 0.03 0.11 0.50 0.03 0.11 0.283 Intermediate 1 586 No data
Progreso, Progreso (AGEB 051-6) 1.00 0.00 0.03 0.09 0.50 0.03 0.09 0.281 Intermediate 3 957 No data
Progreso, Progreso (AGEB 044-6) 1.00 0.00 0.04 0.09 0.50 0.04 0.09 0.281 Intermediate 3 244 No data
Progreso, Progreso (AGEB 075-1) 1.00 0.00 0.02 0.10 0.50 0.02 0.10 0.281 Intermediate 1 409 No data
San Ignacio Tesip, Mérida 0.46 0.00 0.34 0.31 0.23 0.34 0.31 0.280 Intermediate 329 2.56
Progreso, Progreso (AGEB 049-9) 1.00 0.00 0.02 0.09 0.50 0.02 0.09 0.278 Intermediate 2 649 No data
Progreso, Progreso (AGEB 071-3) 1.00 0.00 0.00 0.11 0.50 0.00 0.11 0.277 Intermediate 523 No data
Progreso, Progreso (AGEB 077-0) 1.00 0.00 0.02 0.09 0.50 0.02 0.09 0.277 Intermediate 691 No data
Progreso, Progreso (AGEB 074-7) 1.00 0.00 0.01 0.09 0.50 0.01 0.09 0.276 Intermediate 1 146 No data
Progreso, Progreso (AGEB 072-8) 1.00 0.00 0.02 0.07 0.50 0.02 0.07 0.273 Intermediate 1 123 No data
Progreso, Progreso (AGEB 064-3) 1.00 0.00 0.02 0.07 0.50 0.02 0.07 0.273 Intermediate 933 No data
Progreso, Progreso (AGEB 045-0) 1.00 0.00 0.02 0.07 0.50 0.02 0.07 0.272 Intermediate 3 533 No data
Progreso, Progreso (AGEB 052-0) 1.00 0.00 0.01 0.08 0.50 0.01 0.08 0.271 Intermediate 687 No data
Campestre Flamboyanes, Progreso 0.00 1.00 0.03 0.02 0.50 0.03 0.02 0.264 Intermediate 3 022 -1.92
Kikteil, Mérida 0.38 0.33 0.07 0.26 0.36 0.07 0.26 0.262 Intermediate 216 0.66
Progreso, Progreso (AGEB 046-5) 1.00 0.00 0.01 0.04 0.50 0.01 0.04 0.262 Intermediate 731 No data
Progreso, Progreso (AGEB 047-A) 1.00 0.00 0.01 0.04 0.50 0.01 0.04 0.261 Intermediate 3 538 No data
Progreso, Progreso (AGEB 050-1) 1.00 0.00 0.01 0.02 0.50 0.01 0.02 0.258 Intermediate 2 166 No data
Progreso, Progreso (AGEB 060-5) 1.00 0.00 0.00 0.03 0.50 0.00 0.03 0.257 Intermediate 520 No data
Progreso, Progreso (AGEB 048-4) 1.00 0.00 0.01 0.02 0.50 0.01 0.02 0.256 Intermediate 638 No data
Mérida, Mérida (AGEB 428-4) 0.14 0.00 0.79 0.09 0.07 0.79 0.09 0.254 Intermediate 135 No data
Mérida, Mérida (AGEB 493-7) 0.14 0.00 0.63 0.25 0.07 0.63 0.25 0.253 Intermediate 28 No data
Mérida, Mérida (AGEB 360-4) 0.14 0.00 0.56 0.30 0.07 0.56 0.30 0.250 Intermediate 425 No data
Mérida, Mérida (AGEB 458-5) 0.14 0.00 0.86 0.00 0.07 0.86 0.00 0.249 Intermediate 80 No data
Mérida, Mérida (AGEB 480-A) 0.14 0.00 0.57 0.29 0.07 0.57 0.29 0.249 Intermediate 21 No data
Mérida, Mérida (AGEB 427-A) 0.14 0.00 0.67 0.17 0.07 0.67 0.17 0.243 Intermediate 117 No data
Continues

31Vol. 4 Núm. 1 enero-abril 2013
Appendix A
Indexed sub-component, principal component and WAVI values for units of analysis in Merida Metropolitan Area
Units of Analysis indexRV indexSI indexWD indexUP EXP SEN ADC WAVI Vulnerabi-lity level
At Risk Population
(2005)
Growth rate 2000-
2005Dzidzilché, Mérida 0.00 0.67 0.11 0.19 0.33 0.11 0.19 0.241 Intermediate 153 -8.91
Mérida, Mérida (AGEB 349-8) 0.14 0.00 0.58 0.24 0.07 0.58 0.24 0.241 Intermediate 1.050 No data
Hotzuc, Umán 0.46 0.00 0.08 0.42 0.23 0.08 0.42 0.241 Intermediate 265 -1.65
San Antonio Hool, Mérida 0.43 0.00 0.07 0.47 0.21 0.07 0.47 0.240 Intermediate 135 4.76
Mérida, Mérida (AGEB 348-3) 0.14 0.00 0.44 0.36 0.07 0.44 0.36 0.235 Intermediate 523 No data
Umán, Umán (AGEB 032-9) 0.14 0.00 0.40 0.40 0.07 0.40 0.40 0.234 Intermediate 27 No data
San Ignacio, Progreso 0.00 0.67 0.19 0.08 0.33 0.19 0.08 0.234 Intermediate 767 1.13
Kanasín, Kanasín (AGEB 021-0) 0.14 0.00 0.58 0.20 0.07 0.58 0.20 0.228 Intermediate 814 No data
Umán, Umán (AGEB 038-6) 0.14 0.00 0.18 0.59 0.07 0.18 0.59 0.226 Intermediate 68 No data
Mérida, Mérida (AGEB 496-0) 0.14 0.00 0.75 0.00 0.07 0.75 0.00 0.222 Intermediate 28 No data
Sierra Papacal, Mérida 0.38 0.33 0.04 0.13 0.36 0.04 0.13 0.221 Intermediate 986 0.49
San Pedro Chimay, Mérida 0.46 0.00 0.10 0.32 0.23 0.10 0.32 0.220 Intermediate 1 012 1.70
Yaxnic, Mérida 0.46 0.00 0.09 0.31 0.23 0.09 0.31 0.216 Intermediate 703 1.46
Hunxectamán, Mérida 0.46 0.00 0.10 0.30 0.23 0.10 0.30 0.216 Intermediate 104 -6.17
Cheumán, Mérida 0.43 0.00 0.28 0.13 0.21 0.28 0.13 0.207 Intermediate 197 1.05
San José Tzal, Mérida 0.46 0.00 0.15 0.21 0.23 0.15 0.21 0.205 Intermediate 3 092 1.64
Kanasín, Kanasín (AGEB 039-0) 0.14 0.00 0.30 0.38 0.07 0.30 0.38 0.203 Intermediate 172 No data
Ucú, Ucú 0.43 0.00 0.23 0.14 0.21 0.23 0.14 0.199 Intermediate 2 360 2.01
Petac, Mérida 0.46 0.00 0.03 0.31 0.23 0.03 0.31 0.199 Intermediate 183 -0.75
Xmatkuil, Mérida 0.46 0.00 0.11 0.22 0.23 0.11 0.22 0.199 Intermediate 357 1.22
Mérida, Mérida (AGEB 350-0) 0.14 0.00 0.22 0.42 0.07 0.22 0.42 0.196 Intermediate 1 342 No data
Caucel, Mérida 0.43 0.00 0.22 0.13 0.21 0.22 0.13 0.193 Intermediate 6 655 2.03
Tamanché, Mérida 0.23 0.33 0.13 0.08 0.28 0.13 0.08 0.192 Intermediate 555 3.29
Kanasín, Kanasín (AGEB 040-3) 0.14 0.00 0.38 0.25 0.07 0.38 0.25 0.191 Intermediate 141 No data
Mérida, Mérida (AGEB 359-1) 0.14 0.00 0.56 0.06 0.07 0.56 0.06 0.191 Intermediate 77 No data
San Antonio Tzacalá, Mérida 0.46 0.00 0.01 0.29 0.23 0.01 0.29 0.190 Intermediate 618 -0.19
Tahdzibichén, Mérida 0.46 0.00 0.06 0.23 0.23 0.06 0.23 0.189 Intermediate 678 2.14
Suytunchén, Mérida 0.38 0.33 0.00 0.04 0.36 0.00 0.04 0.188 Intermediate 92 -3.16
Yaxcopoil, Umán 0.46 0.00 0.07 0.21 0.23 0.07 0.21 0.188 Intermediate 1 102 1.28
Mérida, Mérida (AGEB 459-A) 0.14 0.00 0.57 0.04 0.07 0.57 0.04 0.187 Intermediate 695 No data
Molas, Mérida 0.46 0.00 0.08 0.20 0.23 0.08 0.20 0.186 Intermediate 1 859 0.91
Dzibilchaltún, Mérida 0.26 0.33 0.11 0.03 0.29 0.11 0.03 0.182 Intermediate 156 -0.25
Poxilá, Umán 0.14 0.00 0.19 0.38 0.07 0.19 0.38 0.179 Intermediate 801 1.76
Mérida, Mérida (AGEB 155-7) 0.14 0.00 0.52 0.05 0.07 0.52 0.05 0.176 Intermediate 512 No data
Tixcuytún, Mérida 0.43 0.00 0.13 0.14 0.21 0.13 0.14 0.175 Intermediate 348 1.19
Dzibikak, Umán 0.14 0.00 0.11 0.45 0.07 0.11 0.45 0.175 Intermediate 1 238 2.98
Conkal, Conkal 0.43 0.00 0.17 0.09 0.21 0.17 0.09 0.171 Intermediate 6 620 1.92
Texán Cámara, Mérida 0.46 0.00 0.02 0.20 0.23 0.02 0.20 0.171 Intermediate 483 2.30
Mérida, Mérida (AGEB 478-2) 0.14 0.00 0.00 0.54 0.07 0.00 0.54 0.170 Intermediate 211 No data
San Antonio Tehuitz, Kanasín 0.46 0.00 0.03 0.18 0.23 0.03 0.18 0.168 Intermediate 732 2.31
Petec Biltún, Umán 0.31 0.00 0.06 0.30 0.15 0.06 0.30 0.167 Intermediate 155 4.23
Kantoyna, Conkal 0.07 0.33 0.04 0.22 0.20 0.04 0.22 0.167 Intermediate 133 -0.30
Continues
32 REALIDAD, DATOS Y ESPACIO REVISTA INTERNACIONAL DE ESTADÍSTICA Y GEOGRAFÍA
Appendix A
Indexed sub-component, principal component and WAVI values for units of analysis in Merida Metropolitan Area
Units of Analysis indexRV indexSI indexWD indexUP EXP SEN ADC WAVI Vulnerabi-lity level
At Risk Population
(2005)
Growth rate 2000-
2005Dzityá, Mérida 0.43 0.00 0.13 0.11 0.21 0.13 0.11 0.167 Intermediate 1 496 3.86
Dzoyaxché, Mérida 0.14 0.00 0.13 0.40 0.07 0.13 0.40 0.167 Intermediate 412 2.40
Komchén, Mérida 0.07 0.33 0.11 0.13 0.20 0.11 0.13 0.162 Intermediate 3 778 1.35
Taníl, Umán 0.14 0.00 0.13 0.37 0.07 0.13 0.37 0.161 Intermediate 427 1.11
Mérida, Mérida (AGEB 471-0) 0.14 0.00 0.11 0.39 0.07 0.11 0.39 0.159 Intermediate 367 No data
Umán, Umán (AGEB 030-A) 0.14 0.00 0.50 0.00 0.07 0.50 0.00 0.159 Intermediate 59 No data
Xcunyá, Mérida 0.07 0.33 0.11 0.12 0.20 0.11 0.12 0.159 Intermediate 837 2.08
Umán, Umán (AGEB 019-3) 0.14 0.00 0.33 0.16 0.07 0.33 0.16 0.157 Intermediate 2 480 No data
Mérida, Mérida (AGEB 362-3) 0.14 0.00 0.20 0.29 0.07 0.20 0.29 0.156 Intermediate 1 612 No data
Mérida, Mérida (AGEB 363-8) 0.14 0.00 0.15 0.33 0.07 0.15 0.33 0.155 Intermediate 2 735 No data
La Ceiba, Mérida 0.26 0.33 0.03 0.00 0.29 0.03 0.00 0.154 Intermediate 1 023 3.53
Mérida, Mérida (AGEB 401-5) 0.14 0.00 0.28 0.19 0.07 0.28 0.19 0.154 Intermediate 909 No data
Kanasín, Kanasín (AGEB 046-0) 0.14 0.00 0.23 0.25 0.07 0.23 0.25 0.153 Intermediate 1 002 No data
Bolón, Umán 0.14 0.00 0.11 0.34 0.07 0.11 0.34 0.148 Intermediate 1 271 2.69
Mérida, Mérida (AGEB 435-4) 0.14 0.00 0.17 0.29 0.07 0.17 0.29 0.148 Intermediate 279 No data
Cosgaya, Mérida 0.07 0.33 0.07 0.11 0.20 0.07 0.11 0.146 Intermediate 584 1.50
Sac-Nicté, Mérida 0.07 0.33 0.03 0.14 0.20 0.03 0.14 0.145 Intermediate 278 0.96
Xcucul Sur, Umán 0.14 0.00 0.15 0.29 0.07 0.15 0.29 0.144 Intermediate 401 3.17
Cholul, Mérida 0.28 0.00 0.22 0.07 0.14 0.22 0.07 0.144 Intermediate 5 161 3.06
Temozón Norte, Mérida 0.43 0.00 0.07 0.07 0.21 0.07 0.07 0.144 Intermediate 270 1.55
Yaxché de Peón, Ucú 0.43 0.00 0.07 0.08 0.21 0.07 0.08 0.142 Intermediate 691 -0.90
Mérida, Mérida (AGEB 434-A) 0.14 0.00 0.00 0.43 0.07 0.00 0.43 0.142 Intermediate 41 No data
Mérida, Mérida (AGEB 386-9) 0.14 0.00 0.17 0.25 0.07 0.17 0.25 0.141 Intermediate 410 No data
Mérida, Mérida (AGEB 500-9) 0.14 0.00 0.29 0.14 0.07 0.29 0.14 0.141 Intermediate 592 No data
Xcanatún, Mérida 0.43 0.00 0.06 0.07 0.21 0.06 0.07 0.140 Intermediate 1 350 2.54
Kanasín, Kanasín (AGEB 022-5) 0.14 0.00 0.16 0.26 0.07 0.16 0.26 0.140 Intermediate 1 091 No data
Mérida, Mérida (AGEB 383-5) 0.14 0.00 0.06 0.35 0.07 0.06 0.35 0.139 Intermediate 150 No data
Kanasín, Kanasín (AGEB 034-8) 0.14 0.00 0.19 0.22 0.07 0.19 0.22 0.137 Low 454 No data
Susulá, Mérida 0.14 0.00 0.14 0.26 0.07 0.14 0.26 0.135 Low 447 2.66
Umán, Umán (AGEB 031-4) 0.14 0.00 0.34 0.07 0.07 0.34 0.07 0.135 Low 436 No data
Leona Vicario, Mérida 0.14 0.00 0.22 0.18 0.07 0.22 0.18 0.134 Low 1 822 4.64
Opichén, Mérida 0.14 0.00 0.15 0.25 0.07 0.15 0.25 0.134 Low 327 17.18
Dzununcán, Mérida 0.14 0.00 0.14 0.26 0.07 0.14 0.26 0.134 Low 1 528 2.15
Mérida, Mérida (AGEB 402-A) 0.14 0.00 0.19 0.20 0.07 0.19 0.20 0.132 Low 1 171 No data
Mérida, Mérida (AGEB 308-9) 0.14 0.00 0.21 0.18 0.07 0.21 0.18 0.131 Low 1 432 No data
Santa María Chí, Mérida 0.14 0.00 0.14 0.24 0.07 0.14 0.24 0.129 Low 328 0.81
Teya, Kanasín 0.31 0.00 0.03 0.17 0.15 0.03 0.17 0.129 Low 554 3.39
Kanasín, Kanasín (AGEB 032-9) 0.14 0.00 0.16 0.22 0.07 0.16 0.22 0.128 Low 1 497 No data
Tixcacal, Mérida 0.14 0.00 0.15 0.23 0.07 0.15 0.23 0.128 Low 765 3.19
Santa Cruz Palomeque, Mérida 0.14 0.00 0.20 0.18 0.07 0.20 0.18 0.127 Low 718 4.84
Mérida, Mérida (AGEB 516-A) 0.14 0.00 0.09 0.28 0.07 0.09 0.28 0.126 Low 2 016 No data
Kanasín, Kanasín (AGEB 026-3) 0.14 0.00 0.15 0.21 0.07 0.15 0.21 0.125 Low 1 579 No data
Continues

33Vol. 4 Núm. 1 enero-abril 2013
Appendix A
Indexed sub-component, principal component and WAVI values for units of analysis in Merida Metropolitan Area
Units of Analysis indexRV indexSI indexWD indexUP EXP SEN ADC WAVI Vulnerabi-lity level
At Risk Population
(2005)
Growth rate 2000-
2005Mérida, Mérida (AGEB 224-A) 0.14 0.00 0.16 0.20 0.07 0.16 0.20 0.124 Low 1 787 No data
San Antonio Chum, Umán 0.14 0.00 0.14 0.22 0.07 0.14 0.22 0.124 Low 866 2.22
Umán, Umán (AGEB 018-9) 0.14 0.00 0.22 0.13 0.07 0.22 0.13 0.123 Low 3 758 No data
Mérida, Mérida (AGEB 429-9) 0.14 0.00 0.15 0.19 0.07 0.15 0.19 0.121 Low 112 No data
Oxcum, Umán 0.14 0.00 0.08 0.27 0.07 0.08 0.27 0.120 Low 1 049 1.12
Kanasín, Kanasín (AGEB 024-4) 0.14 0.00 0.12 0.22 0.07 0.12 0.22 0.118 Low 1 068 No data
Kanasín, Kanasín (AGEB 031-4) 0.14 0.00 0.11 0.22 0.07 0.11 0.22 0.118 Low 1 042 No data
Kanasín, Kanasín (AGEB 047-5) 0.14 0.00 0.14 0.19 0.07 0.14 0.19 0.117 Low 1 424 No data
Oxholón, Umán 0.14 0.00 0.03 0.29 0.07 0.03 0.29 0.114 Low 797 0.77
Mérida, Mérida (AGEB 400-0) 0.14 0.00 0.11 0.20 0.07 0.11 0.20 0.111 Low 2 322 No data
Ticimul, Umán 0.14 0.00 0.05 0.26 0.07 0.05 0.26 0.110 Low 783 3.38
Chalmuch, Mérida 0.14 0.00 0.10 0.20 0.07 0.10 0.20 0.109 Low 454 3.57
Mérida, Mérida (AGEB 366-1) 0.14 0.00 0.21 0.09 0.07 0.21 0.09 0.109 Low 602 No data
Mérida, Mérida (AGEB 361-9) 0.14 0.00 0.07 0.23 0.07 0.07 0.23 0.107 Low 2 415 No data
Mérida, Mérida (AGEB 344-5) 0.14 0.00 0.06 0.23 0.07 0.06 0.23 0.107 Low 864 No data
Mérida, Mérida (AGEB 460-2) 0.14 0.00 0.29 0.00 0.07 0.29 0.00 0.107 Low 362 No data
Mérida, Mérida (AGEB 472-5) 0.14 0.00 0.08 0.21 0.07 0.08 0.21 0.106 Low 2 567 No data
Mérida, Mérida (AGEB 307-4) 0.14 0.00 0.10 0.18 0.07 0.10 0.18 0.105 Low 1 749 No data
Chablekal, Mérida 0.26 0.00 0.11 0.05 0.13 0.11 0.05 0.105 Low 3 165 2.60
Mérida, Mérida (AGEB 504-7) 0.14 0.00 0.09 0.18 0.07 0.09 0.18 0.103 Low 1 157 No data
Xtepén, Umán 0.14 0.00 0.09 0.18 0.07 0.09 0.18 0.102 Low 485 -0.88
Oncán, Mérida 0.14 0.00 0.11 0.16 0.07 0.11 0.16 0.101 Low 606 0.17
Mérida, Mérida (AGEB 311-0) 0.14 0.00 0.06 0.20 0.07 0.06 0.20 0.100 Low 2 588 No data
Kanasín, Kanasín (AGEB 023-A) 0.14 0.00 0.13 0.13 0.07 0.13 0.13 0.099 Low 1 435 No data
Mérida, Mérida (AGEB 329-0) 0.14 0.00 0.10 0.16 0.07 0.10 0.16 0.099 Low 2 645 No data
Mérida, Mérida (AGEB 515-5) 0.14 0.00 0.07 0.19 0.07 0.07 0.19 0.098 Low 2 811 No data
Kanasín, Kanasín (AGEB 025-9) 0.14 0.00 0.09 0.16 0.07 0.09 0.16 0.097 Low 1 249 No data
Mérida, Mérida (AGEB 499-4) 0.14 0.00 0.18 0.07 0.07 0.18 0.07 0.096 Low 643 No data
X-Cuyum, Conkal 0.14 0.00 0.05 0.19 0.07 0.05 0.19 0.094 Low 1 490 2.19
Tebec, Umán 0.14 0.00 0.03 0.20 0.07 0.03 0.20 0.091 Low 459 1.99
Mérida, Mérida (AGEB 396-2) 0.14 0.00 0.13 0.10 0.07 0.13 0.10 0.091 Low 738 No data
Mérida, Mérida (AGEB 312-5) 0.14 0.00 0.07 0.15 0.07 0.07 0.15 0.091 Low 2 405 No data
Kanasín, Kanasín (AGEB 027-8) 0.14 0.00 0.02 0.20 0.07 0.02 0.20 0.090 Low 4 069 No data
Mérida, Mérida (AGEB 358-7) 0.14 0.00 0.00 0.22 0.07 0.00 0.22 0.090 Low 42 No data
Kanasín, Kanasín (AGEB 037-1) 0.14 0.00 0.10 0.11 0.07 0.10 0.11 0.088 Low 1 023 No data
Kanasín, Kanasín (AGEB 007-0) 0.14 0.00 0.08 0.14 0.07 0.08 0.14 0.088 Low 1 974 No data
Kanasín, Kanasín (AGEB 036-7) 0.14 0.00 0.11 0.10 0.07 0.11 0.10 0.087 Low 1 376 No data
Mérida, Mérida (AGEB 324-8) 0.14 0.00 0.09 0.11 0.07 0.09 0.11 0.086 Low 2 489 No data
Mérida, Mérida (AGEB 468-9) 0.14 0.00 0.09 0.12 0.07 0.09 0.12 0.085 Low 2 079 No data
Mérida, Mérida (AGEB 154-2) 0.14 0.00 0.19 0.01 0.07 0.19 0.01 0.085 Low 989 No data
Mérida, Mérida (AGEB 199-A) 0.14 0.00 0.12 0.08 0.07 0.12 0.08 0.085 Low 752 No data
Yaxché Casares, Mérida 0.14 0.00 0.00 0.20 0.07 0.00 0.20 0.084 Low 50 -8.97
Continues

34 REALIDAD, DATOS Y ESPACIO REVISTA INTERNACIONAL DE ESTADÍSTICA Y GEOGRAFÍA
Appendix A
Indexed sub-component, principal component and WAVI values for units of analysis in Merida Metropolitan Area
Units of Analysis indexRV indexSI indexWD indexUP EXP SEN ADC WAVI Vulnerabi-lity level
At Risk Population
(2005)
Growth rate 2000-
2005Mérida, Mérida (AGEB 151-9) 0.14 0.00 0.12 0.08 0.07 0.12 0.08 0.084 Low 2 255 No data
Mérida, Umán 0.14 0.00 0.12 0.08 0.07 0.12 0.08 0.084 Low 8 865 2.16
Mérida, Mérida (AGEB 157-6) 0.14 0.00 0.18 0.02 0.07 0.18 0.02 0.084 Low 1 190 No data
Hunxectamán, Umán 0.14 0.00 0.05 0.15 0.07 0.05 0.15 0.083 Low 250 -0.08
Mérida, Mérida (AGEB 353-4) 0.14 0.00 0.05 0.14 0.07 0.05 0.14 0.082 Low 1 846 No data
Mérida, Mérida (AGEB 469-3) 0.14 0.00 0.06 0.13 0.07 0.06 0.13 0.082 Low 1 807 No data
Umán, Umán (AGEB 034-8) 0.14 0.00 0.07 0.11 0.07 0.07 0.11 0.081 Low 2 827 No data
Mérida, Mérida (AGEB 334-1) 0.14 0.00 0.07 0.11 0.07 0.07 0.11 0.081 Low 1 081 No data
Mérida, Mérida (AGEB 340-7) 0.14 0.00 0.06 0.13 0.07 0.06 0.13 0.081 Low 1 110 No data
Mérida, Mérida (AGEB 321-4) 0.14 0.00 0.02 0.16 0.07 0.02 0.16 0.080 Low 1 316 No data
Mérida, Mérida (AGEB 275-2) 0.14 0.00 0.04 0.14 0.07 0.04 0.14 0.079 Low 1 824 No data
Mérida, Mérida (AGEB 367-6) 0.14 0.00 0.15 0.02 0.07 0.15 0.02 0.079 Low 534 No data
Mérida, Mérida (AGEB 479-7) 0.14 0.00 0.06 0.12 0.07 0.06 0.12 0.079 Low 71 No data
Mérida, Mérida (AGEB 184-3) 0.14 0.00 0.07 0.11 0.07 0.07 0.11 0.078 Low 5 737 No data
Mérida, Mérida (AGEB 416-1) 0.14 0.00 0.05 0.12 0.07 0.05 0.12 0.077 Low 1 744 No data
Kanasín, Kanasín (AGEB 016-A) 0.14 0.00 0.03 0.14 0.07 0.03 0.14 0.076 Low 6 847 No data
Mérida, Mérida (AGEB 245-1) 0.14 0.00 0.07 0.09 0.07 0.07 0.09 0.075 Low 1 130 No data
Mérida, Mérida (AGEB 298-3) 0.14 0.00 0.07 0.09 0.07 0.07 0.09 0.074 Low 2 485 No data
Mérida, Mérida (AGEB 229-2) 0.14 0.00 0.07 0.09 0.07 0.07 0.09 0.074 Low 1 666 No data
Mérida, Mérida (AGEB 305-5) 0.14 0.00 0.08 0.08 0.07 0.08 0.08 0.073 Low 2 213 No data
Mérida, Mérida (AGEB 512-1) 0.14 0.00 0.06 0.10 0.07 0.06 0.10 0.073 Low 1 977 No data
Mérida, Mérida (AGEB 365-7) 0.14 0.00 0.04 0.11 0.07 0.04 0.11 0.073 Low 842 No data
Mérida, Mérida (AGEB 398-1) 0.14 0.00 0.08 0.07 0.07 0.08 0.07 0.073 Low 1 131 No data
Mérida, Mérida (AGEB 503-2) 0.14 0.00 0.04 0.11 0.07 0.04 0.11 0.072 Low 1 736 No data
Mérida, Mérida (AGEB 320-A) 0.14 0.00 0.06 0.09 0.07 0.06 0.09 0.072 Low 1 322 No data
Mérida, Mérida (AGEB 473-A) 0.14 0.00 0.05 0.10 0.07 0.05 0.10 0.072 Low 1 835 No data
Kanasín, Kanasín (AGEB 028-2) 0.14 0.00 0.01 0.14 0.07 0.01 0.14 0.072 Low 3 292 No data
Sitpach, Mérida 0.14 0.00 0.07 0.08 0.07 0.07 0.08 0.071 Low 1 502 2.60
Mérida, Mérida (AGEB 185-8) 0.14 0.00 0.06 0.08 0.07 0.06 0.08 0.071 Low 3 680 No data
Mérida, Mérida (AGEB 328-6) 0.14 0.00 0.07 0.08 0.07 0.07 0.08 0.070 Low 2 777 No data
Kanasín, Kanasín (AGEB 009-A) 0.14 0.00 0.05 0.10 0.07 0.05 0.10 0.070 Low 3 797 No data
Mérida, Mérida (AGEB 270-A) 0.14 0.00 0.06 0.08 0.07 0.06 0.08 0.070 Low 1 633 No data
Umán, Umán (AGEB 033-3) 0.14 0.00 0.04 0.10 0.07 0.04 0.10 0.069 Low 3 142 No data
Mérida, Mérida (AGEB 276-7) 0.14 0.00 0.02 0.12 0.07 0.02 0.12 0.069 Low 1 899 No data
Umán, Umán (AGEB 020-6) 0.14 0.00 0.05 0.09 0.07 0.05 0.09 0.069 Low 4 638 No data
Mérida, Mérida (AGEB 339-4) 0.14 0.00 0.03 0.10 0.07 0.03 0.10 0.068 Low 1 608 No data
Mérida, Mérida (AGEB 078-A) 0.14 0.00 0.06 0.07 0.07 0.06 0.07 0.067 Low 649 No data
Mérida, Mérida (AGEB 281-8) 0.14 0.00 0.02 0.10 0.07 0.02 0.10 0.066 Low 2 675 No data
Mérida, Mérida (AGEB 369-5) 0.14 0.00 0.03 0.09 0.07 0.03 0.09 0.066 Low 1 095 No data
Mérida, Mérida (AGEB 208-0) 0.14 0.00 0.05 0.08 0.07 0.05 0.08 0.065 Low 1 693 No data
Mérida, Mérida (AGEB 464-0) 0.14 0.00 0.09 0.03 0.07 0.09 0.03 0.065 Low 1 438 No data
Umán, Umán (AGEB 016-A) 0.14 0.00 0.05 0.07 0.07 0.05 0.07 0.065 Low 3 762 No data
Continues
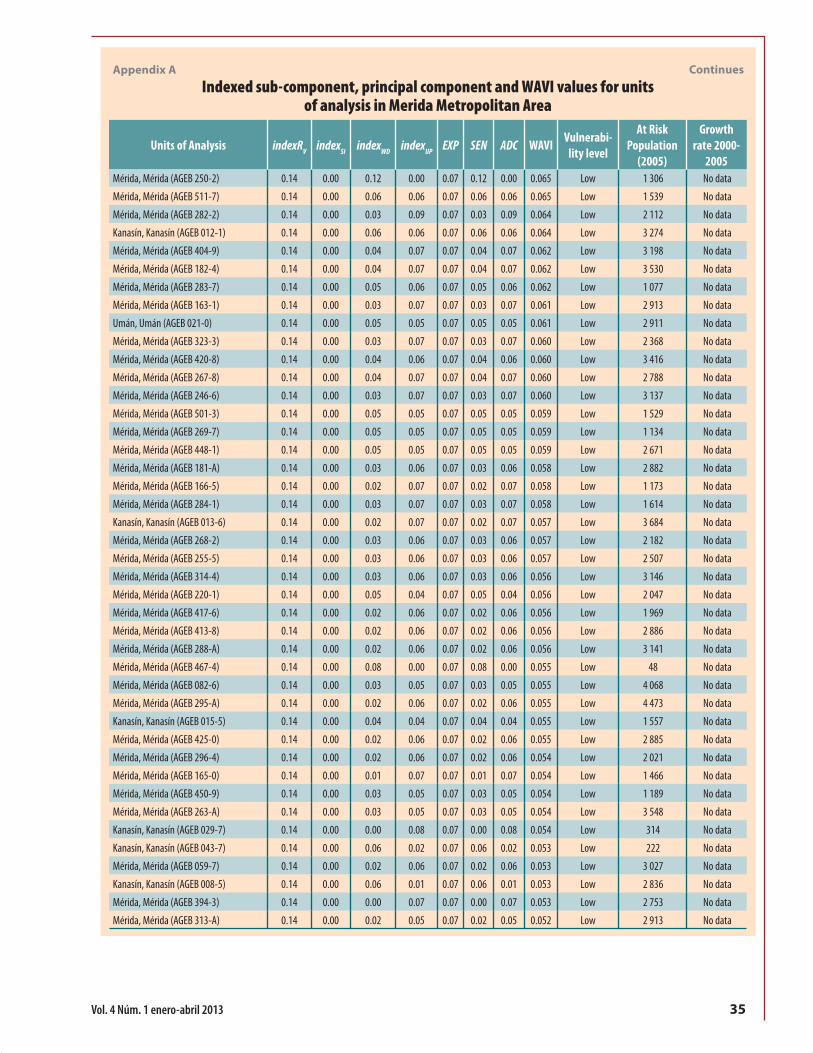
35Vol. 4 Núm. 1 enero-abril 2013
Appendix A
Indexed sub-component, principal component and WAVI values for units of analysis in Merida Metropolitan Area
Units of Analysis indexRV indexSI indexWD indexUP EXP SEN ADC WAVI Vulnerabi-lity level
At Risk Population
(2005)
Growth rate 2000-
2005Mérida, Mérida (AGEB 250-2) 0.14 0.00 0.12 0.00 0.07 0.12 0.00 0.065 Low 1 306 No data
Mérida, Mérida (AGEB 511-7) 0.14 0.00 0.06 0.06 0.07 0.06 0.06 0.065 Low 1 539 No data
Mérida, Mérida (AGEB 282-2) 0.14 0.00 0.03 0.09 0.07 0.03 0.09 0.064 Low 2 112 No data
Kanasín, Kanasín (AGEB 012-1) 0.14 0.00 0.06 0.06 0.07 0.06 0.06 0.064 Low 3 274 No data
Mérida, Mérida (AGEB 404-9) 0.14 0.00 0.04 0.07 0.07 0.04 0.07 0.062 Low 3 198 No data
Mérida, Mérida (AGEB 182-4) 0.14 0.00 0.04 0.07 0.07 0.04 0.07 0.062 Low 3 530 No data
Mérida, Mérida (AGEB 283-7) 0.14 0.00 0.05 0.06 0.07 0.05 0.06 0.062 Low 1 077 No data
Mérida, Mérida (AGEB 163-1) 0.14 0.00 0.03 0.07 0.07 0.03 0.07 0.061 Low 2 913 No data
Umán, Umán (AGEB 021-0) 0.14 0.00 0.05 0.05 0.07 0.05 0.05 0.061 Low 2 911 No data
Mérida, Mérida (AGEB 323-3) 0.14 0.00 0.03 0.07 0.07 0.03 0.07 0.060 Low 2 368 No data
Mérida, Mérida (AGEB 420-8) 0.14 0.00 0.04 0.06 0.07 0.04 0.06 0.060 Low 3 416 No data
Mérida, Mérida (AGEB 267-8) 0.14 0.00 0.04 0.07 0.07 0.04 0.07 0.060 Low 2 788 No data
Mérida, Mérida (AGEB 246-6) 0.14 0.00 0.03 0.07 0.07 0.03 0.07 0.060 Low 3 137 No data
Mérida, Mérida (AGEB 501-3) 0.14 0.00 0.05 0.05 0.07 0.05 0.05 0.059 Low 1 529 No data
Mérida, Mérida (AGEB 269-7) 0.14 0.00 0.05 0.05 0.07 0.05 0.05 0.059 Low 1 134 No data
Mérida, Mérida (AGEB 448-1) 0.14 0.00 0.05 0.05 0.07 0.05 0.05 0.059 Low 2 671 No data
Mérida, Mérida (AGEB 181-A) 0.14 0.00 0.03 0.06 0.07 0.03 0.06 0.058 Low 2 882 No data
Mérida, Mérida (AGEB 166-5) 0.14 0.00 0.02 0.07 0.07 0.02 0.07 0.058 Low 1 173 No data
Mérida, Mérida (AGEB 284-1) 0.14 0.00 0.03 0.07 0.07 0.03 0.07 0.058 Low 1 614 No data
Kanasín, Kanasín (AGEB 013-6) 0.14 0.00 0.02 0.07 0.07 0.02 0.07 0.057 Low 3 684 No data
Mérida, Mérida (AGEB 268-2) 0.14 0.00 0.03 0.06 0.07 0.03 0.06 0.057 Low 2 182 No data
Mérida, Mérida (AGEB 255-5) 0.14 0.00 0.03 0.06 0.07 0.03 0.06 0.057 Low 2 507 No data
Mérida, Mérida (AGEB 314-4) 0.14 0.00 0.03 0.06 0.07 0.03 0.06 0.056 Low 3 146 No data
Mérida, Mérida (AGEB 220-1) 0.14 0.00 0.05 0.04 0.07 0.05 0.04 0.056 Low 2 047 No data
Mérida, Mérida (AGEB 417-6) 0.14 0.00 0.02 0.06 0.07 0.02 0.06 0.056 Low 1 969 No data
Mérida, Mérida (AGEB 413-8) 0.14 0.00 0.02 0.06 0.07 0.02 0.06 0.056 Low 2 886 No data
Mérida, Mérida (AGEB 288-A) 0.14 0.00 0.02 0.06 0.07 0.02 0.06 0.056 Low 3 141 No data
Mérida, Mérida (AGEB 467-4) 0.14 0.00 0.08 0.00 0.07 0.08 0.00 0.055 Low 48 No data
Mérida, Mérida (AGEB 082-6) 0.14 0.00 0.03 0.05 0.07 0.03 0.05 0.055 Low 4 068 No data
Mérida, Mérida (AGEB 295-A) 0.14 0.00 0.02 0.06 0.07 0.02 0.06 0.055 Low 4 473 No data
Kanasín, Kanasín (AGEB 015-5) 0.14 0.00 0.04 0.04 0.07 0.04 0.04 0.055 Low 1 557 No data
Mérida, Mérida (AGEB 425-0) 0.14 0.00 0.02 0.06 0.07 0.02 0.06 0.055 Low 2 885 No data
Mérida, Mérida (AGEB 296-4) 0.14 0.00 0.02 0.06 0.07 0.02 0.06 0.054 Low 2 021 No data
Mérida, Mérida (AGEB 165-0) 0.14 0.00 0.01 0.07 0.07 0.01 0.07 0.054 Low 1 466 No data
Mérida, Mérida (AGEB 450-9) 0.14 0.00 0.03 0.05 0.07 0.03 0.05 0.054 Low 1 189 No data
Mérida, Mérida (AGEB 263-A) 0.14 0.00 0.03 0.05 0.07 0.03 0.05 0.054 Low 3 548 No data
Kanasín, Kanasín (AGEB 029-7) 0.14 0.00 0.00 0.08 0.07 0.00 0.08 0.054 Low 314 No data
Kanasín, Kanasín (AGEB 043-7) 0.14 0.00 0.06 0.02 0.07 0.06 0.02 0.053 Low 222 No data
Mérida, Mérida (AGEB 059-7) 0.14 0.00 0.02 0.06 0.07 0.02 0.06 0.053 Low 3 027 No data
Kanasín, Kanasín (AGEB 008-5) 0.14 0.00 0.06 0.01 0.07 0.06 0.01 0.053 Low 2 836 No data
Mérida, Mérida (AGEB 394-3) 0.14 0.00 0.00 0.07 0.07 0.00 0.07 0.053 Low 2 753 No data
Mérida, Mérida (AGEB 313-A) 0.14 0.00 0.02 0.05 0.07 0.02 0.05 0.052 Low 2 913 No data
Continues

36 REALIDAD, DATOS Y ESPACIO REVISTA INTERNACIONAL DE ESTADÍSTICA Y GEOGRAFÍA
Appendix A
Indexed sub-component, principal component and WAVI values for units of analysis in Merida Metropolitan Area
Units of Analysis indexRV indexSI indexWD indexUP EXP SEN ADC WAVI Vulnerabi-lity level
At Risk Population
(2005)
Growth rate 2000-
2005Mérida, Mérida (AGEB 306-A) 0.14 0.00 0.02 0.05 0.07 0.02 0.05 0.052 Low 3 350 No data
Mérida, Mérida (AGEB 039-A) 0.14 0.00 0.03 0.04 0.07 0.03 0.04 0.052 Low 3 381 No data
Mérida, Mérida (AGEB 315-9) 0.14 0.00 0.01 0.06 0.07 0.01 0.06 0.052 Low 3 959 No data
Kanasín, Kanasín (AGEB 018-9) 0.14 0.00 0.02 0.05 0.07 0.02 0.05 0.051 Low 1 427 No data
Mérida, Mérida (AGEB 247-0) 0.14 0.00 0.03 0.04 0.07 0.03 0.04 0.051 Low 1 829 No data
Mérida, Mérida (AGEB 461-7) 0.14 0.00 0.06 0.01 0.07 0.06 0.01 0.051 Low 1 092 No data
Mérida, Mérida (AGEB 006-5) 0.14 0.00 0.02 0.04 0.07 0.02 0.04 0.051 Low 5 771 No data
Mérida, Mérida (AGEB 273-3) 0.14 0.00 0.04 0.03 0.07 0.04 0.03 0.051 Low 2 425 No data
Mérida, Mérida (AGEB 336-0) 0.14 0.00 0.02 0.05 0.07 0.02 0.05 0.051 Low 2 395 No data
Mérida, Mérida (AGEB 285-6) 0.14 0.00 0.01 0.06 0.07 0.01 0.06 0.051 Low 1 261 No data
Mérida, Mérida (AGEB 462-1) 0.14 0.00 0.04 0.02 0.07 0.04 0.02 0.050 Low 1 033 No data
Mérida, Mérida (AGEB 073-7) 0.14 0.00 0.01 0.05 0.07 0.01 0.05 0.050 Low 3 625 No data
Mérida, Mérida (AGEB 335-6) 0.14 0.00 0.04 0.02 0.07 0.04 0.02 0.050 Low 1 927 No data
Mérida, Mérida (AGEB 041-7) 0.14 0.00 0.02 0.04 0.07 0.02 0.04 0.049 Low 3 303 No data
Mérida, Mérida (AGEB 225-4) 0.14 0.00 0.02 0.04 0.07 0.02 0.04 0.049 Low 2 092 No data
Mérida, Mérida (AGEB 421-2) 0.14 0.00 0.02 0.04 0.07 0.02 0.04 0.049 Low 2 653 No data
Mérida, Mérida (AGEB 412-3) 0.14 0.00 0.01 0.05 0.07 0.01 0.05 0.049 Low 2 629 No data
Mérida, Mérida (AGEB 525-9) 0.14 0.00 0.02 0.04 0.07 0.02 0.04 0.049 Low 1 229 No data
Mérida, Mérida (AGEB 533-3) 0.14 0.00 0.04 0.02 0.07 0.04 0.02 0.049 Low 2 578 No data
Mérida, Mérida (AGEB 076-0) 0.14 0.00 0.02 0.03 0.07 0.02 0.03 0.049 Low 3 853 No data
Mérida, Mérida (AGEB 338-A) 0.14 0.00 0.02 0.04 0.07 0.02 0.04 0.049 Low 2 671 No data
Mérida, Mérida (AGEB 456-6) 0.14 0.00 0.04 0.02 0.07 0.04 0.02 0.048 Low 2 361 No data
Mérida, Mérida (AGEB 050-6) 0.14 0.00 0.01 0.05 0.07 0.01 0.05 0.048 Low 1 117 No data
Mérida, Mérida (AGEB 403-4) 0.14 0.00 0.01 0.05 0.07 0.01 0.05 0.048 Low 4 318 No data
Mérida, Mérida (AGEB 466-A) 0.14 0.00 0.03 0.03 0.07 0.03 0.03 0.048 Low 2 758 No data
Mérida, Mérida (AGEB 074-1) 0.14 0.00 0.02 0.04 0.07 0.02 0.04 0.048 Low 3 549 No data
Mérida, Mérida (AGEB 066-7) 0.14 0.00 0.01 0.04 0.07 0.01 0.04 0.048 Low 4 205 No data
Mérida, Mérida (AGEB 297-9) 0.14 0.00 0.01 0.04 0.07 0.01 0.04 0.048 Low 2 753 No data
Mérida, Mérida (AGEB 080-7) 0.14 0.00 0.02 0.04 0.07 0.02 0.04 0.048 Low 4 712 No data
Mérida, Mérida (AGEB 532-9) 0.14 0.00 0.01 0.04 0.07 0.01 0.04 0.048 Low 2 546 No data
Mérida, Mérida (AGEB 040-2) 0.14 0.00 0.02 0.04 0.07 0.02 0.04 0.048 Low 2 571 No data
Mérida, Mérida (AGEB 540-3) 0.14 0.00 0.05 0.00 0.07 0.05 0.00 0.047 Low 821 No data
Mérida, Mérida (AGEB 152-3) 0.14 0.00 0.02 0.03 0.07 0.02 0.03 0.047 Low 1 675 No data
Mérida, Mérida (AGEB 505-1) 0.14 0.00 0.05 0.00 0.07 0.05 0.00 0.047 Low 496 No data
Mérida, Mérida (AGEB 294-5) 0.14 0.00 0.02 0.03 0.07 0.02 0.03 0.047 Low 2 515 No data
Mérida, Mérida (AGEB 071-8) 0.14 0.00 0.01 0.04 0.07 0.01 0.04 0.047 Low 5 166 No data
Mérida, Mérida (AGEB 148-7) 0.14 0.00 0.01 0.04 0.07 0.01 0.04 0.047 Low 2 464 No data
Itzincab, Umán 0.14 0.00 0.02 0.03 0.07 0.02 0.03 0.046 Low 4 744 0.11
Mérida, Mérida (AGEB 483-3) 0.14 0.00 0.03 0.02 0.07 0.03 0.02 0.046 Low 1 404 No data
Mérida, Mérida (AGEB 534-8) 0.14 0.00 0.03 0.02 0.07 0.03 0.02 0.046 Low 2 299 No data
Mérida, Mérida (AGEB 260-6) 0.14 0.00 0.02 0.03 0.07 0.02 0.03 0.045 Low 1 712 No data
Mérida, Mérida (AGEB 177-3) 0.14 0.00 0.01 0.04 0.07 0.01 0.04 0.045 Low 2 931 No data
Continues

37Vol. 4 Núm. 1 enero-abril 2013
Appendix A
Indexed sub-component, principal component and WAVI values for units of analysis in Merida Metropolitan Area
Units of Analysis indexRV indexSI indexWD indexUP EXP SEN ADC WAVI Vulnerabi-lity level
At Risk Population
(2005)
Growth rate 2000-
2005Mérida, Mérida (AGEB 191-3) 0.14 0.00 0.03 0.01 0.07 0.03 0.01 0.045 Low 2 244 No data
Mérida, Mérida (AGEB 518-9) 0.14 0.00 0.03 0.02 0.07 0.03 0.02 0.045 Low 1 234 No data
Mérida, Mérida (AGEB 060-A) 0.14 0.00 0.01 0.03 0.07 0.01 0.03 0.045 Low 7 201 No data
Mérida, Mérida (AGEB 299-8) 0.14 0.00 0.02 0.03 0.07 0.02 0.03 0.045 Low 2 653 No data
Mérida, Mérida (AGEB 156-1) 0.14 0.00 0.03 0.01 0.07 0.03 0.01 0.045 Low 1 332 No data
Mérida, Mérida (AGEB 286-0) 0.14 0.00 0.01 0.03 0.07 0.01 0.03 0.044 Low 2 239 No data
Mérida, Mérida (AGEB 327-1) 0.14 0.00 0.01 0.03 0.07 0.01 0.03 0.044 Low 2 947 No data
Mérida, Mérida (AGEB 316-3) 0.14 0.00 0.01 0.02 0.07 0.01 0.02 0.044 Low 2 635 No data
Mérida, Mérida (AGEB 271-4) 0.14 0.00 0.02 0.02 0.07 0.02 0.02 0.044 Low 1 780 No data
Mérida, Mérida (AGEB 264-4) 0.14 0.00 0.02 0.02 0.07 0.02 0.02 0.044 Low 2 520 No data
Mérida, Mérida (AGEB 012-0) 0.14 0.00 0.02 0.02 0.07 0.02 0.02 0.044 Low 1 806 No data
Mérida, Mérida (AGEB 266-3) 0.14 0.00 0.01 0.02 0.07 0.01 0.02 0.044 Low 2 882 No data
Mérida, Mérida (AGEB 484-8) 0.14 0.00 0.01 0.02 0.07 0.01 0.02 0.044 Low 1 133 No data
Mérida, Mérida (AGEB 068-6) 0.14 0.00 0.01 0.02 0.07 0.01 0.02 0.044 Low 3 099 No data
Mérida, Mérida (AGEB 489-0) 0.14 0.00 0.00 0.04 0.07 0.00 0.04 0.043 Low 561 No data
Kanasín, Kanasín (AGEB 014-0) 0.14 0.00 0.00 0.03 0.07 0.00 0.03 0.043 Low 1 440 No data
Mérida, Mérida (AGEB 242-8) 0.14 0.00 0.02 0.02 0.07 0.02 0.02 0.043 Low 1 843 No data
Mérida, Mérida (AGEB 300-2) 0.14 0.00 0.01 0.03 0.07 0.01 0.03 0.043 Low 1 536 No data
Mérida, Mérida (AGEB 287-5) 0.14 0.00 0.01 0.03 0.07 0.01 0.03 0.043 Low 2 569 No data
Mérida, Mérida (AGEB 385-4) 0.14 0.00 0.00 0.03 0.07 0.00 0.03 0.043 Low 2 785 No data
Mérida, Mérida (AGEB 048-9) 0.14 0.00 0.01 0.03 0.07 0.01 0.03 0.043 Low 3 464 No data
Mérida, Mérida (AGEB 399-6) 0.14 0.00 0.01 0.02 0.07 0.01 0.02 0.043 Low 1 299 No data
Mérida, Mérida (AGEB 221-6) 0.14 0.00 0.02 0.01 0.07 0.02 0.01 0.043 Low 4 120 No data
Mérida, Mérida (AGEB 075-6) 0.14 0.00 0.01 0.02 0.07 0.01 0.02 0.042 Low 2 755 No data
Mérida, Mérida (AGEB 530-A) 0.14 0.00 0.00 0.03 0.07 0.00 0.03 0.042 Low 2 745 No data
Mérida, Mérida (AGEB 508-5) 0.14 0.00 0.01 0.02 0.07 0.01 0.02 0.042 Low 2 157 No data
Mérida, Mérida (AGEB 067-1) 0.14 0.00 0.01 0.02 0.07 0.01 0.02 0.042 Low 4 447 No data
Mérida, Mérida (AGEB 507-0) 0.14 0.00 0.01 0.02 0.07 0.01 0.02 0.042 Low 2 075 No data
Mérida, Mérida (AGEB 160-8) 0.14 0.00 0.02 0.01 0.07 0.02 0.01 0.042 Low 1 714 No data
Mérida, Mérida (AGEB 134-5) 0.14 0.00 0.01 0.02 0.07 0.01 0.02 0.042 Low 2 518 No data
Mérida, Mérida (AGEB 502-8) 0.14 0.00 0.01 0.02 0.07 0.01 0.02 0.042 Low 2 416 No data
Mérida, Mérida (AGEB 241-3) 0.14 0.00 0.01 0.02 0.07 0.01 0.02 0.042 Low 3 093 No data
Mérida, Mérida (AGEB 303-6) 0.14 0.00 0.02 0.01 0.07 0.02 0.01 0.042 Low 1 182 No data
Mérida, Mérida (AGEB 529-7) 0.14 0.00 0.02 0.01 0.07 0.02 0.01 0.042 Low 1 651 No data
Mérida, Mérida (AGEB 065-2) 0.14 0.00 0.01 0.02 0.07 0.01 0.02 0.042 Low 3 568 No data
Mérida, Mérida (AGEB 042-1) 0.14 0.00 0.01 0.02 0.07 0.01 0.02 0.041 Low 3 375 No data
Mérida, Mérida (AGEB 178-8) 0.14 0.00 0.01 0.02 0.07 0.01 0.02 0.041 Low 2 761 No data
Mérida, Mérida (AGEB 030-9) 0.14 0.00 0.01 0.02 0.07 0.01 0.02 0.041 Low 2 680 No data
Mérida, Mérida (AGEB 063-3) 0.14 0.00 0.01 0.01 0.07 0.01 0.01 0.041 Low 4 766 No data
Mérida, Mérida (AGEB 293-0) 0.14 0.00 0.01 0.02 0.07 0.01 0.02 0.041 Low 2 156 No data
Mérida, Mérida (AGEB 531-4) 0.14 0.00 0.01 0.02 0.07 0.01 0.02 0.041 Low 2 437 No data
Mérida, Mérida (AGEB 291-1) 0.14 0.00 0.01 0.01 0.07 0.01 0.01 0.041 Low 2 810 No data
Continues

38 REALIDAD, DATOS Y ESPACIO REVISTA INTERNACIONAL DE ESTADÍSTICA Y GEOGRAFÍA
Appendix A
Indexed sub-component, principal component and WAVI values for units of analysis in Merida Metropolitan Area
Units of Analysis indexRV indexSI indexWD indexUP EXP SEN ADC WAVI Vulnerabi-lity level
At Risk Population
(2005)
Growth rate 2000-
2005Mérida, Mérida (AGEB 455-1) 0.14 0.00 0.00 0.03 0.07 0.00 0.03 0.041 Low 1 504 No data
Mérida, Mérida (AGEB 026-2) 0.14 0.00 0.01 0.02 0.07 0.01 0.02 0.041 Low 3 538 No data
Mérida, Mérida (AGEB 526-3) 0.14 0.00 0.01 0.01 0.07 0.01 0.01 0.041 Low 1 686 No data
Mérida, Mérida (AGEB 524-4) 0.14 0.00 0.01 0.02 0.07 0.01 0.02 0.040 Low 1 097 No data
Mérida, Mérida (AGEB 036-6) 0.14 0.00 0.01 0.02 0.07 0.01 0.02 0.040 Low 3 005 No data
Mérida, Mérida (AGEB 521-0) 0.14 0.00 0.01 0.01 0.07 0.01 0.01 0.040 Low 1 104 No data
Mérida, Mérida (AGEB 470-6) 0.14 0.00 0.00 0.02 0.07 0.00 0.02 0.040 Low 2 503 No data
Mérida, Mérida (AGEB 272-9) 0.14 0.00 0.00 0.02 0.07 0.00 0.02 0.040 Low 1 397 No data
Mérida, Mérida (AGEB 426-5) 0.14 0.00 0.02 0.00 0.07 0.02 0.00 0.040 Low 367 No data
Mérida, Mérida (AGEB 289-4) 0.14 0.00 0.01 0.01 0.07 0.01 0.01 0.040 Low 4 544 No data
Mérida, Mérida (AGEB 244-7) 0.14 0.00 0.01 0.01 0.07 0.01 0.01 0.040 Low 2 206 No data
Mérida, Mérida (AGEB 527-8) 0.14 0.00 0.00 0.02 0.07 0.00 0.02 0.039 Low 1 707 No data
Mérida, Mérida (AGEB 254-0) 0.14 0.00 0.02 0.00 0.07 0.02 0.00 0.039 Low 1 640 No data
Mérida, Mérida (AGEB 280-3) 0.14 0.00 0.01 0.01 0.07 0.01 0.01 0.039 Low 2 357 No data
Mérida, Mérida (AGEB 226-9) 0.14 0.00 0.00 0.02 0.07 0.00 0.02 0.039 Low 3 225 No data
Mérida, Mérida (AGEB 062-9) 0.14 0.00 0.01 0.01 0.07 0.01 0.01 0.039 Low 2 760 No data
Mérida, Mérida (AGEB 318-2) 0.14 0.00 0.01 0.01 0.07 0.01 0.01 0.039 Low 2 750 No data
Mérida, Mérida (AGEB 406-8) 0.14 0.00 0.01 0.01 0.07 0.01 0.01 0.039 Low 1 226 No data
Mérida, Mérida (AGEB 031-3) 0.14 0.00 0.01 0.01 0.07 0.01 0.01 0.039 Low 2 893 No data
Mérida, Mérida (AGEB 258-9) 0.14 0.00 0.01 0.00 0.07 0.01 0.00 0.039 Low 1 324 No data
Mérida, Mérida (AGEB 351-5) 0.14 0.00 0.01 0.01 0.07 0.01 0.01 0.039 Low 1 314 No data
Mérida, Mérida (AGEB 061-4) 0.14 0.00 0.01 0.01 0.07 0.01 0.01 0.039 Low 3 749 No data
Mérida, Mérida (AGEB 032-8) 0.14 0.00 0.01 0.01 0.07 0.01 0.01 0.039 Low 1 820 No data
Mérida, Mérida (AGEB 033-2) 0.14 0.00 0.00 0.01 0.07 0.00 0.01 0.039 Low 3 476 No data
Mérida, Mérida (AGEB 522-5) 0.14 0.00 0.01 0.01 0.07 0.01 0.01 0.039 Low 1 592 No data
Mérida, Mérida (AGEB 049-3) 0.14 0.00 0.01 0.01 0.07 0.01 0.01 0.039 Low 3 773 No data
Mérida, Mérida (AGEB 379-9) 0.14 0.00 0.00 0.01 0.07 0.00 0.01 0.038 Low 2 153 No data
Mérida, Mérida (AGEB 064-8) 0.14 0.00 0.01 0.01 0.07 0.01 0.01 0.038 Low 3 443 No data
Mérida, Mérida (AGEB 261-0) 0.14 0.00 0.00 0.01 0.07 0.00 0.01 0.038 Low 2 058 No data
Mérida, Mérida (AGEB 054-4) 0.14 0.00 0.00 0.01 0.07 0.00 0.01 0.038 Low 2 869 No data
Mérida, Mérida (AGEB 304-0) 0.14 0.00 0.01 0.01 0.07 0.01 0.01 0.038 Low 2 275 No data
Mérida, Mérida (AGEB 053-A) 0.14 0.00 0.01 0.01 0.07 0.01 0.01 0.038 Low 4 744 No data
Mérida, Mérida (AGEB 259-3) 0.14 0.00 0.00 0.01 0.07 0.00 0.01 0.038 Low 2 328 No data
Mérida, Mérida (AGEB 034-7) 0.14 0.00 0.00 0.01 0.07 0.00 0.01 0.038 Low 3 514 No data
Mérida, Mérida (AGEB 021-A) 0.14 0.00 0.01 0.01 0.07 0.01 0.01 0.038 Low 1 901 No data
Mérida, Mérida (AGEB 397-7) 0.14 0.00 0.00 0.01 0.07 0.00 0.01 0.038 Low 5 539 No data
Mérida, Mérida (AGEB 410-4) 0.14 0.00 0.00 0.01 0.07 0.00 0.01 0.038 Low 2 151 No data
Mérida, Mérida (AGEB 265-9) 0.14 0.00 0.00 0.01 0.07 0.00 0.01 0.038 Low 3 858 No data
Mérida, Mérida (AGEB 326-7) 0.14 0.00 0.00 0.01 0.07 0.00 0.01 0.038 Low 4 237 No data
Mérida, Mérida (AGEB 052-5) 0.14 0.00 0.00 0.01 0.07 0.00 0.01 0.038 Low 2 088 No data
Mérida, Mérida (AGEB 523-A) 0.14 0.00 0.00 0.01 0.07 0.00 0.01 0.038 Low 1 524 No data
Mérida, Mérida (AGEB 408-7) 0.14 0.00 0.00 0.01 0.07 0.00 0.01 0.038 Low 1 371 No data
Continues
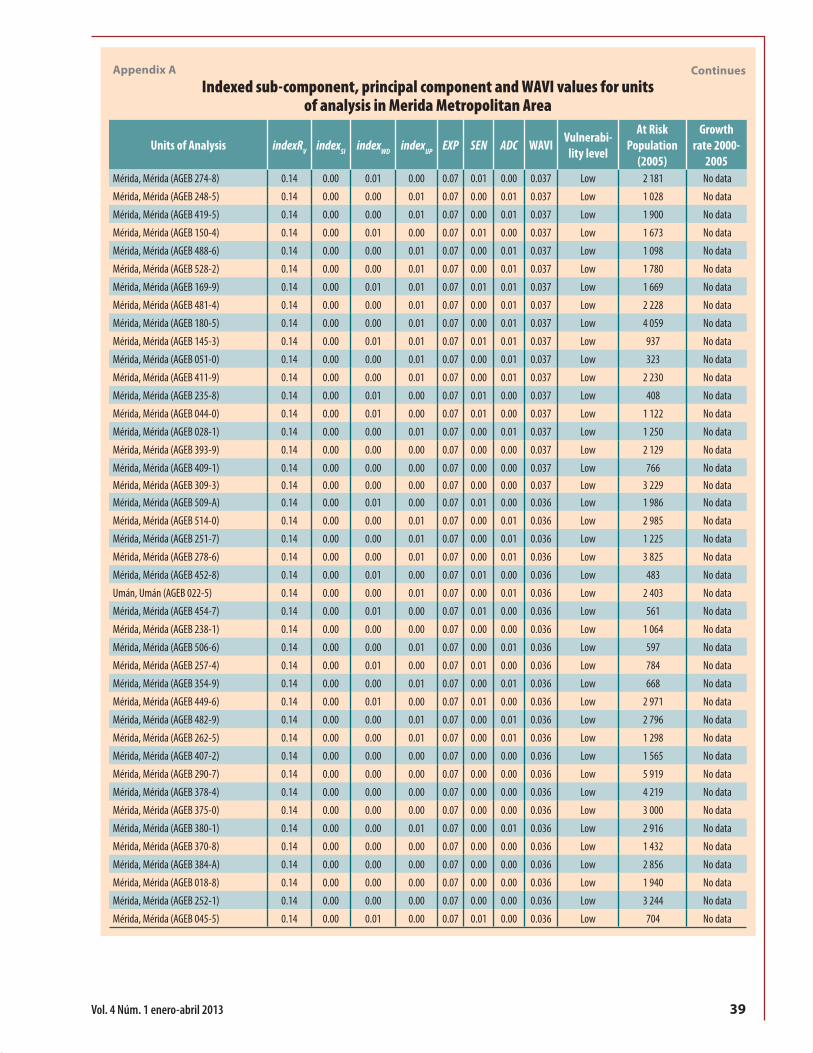
39Vol. 4 Núm. 1 enero-abril 2013
Appendix A
Indexed sub-component, principal component and WAVI values for units of analysis in Merida Metropolitan Area
Units of Analysis indexRV indexSI indexWD indexUP EXP SEN ADC WAVI Vulnerabi-lity level
At Risk Population
(2005)
Growth rate 2000-
2005Mérida, Mérida (AGEB 274-8) 0.14 0.00 0.01 0.00 0.07 0.01 0.00 0.037 Low 2 181 No data
Mérida, Mérida (AGEB 248-5) 0.14 0.00 0.00 0.01 0.07 0.00 0.01 0.037 Low 1 028 No data
Mérida, Mérida (AGEB 419-5) 0.14 0.00 0.00 0.01 0.07 0.00 0.01 0.037 Low 1 900 No data
Mérida, Mérida (AGEB 150-4) 0.14 0.00 0.01 0.00 0.07 0.01 0.00 0.037 Low 1 673 No data
Mérida, Mérida (AGEB 488-6) 0.14 0.00 0.00 0.01 0.07 0.00 0.01 0.037 Low 1 098 No data
Mérida, Mérida (AGEB 528-2) 0.14 0.00 0.00 0.01 0.07 0.00 0.01 0.037 Low 1 780 No data
Mérida, Mérida (AGEB 169-9) 0.14 0.00 0.01 0.01 0.07 0.01 0.01 0.037 Low 1 669 No data
Mérida, Mérida (AGEB 481-4) 0.14 0.00 0.00 0.01 0.07 0.00 0.01 0.037 Low 2 228 No data
Mérida, Mérida (AGEB 180-5) 0.14 0.00 0.00 0.01 0.07 0.00 0.01 0.037 Low 4 059 No data
Mérida, Mérida (AGEB 145-3) 0.14 0.00 0.01 0.01 0.07 0.01 0.01 0.037 Low 937 No data
Mérida, Mérida (AGEB 051-0) 0.14 0.00 0.00 0.01 0.07 0.00 0.01 0.037 Low 323 No data
Mérida, Mérida (AGEB 411-9) 0.14 0.00 0.00 0.01 0.07 0.00 0.01 0.037 Low 2 230 No data
Mérida, Mérida (AGEB 235-8) 0.14 0.00 0.01 0.00 0.07 0.01 0.00 0.037 Low 408 No data
Mérida, Mérida (AGEB 044-0) 0.14 0.00 0.01 0.00 0.07 0.01 0.00 0.037 Low 1 122 No data
Mérida, Mérida (AGEB 028-1) 0.14 0.00 0.00 0.01 0.07 0.00 0.01 0.037 Low 1 250 No data
Mérida, Mérida (AGEB 393-9) 0.14 0.00 0.00 0.00 0.07 0.00 0.00 0.037 Low 2 129 No data
Mérida, Mérida (AGEB 409-1) 0.14 0.00 0.00 0.00 0.07 0.00 0.00 0.037 Low 766 No data
Mérida, Mérida (AGEB 309-3) 0.14 0.00 0.00 0.00 0.07 0.00 0.00 0.037 Low 3 229 No data
Mérida, Mérida (AGEB 509-A) 0.14 0.00 0.01 0.00 0.07 0.01 0.00 0.036 Low 1 986 No data
Mérida, Mérida (AGEB 514-0) 0.14 0.00 0.00 0.01 0.07 0.00 0.01 0.036 Low 2 985 No data
Mérida, Mérida (AGEB 251-7) 0.14 0.00 0.00 0.01 0.07 0.00 0.01 0.036 Low 1 225 No data
Mérida, Mérida (AGEB 278-6) 0.14 0.00 0.00 0.01 0.07 0.00 0.01 0.036 Low 3 825 No data
Mérida, Mérida (AGEB 452-8) 0.14 0.00 0.01 0.00 0.07 0.01 0.00 0.036 Low 483 No data
Umán, Umán (AGEB 022-5) 0.14 0.00 0.00 0.01 0.07 0.00 0.01 0.036 Low 2 403 No data
Mérida, Mérida (AGEB 454-7) 0.14 0.00 0.01 0.00 0.07 0.01 0.00 0.036 Low 561 No data
Mérida, Mérida (AGEB 238-1) 0.14 0.00 0.00 0.00 0.07 0.00 0.00 0.036 Low 1 064 No data
Mérida, Mérida (AGEB 506-6) 0.14 0.00 0.00 0.01 0.07 0.00 0.01 0.036 Low 597 No data
Mérida, Mérida (AGEB 257-4) 0.14 0.00 0.01 0.00 0.07 0.01 0.00 0.036 Low 784 No data
Mérida, Mérida (AGEB 354-9) 0.14 0.00 0.00 0.01 0.07 0.00 0.01 0.036 Low 668 No data
Mérida, Mérida (AGEB 449-6) 0.14 0.00 0.01 0.00 0.07 0.01 0.00 0.036 Low 2 971 No data
Mérida, Mérida (AGEB 482-9) 0.14 0.00 0.00 0.01 0.07 0.00 0.01 0.036 Low 2 796 No data
Mérida, Mérida (AGEB 262-5) 0.14 0.00 0.00 0.01 0.07 0.00 0.01 0.036 Low 1 298 No data
Mérida, Mérida (AGEB 407-2) 0.14 0.00 0.00 0.00 0.07 0.00 0.00 0.036 Low 1 565 No data
Mérida, Mérida (AGEB 290-7) 0.14 0.00 0.00 0.00 0.07 0.00 0.00 0.036 Low 5 919 No data
Mérida, Mérida (AGEB 378-4) 0.14 0.00 0.00 0.00 0.07 0.00 0.00 0.036 Low 4 219 No data
Mérida, Mérida (AGEB 375-0) 0.14 0.00 0.00 0.00 0.07 0.00 0.00 0.036 Low 3 000 No data
Mérida, Mérida (AGEB 380-1) 0.14 0.00 0.00 0.01 0.07 0.00 0.01 0.036 Low 2 916 No data
Mérida, Mérida (AGEB 370-8) 0.14 0.00 0.00 0.00 0.07 0.00 0.00 0.036 Low 1 432 No data
Mérida, Mérida (AGEB 384-A) 0.14 0.00 0.00 0.00 0.07 0.00 0.00 0.036 Low 2 856 No data
Mérida, Mérida (AGEB 018-8) 0.14 0.00 0.00 0.00 0.07 0.00 0.00 0.036 Low 1 940 No data
Mérida, Mérida (AGEB 252-1) 0.14 0.00 0.00 0.00 0.07 0.00 0.00 0.036 Low 3 244 No data
Mérida, Mérida (AGEB 045-5) 0.14 0.00 0.01 0.00 0.07 0.01 0.00 0.036 Low 704 No data
Continues

40 REALIDAD, DATOS Y ESPACIO REVISTA INTERNACIONAL DE ESTADÍSTICA Y GEOGRAFÍA
Appendix A
Indexed sub-component, principal component and WAVI values for units of analysis in Merida Metropolitan Area
Units of Analysis indexRV indexSI indexWD indexUP EXP SEN ADC WAVI Vulnerabi-lity level
At Risk Population
(2005)
Growth rate 2000-
2005Mérida, Mérida (AGEB 319-7) 0.14 0.00 0.00 0.00 0.07 0.00 0.00 0.036 Low 1 429 No data
Umán, Umán (AGEB 023-A) 0.14 0.00 0.00 0.00 0.07 0.00 0.00 0.036 Low 2 599 No data
Mérida, Mérida (AGEB 463-6) 0.14 0.00 0.00 0.00 0.07 0.00 0.00 0.036 Low 2 242 No data
Mérida, Mérida (AGEB 486-7) 0.14 0.00 0.00 0.00 0.07 0.00 0.00 0.036 Low 1 349 No data
Mérida, Mérida (AGEB 330-3) 0.14 0.00 0.00 0.00 0.07 0.00 0.00 0.036 Low 4 993 No data
Mérida, Mérida (AGEB 146-8) 0.14 0.00 0.00 0.00 0.07 0.00 0.00 0.036 Low 1 870 No data
Mérida, Mérida (AGEB 239-6) 0.14 0.00 0.00 0.00 0.07 0.00 0.00 0.036 Low 1 668 No data
Mérida, Mérida (AGEB 377-A) 0.14 0.00 0.00 0.00 0.07 0.00 0.00 0.036 Low 4 849 No data
Mérida, Mérida (AGEB 317-8) 0.14 0.00 0.00 0.00 0.07 0.00 0.00 0.035 Low 1 854 No data
Mérida, Mérida (AGEB 292-6) 0.14 0.00 0.00 0.00 0.07 0.00 0.00 0.035 Low 1 917 No data
Mérida, Mérida (AGEB 056-3) 0.14 0.00 0.00 0.00 0.07 0.00 0.00 0.035 Low 3 640 No data
Mérida, Mérida (AGEB 043-6) 0.14 0.00 0.00 0.00 0.07 0.00 0.00 0.035 Low 2 423 No data
Mérida, Mérida (AGEB 124-1) 0.14 0.00 0.00 0.00 0.07 0.00 0.00 0.035 Low 3 040 No data
Mérida, Mérida (AGEB 395-8) 0.14 0.00 0.00 0.00 0.07 0.00 0.00 0.035 Low 1 042 No data
Mérida, Mérida (AGEB 389-2) 0.14 0.00 0.00 0.00 0.07 0.00 0.00 0.035 Low 4 035 No data
Mérida, Mérida (AGEB 510-2) 0.14 0.00 0.00 0.00 0.07 0.00 0.00 0.035 Low 3 342 No data
Mérida, Mérida (AGEB 232-4) 0.14 0.00 0.00 0.00 0.07 0.00 0.00 0.035 Low 2 038 No data
Mérida, Mérida (AGEB 122-2) 0.14 0.00 0.00 0.00 0.07 0.00 0.00 0.035 Low 4 421 No data
Mérida, Mérida (AGEB 227-3) 0.14 0.00 0.00 0.00 0.07 0.00 0.00 0.035 Low 3 048 No data
Mérida, Mérida (AGEB 390-5) 0.14 0.00 0.00 0.00 0.07 0.00 0.00 0.035 Low 2 951 No data
Mérida, Mérida (AGEB 343-0) 0.14 0.00 0.00 0.00 0.07 0.00 0.00 0.035 Low 2 228 No data
Mérida, Mérida (AGEB 231-A) 0.14 0.00 0.00 0.00 0.07 0.00 0.00 0.035 Low 3 611 No data
Mérida, Mérida (AGEB 357-2) 0.14 0.00 0.00 0.00 0.07 0.00 0.00 0.035 Low 2 593 No data
Mérida, Mérida (AGEB 029-6) 0.14 0.00 0.00 0.00 0.07 0.00 0.00 0.035 Low 1 116 No data
Mérida, Mérida (AGEB 121-8) 0.14 0.00 0.00 0.00 0.07 0.00 0.00 0.035 Low 2 639 No data
Mérida, Mérida (AGEB 431-6) 0.14 0.00 0.00 0.00 0.07 0.00 0.00 0.035 Low 1 450 No data
Mérida, Mérida (AGEB 422-7) 0.14 0.00 0.00 0.00 0.07 0.00 0.00 0.035 Low 1 477 No data
Mérida, Mérida (AGEB 371-2) 0.14 0.00 0.00 0.00 0.07 0.00 0.00 0.035 Low 3 061 No data
Mérida, Mérida (AGEB 233-9) 0.14 0.00 0.00 0.00 0.07 0.00 0.00 0.035 Low 1 869 No data
Mérida, Mérida (AGEB 277-1) 0.14 0.00 0.00 0.00 0.07 0.00 0.00 0.035 Low 3 422 No data
Mérida, Mérida (AGEB 414-2) 0.14 0.00 0.00 0.00 0.07 0.00 0.00 0.035 Low 1 847 No data
Mérida, Mérida (AGEB 341-1) 0.14 0.00 0.00 0.00 0.07 0.00 0.00 0.035 Low 3 589 No data
Mérida, Mérida (AGEB 415-7) 0.14 0.00 0.00 0.00 0.07 0.00 0.00 0.035 Low 1 788 No data
Mérida, Mérida (AGEB 147-2) 0.14 0.00 0.00 0.00 0.07 0.00 0.00 0.035 Low 2 105 No data
Mérida, Mérida (AGEB 302-1) 0.14 0.00 0.00 0.00 0.07 0.00 0.00 0.035 Low 2 461 No data
Mérida, Mérida (AGEB 374-6) 0.14 0.00 0.00 0.00 0.07 0.00 0.00 0.035 Low 4 216 No data
Mérida, Mérida (AGEB 457-0) 0.14 0.00 0.00 0.00 0.07 0.00 0.00 0.035 Low 2 392 No data
Mérida, Mérida (AGEB 301-7) 0.14 0.00 0.00 0.00 0.07 0.00 0.00 0.035 Low 2 956 No data
Mérida, Mérida (AGEB 418-0) 0.14 0.00 0.00 0.00 0.07 0.00 0.00 0.035 Low 2 474 No data
Mérida, Mérida (AGEB 223-5) 0.14 0.00 0.00 0.00 0.07 0.00 0.00 0.035 Low 2 820 No data
Mérida, Mérida (AGEB 541-8) 0.14 0.00 0.00 0.00 0.07 0.00 0.00 0.035 Low 2 823 No data
Mérida, Mérida (AGEB 451-3) 0.14 0.00 0.00 0.00 0.07 0.00 0.00 0.035 Low 3 148 No data
Continues

41Vol. 4 Núm. 1 enero-abril 2013
Appendix A
Indexed sub-component, principal component and WAVI values for units of analysis in Merida Metropolitan Area
Units of Analysis indexRV indexSI indexWD indexUP EXP SEN ADC WAVI Vulnerabi-lity level
At Risk Population
(2005)
Growth rate 2000-
2005Mérida, Mérida (AGEB 391-A) 0.14 0.00 0.00 0.00 0.07 0.00 0.00 0.035 Low 4 367 No data
Mérida, Mérida (AGEB 228-8) 0.14 0.00 0.00 0.00 0.07 0.00 0.00 0.035 Low 3 972 No data
Kanasín, Kanasín (AGEB 038-6) 0.14 0.00 0.00 0.00 0.07 0.00 0.00 0.034 Low 1 No data
Mérida, Mérida (AGEB 016-9) 0.14 0.00 0.00 0.00 0.07 0.00 0.00 0.034 Low 1 961 No data
Mérida, Mérida (AGEB 022-4) 0.14 0.00 0.00 0.00 0.07 0.00 0.00 0.034 Low 1 126 No data
Mérida, Mérida (AGEB 168-4) 0.14 0.00 0.00 0.00 0.07 0.00 0.00 0.034 Low 983 No data
Mérida, Mérida (AGEB 171-6) 0.14 0.00 0.00 0.00 0.07 0.00 0.00 0.034 Low 2 708 No data
Mérida, Mérida (AGEB 222-0) 0.14 0.00 0.00 0.00 0.07 0.00 0.00 0.034 Low 2 370 No data
Mérida, Mérida (AGEB 234-3) 0.14 0.00 0.00 0.00 0.07 0.00 0.00 0.034 Low 348 No data
Mérida, Mérida (AGEB 236-2) 0.14 0.00 0.00 0.00 0.07 0.00 0.00 0.034 Low 544 No data
Mérida, Mérida (AGEB 237-7) 0.14 0.00 0.00 0.00 0.07 0.00 0.00 0.034 Low 485 No data
Mérida, Mérida (AGEB 240-9) 0.14 0.00 0.00 0.00 0.07 0.00 0.00 0.034 Low 959 No data
Mérida, Mérida (AGEB 243-2) 0.14 0.00 0.00 0.00 0.07 0.00 0.00 0.034 Low 2 015 No data
Mérida, Mérida (AGEB 249-A) 0.14 0.00 0.00 0.00 0.07 0.00 0.00 0.034 Low 1 364 No data
Mérida, Mérida (AGEB 310-6) 0.14 0.00 0.00 0.00 0.07 0.00 0.00 0.034 Low 2 153 No data
Mérida, Mérida (AGEB 342-6) 0.14 0.00 0.00 0.00 0.07 0.00 0.00 0.034 Low 1 978 No data
Mérida, Mérida (AGEB 372-7) 0.14 0.00 0.00 0.00 0.07 0.00 0.00 0.034 Low 2 564 No data
Mérida, Mérida (AGEB 376-5) 0.14 0.00 0.00 0.00 0.07 0.00 0.00 0.034 Low 2 509 No data
Mérida, Mérida (AGEB 423-1) 0.14 0.00 0.00 0.00 0.07 0.00 0.00 0.034 Low 2 196 No data
Mérida, Mérida (AGEB 430-1) 0.14 0.00 0.00 0.00 0.07 0.00 0.00 0.034 Low 499 No data
Mérida, Mérida (AGEB 432-0) 0.14 0.00 0.00 0.00 0.07 0.00 0.00 0.034 Low 331 No data
Mérida, Mérida (AGEB 433-5) 0.14 0.00 0.00 0.00 0.07 0.00 0.00 0.034 Low 543 No data
Mérida, Mérida (AGEB 453-2) 0.14 0.00 0.00 0.00 0.07 0.00 0.00 0.034 Low 86 No data
Mérida, Mérida (AGEB 485-2) 0.14 0.00 0.00 0.00 0.07 0.00 0.00 0.034 Low 932 No data
Mérida, Mérida (AGEB 490-3) 0.14 0.00 0.00 0.00 0.07 0.00 0.00 0.034 Low 25 No data
Mérida, Mérida (AGEB 491-8) 0.14 0.00 0.00 0.00 0.07 0.00 0.00 0.034 Low 141 No data
Mérida, Mérida (AGEB 513-6) 0.14 0.00 0.00 0.00 0.07 0.00 0.00 0.034 Low 1 513 No data
Mérida, Mérida (AGEB 517-4) 0.14 0.00 0.00 0.00 0.07 0.00 0.00 0.034 Low 2 127 No data
Mérida, Mérida (AGEB 537-1) 0.14 0.00 0.00 0.00 0.07 0.00 0.00 0.034 Low 185 No data
Umán, Umán (AGEB 035-2) 0.14 0.00 0.00 0.00 0.07 0.00 0.00 0.034 Low 25 No data
Source: Developed by authors.
Abbreviation: WAVI: Water Access Vulnerability Index; IndexRV
: Rainfall, variation indexed sub-component; indexSI
: Saltwater intrusion indexed sub-component; index WD
: Safe water
access deficit indexed sub-component; indexUP
: Urban poverty indexed sub-component; EXP: Climate change exposure principal component; SEN: Climate change sensi-
tivity principal component; ADC: Climate change adaptation capacity principal component; AGEB: Spanish abbreviation for Basic Geostatistic Area. Units of analysis: First
name = Location name, Second name (after comma) = Municipality name.
Concludes