CHAPTER 10 BREAST TUMOR DIAGNOSIS IN …eprints.uthm.edu.my/id/eprint/11963/1/c10.pdfThe initial...
15
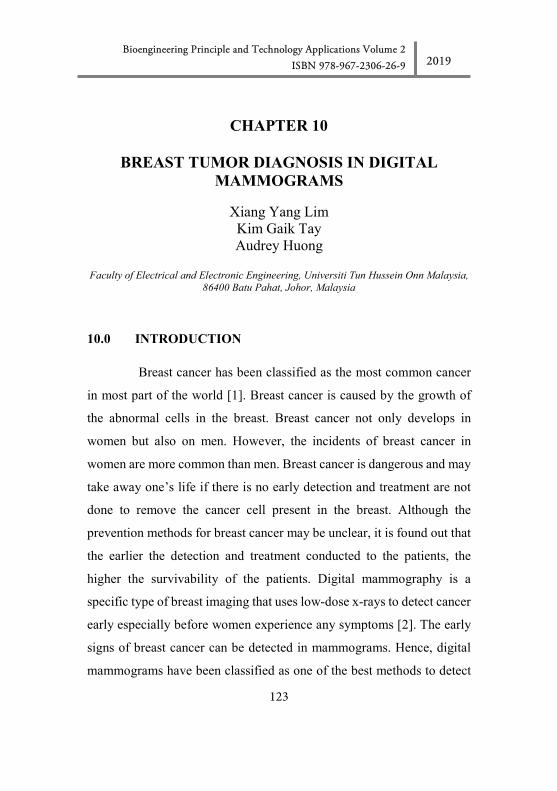
123 Bioengineering Principle and Technology Applications Volume 2 ISBN 978-967-2306-26-9 2019 CHAPTER 10 BREAST TUMOR DIAGNOSIS IN DIGITAL MAMMOGRAMS Xiang Yang Lim Kim Gaik Tay Audrey Huong Faculty of Electrical and Electronic Engineering, Universiti Tun Hussein Onn Malaysia, 86400 Batu Pahat, Johor, Malaysia 10.0 INTRODUCTION Breast cancer has been classified as the most common cancer in most part of the world [1]. Breast cancer is caused by the growth of the abnormal cells in the breast. Breast cancer not only develops in women but also on men. However, the incidents of breast cancer in women are more common than men. Breast cancer is dangerous and may take away one’s life if there is no early detection and treatment are not done to remove the cancer cell present in the breast. Although the prevention methods for breast cancer may be unclear, it is found out that the earlier the detection and treatment conducted to the patients, the higher the survivability of the patients. Digital mammography is a specific type of breast imaging that uses low-dose x-rays to detect cancer early especially before women experience any symptoms [2]. The early signs of breast cancer can be detected in mammograms. Hence, digital mammograms have been classified as one of the best methods to detect
Transcript of CHAPTER 10 BREAST TUMOR DIAGNOSIS IN …eprints.uthm.edu.my/id/eprint/11963/1/c10.pdfThe initial...
123
Bioengineering Principle and Technology Applications Volume 2 ISBN 978-967-2306-26-9 2019
CHAPTER 10
BREAST TUMOR DIAGNOSIS IN DIGITAL MAMMOGRAMS
Xiang Yang Lim Kim Gaik Tay Audrey Huong
Faculty of Electrical and Electronic Engineering, Universiti Tun Hussein Onn Malaysia,
86400 Batu Pahat, Johor, Malaysia
10.0 INTRODUCTION
Breast cancer has been classified as the most common cancer
in most part of the world [1]. Breast cancer is caused by the growth of
the abnormal cells in the breast. Breast cancer not only develops in
women but also on men. However, the incidents of breast cancer in
women are more common than men. Breast cancer is dangerous and may
take away one’s life if there is no early detection and treatment are not
done to remove the cancer cell present in the breast. Although the
prevention methods for breast cancer may be unclear, it is found out that
the earlier the detection and treatment conducted to the patients, the
higher the survivability of the patients. Digital mammography is a
specific type of breast imaging that uses low-dose x-rays to detect cancer
early especially before women experience any symptoms [2]. The early
signs of breast cancer can be detected in mammograms. Hence, digital
mammograms have been classified as one of the best methods to detect
124
Bioengineering Principle and Technology Applications Volume 2 ISBN 978-967-2306-26-9 2019
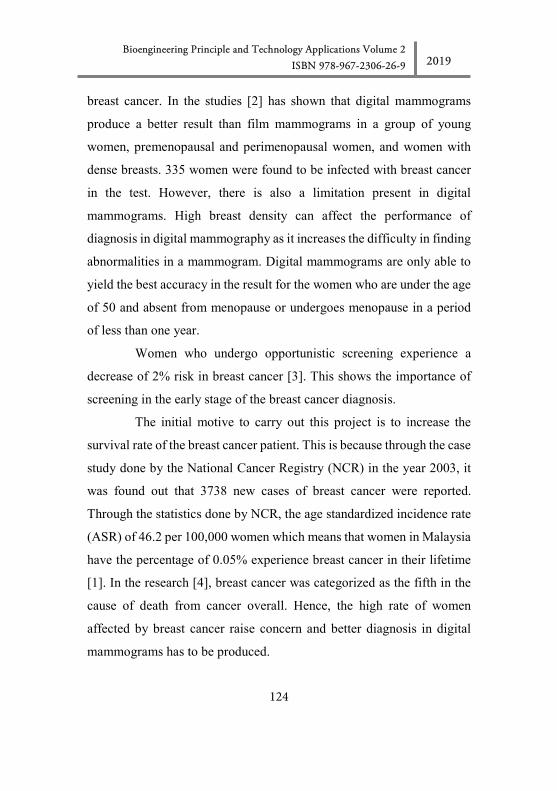
breast cancer. In the studies [2] has shown that digital mammograms
produce a better result than film mammograms in a group of young
women, premenopausal and perimenopausal women, and women with
dense breasts. 335 women were found to be infected with breast cancer
in the test. However, there is also a limitation present in digital
mammograms. High breast density can affect the performance of
diagnosis in digital mammography as it increases the difficulty in finding
abnormalities in a mammogram. Digital mammograms are only able to
yield the best accuracy in the result for the women who are under the age
of 50 and absent from menopause or undergoes menopause in a period
of less than one year.
Women who undergo opportunistic screening experience a
decrease of 2% risk in breast cancer [3]. This shows the importance of
screening in the early stage of the breast cancer diagnosis.
The initial motive to carry out this project is to increase the
survival rate of the breast cancer patient. This is because through the case
study done by the National Cancer Registry (NCR) in the year 2003, it
was found out that 3738 new cases of breast cancer were reported.
Through the statistics done by NCR, the age standardized incidence rate
(ASR) of 46.2 per 100,000 women which means that women in Malaysia
have the percentage of 0.05% experience breast cancer in their lifetime
[1]. In the research [4], breast cancer was categorized as the fifth in the
cause of death from cancer overall. Hence, the high rate of women
affected by breast cancer raise concern and better diagnosis in digital
mammograms has to be produced.
125
Bioengineering Principle and Technology Applications Volume 2 ISBN 978-967-2306-26-9 2019
Besides, the data collected from NCR in the research [5], the survival
rate of the breast cancer patient relies on the stage at diagnosis. Stage 1
had the best survival of 81.7%, Stage 2 with 72.4%, Stage 3 with 39.9%
and Stage 4 with 12.9%. Through the study, it was found that the survival
rate of the patient declines with the increasing stage at diagnosis. To
overcome this problem, the digital mammograms which are able to detect
the early symptoms of the breast cancer should be used to carry out a
diagnosis to provide an immediate and accurate result in an early stage
at diagnosis.
10.1 MAMMOGRAPHY AND MAMMOGRAPHY IMAGES
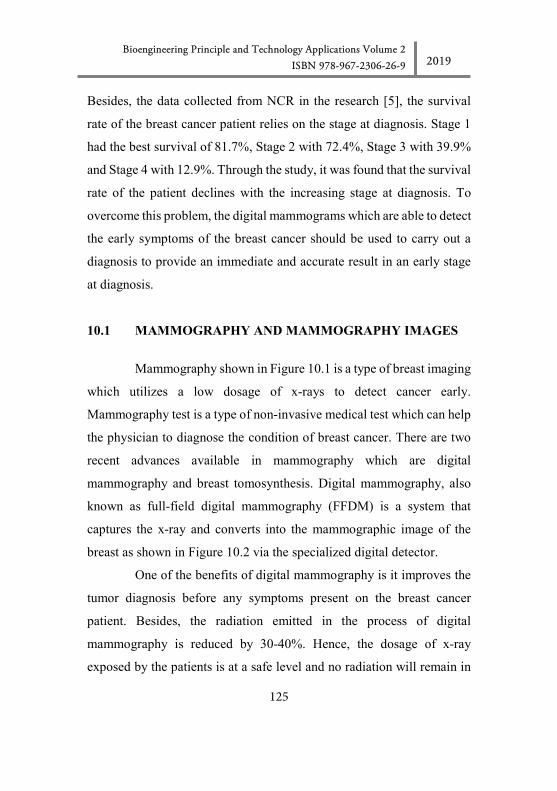
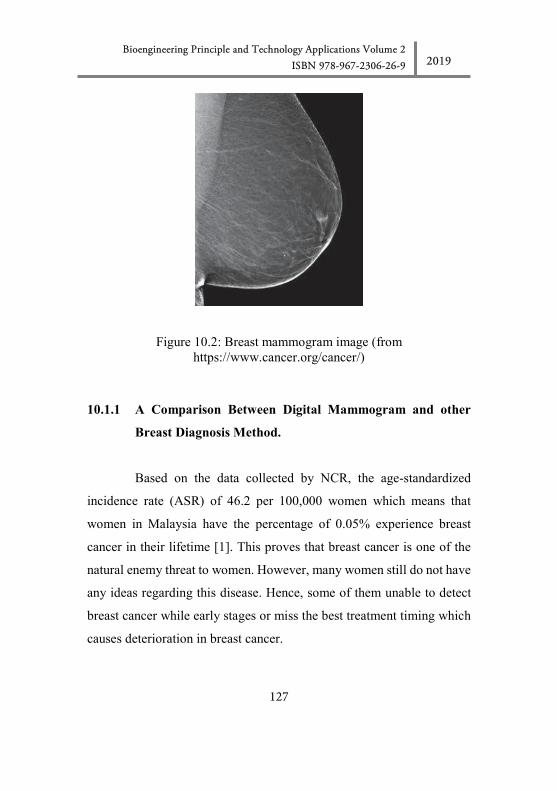
Mammography shown in Figure 10.1 is a type of breast imaging
which utilizes a low dosage of x-rays to detect cancer early.
Mammography test is a type of non-invasive medical test which can help
the physician to diagnose the condition of breast cancer. There are two
recent advances available in mammography which are digital
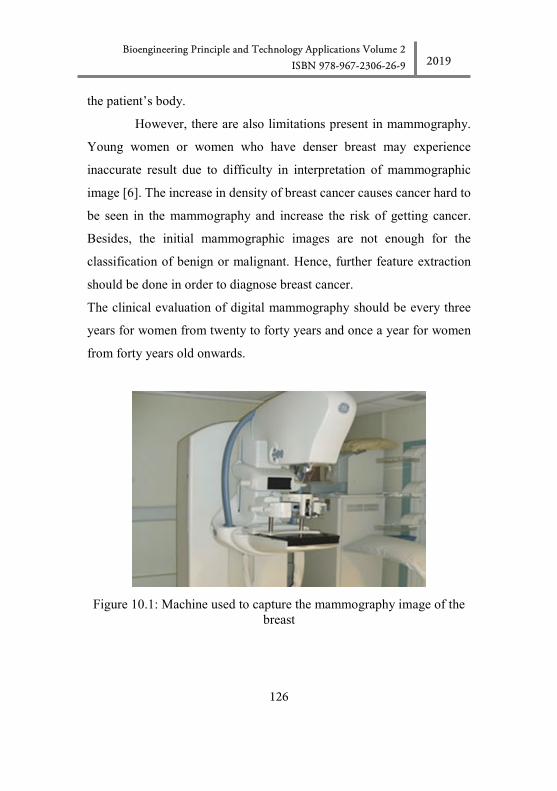
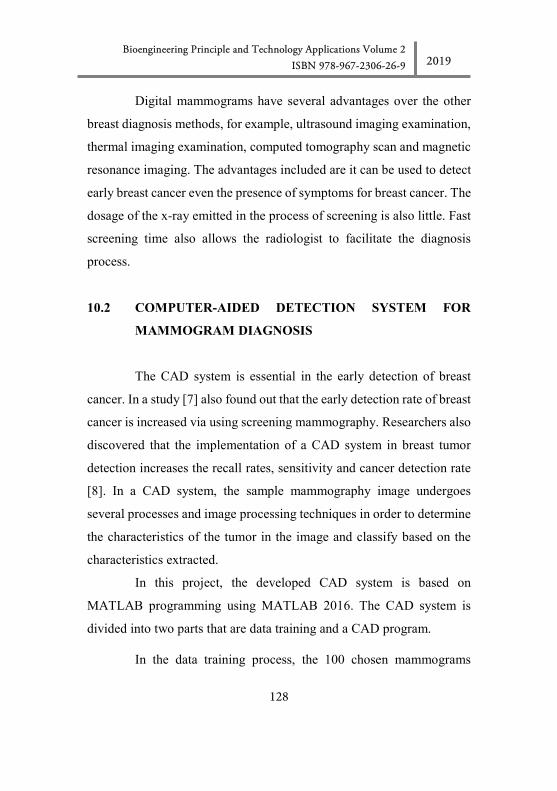
mammography and breast tomosynthesis. Digital mammography, also
known as full-field digital mammography (FFDM) is a system that
captures the x-ray and converts into the mammographic image of the
breast as shown in Figure 10.2 via the specialized digital detector.
One of the benefits of digital mammography is it improves the
tumor diagnosis before any symptoms present on the breast cancer
patient. Besides, the radiation emitted in the process of digital
mammography is reduced by 30-40%. Hence, the dosage of x-ray
exposed by the patients is at a safe level and no radiation will remain in
126
Bioengineering Principle and Technology Applications Volume 2 ISBN 978-967-2306-26-9 2019
the patient’s body.
However, there are also limitations present in mammography.
Young women or women who have denser breast may experience
inaccurate result due to difficulty in interpretation of mammographic
image [6]. The increase in density of breast cancer causes cancer hard to
be seen in the mammography and increase the risk of getting cancer.
Besides, the initial mammographic images are not enough for the
classification of benign or malignant. Hence, further feature extraction
should be done in order to diagnose breast cancer.
The clinical evaluation of digital mammography should be every three
years for women from twenty to forty years and once a year for women
from forty years old onwards.
Figure 10.1: Machine used to capture the mammography image of the breast
127
Bioengineering Principle and Technology Applications Volume 2 ISBN 978-967-2306-26-9 2019
Figure 10.2: Breast mammogram image (from https://www.cancer.org/cancer/)
10.1.1 A Comparison Between Digital Mammogram and other
Breast Diagnosis Method.
Based on the data collected by NCR, the age-standardized
incidence rate (ASR) of 46.2 per 100,000 women which means that
women in Malaysia have the percentage of 0.05% experience breast
cancer in their lifetime [1]. This proves that breast cancer is one of the
natural enemy threat to women. However, many women still do not have
any ideas regarding this disease. Hence, some of them unable to detect
breast cancer while early stages or miss the best treatment timing which
causes deterioration in breast cancer.
128
Bioengineering Principle and Technology Applications Volume 2 ISBN 978-967-2306-26-9 2019
Digital mammograms have several advantages over the other
breast diagnosis methods, for example, ultrasound imaging examination,
thermal imaging examination, computed tomography scan and magnetic
resonance imaging. The advantages included are it can be used to detect
early breast cancer even the presence of symptoms for breast cancer. The
dosage of the x-ray emitted in the process of screening is also little. Fast
screening time also allows the radiologist to facilitate the diagnosis
process.
10.2 COMPUTER-AIDED DETECTION SYSTEM FOR
MAMMOGRAM DIAGNOSIS
The CAD system is essential in the early detection of breast
cancer. In a study [7] also found out that the early detection rate of breast
cancer is increased via using screening mammography. Researchers also
discovered that the implementation of a CAD system in breast tumor
detection increases the recall rates, sensitivity and cancer detection rate
[8]. In a CAD system, the sample mammography image undergoes
several processes and image processing techniques in order to determine
the characteristics of the tumor in the image and classify based on the
characteristics extracted.
In this project, the developed CAD system is based on
MATLAB programming using MATLAB 2016. The CAD system is
divided into two parts that are data training and a CAD program.
In the data training process, the 100 chosen mammograms
129
Bioengineering Principle and Technology Applications Volume 2 ISBN 978-967-2306-26-9 2019
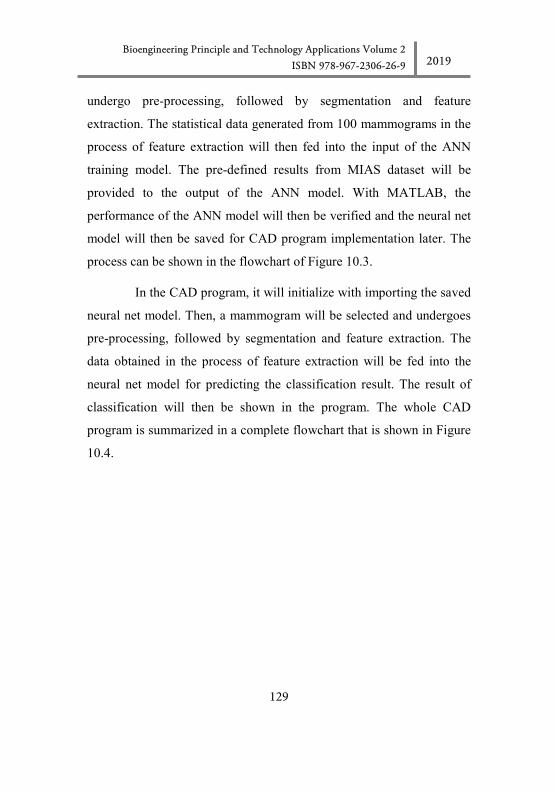
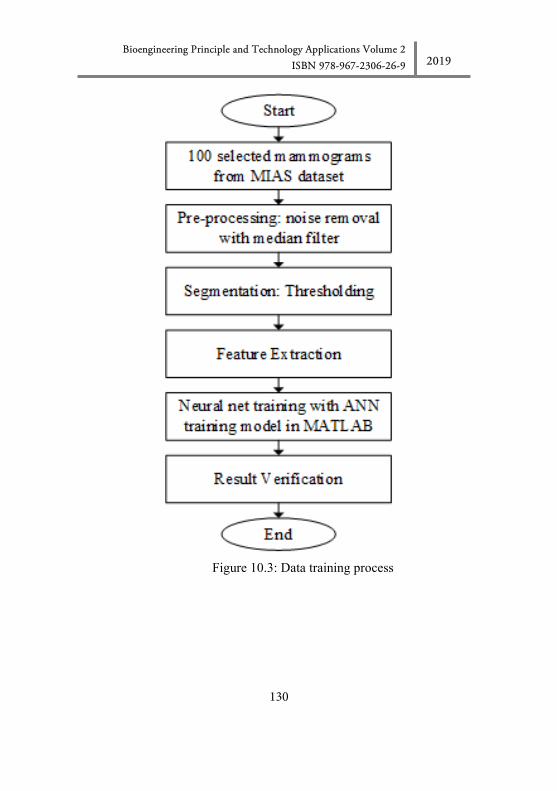
undergo pre-processing, followed by segmentation and feature
extraction. The statistical data generated from 100 mammograms in the
process of feature extraction will then fed into the input of the ANN
training model. The pre-defined results from MIAS dataset will be
provided to the output of the ANN model. With MATLAB, the
performance of the ANN model will then be verified and the neural net
model will then be saved for CAD program implementation later. The
process can be shown in the flowchart of Figure 10.3.
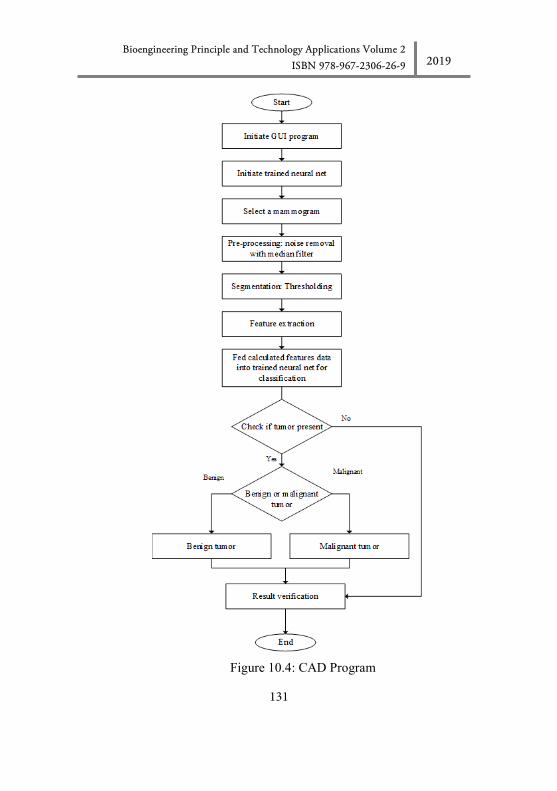
In the CAD program, it will initialize with importing the saved
neural net model. Then, a mammogram will be selected and undergoes
pre-processing, followed by segmentation and feature extraction. The
data obtained in the process of feature extraction will be fed into the
neural net model for predicting the classification result. The result of
classification will then be shown in the program. The whole CAD
program is summarized in a complete flowchart that is shown in Figure
10.4.
130
Bioengineering Principle and Technology Applications Volume 2 ISBN 978-967-2306-26-9 2019
Figure 10.3: Data training process
131
Bioengineering Principle and Technology Applications Volume 2 ISBN 978-967-2306-26-9 2019
Figure 10.4: CAD Program
132
Bioengineering Principle and Technology Applications Volume 2 ISBN 978-967-2306-26-9 2019
10.3 PRELIMINARY RESULTS
In the current state of the project, the CAD system was tested
with 10 samples of the dataset obtained from MIAS dataset.
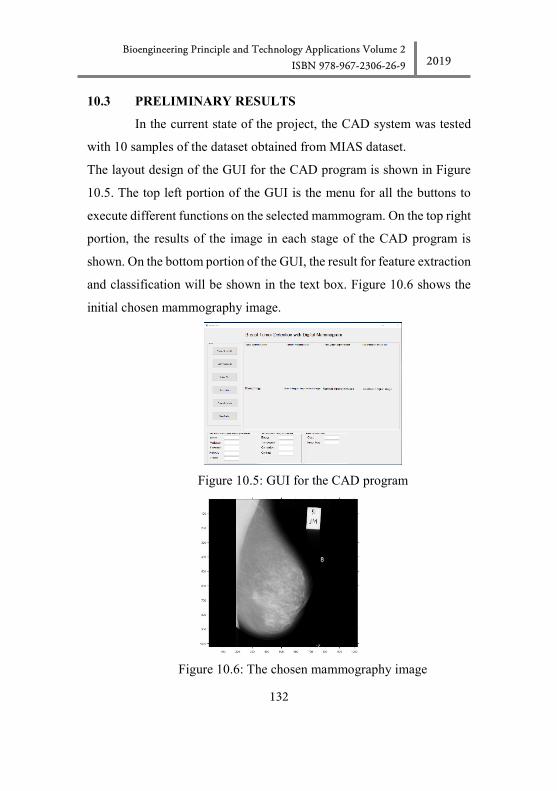
The layout design of the GUI for the CAD program is shown in Figure
10.5. The top left portion of the GUI is the menu for all the buttons to
execute different functions on the selected mammogram. On the top right
portion, the results of the image in each stage of the CAD program is
shown. On the bottom portion of the GUI, the result for feature extraction
and classification will be shown in the text box. Figure 10.6 shows the
initial chosen mammography image.
Figure 10.5: GUI for the CAD program
Figure 10.6: The chosen mammography image
133
Bioengineering Principle and Technology Applications Volume 2 ISBN 978-967-2306-26-9 2019
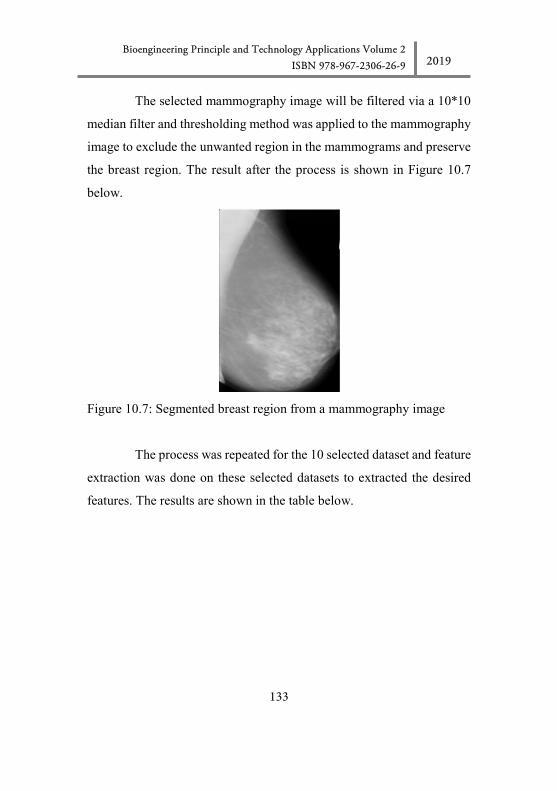
The selected mammography image will be filtered via a 10*10
median filter and thresholding method was applied to the mammography
image to exclude the unwanted region in the mammograms and preserve
the breast region. The result after the process is shown in Figure 10.7
below.
Figure 10.7: Segmented breast region from a mammography image
The process was repeated for the 10 selected dataset and feature
extraction was done on these selected datasets to extracted the desired
features. The results are shown in the table below.
134
Bioengineering Principle and Technology Applications Volume 2 ISBN 978-967-2306-26-9 2019
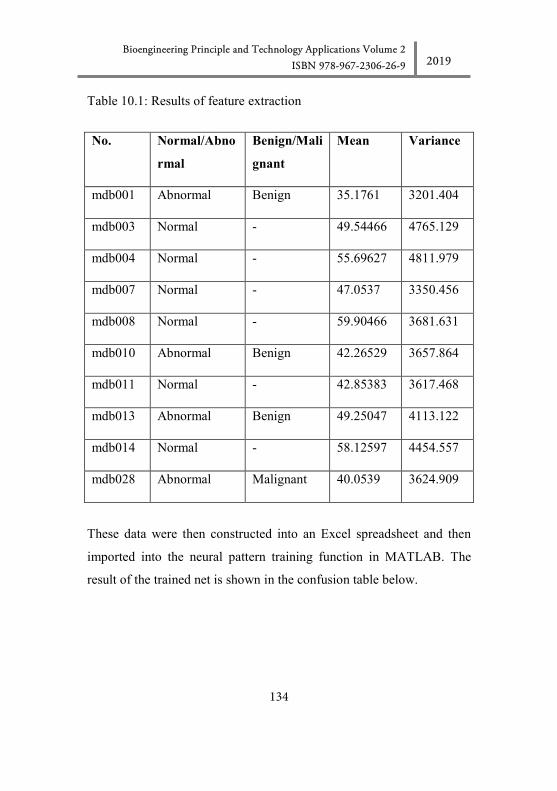
Table 10.1: Results of feature extraction
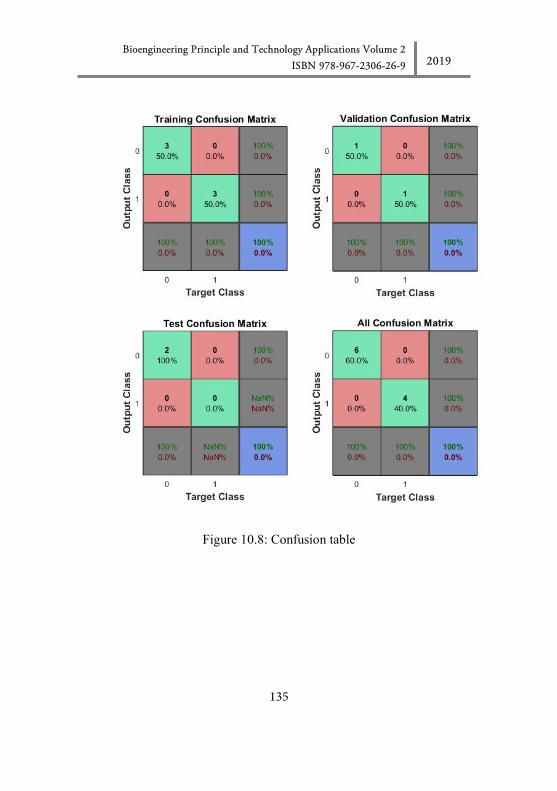
These data were then constructed into an Excel spreadsheet and then
imported into the neural pattern training function in MATLAB. The
result of the trained net is shown in the confusion table below.
No. Normal/Abno
rmal
Benign/Mali
gnant
Mean Variance
mdb001 Abnormal Benign 35.1761 3201.404
mdb003 Normal - 49.54466 4765.129
mdb004 Normal - 55.69627 4811.979
mdb007 Normal - 47.0537 3350.456
mdb008 Normal - 59.90466 3681.631
mdb010 Abnormal Benign 42.26529 3657.864
mdb011 Normal - 42.85383 3617.468
mdb013 Abnormal Benign 49.25047 4113.122
mdb014 Normal - 58.12597 4454.557
mdb028 Abnormal Malignant 40.0539 3624.909
135
Bioengineering Principle and Technology Applications Volume 2 ISBN 978-967-2306-26-9 2019
Figure 10.8: Confusion table

136
Bioengineering Principle and Technology Applications Volume 2 ISBN 978-967-2306-26-9 2019
10.4 DISCUSSION
Since the numbers of dataset used in the project currently is 10
and the features used in the classification only consists of 2 types which
are mean and variance, it is expected that the accuracy, specificity,
sensitivity and precision of the CAD system may be affected and
encounter slight performance degradation due to the increasing number
of features and dataset.
Besides, the pectoral muscles in the segmented breast region
will also affected the classification results. Hence, removal of pectoral
muscles is important so that the only region undergoes feature extraction
is only consists of the breast region.
10.5 CONCLUSION
The next phase of this project is the training of 100
mammograms of MIAS dataset and produce a high-performance neural
net. The neural net will then be imported into the developed GUI
program to perform classification later.
It is expected that the CAD program is able to perform breast
tumor diagnosis and classification on a benign or malignant
mammogram. The result for accuracy, specificity, sensitivity and
precision of the CAD system will be improved.
137
Bioengineering Principle and Technology Applications Volume 2 ISBN 978-967-2306-26-9 2019
REFERENCES [1] Ferlay J., Shin H.R., Bray F., Forman D., Mathers C., Parkin D.M.,
2010. Estimates of worldwide burden of cancer in 2008: GLOBOCAN 2008. International Journal of Cancer. 127(12): 2893–917.
[2] Pisano, E. D., Gatsonis, C., Hendrick, E., Yaffe, M., Baum, J. K., Acharyya, S., and Rebner, M., 2005. Diagnostic Performance of Digital versus Film Mammography for Breast-Cancer Screening. New England Journal of Medicine 353: 1773-1783.
[3] Hassan N., Kee Ho W., Mariapun S., and Hwang Teo S., 2015. A cross sectional study on the motivators for Asian women to attend opportunistic mammography screening in a private hospital in Malaysia: the MyMammo study. BMC Public Health.
[4] Parkin, D.M., et al., 2005 Global cancer statistics, 2002. CA: A Cancer Journal for Clinicians 55: 74-108.
[5] Cheng, H. Y., Taib, N. M., and I. M., 2005. Epidemiology of breast cancer in Malaysia. Proceedings of the Asian Breast Diseases Association (ABDA) 3rd Teaching.
[6] García-Manso, A., García-Orellana, C. J., González-Velasco, H. M., Gallardo- Caballero, R., and Macías-Macías, M., 2013. Study of the effect of breast tissue density on detection of masses in mammograms. Computational and mathematical methods in medicine 2013: 213794.
[7] Lauby-Secretan, B., Scoccianti, C., Loomis, D., Benbrahim-Tallaa, L., Bouvard, V., Bianchini, F., and Straif, K., 2015. Breast-Cancer Screening — Viewpoint of the IARC Working Group. New England Journal of Medicine 372(24): 2353–2358.
[8] Henriksen E. L., Carlsen J. F., Vejborg I. MM, Nielsen M. B., and Lauridsen C. A., 2018. The efficacy of using computer-aided detection (CAD) for detection of breast cancer in mammography screening: a systematic review. Acta Radiologica.