CEMRC H1N1 Presentation 20100614
15
Inpatient capacity margin at children's hospitals during the fall 2009 H1N1 influenza pandemic Marion R. Sills, MD, MPH,
-
Upload
marion-sills -
Category
Healthcare
-
view
275 -
download
0
Transcript of CEMRC H1N1 Presentation 20100614
Inpatient capacity margin at children's hospitals during the fall 2009 H1N1 influenza pandemic
Marion R. Sills, MD, MPH,
Objectives• Objectives:
Compare occupancy—non-ICU and ICU—during the fall 2009 pandemic to baseline numbers
Measure how close each hospital came to threshold occupancy—non-ICU and ICU
Measure how much of an increase in ED admissions it would have taken to fill each hospital (and each ICU)

Background• March 2009: “swine flu” reported with 6% case
fatality rate in Mexico; Mexico City shut down• April 2009: public health emergency declared in US• April 2010: CDC estimate of
H1N1 case fatality rate in US: 0.02% (0.006% in children 0-17 years)
H1N1 case hospitalization rate: 0.45% (0.44% in children 0-17 years)
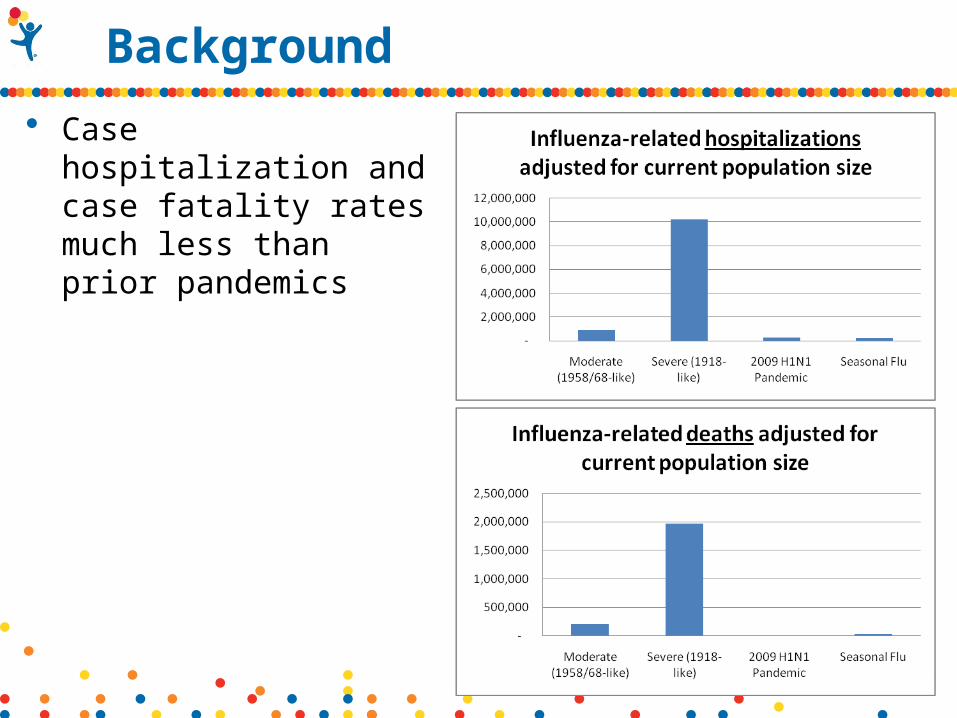
Background• Case hospitalization
and case fatality rates much less than prior pandemics
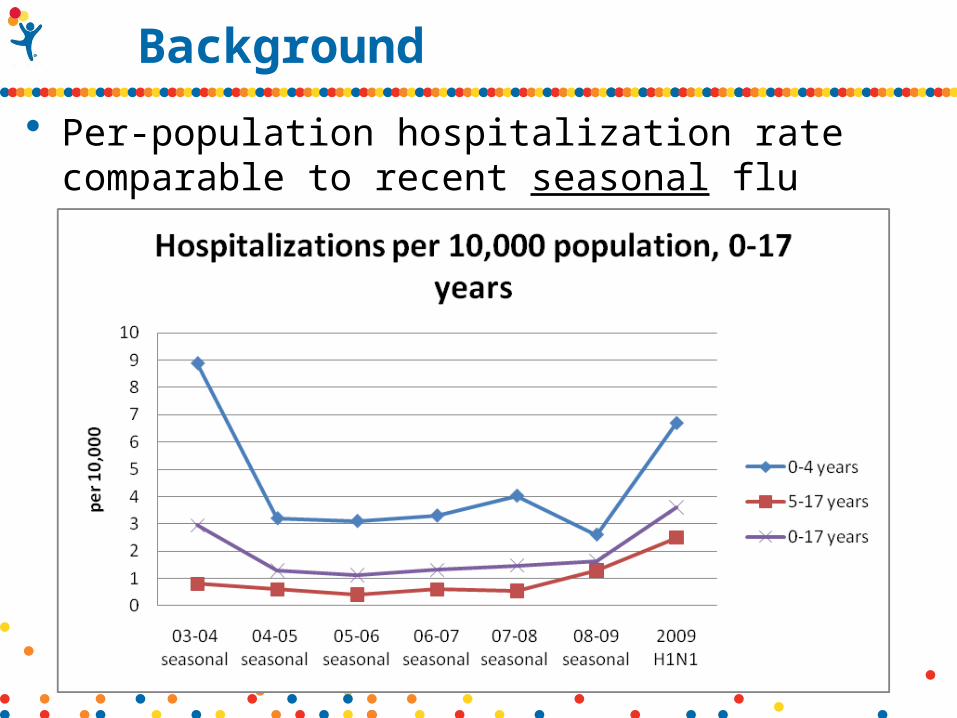
Background• Per-population hospitalization rate
comparable to recent seasonal flu years
Methods• Inpatient data from Pediatric Health Information
System (PHIS) database• 41 children’s hospitals
Methods
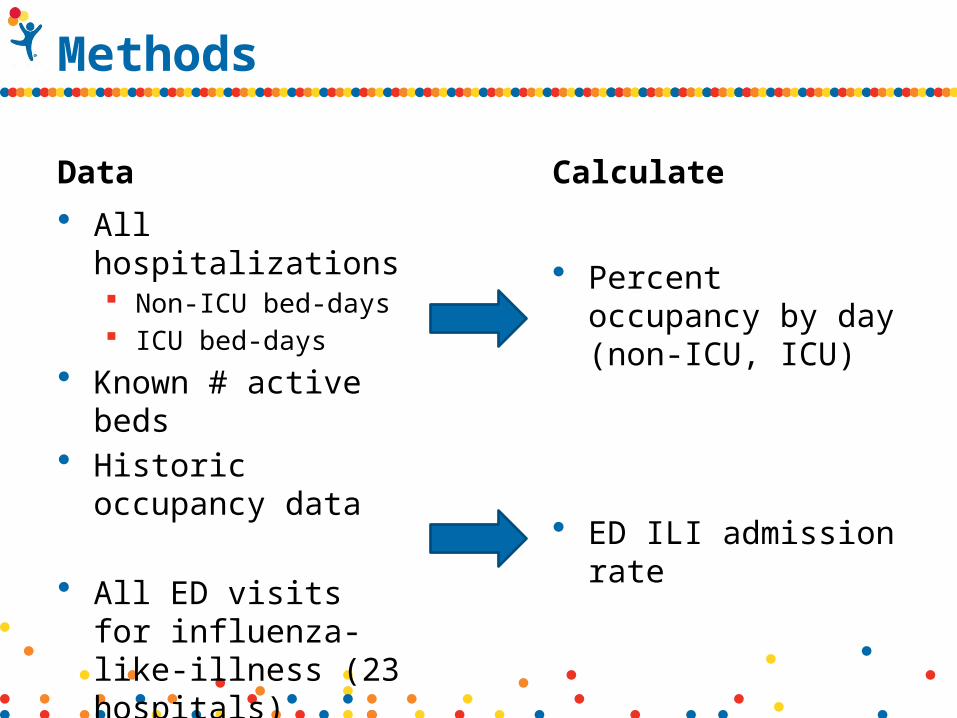
Data• All hospitalizations
Non-ICU bed-days ICU bed-days
• Known # active beds
• Historic occupancy data
• All ED visits for influenza-like-illness (23 hospitals)
Calculate
• Percent occupancy by day (non-ICU, ICU)
• ED ILI admission rate

Methods• Objective 1: Compare occupancy—non-ICU and ICU—
during the fall 2009 pandemic to baseline numbers• Same weeks (35-45) for 2008 (charted below)• Seasonal flu (weeks 4-11 of 2009) for 2008-09
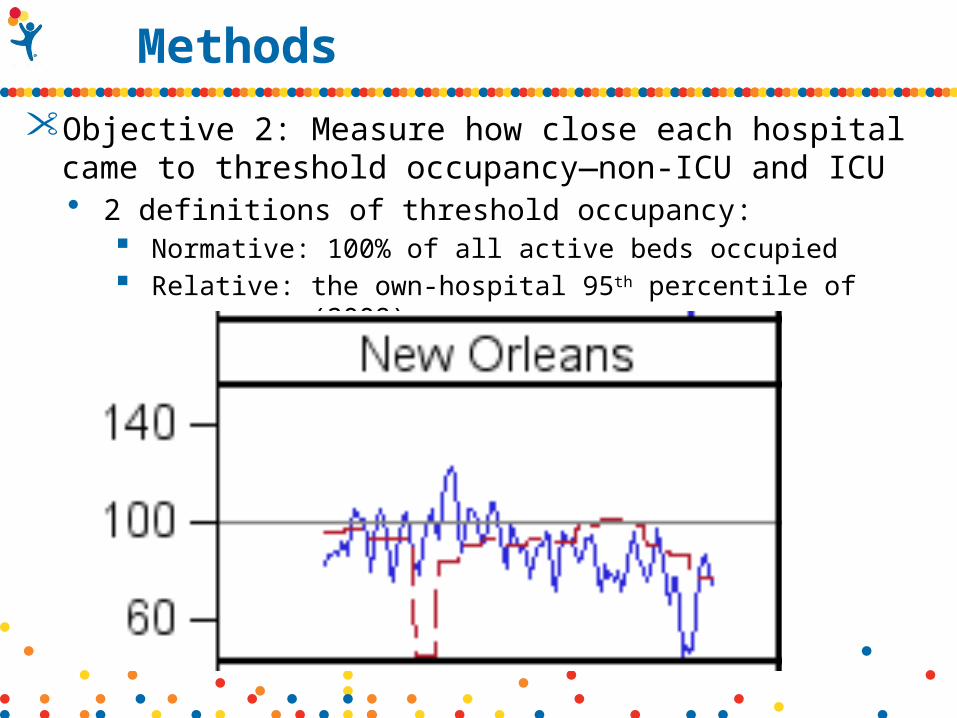
Methods• Objective 2: Measure how close each hospital came
to threshold occupancy—non-ICU and ICU• 2 definitions of threshold occupancy:
Normative: 100% of all active beds occupied Relative: the own-hospital 95th percentile of occupancy
(2008)
Methods• Objective 2: Measure how close each hospital came
to threshold occupancy—non-ICU and ICU How best to express this?
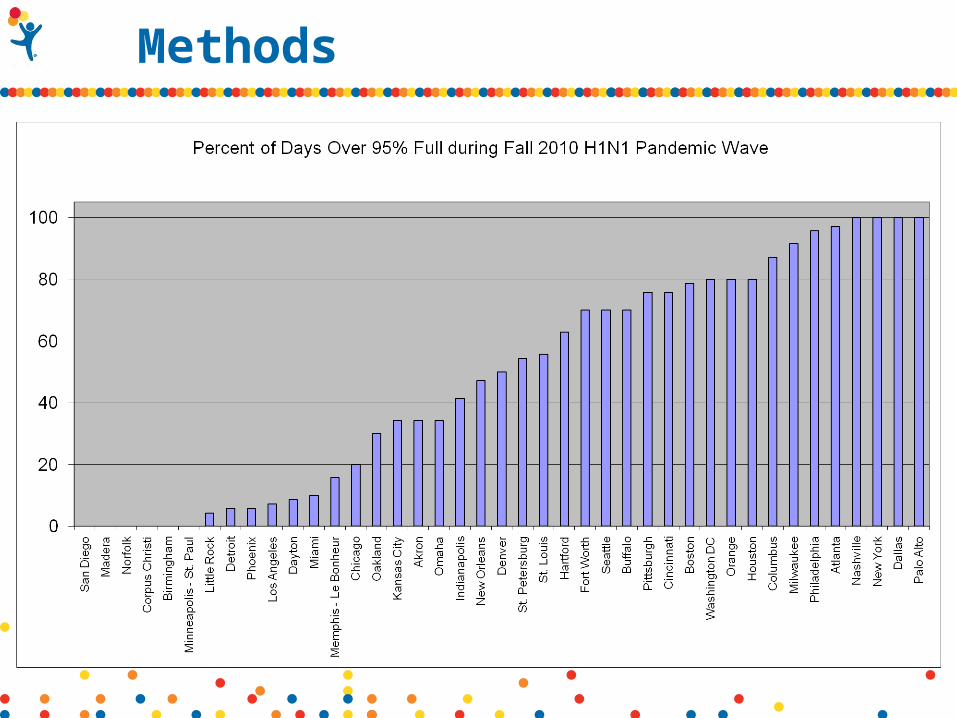
• Proportion of days over threshold occupancy during pandemic period?
• Some component of duration: X weeks of Y% of days over threshold?
• Number of bed-days that could have been filled daily before threshold occupancy was reached?
• Number of additional patients that could have been accepted daily before threshold occupancy was reached?
Methods
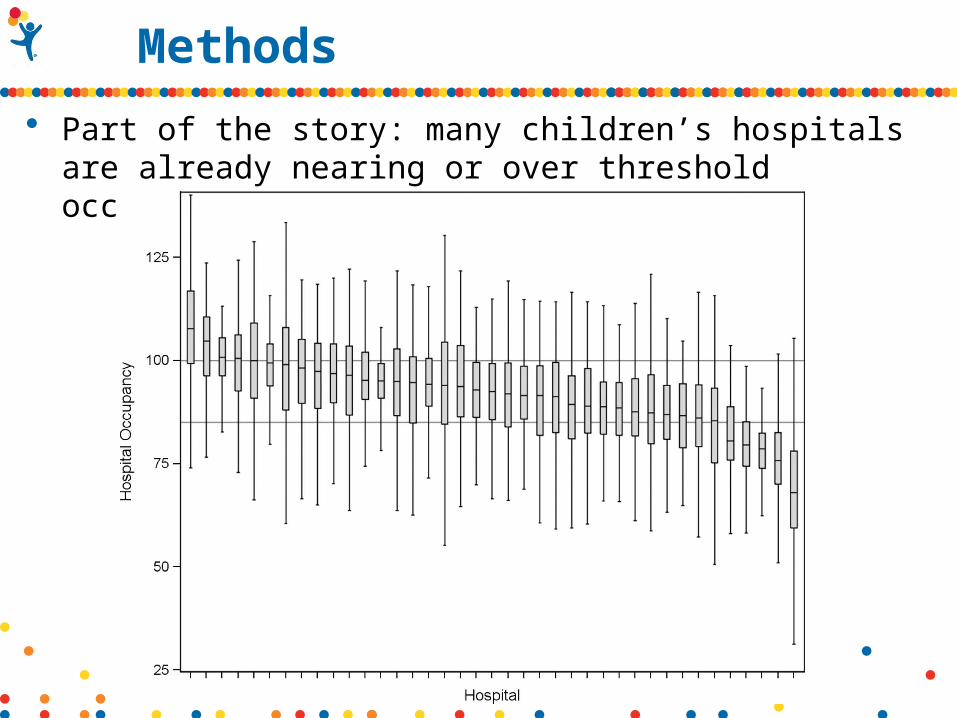
Methods• Part of the story: many children’s hospitals are
already nearing or over threshold occupancy (2006 data)

Methods Objective 3: Measure how much of an increase in ED
admissions it would have taken to fill each hospital (and each ICU)
For each hospital, calculate actual ED-to-non-ICU and ED-to-ICU admit rate among all patients with ILI
Calculate how much higher this rate would have had to be to fill all beds
Select a bad flu year (pandemic flu year? recent seasonal flu year?) and re-do the modeling for Objective 2 to show how full hospitals would have been, and how many excess beds we would have needed (i.e., how many would have boarded in the ED)
Methods Objective 3: Measure how much of an increase in ED
admissions it would have taken to fill each hospital (and each ICU)
Assumptions: • All ED-to-hospital admissions with discharge
diagnosis of ILI had H1N1 influenza• All inpatients with influenza were admitted via that
hospital’s ED• ED-to-hospital admissions were distributed evenly
throughout the study period