Can sub-Saharan Africa feed itself? · goal of its Action Plan for an Africa n agricultural...
6
Can sub-Saharan Africa feed itself? Martin K. van Ittersum a,1 , Lenny G. J. van Bussel a , Joost Wolf a , Patricio Grassini b , Justin van Wart b , Nicolas Guilpart b , Lieven Claessens c , Hugo de Groot d , Keith Wiebe e , Daniel Mason-D’Croz e , Haishun Yang b , Hendrik Boogaard d , Pepijn A. J. van Oort f,g , Marloes P. van Loon a , Kazuki Saito f , Ochieng Adimo h , Samuel Adjei-Nsiah i , Alhassane Agali j , Abdullahi Bala k , Regis Chikowo l , Kayuki Kaizzi m , Mamoutou Kouressy n , Joachim H. J. R. Makoi o , Korodjouma Ouattara p , Kindie Tesfaye q , and Kenneth G. Cassman b a Plant Production Systems Group, Wageningen University, 6700 AK Wageningen, The Netherlands; b Department of Agronomy and Horticulture, University of Nebraska, Lincoln, NE 68583-0915; c International Crops Research Institute for the Semi-Arid Tropics, 00623 Nairobi, Kenya; d Wageningen Environmental Research, Wageningen University & Research, 6700 AA, Wageningen, The Netherlands; e Environment and Production Technology Division, International Food Policy Research Institute, Washington, DC 20006-1002; f Africa Rice Center, Sustainable Productivity Enhancement Program, 01 BP 2031, Cotonou, Benin; g Centre for Crop Systems Analysis, Wageningen University, 6700 AK Wageningen, The Netherlands; h Jomo Kenyatta University of Agriculture and Technology, 00200 Nairobi, Kenya; i International Institute of Tropical Agriculture, Tamale, Ghana; j AGRHYMET Regional Centre, BP 11011 Niamey, Niger; k Department of Soil Science, Federal University of Technology Minna, P.M.B 65 Gidan-Kwano, Niger State, Nigeria; l Crop Science Department, University of Zimbabwe, MP167 Mount Pleasant, Harare, Zimbabwe; m National Agricultural Research Laboratories, Kampala Nabweru 7065, Uganda; n Institut d’Economie Rurale, BP 258 Bamako, Mali; o National Irrigation Commission, Ministry of Water and Irrigation, 14473 Dar es Salaam, The United Republic of Tanzania; p Institut de l’Environnement et de Recherches Agricoles, 04 BP: 8645 Ouagadougou 04, Ouagadougou, Burkina Faso; and q International Maize and Wheat Improvement Centre, Addis Ababa, Ethiopia Edited by Robert John Scholes, University of the Witwatersrand, Wits, South Africa, and approved November 3, 2016 (received for review June 28, 2016) Although global food demand is expected to increase 60% by 2050 compared with 2005/2007, the rise will be much greater in sub- Saharan Africa (SSA). Indeed, SSA is the region at greatest food security risk because by 2050 its population will increase 2.5-fold and demand for cereals approximately triple, whereas current levels of cereal consumption already depend on substantial imports. At issue is whether SSA can meet this vast increase in cereal demand without greater reliance on cereal imports or major expansion of agricultural area and associated biodiversity loss and greenhouse gas emissions. Recent studies indicate that the global increase in food demand by 2050 can be met through closing the gap between current farm yield and yield potential on existing cropland. Here, however, we estimate it will not be feasible to meet future SSA cereal demand on existing production area by yield gap closure alone. Our agronomically robust yield gap analysis for 10 countries in SSA using location-specific data and a spatial upscaling approach reveals that, in addition to yield gap closure, other more complex and uncertain components of intensification are also needed, i.e., increasing cropping intensity (the number of crops grown per 12 mo on the same field) and sustainable expansion of irrigated production area. If intensification is not successful and massive cropland land expansion is to be avoided, SSA will depend much more on imports of cereals than it does today. yield gaps | food self-sufficiency | food security | food availability | cereals P roducing adequate food to meet global demand by 2050 is widely recognized as a major challenge (1, 2). Increased price volatility of major food crops (3, 4) and an abrupt surge in land area devoted to crop production since approximately 2002 (5) reflect the powerful forces underpinning this challenge. A number of studies argue it is possible to meet projected global food demand on existing agricultural land by narrowing gaps between actual farm yields and yield potential (3, 6–11). Yield potential assumes un- constrained crop growth and perfect management that avoids lim- itations from nutrient deficiencies and water stress, and reductions from weeds, pests, and diseases (12, 13). Yield potential is therefore location-specific and depends on solar radiation, temperature, and water supply during the crop growing season and can be calculated for both rainfed (water-limited yield potential) and irrigated con- ditions (12, 13). The difference between the yield potential and actual farm yield is called the yield gap. Although meeting the increased global demand may be possible, a more pressing question is whether and how different regions of the world can meet their respective demands for staple food crops. More specifically, although sub-Saharan Africa’s current self-sufficiency ratio in staple cereals is just above 0.8 (Fig. 1A), it is among the (sub) continents with the lowest cereal self-sufficiency ratio while it has the greatest projected increase in population (14, 15). Self-sufficiency is defined here as the ratio between domestic production and total consumption (or demand); the latter is assumed to be equal to the domestic production plus net imports. While recognizing that food self-sufficiency is not an essential precondition for food security, self- sufficiency for low-income developing countries is of great concern because many lack adequate foreign exchange reserves to pay for food imports and infrastructure to store and distribute it efficiently. Substantial reliance on food imports is only possible if economic development is sufficient to afford them, and economic development of low-income countries to support such imports does not occur without strong agricultural development (16, 17). Apart from city states such as Singapore, there are no examples of low income countries that successfully industrialized in the second half of the 20th century while importing major shares of their food supply. Essentially, all success stories started with an economic revolution in the agricultural sector. Indeed, the African Development Bank explicitly highlights self-sufficiency in food production as a principal Significance The question whether sub-Saharan Africa (SSA) can be self- sufficient in cereals by 2050 is of global relevance. Currently, SSA is amongst the (sub)continents with the largest gap be- tween cereal consumption and production, whereas its pro- jected tripling demand between 2010 and 2050 is much greater than in other continents. We show that nearly complete clo- sure of the gap between current farm yields and yield potential is needed to maintain the current level of cereal self-sufficiency (approximately 80%) by 2050. For all countries, such yield gap closure requires a large, abrupt acceleration in rate of yield increase. If this acceleration is not achieved, massive cropland expansion with attendant biodiversity loss and greenhouse gas emissions or vast import dependency are to be expected. Author contributions: M.K.v.I., L.G.J.v.B., J.W., P.G., and K.G.C. designed research; M.K.v.I., L.G.J.v.B., J.W., P.G., J.v.W., N.G., L.C., H.d.G., K.W., H.Y., H.B., P.A.J.v.O., K.S., and K.G.C. performed research; M.K.v.I., L.G.J.v.B., J.W., J.v.W., N.G., H.d.G., D.M.-D., P.A.J.v.O., M.P.v.L., O.A., S.A.-N., A.A., A.B., R.C., K.K., M.K., J.H.J.R.M., K.O., and K.T. analyzed data and results; M.K.v.I., P.G., and K.G.C. wrote the paper; H.d.G. database and visualization; and O.A., S.A.-N., A.A., A.B., R.C., K.K., M.K., J.H.J.R.M., K.O., and K.T. collected data. The authors declare no conflict of interest. This article is a PNAS Direct Submission. Freely available online through the PNAS open access option. 1 To whom correspondence should be addressed. Email: [email protected]. This article contains supporting information online at www.pnas.org/lookup/suppl/doi:10. 1073/pnas.1610359113/-/DCSupplemental. 14964–14969 | PNAS | December 27, 2016 | vol. 113 | no. 52 www.pnas.org/cgi/doi/10.1073/pnas.1610359113 Downloaded by guest on May 31, 2020
Transcript of Can sub-Saharan Africa feed itself? · goal of its Action Plan for an Africa n agricultural...
Can sub-Saharan Africa feed itself?Martin K. van Ittersuma,1, Lenny G. J. van Bussela, Joost Wolfa, Patricio Grassinib, Justin van Wartb, Nicolas Guilpartb,Lieven Claessensc, Hugo de Grootd, Keith Wiebee, Daniel Mason-D’Croze, Haishun Yangb, Hendrik Boogaardd,Pepijn A. J. van Oortf,g, Marloes P. van Loona, Kazuki Saitof, Ochieng Adimoh, Samuel Adjei-Nsiahi, Alhassane Agalij,Abdullahi Balak, Regis Chikowol, Kayuki Kaizzim, Mamoutou Kouressyn, Joachim H. J. R. Makoio,Korodjouma Ouattarap, Kindie Tesfayeq, and Kenneth G. Cassmanb
aPlant Production Systems Group, Wageningen University, 6700 AK Wageningen, The Netherlands; bDepartment of Agronomy and Horticulture,University of Nebraska, Lincoln, NE 68583-0915; cInternational Crops Research Institute for the Semi-Arid Tropics, 00623 Nairobi, Kenya; dWageningenEnvironmental Research, Wageningen University & Research, 6700 AA, Wageningen, The Netherlands; eEnvironment and Production Technology Division,International Food Policy Research Institute, Washington, DC 20006-1002; fAfrica Rice Center, Sustainable Productivity Enhancement Program, 01 BP 2031,Cotonou, Benin; gCentre for Crop Systems Analysis, Wageningen University, 6700 AK Wageningen, The Netherlands; hJomo Kenyatta University ofAgriculture and Technology, 00200 Nairobi, Kenya; iInternational Institute of Tropical Agriculture, Tamale, Ghana; jAGRHYMET Regional Centre, BP 11011Niamey, Niger; kDepartment of Soil Science, Federal University of Technology Minna, P.M.B 65 Gidan-Kwano, Niger State, Nigeria; lCrop ScienceDepartment, University of Zimbabwe, MP167 Mount Pleasant, Harare, Zimbabwe; mNational Agricultural Research Laboratories, Kampala Nabweru 7065,Uganda; nInstitut d’Economie Rurale, BP 258 Bamako, Mali; oNational Irrigation Commission, Ministry of Water and Irrigation, 14473 Dar es Salaam,The United Republic of Tanzania; pInstitut de l’Environnement et de Recherches Agricoles, 04 BP: 8645 Ouagadougou 04, Ouagadougou, Burkina Faso; andqInternational Maize and Wheat Improvement Centre, Addis Ababa, Ethiopia
Edited by Robert John Scholes, University of the Witwatersrand, Wits, South Africa, and approved November 3, 2016 (received for review June 28, 2016)
Although global food demand is expected to increase 60% by 2050compared with 2005/2007, the rise will be much greater in sub-Saharan Africa (SSA). Indeed, SSA is the region at greatest foodsecurity risk because by 2050 its population will increase 2.5-foldand demand for cereals approximately triple, whereas current levelsof cereal consumption already depend on substantial imports. Atissue is whether SSA can meet this vast increase in cereal demandwithout greater reliance on cereal imports or major expansion ofagricultural area and associated biodiversity loss and greenhousegas emissions. Recent studies indicate that the global increase infood demand by 2050 can be met through closing the gap betweencurrent farm yield and yield potential on existing cropland. Here,however, we estimate it will not be feasible to meet future SSAcereal demand on existing production area by yield gap closurealone. Our agronomically robust yield gap analysis for 10 countriesin SSA using location-specific data and a spatial upscaling approachreveals that, in addition to yield gap closure, other more complexand uncertain components of intensification are also needed, i.e.,increasing cropping intensity (the number of crops grown per 12 moon the same field) and sustainable expansion of irrigated productionarea. If intensification is not successful and massive cropland landexpansion is to be avoided, SSA will depend much more on importsof cereals than it does today.
yield gaps | food self-sufficiency | food security | food availability | cereals
Producing adequate food to meet global demand by 2050 iswidely recognized as a major challenge (1, 2). Increased price
volatility of major food crops (3, 4) and an abrupt surge in land areadevoted to crop production since approximately 2002 (5) reflect thepowerful forces underpinning this challenge. A number of studiesargue it is possible to meet projected global food demand onexisting agricultural land by narrowing gaps between actual farmyields and yield potential (3, 6–11). Yield potential assumes un-constrained crop growth and perfect management that avoids lim-itations from nutrient deficiencies and water stress, and reductionsfrom weeds, pests, and diseases (12, 13). Yield potential is thereforelocation-specific and depends on solar radiation, temperature, andwater supply during the crop growing season and can be calculatedfor both rainfed (water-limited yield potential) and irrigated con-ditions (12, 13). The difference between the yield potential andactual farm yield is called the yield gap.Although meeting the increased global demand may be possible, a
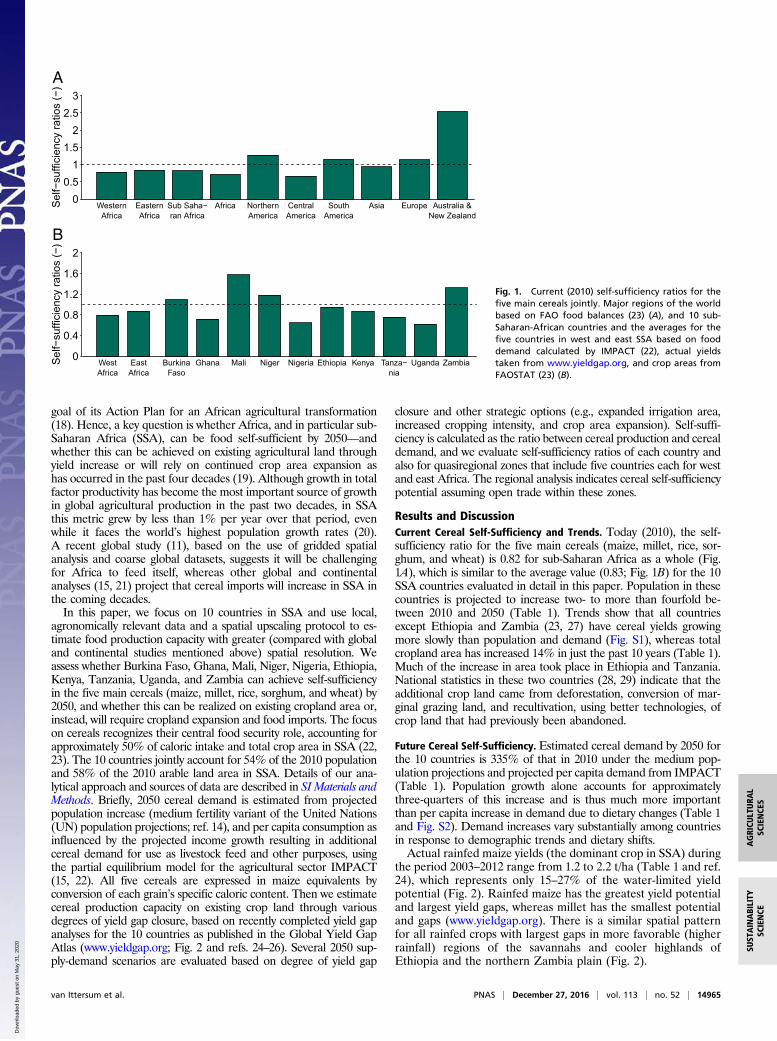
more pressing question is whether and how different regions of theworld can meet their respective demands for staple food crops. Morespecifically, although sub-Saharan Africa’s current self-sufficiencyratio in staple cereals is just above 0.8 (Fig. 1A), it is among the (sub)
continents with the lowest cereal self-sufficiency ratio while it has thegreatest projected increase in population (14, 15). Self-sufficiency isdefined here as the ratio between domestic production and totalconsumption (or demand); the latter is assumed to be equal to thedomestic production plus net imports. While recognizing that foodself-sufficiency is not an essential precondition for food security, self-sufficiency for low-income developing countries is of great concernbecause many lack adequate foreign exchange reserves to pay forfood imports and infrastructure to store and distribute it efficiently.Substantial reliance on food imports is only possible if economicdevelopment is sufficient to afford them, and economic developmentof low-income countries to support such imports does not occurwithout strong agricultural development (16, 17). Apart from citystates such as Singapore, there are no examples of low incomecountries that successfully industrialized in the second half of the20th century while importing major shares of their food supply.Essentially, all success stories started with an economic revolutionin the agricultural sector. Indeed, the African Development Bankexplicitly highlights self-sufficiency in food production as a principal
Significance
The question whether sub-Saharan Africa (SSA) can be self-sufficient in cereals by 2050 is of global relevance. Currently,SSA is amongst the (sub)continents with the largest gap be-tween cereal consumption and production, whereas its pro-jected tripling demand between 2010 and 2050 is much greaterthan in other continents. We show that nearly complete clo-sure of the gap between current farm yields and yield potentialis needed to maintain the current level of cereal self-sufficiency(approximately 80%) by 2050. For all countries, such yield gapclosure requires a large, abrupt acceleration in rate of yieldincrease. If this acceleration is not achieved, massive croplandexpansion with attendant biodiversity loss and greenhouse gasemissions or vast import dependency are to be expected.
Author contributions: M.K.v.I., L.G.J.v.B., J.W., P.G., and K.G.C. designed research; M.K.v.I.,L.G.J.v.B., J.W., P.G., J.v.W., N.G., L.C., H.d.G., K.W., H.Y., H.B., P.A.J.v.O., K.S., and K.G.C.performed research; M.K.v.I., L.G.J.v.B., J.W., J.v.W., N.G., H.d.G., D.M.-D., P.A.J.v.O., M.P.v.L.,O.A., S.A.-N., A.A., A.B., R.C., K.K., M.K., J.H.J.R.M., K.O., and K.T. analyzed data and results;M.K.v.I., P.G., and K.G.C. wrote the paper; H.d.G. database and visualization; and O.A., S.A.-N.,A.A., A.B., R.C., K.K., M.K., J.H.J.R.M., K.O., and K.T. collected data.
The authors declare no conflict of interest.
This article is a PNAS Direct Submission.
Freely available online through the PNAS open access option.1To whom correspondence should be addressed. Email: [email protected].
This article contains supporting information online at www.pnas.org/lookup/suppl/doi:10.1073/pnas.1610359113/-/DCSupplemental.
14964–14969 | PNAS | December 27, 2016 | vol. 113 | no. 52 www.pnas.org/cgi/doi/10.1073/pnas.1610359113
Dow
nloa
ded
by g
uest
on
May
31,
202
0
goal of its Action Plan for an African agricultural transformation(18). Hence, a key question is whether Africa, and in particular sub-Saharan Africa (SSA), can be food self-sufficient by 2050—andwhether this can be achieved on existing agricultural land throughyield increase or will rely on continued crop area expansion ashas occurred in the past four decades (19). Although growth in totalfactor productivity has become the most important source of growthin global agricultural production in the past two decades, in SSAthis metric grew by less than 1% per year over that period, evenwhile it faces the world’s highest population growth rates (20).A recent global study (11), based on the use of gridded spatialanalysis and coarse global datasets, suggests it will be challengingfor Africa to feed itself, whereas other global and continentalanalyses (15, 21) project that cereal imports will increase in SSA inthe coming decades.In this paper, we focus on 10 countries in SSA and use local,
agronomically relevant data and a spatial upscaling protocol to es-timate food production capacity with greater (compared with globaland continental studies mentioned above) spatial resolution. Weassess whether Burkina Faso, Ghana, Mali, Niger, Nigeria, Ethiopia,Kenya, Tanzania, Uganda, and Zambia can achieve self-sufficiencyin the five main cereals (maize, millet, rice, sorghum, and wheat) by2050, and whether this can be realized on existing cropland area or,instead, will require cropland expansion and food imports. The focuson cereals recognizes their central food security role, accounting forapproximately 50% of caloric intake and total crop area in SSA (22,23). The 10 countries jointly account for 54% of the 2010 populationand 58% of the 2010 arable land area in SSA. Details of our ana-lytical approach and sources of data are described in SI Materials andMethods. Briefly, 2050 cereal demand is estimated from projectedpopulation increase (medium fertility variant of the United Nations(UN) population projections; ref. 14), and per capita consumption asinfluenced by the projected income growth resulting in additionalcereal demand for use as livestock feed and other purposes, usingthe partial equilibrium model for the agricultural sector IMPACT(15, 22). All five cereals are expressed in maize equivalents byconversion of each grain’s specific caloric content. Then we estimatecereal production capacity on existing crop land through variousdegrees of yield gap closure, based on recently completed yield gapanalyses for the 10 countries as published in the Global Yield GapAtlas (www.yieldgap.org; Fig. 2 and refs. 24–26). Several 2050 sup-ply-demand scenarios are evaluated based on degree of yield gap
closure and other strategic options (e.g., expanded irrigation area,increased cropping intensity, and crop area expansion). Self-suffi-ciency is calculated as the ratio between cereal production and cerealdemand, and we evaluate self-sufficiency ratios of each country andalso for quasiregional zones that include five countries each for westand east Africa. The regional analysis indicates cereal self-sufficiencypotential assuming open trade within these zones.
Results and DiscussionCurrent Cereal Self-Sufficiency and Trends. Today (2010), the self-sufficiency ratio for the five main cereals (maize, millet, rice, sor-ghum, and wheat) is 0.82 for sub-Saharan Africa as a whole (Fig.1A), which is similar to the average value (0.83; Fig. 1B) for the 10SSA countries evaluated in detail in this paper. Population in thesecountries is projected to increase two- to more than fourfold be-tween 2010 and 2050 (Table 1). Trends show that all countriesexcept Ethiopia and Zambia (23, 27) have cereal yields growingmore slowly than population and demand (Fig. S1), whereas totalcropland area has increased 14% in just the past 10 years (Table 1).Much of the increase in area took place in Ethiopia and Tanzania.National statistics in these two countries (28, 29) indicate that theadditional crop land came from deforestation, conversion of mar-ginal grazing land, and recultivation, using better technologies, ofcrop land that had previously been abandoned.
Future Cereal Self-Sufficiency. Estimated cereal demand by 2050 forthe 10 countries is 335% of that in 2010 under the medium pop-ulation projections and projected per capita demand from IMPACT(Table 1). Population growth alone accounts for approximatelythree-quarters of this increase and is thus much more importantthan per capita increase in demand due to dietary changes (Table 1and Fig. S2). Demand increases vary substantially among countriesin response to demographic trends and dietary shifts.Actual rainfed maize yields (the dominant crop in SSA) during
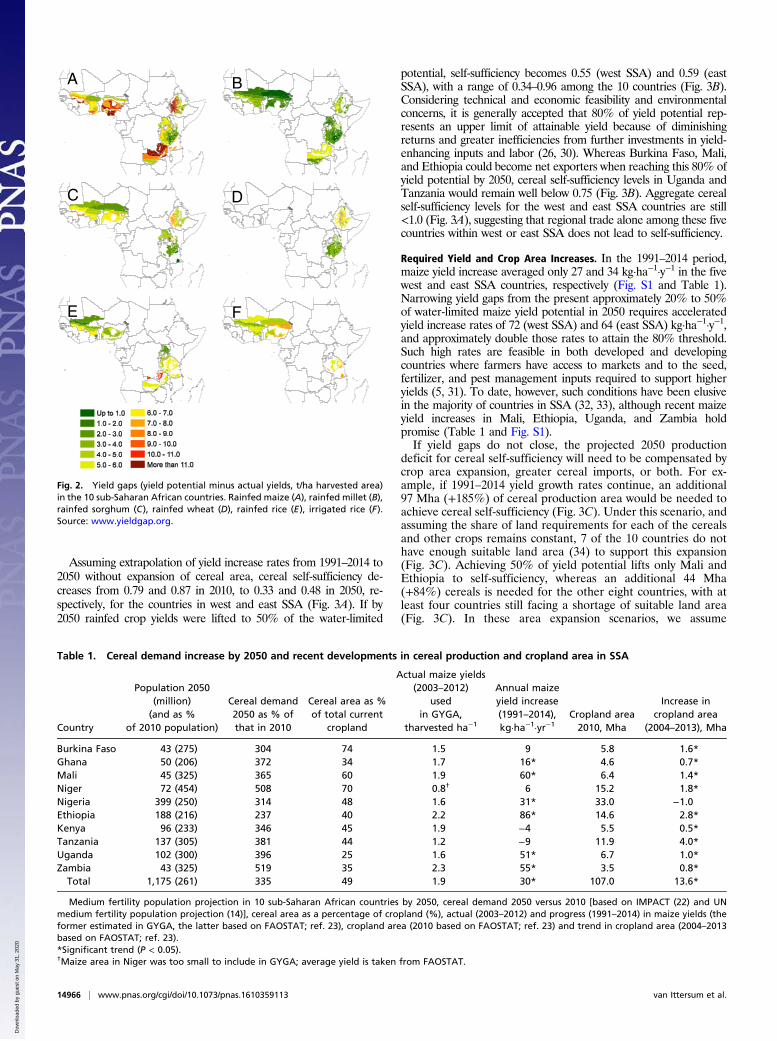
the period 2003–2012 range from 1.2 to 2.2 t/ha (Table 1 and ref.24), which represents only 15–27% of the water-limited yieldpotential (Fig. 2). Rainfed maize has the greatest yield potentialand largest yield gaps, whereas millet has the smallest potentialand gaps (www.yieldgap.org). There is a similar spatial patternfor all rainfed crops with largest gaps in more favorable (higherrainfall) regions of the savannahs and cooler highlands ofEthiopia and the northern Zambia plain (Fig. 2).
Sel
f−su
ffici
ency
ratio
s (−
)
00.5
11.5
22.5
3
WesternAfrica
EasternAfrica
Sub Saha−ran Africa
Africa NorthernAmerica
CentralAmerica
SouthAmerica
Asia Europe Australia &New Zealand
A
Sel
f−su
ffici
ency
ratio
s (−
)
0
0.4
0.8
1.2
1.6
2
WestAfrica
EastAfrica
BurkinaFaso
Ghana Mali Niger Nigeria Ethiopia Kenya Tanza−nia
Uganda Zambia
B
Fig. 1. Current (2010) self-sufficiency ratios for thefive main cereals jointly. Major regions of the worldbased on FAO food balances (23) (A), and 10 sub-Saharan-African countries and the averages for thefive countries in west and east SSA based on fooddemand calculated by IMPACT (22), actual yieldstaken from www.yieldgap.org, and crop areas fromFAOSTAT (23) (B).
van Ittersum et al. PNAS | December 27, 2016 | vol. 113 | no. 52 | 14965
AGRICU
LTURA
LSC
IENCE
SSU
STAINABILITY
SCIENCE
Dow
nloa
ded
by g
uest
on
May
31,
202
0
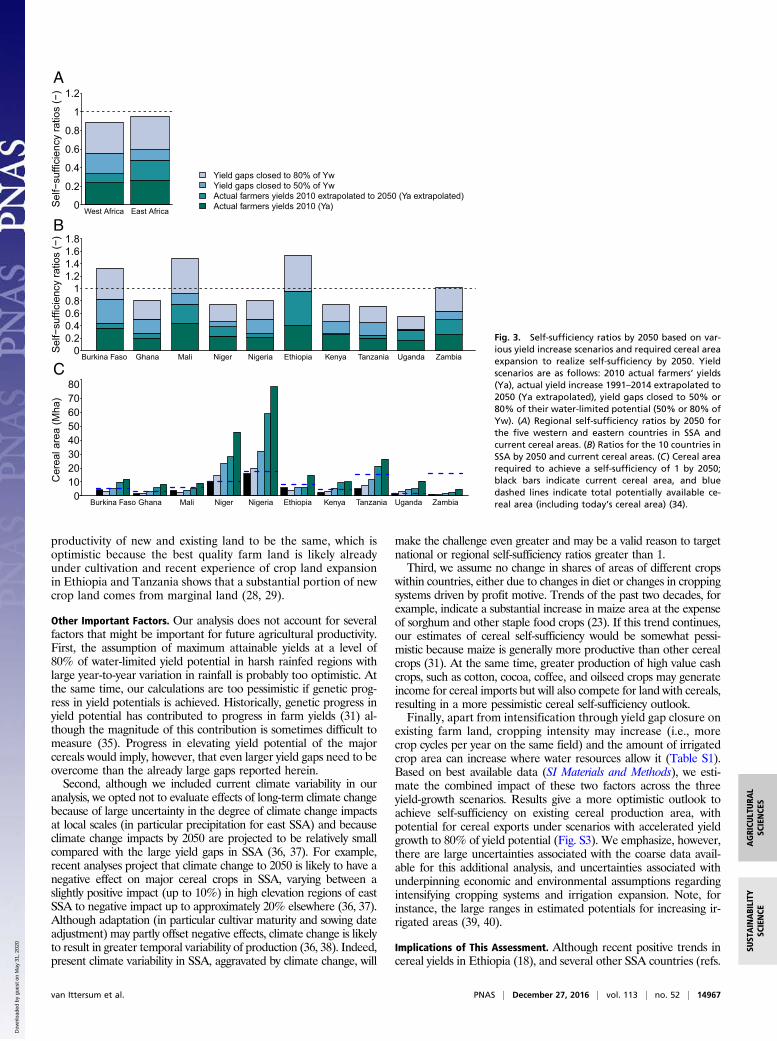
Assuming extrapolation of yield increase rates from 1991–2014 to2050 without expansion of cereal area, cereal self-sufficiency de-creases from 0.79 and 0.87 in 2010, to 0.33 and 0.48 in 2050, re-spectively, for the countries in west and east SSA (Fig. 3A). If by2050 rainfed crop yields were lifted to 50% of the water-limited
potential, self-sufficiency becomes 0.55 (west SSA) and 0.59 (eastSSA), with a range of 0.34–0.96 among the 10 countries (Fig. 3B).Considering technical and economic feasibility and environmentalconcerns, it is generally accepted that 80% of yield potential rep-resents an upper limit of attainable yield because of diminishingreturns and greater inefficiencies from further investments in yield-enhancing inputs and labor (26, 30). Whereas Burkina Faso, Mali,and Ethiopia could become net exporters when reaching this 80% ofyield potential by 2050, cereal self-sufficiency levels in Uganda andTanzania would remain well below 0.75 (Fig. 3B). Aggregate cerealself-sufficiency levels for the west and east SSA countries are still<1.0 (Fig. 3A), suggesting that regional trade alone among these fivecountries within west or east SSA does not lead to self-sufficiency.
Required Yield and Crop Area Increases. In the 1991–2014 period,maize yield increase averaged only 27 and 34 kg·ha−1·y−1 in the fivewest and east SSA countries, respectively (Fig. S1 and Table 1).Narrowing yield gaps from the present approximately 20% to 50%of water-limited maize yield potential in 2050 requires acceleratedyield increase rates of 72 (west SSA) and 64 (east SSA) kg·ha−1·y−1,and approximately double those rates to attain the 80% threshold.Such high rates are feasible in both developed and developingcountries where farmers have access to markets and to the seed,fertilizer, and pest management inputs required to support higheryields (5, 31). To date, however, such conditions have been elusivein the majority of countries in SSA (32, 33), although recent maizeyield increases in Mali, Ethiopia, Uganda, and Zambia holdpromise (Table 1 and Fig. S1).If yield gaps do not close, the projected 2050 production
deficit for cereal self-sufficiency will need to be compensated bycrop area expansion, greater cereal imports, or both. For ex-ample, if 1991–2014 yield growth rates continue, an additional97 Mha (+185%) of cereal production area would be needed toachieve cereal self-sufficiency (Fig. 3C). Under this scenario, andassuming the share of land requirements for each of the cerealsand other crops remains constant, 7 of the 10 countries do nothave enough suitable land area (34) to support this expansion(Fig. 3C). Achieving 50% of yield potential lifts only Mali andEthiopia to self-sufficiency, whereas an additional 44 Mha(+84%) cereals is needed for the other eight countries, with atleast four countries still facing a shortage of suitable land area(Fig. 3C). In these area expansion scenarios, we assume
A
C
E
B
D
F
Fig. 2. Yield gaps (yield potential minus actual yields, t/ha harvested area)in the 10 sub-Saharan African countries. Rainfed maize (A), rainfed millet (B),rainfed sorghum (C), rainfed wheat (D), rainfed rice (E), irrigated rice (F).Source: www.yieldgap.org.
Table 1. Cereal demand increase by 2050 and recent developments in cereal production and cropland area in SSA
Country
Population 2050(million)(and as %
of 2010 population)
Cereal demand2050 as % ofthat in 2010
Cereal area as %of total current
cropland
Actual maize yields(2003–2012)
usedin GYGA,
tharvested ha−1
Annual maizeyield increase(1991–2014),kg·ha−1·yr−1
Cropland area2010, Mha
Increase incropland area
(2004–2013), Mha
Burkina Faso 43 (275) 304 74 1.5 9 5.8 1.6*Ghana 50 (206) 372 34 1.7 16* 4.6 0.7*Mali 45 (325) 365 60 1.9 60* 6.4 1.4*Niger 72 (454) 508 70 0.8† 6 15.2 1.8*Nigeria 399 (250) 314 48 1.6 31* 33.0 −1.0Ethiopia 188 (216) 237 40 2.2 86* 14.6 2.8*Kenya 96 (233) 346 45 1.9 −4 5.5 0.5*Tanzania 137 (305) 381 44 1.2 −9 11.9 4.0*Uganda 102 (300) 396 25 1.6 51* 6.7 1.0*Zambia 43 (325) 519 35 2.3 55* 3.5 0.8*
Total 1,175 (261) 335 49 1.9 30* 107.0 13.6*
Medium fertility population projection in 10 sub-Saharan African countries by 2050, cereal demand 2050 versus 2010 [based on IMPACT (22) and UNmedium fertility population projection (14)], cereal area as a percentage of cropland (%), actual (2003–2012) and progress (1991–2014) in maize yields (theformer estimated in GYGA, the latter based on FAOSTAT; ref. 23), cropland area (2010 based on FAOSTAT; ref. 23) and trend in cropland area (2004–2013based on FAOSTAT; ref. 23).*Significant trend (P < 0.05).†Maize area in Niger was too small to include in GYGA; average yield is taken from FAOSTAT.
14966 | www.pnas.org/cgi/doi/10.1073/pnas.1610359113 van Ittersum et al.
Dow
nloa
ded
by g
uest
on
May
31,
202
0
productivity of new and existing land to be the same, which isoptimistic because the best quality farm land is likely alreadyunder cultivation and recent experience of crop land expansionin Ethiopia and Tanzania shows that a substantial portion of newcrop land comes from marginal land (28, 29).
Other Important Factors. Our analysis does not account for severalfactors that might be important for future agricultural productivity.First, the assumption of maximum attainable yields at a level of80% of water-limited yield potential in harsh rainfed regions withlarge year-to-year variation in rainfall is probably too optimistic. Atthe same time, our calculations are too pessimistic if genetic prog-ress in yield potentials is achieved. Historically, genetic progress inyield potential has contributed to progress in farm yields (31) al-though the magnitude of this contribution is sometimes difficult tomeasure (35). Progress in elevating yield potential of the majorcereals would imply, however, that even larger yield gaps need to beovercome than the already large gaps reported herein.Second, although we included current climate variability in our
analysis, we opted not to evaluate effects of long-term climate changebecause of large uncertainty in the degree of climate change impactsat local scales (in particular precipitation for east SSA) and becauseclimate change impacts by 2050 are projected to be relatively smallcompared with the large yield gaps in SSA (36, 37). For example,recent analyses project that climate change to 2050 is likely to have anegative effect on major cereal crops in SSA, varying between aslightly positive impact (up to 10%) in high elevation regions of eastSSA to negative impact up to approximately 20% elsewhere (36, 37).Although adaptation (in particular cultivar maturity and sowing dateadjustment) may partly offset negative effects, climate change is likelyto result in greater temporal variability of production (36, 38). Indeed,present climate variability in SSA, aggravated by climate change, will
make the challenge even greater and may be a valid reason to targetnational or regional self-sufficiency ratios greater than 1.Third, we assume no change in shares of areas of different crops
within countries, either due to changes in diet or changes in croppingsystems driven by profit motive. Trends of the past two decades, forexample, indicate a substantial increase in maize area at the expenseof sorghum and other staple food crops (23). If this trend continues,our estimates of cereal self-sufficiency would be somewhat pessi-mistic because maize is generally more productive than other cerealcrops (31). At the same time, greater production of high value cashcrops, such as cotton, cocoa, coffee, and oilseed crops may generateincome for cereal imports but will also compete for land with cereals,resulting in a more pessimistic cereal self-sufficiency outlook.Finally, apart from intensification through yield gap closure on
existing farm land, cropping intensity may increase (i.e., morecrop cycles per year on the same field) and the amount of irrigatedcrop area can increase where water resources allow it (Table S1).Based on best available data (SI Materials and Methods), we esti-mate the combined impact of these two factors across the threeyield-growth scenarios. Results give a more optimistic outlook toachieve self-sufficiency on existing cereal production area, withpotential for cereal exports under scenarios with accelerated yieldgrowth to 80% of yield potential (Fig. S3). We emphasize, however,there are large uncertainties associated with the coarse data avail-able for this additional analysis, and uncertainties associated withunderpinning economic and environmental assumptions regardingintensifying cropping systems and irrigation expansion. Note, forinstance, the large ranges in estimated potentials for increasing ir-rigated areas (39, 40).
Implications of This Assessment. Although recent positive trends incereal yields in Ethiopia (18), and several other SSA countries (refs.
0
0.2
0.4
0.6
0.8
1
1.2
Sel
f−su
ffici
ency
ratio
s (−
)
West Africa East Africa
A
Yield gaps closed to 80% of YwYield gaps closed to 50% of YwActual farmers yields 2010 extrapolated to 2050 (Ya extrapolated)Actual farmers yields 2010 (Ya)
00.20.40.60.8
11.21.41.61.8
Sel
f−su
ffici
ency
ratio
s (−
)
Burkina Faso Ghana Mali Niger Nigeria Ethiopia Kenya Tanzania Uganda Zambia
B
01020304050607080
Cer
eal a
rea
(Mha
)
Burkina Faso Ghana Mali Niger Nigeria Ethiopia Kenya Tanzania Uganda Zambia
C
Fig. 3. Self-sufficiency ratios by 2050 based on var-ious yield increase scenarios and required cereal areaexpansion to realize self-sufficiency by 2050. Yieldscenarios are as follows: 2010 actual farmers’ yields(Ya), actual yield increase 1991–2014 extrapolated to2050 (Ya extrapolated), yield gaps closed to 50% or80% of their water-limited potential (50% or 80% ofYw). (A) Regional self-sufficiency ratios by 2050 forthe five western and eastern countries in SSA andcurrent cereal areas. (B) Ratios for the 10 countries inSSA by 2050 and current cereal areas. (C) Cereal arearequired to achieve a self-sufficiency of 1 by 2050;black bars indicate current cereal area, and bluedashed lines indicate total potentially available ce-real area (including today’s cereal area) (34).
van Ittersum et al. PNAS | December 27, 2016 | vol. 113 | no. 52 | 14967
AGRICU
LTURA
LSC
IENCE
SSU
STAINABILITY
SCIENCE
Dow
nloa
ded
by g
uest
on
May
31,
202
0
41 and 42 and Fig. S1) hold promise, for some of these countries,yield improvements follow a period of stagnant to sluggish yieldincrease in the 1980s and 1990s (43). However, it is clear that withimproved cultivars, hybrids, and seed, coupled with increased use offertilizers, modern pest management practices, and good agronomy,it is possible to achieve accelerated rates of yield gain (27, 42). It isalso generally agreed that accelerated intensification will requiregreater investment in research and development (R & D) in bothpublic and private sectors (44–46). This investment is needed now,and even more so under future climate change (27–29).We emphasize that our study addresses only the biophysical op-
portunities and limitations to increase production, whereas manysocio-economic and institutional factors need to be attuned to allowfor production increases. R & D investments in agriculture must bematched by supportive policies and public finance for improvedtransport and communication, market infrastructure, credit, in-surance, and improved land entitlements (21, 45–47). Targetedmeasures to stabilize markets (which may imply some degree ofimport tariffs) for smallholder farming seem essential (3, 48). Be-cause smallholder farming is so prominent in SSA relative to com-mercial scale farming, creating off-farm employment opportunities isprobably equally important as targeting agricultural productivity andyield gap closure to allow for upscaling of farming (33). Finally, an-ticipating and avoiding negative environmental impacts of in-tensification will be important, and especially a period of excess useof nutrients and pesticides such as in Europe and China. Indeed, adirect transition from an agriculture that mines the soil to one basedon high resource use efficiency and conservation of natural resourcesis necessary (49, 50), requiring anticipatory R & D focused on thedual goals of increasing yields and protecting environmental quality.
ConclusionsThis study provides insight about the challenge in meeting theprojected tripled cereal demand by 2050 due to expected pop-ulation growth and modest changes in diets in 10 SSA countries,through scenarios of yield gap closure. Together these 10 countriesrepresent 54% of total population and 58% of the arable land areain SSA, making it unlikely that the situation is more optimistic forthe rest of the region. Results reveal that although yield gap closureon existing cropland and a large acceleration in yield growth ratesare essential to achieve cereal self-sufficiency, they are most likelynot sufficient. For instance, increasing maize yields from the ap-proximately 20% of yield potential in 2010 to 50% by 2050 implies adoubling of annual yield increases compared with the past decades.Even then, cereal areas must increase by more than 80% to realizeself-sufficiency in the 10 countries. Therefore, the path to self-suf-ficiency will likely require, in addition to yield gap closure, increasedcropping intensity and expansion of irrigated production area inregions that can support these options in a sustainable manner.Failure to achieve these intensification options will result in in-creasing dependence on cereal imports and vast expansion ofrainfed cropland area, especially because population in SSA isprojected to further increase between 2050 and 2100 by a factor 1.9and anticipated climate change will make the situation even morechallenging. In highlighting the need for intensification throughaccelerated yield growth, greater cropping intensity, and increasedirrigated area, we emphasize the importance of adequate R & Dinvestments by the public and private sectors, accompanied by fa-cilitating government policies to meet this challenge and to ensureintensification without negative environmental consequences.
Materials and MethodsWe first computed current (2010) national demand (assumed equal to the2010 consumption) and the 2010 production of the five main cereal crops (i.e.,maize, millet, rice, sorghum, and wheat) to estimate 2010 self-sufficiency ratiosin the 10 countries included in this study. Most of these countries have a largenumber of rural poor farmers living in high density rural areas, combined withlarge and growing market potential, making them a priority for private and
public sector investments in SSA. Current total cereal demands per countrywere calculated as the product of current population size (Table 1; from UNpopulation prospects, see ref. 14; see https://esa.un.org/unpd/wpp) and cerealdemand per capita based on IMPACT (22, 23) (Table S2). The annual per capitademand for the five cereals was next expressed in maize yield equivalents byusing the crop-specific grain caloric contents (with caloric contents based onFAO food balances, see faostat3.fao.org/home/E). Current (approximately year2010) domestic grain production per cereal crop per country was calculated asmean actual crop yield (2003–2012) as estimated in the Global Yield Gap Atlas(Table 1; www.yieldgap.org; refs. 24 and 25) times the 2010 harvested area percrop (FAOSTAT; ref. 23: (faostat3.fao.org/home/E) (Table S1). Note, weexpressed production and demand data at standard moisture content (15.5%for maize; 14% for rice, sorghum, and millet; 13.5% for wheat).
Total future (2050) annual cereal demand per capita, for each of the fivecereals and each country, was retrieved from IMPACTmodeling results (22). Forthis purpose, the Shared Socioeconomic Pathway (SSP2, no climate change; ref.51) from the Intergovernmental Panel on Climate Change (IPCC) fifth assess-ment was used. Total cereal demand per country in 2050 was calculated basedon projected 2050 population (medium fertility variant of UN populationprospects (14), see https://esa.un.org/unpd/wpp; see Table 1 for medium fer-tility population projection) multiplied by the per capita cereal demand in2050 from the SSP2 scenario.
Opportunities to increase cereal production by 2050 on current cereal landwere estimated through extrapolation of 1991–2014 increases in actual yields anddifferent levels (50% and 80%) of yield gap closure derived from the GlobalYield Gap Atlas (GYGA) (www.yieldgap.org; refs. 24 and 25). The yield gap iscalculated by the difference between current farm yield and yield potentialwhen the crop is grown by using competent management that avoids yield lossfrom insect pests, disease, weeds, and nutrient deficiencies (26, 30). With muchcoarser data, we also estimated the possibilities of increasing cropping intensity(i.e., the number of crops grown in the same piece of land within a 12-mo timeperiod), and expansion of irrigated area (SI Materials andMethods). These futurecereal production data were compared against projections for the 2050 demandfor cereals. We first calculated self-sufficiency ratios for year 2050 assuming theabove-mentioned yield gap closures and with no expansion of rainfed croplandand no change in areas for each of the cereals. If the food self-sufficiency ratio by2050 was <1, we calculated how much additional arable land area would beneeded to reach self-sufficiency. For example, a self-sufficiency ratio of 0.5 wouldrequire the cropland area to be doubled assuming that the new land broughtinto crop production has the same productivity as current land (which is anoptimistic assumption). Maximum land areas suitable for high-input rainfed ce-real production (Table S1) were taken from a recent study (34) that concludedthat the potential for profitable smallholder-based cropland expansion in manyAfrican countries is likely to be smaller than previous estimations (52, 53). Weassumed the share of cereal land in total cropland will remain the same as today(Table S1) and corrected potentially available cropland for cereals accordingly(shown in Fig. 3C by dashed lines).
Note, that although the IMPACTmodel simulates both the supply and demandside of agricultural commodities, it was used in this analysis only for the per capitademand side. IMPACT includes the livestock and feed demand and incorporatesinteractions between agricultural sectors, but notwith nonagricultural sectors.Weopted to assess future supply based on different degrees of yield gap closure asderived fromGYGA. Yield gap analysis, i.e., assessing the difference between yieldpotential and actual farm yield in a given location, is nowwidely used in literatureto assess opportunities for sustainable intensification (6, 9, 11, 26, 30, 54, 55). Theadvantage of using yield gap analysis is that ultimate opportunities and limita-tions of technological progress are revealed, whereas in economic models, tech-nological progress is simulated with economic feedbacks and at much lowertemporal and spatial resolution. Our analysis thus provides the biophysical limitsto become self-sufficient in cereals. GYGA uses a global protocol that relies onlocation-specific data on climate, soils, and cropping systems combined with arobust spatial framework to aggregate results to a national scale, and well-vali-dated crop growth models to estimate potential yields (24–26). The databaseincludes a unique collection of measuredweather data, a recently completedmapfor SSA on Root Zone Plant Available Water Holding Capacity (www.isric.org/content/afsis-gyga-functional-soil-information-sub-saharan-africa-rz-pawhc-ssa)and location-specific information on cropping systems from country agronomists.Crop models were calibrated and evaluated by using the best available experi-ments. Simulations therefore provide estimations of yield gaps with agronomicrigor and a finer level of spatial resolution than previous studies. Cereal pro-duction in SSA is largely rainfed; hence, we use the water-limited yield potentialas a benchmark for estimating yield gaps except for irrigated areas (mainly ricegrowing areas) where yield potential is unconstrained by water limitation (26).
Our analysis covers the 2010–2050 time period, and we note that year2050 is often used as the target in evaluations of future food supply-demand
14968 | www.pnas.org/cgi/doi/10.1073/pnas.1610359113 van Ittersum et al.
Dow
nloa
ded
by g
uest
on
May
31,
202
0
projections. This 40-y period is long enough to envision the possibility ofclosing the current, large yield gaps given what has occurred in 30–40 y inmany other parts of the world (e.g., Asia and Europe; ref. 31). It is a com-promise between a timeframe that is long enough for changes in policies,investments, and technologies to have substantial impact, yet not so longthat uncertainties overwhelm the analysis. As explained in Results and Dis-cussion, we opted not to include climate change in our assessment.
Details of estimating current and future cereal demand and production(including sensitivity analysis for future cereal demand) are provided in SIMaterials and Methods.
ACKNOWLEDGMENTS. We thank J. Chamberlin for providing potentiallyavailable cropland areas and K. E. Giller for comments on an earlier versionof the manuscript. This research was performed in the context of the GYGAproject (www.yieldgap.org) supported by the Bill & Melinda Gates Founda-tion, the Robert B. Daugherty Water for Food Institute at the University ofNebraska-Lincoln, and Wageningen University & Research (The Nether-lands). Research conducted with the International Food Policy Research In-stitute’s (IFPRI) IMPACT model was supported by the CGIAR ResearchProgram on Policies, Institutions, and Markets (PIM) and the Bill & MelindaGates Foundation. We also acknowledge the CGIAR Research Program onClimate Change, Agriculture, and Food Security (CCAFS).
1. Alexandratos N, Bruinsma J (2012) World Agriculture Towards 2030/2050: The 2012Revision (Food Agri Org United Nations, Rome).
2. Godfray HC, et al. (2010) Food security: The challenge of feeding 9 billion people.Science 327(5967):812–818.
3. Koning NBJ, et al. (2008) Long-term global availability of food: Continued abundanceor new scarcity? NJAS Wagening J Life Sci 55(3):229–292.
4. Lagi M, Bertrand KZ, Bar-Yam Y (2011) The food crises and political instability in NorthAfrica and the Middle East. SSRN:10.2139/ssm.1910031.
5. Grassini P, Eskridge KM, Cassman KG (2013) Distinguishing between yield advancesand yield plateaus in historical crop production trends. Nat Commun 4(2918):2918.
6. Mueller ND, et al. (2012) Closing yield gaps through nutrient and water management.Nature 490(7419):254–257.
7. Tilman D, Balzer C, Hill J, Befort BL (2011) Global food demand and the sustainableintensification of agriculture. Proc Natl Acad Sci USA 108(50):20260–20264.
8. Foley JA, et al. (2011) Solutions for a cultivated planet. Nature 478(7369):337–342.9. Erb K-H, et al. (2016) Exploring the biophysical option space for feeding the world
without deforestation. Nat Commun 7:11382.10. Mauser W, et al. (2015) Global biomass production potentials exceed expected future
demand without the need for cropland expansion. Nat Commun 6:8946.11. Pradhan P, Fischer G, van Velthuizen H, Reusser DE, Kropp JP (2015) Closing yield
gaps: How sustainable can we be? PLoS One 10(6):e0129487.12. Evans LT, Fischer RA (1999) Yield potential: Its definition, measurement, and signifi-
cance. Crop Sci 39(6):1544–1551.13. Van Ittersum MK, Rabbinge R (1997) Concepts in production ecology for analysis and
quantification of agricultural input-output combinations. Field Crops Res 52:197–208.14. United Nations - Department of Economic and Social Affairs (2015) World Population
Prospects, the 2015 Revision (United Nations, New York).15. Sulser TB, Mason-D’Croz D, Islam SRS, Wiebe K, Rosegrant MW (2015) Africa in the
global agricultural economy in 2030 and 2050. Beyond a Middle Income Africa:Transforming African Economies for Sustained Growth with Rising Employmentand Incomes. ReSAKSS Annual Trends and Outlook Report 2014, eds Badiane O,Makombe T (Int Food Policy Res Inst, Washington, DC).
16. Johnston BF, Mellor JW (1961) The role of agriculture in economic development. AmEcon Rev 51(4):566–593.
17. Chang H-J (2009) Rethinking Public Policy in Agriculture: Lessons from Distant andRecent History (Food Agric Organ United Nations, Rome).
18. African Development Bank (2015) Feeding Africa: An Action Plan for African Agri-cultural Transformation (African Development Bank, Abidjan, Cote d’Ivoire).
19. Brink AB, Eva HD (2009) Monitoring 25 years of land cover change dynamics in Africa:a sample based remote sensing approach. Appl Geogr 29:501–512.
20. Fuglie KO, Wang SL, Ball VE, eds (2012) Productivity Growth in Agriculture: AnInternational Perspective (CABI, Wallingford, UK).
21. OECD/FAO (2016) OECD-FAO Agricultural Outlook 2016-2025 (OECD Publishing, Paris).22. Robinson S, et al. (2015) The International Model for Policy Analysis of Agricultural
Commodities and Trade (IMPACT); Model Description for Version 3, IFPRI DiscussionPaper (Int Food Policy Res Inst, Washington, DC).
23. Food and Agriculture Organization of the United Nations (2015) Production/Cropsand Resource/Fertilizer (FAOSTAT Database Collections, Rome).
24. Grassini P, et al. (2015) How good is good enough? Data requirements for reliablecrop yield simulations and yield-gap analysis. Field Crops Res 177:49–63.
25. Van Bussel LGJ, et al. (2015) From field to atlas: Upscaling of location-specific yieldgap estimates. Field Crops Res 177:98–108.
26. Van Ittersum MK, et al. (2013) Yield gap analysis with local to global relevance—Areview. Field Crops Res 143:4–17.
27. Abate T, et al. (2015) Factors that transformed maize productivity in Ethiopia. FoodSecur 7(5):965–981.
28. CSA (2015) Report on Area and Production of Crops (Private Peasant Holdings, MeherSeason). Agricultural Sample Survey 2014/2015 (2007 E.C.). Statistical Bulletin 578(Central Stat Agency, Addis Ababa, Ethiopia), Vol I.
29. AGSTATS (2013) The 2012/13 Preliminary Food Crop Production Forecast for 2013/14Food Security. AGSTATS for Food Security (Ministry of Agric Food Secur Cooperatives,Dar es Salaam, Tanzania).
30. Lobell DB, Cassman KG, Field CB (2009) Crop yield gaps: Their importance, magni-tudes, and causes. Annu Rev Environ Resour 34:179–204.
31. Fischer T, Byerlee D, Edmeades G (2014) Crop Yields and Global Food Security: Will YieldIncrease Continue to Feed the World? (Aust Centre Int Agric Res, Canberra) pp XXI, 634.
32. Tittonell P, Giller KE (2013) When yield gaps are poverty traps: The paradigm of eco-logical intensification in African smallholder agriculture. Field Crops Res 143:76–90.
33. Frelat R, et al. (2016) Drivers of household food availability in sub-Saharan Africabased on big data from small farms. Proc Natl Acad Sci USA 113(2):458–463.
34. Chamberlin J, Jayne TS, Headey D (2014) Scarcity amidst abundance? Reassessing thepotential for cropland expansion in Africa. Food Policy 48:51–65.
35. Cassman KG, Dobermann A, Walters DT, Yang H (2003) Meeting cereal demand whileprotecting natural resources and improving environmental quality. Annu Rev EnvironResour 28:315–358.
36. Niang I, et al. (2014) Africa. Climate Change 2014: Impacts, Adaptation, andVulnerability. Part B: Regional Aspects. Contribution of Working Group II to theFifth Assessment Report of the Intergovernmental Panel on Climate Change, edsBarros VR, et al. (Cambridge Univ Press, Cambridge, UK), pp 1199–1265.
37. Porter JR, et al. (2014) Food Security and Food Production Systems. Climate Change 2014:Impacts, Adaptation, and Vulnerability. Part A: Global and Sectoral Aspects. Contributionof Working Group II to the Fifth Assessment Report of the Intergovernmental Panel onClimate Change, eds Field CB, et al. (Cambridge Univ Press, Cambridge, UK), pp 485–533.
38. Lesk C, Rowhani P, Ramankutty N (2016) Influence of extreme weather disasters onglobal crop production. Nature 529(7584):84–87.
39. You L, et al. (2011) What is the irrigation potential for Africa? A combined biophysicaland socioeconomic approach. Food Policy 36(6):770–782.
40. Food and Agriculture Organization of the United Nations (2015) AQUASTAT. Availableat www.fao.org/nr/water/aquastat/data. Accessed November 22, 2016.
41. The Economist (March 12, 2016) Briefing African Agriculture – A Green Evolution. TheEconomist, 19–22.
42. Sanchez PA (2015) En route to plentiful food production in Africa. Nat Plants 1:14014.43. Nin-Pratt A, Johnson M, Yu B (2012) Improved Performance of Agriculture in Africa
South of the Sahara: Taking Off or Bouncing Back. IFPRI Discussion Paper No. 01224.(Int Food Policy Res Inst, Washington, DC), p 32.
44. Pardey PG, Alston JM, Chan-Kang C (2013) Public agricultural R&D over the past halfcentury: An emerging new world order. Agric Econ 44(s1):103–113.
45. World Bank (2009) Awakening Africa’s Sleeping Giant Prospects for CommercialAgriculture in the Guinea Savannah Zone and Beyond (World Bank, Washington, DC), p 4.
46. World Bank (2013) Growing Africa: Unlocking the Potential of Agribusiness (WorldBank, Washington, DC), p 162.
47. Smale M, Byerlee D, Jayne T (2013) Maize revolutions in Sub-Saharan Africa. AnAfrican Green Revolution: Finding Ways to Boost Productivity on Small Farms, edsOtsuka K, Larson DF (Springer, Dordrecht), pp 168–196.
48. Koning N, van Ittersum MK (2009) Will the world have enough to eat? Curr OpinEnviron Sustain 1(1):77–82.
49. Cassman KG (1999) Ecological intensification of cereal production systems: Yield po-tential, soil quality, and precision agriculture. Proc Natl Acad Sci USA 96(11):5952–5959.
50. Zhang X, et al. (2015) Managing nitrogen for sustainable development. Nature528(7580):51–59.
51. O’Neill B, et al. (2014) A new scenario framework for climate change research: theconcept of shared socioeconomic pathways. Clim Change 122(3):387–400.
52. Fischer G, van Velthuizen H, Shah M, Nachtergaele F (2002) Global Agro-ecologicalAssessment for Agriculture in the 21st Century: Methodology and Results (IIASA,Laxenburg, Austria, and Food Agric Org United Nations, Rome).
53. IIASA/FAO (2012) Global Agro‐ecological Zones (GAEZ v3.0) (IIASA, Laxenburg, Aus-tria, and Food Agric Org United Nations, Rome).
54. Sumberg J (2012) Mind the (yield) gap(s). Food Secur 4(4):509–518.55. Van Oort PAJ, et al. Can yield gap anlaysis be used to inform R&D prioritisation? Glob
Food Secur, in press.56. Wiebe K, et al. (2015) Climate change impacts on agriculture in 2050 under a range of
plausible socioeconomic and emissions scenarios. Environ Res Lett 10(8):085010.57. Deininger K, Byerlee D (2011) Rising Global Interest in Farmland: Can it Yield
Sustainable and Equitable Benefits? (World Bank Publications, Washington, DC).58. You L, et al. (2014) Generating global crop distribution maps: From census to grid.
Agric Syst 127:53–60.59. Yang H, Dobermann A, Cassman KG, Walters DT (2006) Features, applications, and
limitations of the hybrid-maize simulation model. Agron J 98(3):737–748.60. Bouman BAM, et al. (2001) ORYZA2000: Modeling Lowland Rice (IRRI, Los Baños, The
Philippines), p 235.61. van Oort PAJ, de Vries ME, Yoshida H, Saito K (2015) Improved climate risk simula-
tions for rice in arid environments. PLoS One 10(3):e0118114.62. Supit I, et al. (2012) Assessing climate change effects on European crop yields using the
Crop Growth Monitoring System and a weather generator. Agric Meteorol 164:96–111.63. Wolf J, et al. (2011) Modeling winter wheat production over Europe with WOFOST –
the effect of two new zonations and two newly calibrated model parameter sets.Methods of Introducing System Models into Agricultural Research. Advances in Agri-cultural Systems Modeling 2: Trans-disciplinary Research, Synthesis, and Appli-cations, eds Ahuja LR, Ma L (ASA-CSSA-SSSA, Madison, WI), pp 297–326.
64. Van Wart J, et al. (2013) Use of agro-climatic zones to upscale simulated crop yieldpotential. Field Crops Res 143:44–55.
van Ittersum et al. PNAS | December 27, 2016 | vol. 113 | no. 52 | 14969
AGRICU
LTURA
LSC
IENCE
SSU
STAINABILITY
SCIENCE
Dow
nloa
ded
by g
uest
on
May
31,
202
0