CALIDAD DE LUZ LED Y DESARROLLO in vitro DE Oncidium ... · CALIDAD DE LUZ LED Y DESARROLLO in...
16
1065 RESUMEN La calidad, intensidad y duración de la luz afectan el desarro- llo vegetal porque promueven diferentes respuestas fisiológi- cas. El objetivo de esta investigación fue evaluar la influen- cia de distintos espectros de iluminación sobre el desarro- llo in vitro de Oncidium tigrinum La Llave y Lex. y Laelia autumnalis (Lex.) Lindl. Plántulas de tres meses de edad se cultivaron en medio Murashige y Skoog sin fitohormonas más tiamina (0.4 mg L 1 ), inositol (100 mg L 1 ), sacarosa (30 g L 1 ), agar (6 g L 1 ) con pH de 5.7. El diseño experi- mental fue completamente al azar y la unidad experimental consistió de 30 plántulas. Los tratamientos fueron LEDs rojo y azul en proporción 3:1, 2:2 y 1:3, LEDs blancos y luz blanca fluorescente (testigo), con seis repeticiones por tratamiento. Las longitudes de onda fueron: rojo de 590 a 670 nm, azul de 430 a 480 nm y blanca de 400 a 700 nm; el flujo de fotones fotosintéticos se ajustó a 312 mol m 2 s 1 . Las variables evaluadas fueron longitud de plántula y raíces, número de hojas y raíces, materia fresca y seca, y contenido de clorofila a, b y total. Con los datos se realizó un ANDEVA y las medias se compararon con la prueba de Tukey (p0.05). Los resul- tados mostraron que la iluminación con LEDs blancos fue similar a la iluminación con luz fluorescente en el desarrollo in vitro de plántulas de L. autumnalis con valores del doble o más de clorofila a, b y total, y hasta 2 % más acumulación de biomasa, en comparación con los demás tratamientos. En O. tigrinum la luz LED blanca indujo el desarrollo de plan- tas vigorosas color verde intenso, sin daño por fotoxidación. Esto confirma que los LEDs son una alternativa eficaz para el ABSTRACT Quality, intensity and duration of light affect plant development because they promote different physiological responses. The aim of this study was to evaluate the influence of different lighting spectra on in vitro development of Oncidium tigrinum La Llave and Lex. and Laelia autumnalis (Lex.) Lindl. Three-month-old seedlings were grown in a Murashige and Skoog medium without plant hormones plus thiamine (0.4 mg L 1 ), inositol (100 mg L 1 ), saccharose (30 g L 1 ), and agar (6 g L 1 ) with pH of 5.7. The experimental design was completely randomized and the experimental unit consisted of 30 seedlings. Treatments were red and blue LEDs in a 3:1, 2:2, and 1:3 ratios, white LEDs and fluorescent white light (control), with six repetitions per treatment. Wave lengths were: 590-670 nm for red, 430-480 nm for blue, and 400-700 nm for white; photosynthetically active radiation was adjusted to 312 mol m 2 s 1 . The dependent variables were seedling and root length, number of leaves and roots, fresh and dry matter, and a, b and total chlorophyll content. An ANOVA was performed with this data and means were compared with a Tukey test (p0.05). Results showed that white LED lighting was similar to fluorescent lighting in terms of in vitro seedlings development of L. autumnalis. Seedlings showed twice as much a, b, and total chlorophyll and up to 2 % more biomass accumulation compared with the other treatments. For O. tigrinum, white LED light induced the development of vigorous bright green plants with no photooxidation damage. LEDs lights were confirmed as an effective alternative for in vitro seedling growth and development of O. tigrinum and L. autumnalis. Key words: Laelia autumnalis, Oncidium tigrinum, in vitro development, in vitro directed radiation, LEDs. CALIDAD DE LUZ LED Y DESARROLLO in vitro DE Oncidium tigrinum Y Laelia autumnalis (ORCHIDACEAE) LED LIGHT QUALITY AND in vitro DEVELOPMENT OF Oncidium tigrinum AND Laelia autumnalis (ORCHIDACEAE) Martha M. Murillo-Talavera 1 , Martha E. Pedraza-Santos 1* , Nicolás Gutiérrez-Rangel 2 , María de las N. Rodríguez-Mendoza 3 , Philippe Lobit 1 , Alejandro Martínez-Palacios 1 1 Universidad Michoacana de San Nicolás de Hidalgo. Avenida Francisco J. Múgica S/N Ciudad Universitaria. 58030. Morelia, Michoacán, México. ([email protected]). 2 Campus Puebla, Colegio de Postgraduados. Km. 125.5 carretera federal México-Puebla. 72760. Puebla, Puebla, México. ([email protected]). 3 Campus Montecillo, Colegio de Postgraduados. Km.36.5 carretera México-Texcoco. 56230. Montecillo, Texcoco, Estado de México. ([email protected]) *Autor responsable v Author for correspondence. Recibido: agosto, 2015. Aprobado: junio, 2016. Publicado como ARTÍCULO en Agrociencia 50: 1065-1080. 2016.
Transcript of CALIDAD DE LUZ LED Y DESARROLLO in vitro DE Oncidium ... · CALIDAD DE LUZ LED Y DESARROLLO in...

1065
Resumen
La calidad, intensidad y duración de la luz afectan el desarro-llo vegetal porque promueven diferentes respuestas fisiológi-cas. El objetivo de esta investigación fue evaluar la influen-cia de distintos espectros de iluminación sobre el desarro-llo in vitro de Oncidium tigrinum La Llave y Lex. y Laelia autumnalis (Lex.) Lindl. Plántulas de tres meses de edad se cultivaron en medio Murashige y Skoog sin fitohormonas más tiamina (0.4 mg L1), inositol (100 mg L1), sacarosa (30 g L1), agar (6 g L1) con pH de 5.7. El diseño experi-mental fue completamente al azar y la unidad experimental consistió de 30 plántulas. Los tratamientos fueron LEDs rojo y azul en proporción 3:1, 2:2 y 1:3, LEDs blancos y luz blanca fluorescente (testigo), con seis repeticiones por tratamiento. Las longitudes de onda fueron: rojo de 590 a 670 nm, azul de 430 a 480 nm y blanca de 400 a 700 nm; el flujo de fotones fotosintéticos se ajustó a 312 mol m2 s1. Las variables evaluadas fueron longitud de plántula y raíces, número de hojas y raíces, materia fresca y seca, y contenido de clorofila a, b y total. Con los datos se realizó un ANDEVA y las medias se compararon con la prueba de Tukey (p0.05). Los resul-tados mostraron que la iluminación con LEDs blancos fue similar a la iluminación con luz fluorescente en el desarrollo in vitro de plántulas de L. autumnalis con valores del doble o más de clorofila a, b y total, y hasta 2 % más acumulación de biomasa, en comparación con los demás tratamientos. En O. tigrinum la luz LED blanca indujo el desarrollo de plan-tas vigorosas color verde intenso, sin daño por fotoxidación. Esto confirma que los LEDs son una alternativa eficaz para el
AbstRAct
Quality, intensity and duration of light affect plant development because they promote different physiological responses. The aim of this study was to evaluate the influence of different lighting spectra on in vitro development of Oncidium tigrinum La Llave and Lex. and Laelia autumnalis (Lex.) Lindl. Three-month-old seedlings were grown in a Murashige and Skoog medium without plant hormones plus thiamine (0.4 mg L1), inositol (100 mg L1), saccharose (30 g L1), and agar (6 g L1) with pH of 5.7. The experimental design was completely randomized and the experimental unit consisted of 30 seedlings. Treatments were red and blue LEDs in a 3:1, 2:2, and 1:3 ratios, white LEDs and fluorescent white light (control), with six repetitions per treatment. Wave lengths were: 590-670 nm for red, 430-480 nmfor blue, and 400-700 nm for white; photosynthetically active radiation was adjusted to 312 mol m2 s1. The dependent variables were seedling and root length, number of leaves and roots, fresh and dry matter, and a, b and total chlorophyll content. An ANOVA was performed with this data and means were compared with a Tukey test (p0.05). Results showed that white LED lighting was similar to fluorescent lighting in terms of in vitro seedlings development of L. autumnalis. Seedlings showed twice as much a, b, and total chlorophyll and up to 2 % more biomass accumulation compared with the other treatments. For O. tigrinum, white LED light induced the development of vigorous bright green plants with no photooxidation damage. LEDs lights were confirmed as an effective alternative for in vitro seedling growth and development of O. tigrinum and L. autumnalis.
Key words: Laelia autumnalis, Oncidium tigrinum, in vitro development, in vitro directed radiation, LEDs.
CALIDAD DE LUZ LED Y DESARROLLO in vitro DE Oncidium tigrinum Y Laelia autumnalis (ORCHIDACEAE)
LED LIGHT QUALITY AND in vitro DEVELOPMENT OF Oncidium tigrinum AND Laelia autumnalis (ORCHIDACEAE)
Martha M. Murillo-Talavera1, Martha E. Pedraza-Santos1*, Nicolás Gutiérrez-Rangel2, María de las N. Rodríguez-Mendoza3, Philippe Lobit1, Alejandro Martínez-Palacios1
1Universidad Michoacana de San Nicolás de Hidalgo. Avenida Francisco J. Múgica S/N Ciudad Universitaria. 58030. Morelia, Michoacán, México. ([email protected]). 2Campus Puebla, Colegio de Postgraduados. Km. 125.5 carretera federal México-Puebla. 72760. Puebla, Puebla, México. ([email protected]). 3Campus Montecillo, Colegio de Postgraduados. Km.36.5 carretera México-Texcoco. 56230. Montecillo, Texcoco, Estado de México. ([email protected])
*Autor responsable v Author for correspondence.Recibido: agosto, 2015. Aprobado: junio, 2016.Publicado como ARTÍCULO en Agrociencia 50: 1065-1080. 2016.

1066
AGROCIENCIA, 16 de noviembre - 31 de diciembre, 2016
VOLUMEN 50, NÚMERO 8
crecimiento y desarrollo in vitro de plántulas de O. tigrinum y L. autumnalis.
Palabras clave: Laelia autumnalis, Oncidium tigrinum, desarrollo in vitro, irradiación dirigida in vitro, LEDs.
IntRoduccIón
En México se reconocen más de 1200 espe-cies y subespecies de orquídeas y se ubican al sur del Trópico de Cáncer, desde las cos-
tas del Pacífico a las del Golfo, en regiones de hasta 3500 msnm (Espejo y López-Ferrari, 1998). Oncidium y Laelia son dos géneros de orquídeas distribuidas en México y tienen valor comercial alto. La belleza de sus flores las hace muy atractivas, por lo cual en las poblaciones silvestres se extraen ejemplares de mane-ra ilegal para satisfacer la creciente demanda de los mercados. Lo anterior, aunado a la deforestación de su hábitat y a cambios en el uso de suelo, son las cau-sas principales de la disminución de sus poblaciones silvestres (Szeszko, 2011). La reproducción in vitro o micropropagación vegetal es una técnica viable para la multiplicación masiva de plantas, y se usa para la propagación y preservación de orquídeas nativas im-portantes, como Laelia y Oncidium (Lee et al., 2007; Mengxi et al., 2011). En un laboratorio de micropropagación comer-cial, el control de las condiciones físico-químicas, nutricionales y de ambiente (temperatura, hume-dad y luz) son factores críticos (Loberant y Altman, 2010), ya que determinan el crecimiento y el de-sarrollo de los tejidos vegetales. Para la fijación de carbono, las plantas usan la radiación fotosintéti-camente activa (PAR) que corresponde a las zonas azul (400 a 500 nm) y roja (superior a 600 nm) del espectro visible, que abarca de 400 a 700 nm. El resto del espectro se refleja y es responsable del color verde de las hojas. Por esto, al mejorar la calidad e intensidad de la luz se acelera la fotosíntesis de las plantas, sobre todo cuando se iluminan al irradiarlas con las longitudes roja y azul del espectro (Casierra-Posada et al., 2011). La fuente de luz tradicional usada en cultivo in vitro es de lámparas tubulares fluorescentes (LTFs) (Lin et al., 2011) que emiten un espectro amplio, por lo cual los efectos fisiológicos en los vegetales son poco específicos (Da Rocha et al., 2010). Su uso en un laboratorio de cultivo de tejidos representa 65 %
IntRoductIon
There are more than 1200 known orchid species and subspecies in Mexico, located south of the Tropic of Cancer, from the Pacific Ocean
to the Gulf of Mexico’s coasts, in areas up to 3500 amsl (Espejo and López Ferrari, 1998). Oncidium and Laelia are two orchid genera which are distributed across Mexico and have high commercial value. The beauty of their flowers makes them very attractive, which is why specimens are illegally extracted from wild populations to satisfy growing market demands. Together with the deforestation of their habitat and land use changes, this demand is one of the three main causes of its population decline in the wild (Szeszko, 2011). In vitro reproduction or plant micropropagation is a feasible technique for massive plant multiplication and is used for the propagation and conservation of important native orchids, such as Laelia and Oncidium (Lee et al., 2007; Mengxi et al., 2011). In a commercial micropropagation laboratory, controlling physical-chemical, nutritional, and environmental conditions (temperature, moisture, and light) is crucial (Loberant and Altman, 2010), because these factors determine vegetal tissue growth and development. Plants use photosynthetically active radiation (PAR) for carbon fixation, which match the blue (400-500 nm) and red (over 600 nm) areas of the visible spectrum (400-700 nm). The rest of the spectrum is reflected and it is responsible for the green color of leaves. Therefore, improving light quality and intensity accelerates plant photosynthesis, especially when they are lighted with the red and blue radiation wavelengths of the spectrum (Casierra-Posada et al., 2011). Light sources usually used for in vitro plant tissue culture are fluorescent tube lamps (FTLs) (Lin et al., 2011) that emit a wide spectrum, which produces unspecific physiological effects in plants (Da Rocha et al., 2010). Its use in plant tissue culture laboratories represents 65 % of the total electricity costs (Jao and Fang, 2004) and it provides wavelengths which are unnecessary for plants. For this reason, alternative energy sources and more efficient ways to illuminate crops must be sought (Loberant and Altman, 2010). Light-emitting diodes (LEDs) have high potential to be used as a light source in micropropagation (Loberant and Altman, 2010). They provide a more efficient energy conversion, small volume,

CALIDAD DE LUZ LED Y DESARROLLO in vitro DE Oncidium tigrinum Y Laelia autumnalis (ORCHIDACEAE)
1067MURILLO-TALAVERA et al.
del costo total de electricidad (Jao y Fang, 2004) y provee las longitudes de onda innecesarias para las plantas. Por lo tanto, se debe buscar fuentes alterna-tivas de energía y formas más eficientes de iluminar los cultivos (Loberant y Altman, 2010). Los diodos emisores de luz (LEDs) tienen un potencial alto para usarse como fuente de luz en la micropropagación (Loberant y Altman, 2010). Sus ventajas son la conversión eficiente de energía, su volumen pequeño, una vida más larga, la emisión de radiación de longitudes de onda específicas, que permiten eficientizar la fotosíntesis (Araujo et al., 2009) y ajustar la intensidad/calidad de luz; ade-más, sus emisiones térmicas y sus costos de mante-nimiento son bajos y protegen el ambiente al dis-minuir las emisiones de CO2 (Lee et al., 2010). En la micropropagación, la luz LED roja y azul, solas o combinadas, tienen una influencia significativa sobre el desarrollo de las plantas (Dutta y Jatothu, 2013). La luz LED roja se asocia con el crecimiento de las plantas (alargamiento de entrenudos), como se observó en Oncidium (Mengxi et al., 2011) y con la baja concentración de pigmentos fotosintéticos probada en Dendrobium officinale (Lin et al., 2011). Pero hay poca información acerca del efecto de la luz azul sobre la fisiología de plantas superiores; con frecuencia se le relaciona con el crecimiento vigoroso, la diferenciación y los contenidos altos de clorofila y carotenoides en plantas in vitro (Lin et al., 2011; Mengxi et al., 2011). La luz LED roja aumenta la biomasa húmeda y seca de raíces de plántulas de Paphiopedilum en com-paración con la luz blanca fluorescente y la azul (Lee et al., 2011), y aumenta el peso fresco y seco de brotes en Dendrobium officinale (Lin et al., 2011). Mientras que la combinación con luz azul aumentó la acumu-lación de biomasa en PLBS de Oncidium (Mengxi et al., 2011). Esto indica que la respuesta de las plantas a la calidad de luz LED cambia entre especies y su etapa de desarrollo, y se necesita estudiar su efecto en cada especie para lograr determinados propósitos: promover o inhibir brotes, raíces, bulbos y controlar floración (Kim et al., 2004; Poudel et al., 2008). Con base en estas investigaciones, se plantea que es posible sustituir la luz fluorescente por luz LED durante la micropropagación de O. tigrinum y L. autumnalis; además, las respuestas morfogénicas de las plantas a la calidad de la luz, se pueden usar para el control del desarrollo de los tejidos in vitro. Por tal motivo, el
longer life, specific wavelength radiation that make photosynthesis more efficient (Araujo et al., 2009), and other advantages such as the possibility to adjust light intensity/quality; furthermore, their thermic radiation and maintenance costs are low and they protect the environment with reduced CO2 emissions (Lee et al., 2010). In micropropagation, red and blue LED light, separated or combined, have a significant influence on plant growth (Dutta and Jatothu, 2013). Red LED light is associated with plant growth (internode lengthening), as was observed in Oncidium (Mengxi et al., 2011), and in low concentrations of photosynthetic pigments proved for Dendrobium officinale (Lin et al., 2011). However, there is little information about the effect of blue light over seed plants physiology; it is usually associated with vigorous growth, differentiation, and high chlorophyll and carotenoid contents on in vitro plants (Lin et al., 2011; Mengxi et al., 2011). Red LED light increases wet and dry mass of the roots of Paphiopedilum seedling, compared to fluorescent white light and blue light (Lee et al., 2011), and increases wet and dry weight of the sprouts of Dendrobium officinale (Lin et al., 2011). Meanwhile, combined with blue light, biomass accumulation of Oncidium PLBs was increased (Mengxi et al., 2011). This indicates that plant response to LED light quality varies among species and their developmental stage. Its effect on each species needs to be studied separately in order to achieve certain goals: to promote or inhibit sprouts, roots and bulbs, and to control flowering (Kim et al., 2004; Poudel et al., 2008). On the basis of such researches, it might be possible to substitute fluorescent light with LED light during the micropropagation of O. tigrinum and L. autumnalis; also, the plants’ morphogenic responses to light quality can be used to control the development of in vitro tissues. For this reason, the aim of this study was to determine favorable light quality, out of different combinations of LED light, required for optimum in vitro development of O. tigrinum and L. autumnalis orchid seedlings.
mAteRIAls And methods
Plant material
For this study, in vitro cultured seedlings -approximately 1.0 cm tall and three month old- were used. Seedlings were

1068
AGROCIENCIA, 16 de noviembre - 31 de diciembre, 2016
VOLUMEN 50, NÚMERO 8
objetivo del presente estudio fue determinar la cali-dad de luz favorable, a partir de diferentes combina-ciones de luz LED, requerida para el desarrollo ópti-mo in vitro de plántulas de las orquídeas O. tigrinum y L. autumnalis.
mAteRIAles y métodos
Material vegetal
En este estudio se usaron plántulas cultivadas in vitro, con una altura aproximada de 1.0 cm y tres meses de edad, obteni-das de la germinación de semillas de plantas de O. tigrinum y L. autumnalis pertenecientes al Sistema Nacional de Recursos Fitogenéticos (SINAREFI), bajo resguardo de la Facultad de Agrobiología Presidente Juárez, de la Universidad Michoacana de San Nicolás de Hidalgo, en Uruapan, Michoacán.
Medio de cultivo
Para el cultivo de las plántulas se usó el medio Murashige y Skoog (MS) sin fitohormonas más tiamina (0.4 mg L1), inositol (100 mg L1), sacarosa (30 g L1) y agar (6 g L1) ajustado a pH 5.7. Este medio se esterilizó en autoclave 15 min a 121 °C.
Establecimiento y diseño experimental
En este estudio se usaron frascos de vidrio de 100 mL de capacidad con 20 mL de medio MS, y en cada uno se colocaron 30 plántulas. El procedimiento se realizó en una campana de flujo laminar. Los frascos etiquetados se incubaron en cajas de triplay de 0.10125 m3 pintadas en su interior de color blanco. En la parte superior de cada caja se colocó una base de aluminio con cuatro focos LED de alta eficiencia de 1 W marca SiLed de colores rojo, azul o blanco, acoplados en serie a una fuente de alimentación externa de 12 V para conectarse a la corriente alterna de 110 V. El diseño experimental fue completamente al azar y los tra-tamientos fueron: LEDs rojo y azul en proporción 3:1, 2:2 y 1:3, y LEDs blancos (Cuadro 1). Las plántulas del tratamiento testigo se incubaron con una lámpara blanca fluorescente marca Phillips de 39 W, cada tratamiento se repitió seis veces, y la unidad experimental fue un frasco con 30 plántulas. Las longitudes de onda emitidas por las fuentes se midieron con un espectro radiómetro de campo (Field Spec Pro) Marca ASD (Analitical Spectral Devices). Los LEDs azules y rojos emitieron espectros caracterizados por un único pico de emi-sión, centrado a 458 y 636 nm, respectivamente, de aspecto
obtained from the germination of seeds of O. tigrinum and L. autumnalis plants that belong to Mexico’s National Phyto Genetic Resources System (SINAREFI), held by President Juárez Agrobiology School of the Universidad Michoacana de San Nicolás de Hidalgo, in Uruapan, Michoacán.
Culture medium
A Murashige and Skoog (MS) medium with no plant hormones, plus thiamine (0.4 mg L1), inositol (100 mg L1), saccharose (30 g L1), agar (6 g L1), and with pH adjusted at 5.7 was used to grow seedlings. This medium was sterilized in an autoclave, during 15 minutes, at 121 °C.
Establishment and experimental design
For this study, 100 mL glass jars with 20 ml of MS medium were used and 30 seedlings were placed on each one. The procedure was performed in a laminar flow hood. The labeled jars were incubated in 0.10125 m3 plywood boxes painted in white on the inside. On the top of each box an aluminum base with four SiLed high-efficiency 1 W LED lights was placed. LEDs were red, blue or white, coupled in series to an external 12 V source that was connected to the 110 V AC. Experimental design was completely random and treatments were: red and blue LEDs in a 3:1, 2:2, and 1:3 ratios, and white LEDs (Table 1). Seedlings in the control group were incubated with a Phillips white fluorescent 39 W lamp. Each treatment was repeated six times and the experimental unit was a jar with 30 seedlings. Wavelengths emitted by the light sources were measured with an ASD (Analytical Spectral Devices) field spectrum radiometer (Field Spec Pro). Blue and red LEDs emitted spectrums featuring a single emission peak centered at 458 and 636 nm respectively, of Gaussian appearance and with a
Cuadro 1. Tratamientos para evaluar el efecto de la calidad de la luz LED en el desarrollo in vitro de plántulas de Oncidium tigrinum y Laelia autumnalis.
Table 1. Treatments to evaluate the effect of LED light quality on the in vitro development of Oncidium tigrinum and Laelia autumnalis seedlings.
Tratamiento Descripción
1 LEDs rojo y azul (3:1)2 LEDs rojo y azul (2:2)3 LEDs rojo y azul (1:3)4 LEDs blancos
5 (testigo) Luz blanca fluorescente

CALIDAD DE LUZ LED Y DESARROLLO in vitro DE Oncidium tigrinum Y Laelia autumnalis (ORCHIDACEAE)
1069MURILLO-TALAVERA et al.
standard deviation of 13 nm. On the one hand, white LEDs had a 444 nm emission peak of (also with a 13 nm standard deviation) and a wide area of emission centered around 553 nm (but with a 50 nm dispersion). On the other hand, fluorescent lamps had a series of close peaks at 436, 490, 545, 586, and 612 nm (Figure 1). Light intensity was determined with the radiation sensor of a portable photosynthesis system (IRGA-6400, LI-COR); the resulting intensity was 312 mol m2 s1 in all treatments, with a photoperiod of 16 h of light and 8 h of dark and an average temperature of 25 °C.
Measured variables
Seedling and root length (cm) was measured from the base and the apex of the plantlet or the root, respectively, using graph paper, on 10 seedlings for each treatment and repetition. The number of leaves and roots was also registered in 10 seedlings per treatment and repetition. Seedlings’ fresh weight (mg), 10 seedlings of each treatment were selected and weighted in an OHAUS analytical electronic balance with a 0.01 mg readability. Seedlings’ dry matter (%). This variable was measured in a 100 mg sample of seedling’s fresh matter, one for each treatment and repetition, using the gravimetric method. Drying was performed in a FELISA oven, at 70 °C during 72 h. Dry samples were weighted in an OHAUS analytical electronic balance and results are shown as percentage of dry matter with respect to its fresh weight. Seedlings’ pigment content (mg g1). a, b, and total chlorophyll concentration was determined in 100 mg samples of each treatment and repetition, extracting the leaves and measuring them through spectrophotometry (Porra et al., 1989). Leaves were placed in glass jars with 3 mL of N-dimethylformamide covered with aluminum foil. The jars were stored at 4 °C during 48 h. Afterwards, a 1 mL sample was placed in a cell to test-measure absorbance in a JENWAY 6320D spectrophotometer;
gaussiano y con una dispersión (desviación estándar) de 13 nm. Los LEDs blancos presentaron un pico de emisión a 444 nm (también con una dispersión de 13 nm) y una amplia zona de emisión centrada alrededor de 553 nm (pero con una dispersión de 50 nm). En cambio, las lámparas fluorescentes presentaron una serie de picos estrechos a 436, 490, 545, 586 y 612 nm (Figura 1). La intensidad lumínica se determinó con el sensor de radiación de una pinza a fotosíntesis (IRGA-6400, LI-COR), fue de 312 mol m2 s1 en todos los tratamientos, con foto-periodo de 16 h luz y 8 de oscuridad y temperatura promedio de 25 °C.
Variables evaluadas
Longitud de plántula y de raíz (cm) se midió desde la base y el ápice de la plántula o la raíz, en su caso, con papel milimé-trico, en 10 plántulas de cada tratamiento y repetición. Número de hojas y raíces, también se registraron en 10 plán-tulas por tratamiento y repetición. Peso fresco de plántulas (mg), se seleccionaron 10 plántulas de cada tratamiento y se pesaron en una balanza analítica digital marca OHAUS con legibilidad de 0.01 mg. Materia seca de plántulas (%). Esta variable se determinó en una muestra de 100 mg de tejido fresco de las plántulas de cada tratamiento y repetición, mediante el método gravimétrico. El secado se realizó en una estufa marca FELISA, a 70 °C durante 72 h. Las muestras secas se pesaron en una balanza analítica digi-tal marca OHAUS y los resultados se expresaron como porcen-tajes de materia seca en proporción a su peso fresco. Contenido de pigmentos en las plántulas (mg g1). La con-centración de clorofila a, b y total se determinó en muestras de 100 mg de cada tratamiento y repetición, mediante su ex-tracción de las hojas y su medición espectrofotométrica (Porra et al., 1989). Las hojas se colocaron en frascos de vidrio con 3 mL de N-Dimetilformamida cubiertos con papel alumi-nio, los cuales se almacenaron 48 h a 4 °C. Después se colocó
Figura 1. Características de las longitudes de onda emitidas por focos LED (azul, rojo y blanco) y lámpara fluo-rescente, medidas con un espectro radiómetro de campo (Field Spec Pro) Marca ASD (Analitical Spectral Devices). La emisión normalizada equi-vale al porcentaje de la energía visible total que se encuentra en cada banda de 1 nm.
Figure 1. Characteristics of the wavelengths emitted by LED lights (blue, red, and white) and fluorescent lamp, measured with an ASD (Analytical Spectral Devices) field spectrum radiometer (Field Spec Pro). Normalized emission is equivalent to the percentage of total visible energy found on each
1 nm band.300 400 500 600 700 800
Longitud de onda (nm)
0.04
0.03
0.02
0.01
0
Emisi
ón n
orm
aliza
da
AzulRojoBlancoFluorescente

1070
AGROCIENCIA, 16 de noviembre - 31 de diciembre, 2016
VOLUMEN 50, NÚMERO 8
1 mL de muestra en una celda para medir su absorbancia en un espectrofotómetro JENWAY 6320D; las longitudes de onda utilizadas en la medición fueron: 664 mm para clorofila a y 647 nm para clorofila b. Los datos de absorbancia se usaron para calcular la concentración de cada una de las clorofilas con las siguientes ecuaciones: clorofila a12.70 (A664)2.97 (A647); clorofila b20.70 (A647)4.62 (A664) y clorofila total17.90 (A647)8.08 (A664). Porcentaje de plantas con necrosis y albinas sólo se midió para O. tigrinum. Cada unidad experimental (frasco) se dividió en cuadrantes para facilitar los conteos, se contaron las plantas normales, necróticas o con albinismo en cada cuadrante y se su-maron para obtener los totales de cada condición por frasco. Con la suma de plantas normales, necróticas y albinas de cada frasco se obtuvo el número total de plantas por unidad experimental, que se usó como denominador para obtener los porcentajes de plantas necrosadas o albinas: porcentaje de plantas necrosadas o albinas por unidad experimental(Número de plantas necrosa-das o albinas por frasco/Número total de plantas contenidas en el frasco)100. El registro de variables en O. tigrinum se realizó 30 d después de iniciar los tratamientos, mientras que para L. autumnalis fue a los 90 d.
Análisis de datos
Con los datos se realizó un análisis de varianza y la prueba de Tukey (p0.05) con SAS versión 9.0. Para ilustrar mejor las comparaciones de medias entre tratamientos, se usó el soft-ware R versión 3.1.1, que da gráficas para las diferencias. Para comprobar la normalidad de la distribución de datos se usó la prueba Shapiro (R Core Team, 2014).
ResultAdos y dIscusIón
Desarrollo de Oncidium tigrinum
Las plántulas de O. tigrinum no mostraron dife-rencias significativas entre tratamientos en el peso de materia fresca, el número de hojas y los conte-nidos de clorofila a, b y total. Aunque se esperaba que la exposición a la combinación de los espectros rojo y azul incrementara la concentración de pig-mentos y peso fresco debido a que: 1) las clorofilas a y b tienen su máxima absorción en el rango de azul y rojo (Pimentel et al., 2007); 2) la luz influye considerablemente en la multiplicación celular y el crecimiento de los tejidos vegetales cultivados in vitro (Araujo et al., 2009); 3) ya se tenía registrado
measurement was performed with the following wavelengths: 664 nm for chlorophyll a and 647 nm for chlorophyll b. Absorbance data was used to calculate the concentration of each chlorophyll through the following equations: chlorophyll a12.70 (A664)2.97 (A647); chlorophyll b20.70 (A647)4.62 (A664) and total chlorophyll17.90 (A647)8.08 (A664). Percentage of necrotic and albino plants was only measured for O. tigrinum. Each experimental unit (jar) was divided into quadrants to facilitate counting. Then, normal, necrotic or albino plants were counted by quadrant and added to obtain the total number of each condition per jar. With the total sum of normal, necrotic, and albino plants per experimental unit, the total number of plants per experimental unit was obtained. This number was then used as denominator to calculate the percentage of necrotic or albino plants with the formula: percentage of necrotic or albino plants per experimental unit(Number of necrotic or albino plants per jar/Total number of plants in the jar)100. Variable recordings for O. tigrinum were performed 30 d after treatments started, while variable recordings for L. autumnalis were performed after 90 d.
Data analysis
With the data a variance analysis and a Tukey test (p0.05) were performed with SAS 9.0. To better illustrate mean comparisons between treatments, R software 3.1.1 was used, which provides a graphic representation of the differences. The Shapiro test was used to verify distribution normality in the data (R Core Team, 2014).
Results And dIscussIon
Oncidium tigrinum development
Oncidium tigrinum seedlings did not have significant differences between treatments in terms of fresh matter weight, total leaf number, or a, b or total chlorophyll. The exposure to the combination of red and blue spectrums was expected to increase the concentration of pigments and fresh weight, given that: 1) a and b chlorophylls reach their maximum absorbance in the blue and red range (Pimentel et al., 2007); 2) light has a strong influence in cellular multiplication and in in vitro cultured plant tissue growth (Araujo et al., 2009); 3) an increase in biomass and photosynthetically active pigment concentration (a, b, and total chlorophyll) as a result of the exposure to the combination of red and blue
CALIDAD DE LUZ LED Y DESARROLLO in vitro DE Oncidium tigrinum Y Laelia autumnalis (ORCHIDACEAE)
1071MURILLO-TALAVERA et al.
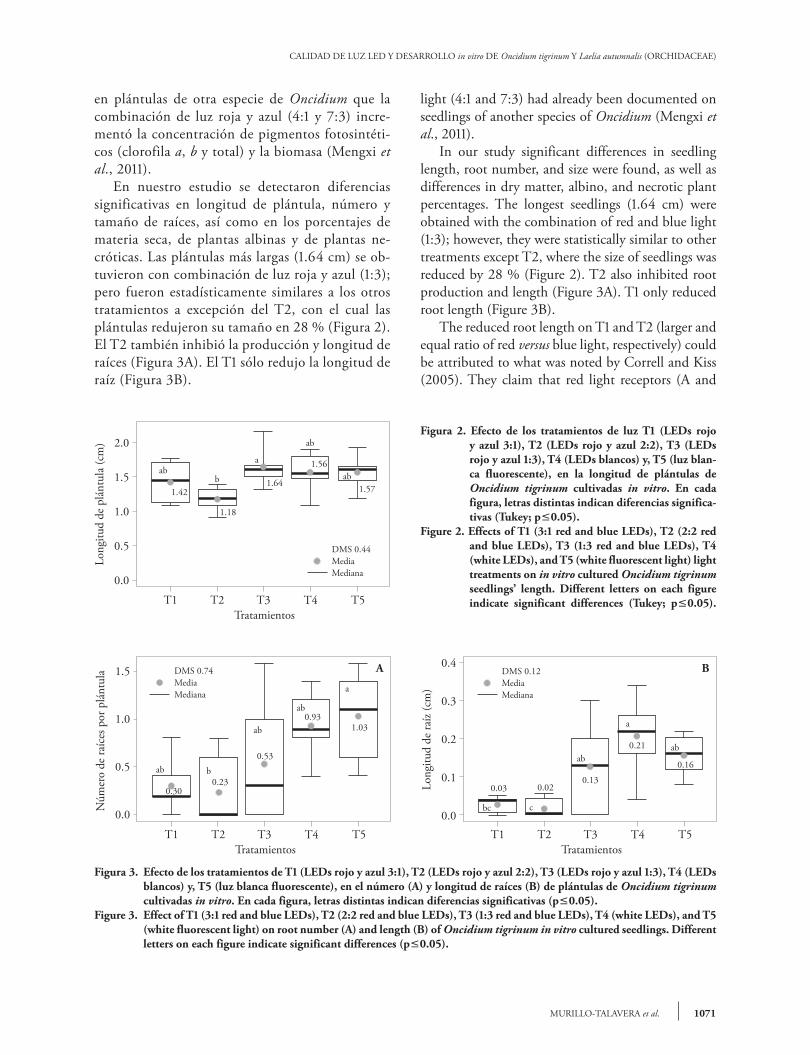
en plántulas de otra especie de Oncidium que la combinación de luz roja y azul (4:1 y 7:3) incre-mentó la concentración de pigmentos fotosintéti-cos (clorofila a, b y total) y la biomasa (Mengxi et al., 2011). En nuestro estudio se detectaron diferencias significativas en longitud de plántula, número y tamaño de raíces, así como en los porcentajes de materia seca, de plantas albinas y de plantas ne-cróticas. Las plántulas más largas (1.64 cm) se ob-tuvieron con combinación de luz roja y azul (1:3); pero fueron estadísticamente similares a los otros tratamientos a excepción del T2, con el cual las plántulas redujeron su tamaño en 28 % (Figura 2). El T2 también inhibió la producción y longitud de raíces (Figura 3A). El T1 sólo redujo la longitud de raíz (Figura 3B).
light (4:1 and 7:3) had already been documented on seedlings of another species of Oncidium (Mengxi et al., 2011). In our study significant differences in seedling length, root number, and size were found, as well as differences in dry matter, albino, and necrotic plant percentages. The longest seedlings (1.64 cm) were obtained with the combination of red and blue light (1:3); however, they were statistically similar to other treatments except T2, where the size of seedlings was reduced by 28 % (Figure 2). T2 also inhibited root production and length (Figure 3A). T1 only reduced root length (Figure 3B). The reduced root length on T1 and T2 (larger and equal ratio of red versus blue light, respectively) could be attributed to what was noted by Correll and Kiss (2005). They claim that red light receptors (A and
Figura 2. Efecto de los tratamientos de luz T1 (LEDs rojo y azul 3:1), T2 (LEDs rojo y azul 2:2), T3 (LEDs rojo y azul 1:3), T4 (LEDs blancos) y, T5 (luz blan-ca fluorescente), en la longitud de plántulas de Oncidium tigrinum cultivadas in vitro. En cada figura, letras distintas indican diferencias significa-tivas (Tukey; p0.05).
Figure 2. Effects of T1 (3:1 red and blue LEDs), T2 (2:2 red and blue LEDs), T3 (1:3 red and blue LEDs), T4 (white LEDs), and T5 (white fluorescent light) light treatments on in vitro cultured Oncidium tigrinum seedlings’ length. Different letters on each figure indicate significant differences (Tukey; p0.05).
1.42
1.18
1.64
1.56
1.57
abb
a
ab
ab
DMS 0.44MediaMediana
T1 T2 T3 T4 T5
2.0
1.5
1.0
0.5
0.0
Long
itud
de p
lánt
ula
(cm
)
Tratamientos
Figura 3. Efecto de los tratamientos de T1 (LEDs rojo y azul 3:1), T2 (LEDs rojo y azul 2:2), T3 (LEDs rojo y azul 1:3), T4 (LEDs blancos) y, T5 (luz blanca fluorescente), en el número (A) y longitud de raíces (B) de plántulas de Oncidium tigrinum cultivadas in vitro. En cada figura, letras distintas indican diferencias significativas (p0.05).
Figure 3. Effect of T1 (3:1 red and blue LEDs), T2 (2:2 red and blue LEDs), T3 (1:3 red and blue LEDs), T4 (white LEDs), and T5 (white fluorescent light) on root number (A) and length (B) of Oncidium tigrinum in vitro cultured seedlings. Different letters on each figure indicate significant differences (p0.05).
0.300.23
0.53
0.931.03
ab b
ab
ab
a
DMS 0.74MediaMediana
T1 T2 T3 T4 T5
1.5
1.0
0.5
0.0Núm
ero
de ra
íces
por
plá
ntul
a
Tratamientos
A
0.03 0.020.13
0.21
0.16
bc c
abab
a
DMS 0.12MediaMediana
T1 T2 T3 T4 T5
0.4
0.3
0.2
0.1
0.0
Long
itud
de ra
íz (c
m)
Tratamientos
B

1072
AGROCIENCIA, 16 de noviembre - 31 de diciembre, 2016
VOLUMEN 50, NÚMERO 8
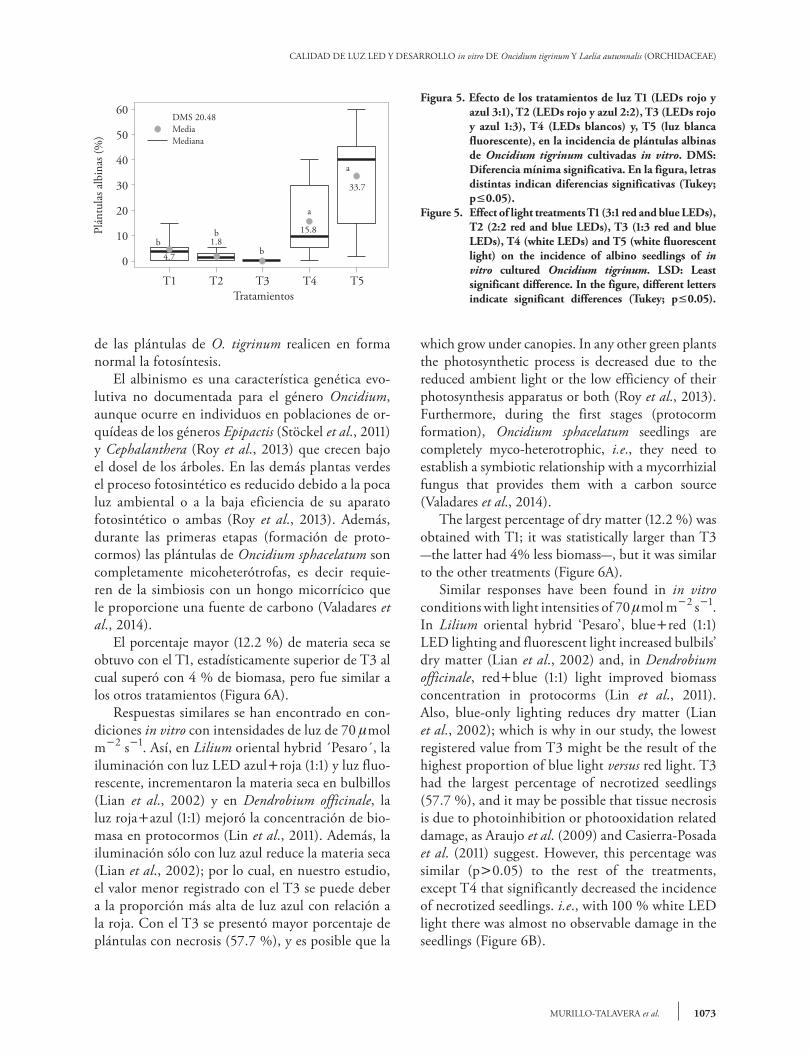
La menor longitud de raíces en el T1 y T2 (ma-yor e igual proporción de luz roja respecto a la azul), puede atribuirse a lo señalado por Correll y Kiss (2005), quienes afirman que los receptores de luz roja (fitocromo A y B) tienen efecto inhibi-torio sobre la elongación de raíces. La luz blanca emite menor proporción de radiación en la región roja, estimula el enraizamiento de plántulas de Cattleya loddigessi (Araujo et al., 2009) y junto con la luz verde promueve el enraizamiento de brotes Dendranthemagrandiflora ‘Lilac Wonder’ (Miler y Zalewska, 2006). Nuestro estudio confirma que la luz blanca emitida por los LEDs y las lámparas fluorescentes promovió el enraizamiento in vitro de plántulas de O. tigrinum y estas fuentes de luz emitieron la menor cantidad de radiación en la re-gión roja, comparado con los otros espectros estu-diados. Las plántulas micropropagadas fueron de buena calidad en todos los tratamientos de iluminación y no se presentaron cambios degenerativos en hojas y pseudobulbos (Figura 4); excepto por la presen-cia de algunas con ausencia total de clorofila. La incidencia mayor de plántulas albinas (33.7 %) se encontró en el T5 (luz fluorescente) y fue similar a T4 (15.8 %), pero significativamente diferente a los demás tratamientos, que en promedio mostraron 2.16 % de plántulas albinas (Figura 5). Esto parece indicar que la cantidad de luz que emiten las lámpa-ras fluorescente y LEDs blancas en las regiones roja y azul del espectro, no es suficiente para que algunas
B phytochrome) have an inhibitory effect on root elongation. White light -which has less radiation ratio in the red region of the spectrum- stimulates rooting in Cattleya loddigessi seedlings (Araujo et al., 2009) and, together with green light, boosts bud rooting of Dendranthemagrandiflora ‘Lilac Wonder’ (Miler and Zalewska, 2006). Our study confirms that white light from LEDs and fluorescent lamps promoted rooting of in vitro O. tigrinum seedlings and that these light sources emitted the least amount of radiation in the red region, compared to all other studied spectrums. Micropropagated seedlings had good quality in all lighting treatments and degenerative changes in leaves and pseudobulbs were not found (Figure 4), apart from some cases with total chlorophyll absence. The highest incidence of albino seedlings (33.7 %) was found on T5 (fluorescent light) and was similar to that of T4 (15.8 %), but significantly different from the other treatments, which showed an average of 2.16 % of albino seedlings (Figure 5). These findings seem to indicate that fluorescent lamps and white LEDs light emission on the red and blue regions of the spectrum are not enough to ensure that some O. tigrinum seedlings can perform normal photosynthesis. Albinism is an evolutionary genetic characteristic that has not been documented on the Oncidium genus, although it occurs in some individuals of orchid populations of the Epipactis (Stöckel et al., 2011) and Cephalanthera (Roy et al., 2013) genera,
Figura 4. Plántulas de Oncidium tigrinum in vitro iluminadas durante 30 d con diferentes combinaciones de luz: T1 (LEDs rojo y azul 3:1), T2 (LEDs rojo y azul 2:2), T3 (LEDs rojo y azul 1:3), T4 (LEDs blancos) y, T5 (luz blanca fluorescente).
Figure 4. In vitro Oncidium tigrinum seedlings lighted during 30 days with different light combinations T1 (3:1 red and blue LEDs), T2 (2:2 red and blue LEDs), T3 (1:3 red and blue LEDs), T4 (white LEDs), and T5 (white fluorescent light).
T1 T2 T3 T4 T5
CALIDAD DE LUZ LED Y DESARROLLO in vitro DE Oncidium tigrinum Y Laelia autumnalis (ORCHIDACEAE)
1073MURILLO-TALAVERA et al.
Figura 5. Efecto de los tratamientos de luz T1 (LEDs rojo y azul 3:1), T2 (LEDs rojo y azul 2:2), T3 (LEDs rojo y azul 1:3), T4 (LEDs blancos) y, T5 (luz blanca fluorescente), en la incidencia de plántulas albinas de Oncidium tigrinum cultivadas in vitro. DMS: Diferencia mínima significativa. En la figura, letras distintas indican diferencias significativas (Tukey; p0.05).
Figure 5. Effect of light treatments T1 (3:1 red and blue LEDs), T2 (2:2 red and blue LEDs), T3 (1:3 red and blue LEDs), T4 (white LEDs) and T5 (white fluorescent light) on the incidence of albino seedlings of in vitro cultured Oncidium tigrinum. LSD: Least significant difference. In the figure, different letters indicate significant differences (Tukey; p0.05).
4.7
1.815.8
33.7
bb
b
a
a
DMS 20.48MediaMediana
T1 T2 T3 T4 T5
60
50
40
30
20
10
0
Plán
tula
s alb
inas
(%)
Tratamientos
which grow under canopies. In any other green plants the photosynthetic process is decreased due to the reduced ambient light or the low efficiency of their photosynthesis apparatus or both (Roy et al., 2013). Furthermore, during the first stages (protocorm formation), Oncidium sphacelatum seedlings are completely myco-heterotrophic, i.e., they need to establish a symbiotic relationship with a mycorrhizial fungus that provides them with a carbon source (Valadares et al., 2014). The largest percentage of dry matter (12.2 %) was obtained with T1; it was statistically larger than T3 -the latter had 4% less biomass-, but it was similar to the other treatments (Figure 6A). Similar responses have been found in in vitro conditions with light intensities of 70 mol m2 s1. In Lilium oriental hybrid ‘Pesaro’, bluered (1:1) LED lighting and fluorescent light increased bulbils’ dry matter (Lian et al., 2002) and, in Dendrobium officinale, redblue (1:1) light improved biomass concentration in protocorms (Lin et al., 2011). Also, blue-only lighting reduces dry matter (Lian et al., 2002); which is why in our study, the lowest registered value from T3 might be the result of the highest proportion of blue light versus red light. T3 had the largest percentage of necrotized seedlings (57.7 %), and it may be possible that tissue necrosis is due to photoinhibition or photooxidation related damage, as Araujo et al. (2009) and Casierra-Posada et al. (2011) suggest. However, this percentage was similar (p0.05) to the rest of the treatments, except T4 that significantly decreased the incidence of necrotized seedlings. i.e., with 100 % white LED light there was almost no observable damage in the seedlings (Figure 6B).
de las plántulas de O. tigrinum realicen en forma normal la fotosíntesis. El albinismo es una característica genética evo-lutiva no documentada para el género Oncidium, aunque ocurre en individuos en poblaciones de or-quídeas de los géneros Epipactis (Stöckel et al., 2011) y Cephalanthera (Roy et al., 2013) que crecen bajo el dosel de los árboles. En las demás plantas verdes el proceso fotosintético es reducido debido a la poca luz ambiental o a la baja eficiencia de su aparato fotosintético o ambas (Roy et al., 2013). Además, durante las primeras etapas (formación de proto-cormos) las plántulas de Oncidium sphacelatum son completamente micoheterótrofas, es decir requie-ren de la simbiosis con un hongo micorrícico que le proporcione una fuente de carbono (Valadares et al., 2014). El porcentaje mayor (12.2 %) de materia seca se obtuvo con el T1, estadísticamente superior de T3 al cual superó con 4 % de biomasa, pero fue similar a los otros tratamientos (Figura 6A). Respuestas similares se han encontrado en con-diciones in vitro con intensidades de luz de 70 mol m2 s1. Así, en Lilium oriental hybrid ´Pesaro´, la iluminación con luz LED azulroja (1:1) y luz fluo-rescente, incrementaron la materia seca en bulbillos (Lian et al., 2002) y en Dendrobium officinale, la luz rojaazul (1:1) mejoró la concentración de bio-masa en protocormos (Lin et al., 2011). Además, la iluminación sólo con luz azul reduce la materia seca (Lian et al., 2002); por lo cual, en nuestro estudio, el valor menor registrado con el T3 se puede deber a la proporción más alta de luz azul con relación a la roja. Con el T3 se presentó mayor porcentaje de plántulas con necrosis (57.7 %), y es posible que la

1074
AGROCIENCIA, 16 de noviembre - 31 de diciembre, 2016
VOLUMEN 50, NÚMERO 8
Laelia autumnalis development
Significant differences on seedling and root length, number of leaves and roots, in seedling’s fresh and dry weight, and in a, b, and total chlorophyll content were found in this species. The longest seedlings were obtained in treatments with the highest emissions of light in the blue region: T3 (3.26 cm),T1 (3.04 cm), and T2 (2.93 cm), statistically similar, but superior to T4 (2.65 cm), and T5 (1.88 cm)(Figure 7A). However, this elongated plants presented degenerative morphological changes, with thinner stems and leaves than the other treatments (Figure 8). This could be explained partly because blue light increases plants’ water consumption to their maximum cellular capacity, which can produce increased tissue length (Ribeiro et al., 2009). Contrary to our study’s results, Ribeiro et al. (2009) did not find differences in Zantedeschia aethiopica seedlings length as a result of the quality of white, red, blue, and green light; however, in Paphiopedilum sprouts, Lee et al. (2011) observed apical dominance loss (small plants) as a result of blue light. Average leaf number in all treatments was over six, except in T1 where the average was just five, although only T2 was statistically different with 8.23 leaves per plant (Figure 7B). This could be a reflection of the low proportion of blue light versus red light in T1 (1:3), compared with T2 (2:2). Lateral bud and leaf imposition in Anthurium seedlings (Budiarto, 2010) and Dendrobium officinale PLBs (Lin et al., 2011) are
12.2
11.0
8.2
8.810.0
b
DMS 3.4MediaMediana
T1 T2 T3 T4 T5
20
15
10
5
0
Mat
eria
seca
(%)
Tratamientos
A
15.7
40.2
57.7
9.0
ab
b
a
ab
ab30.8
b
DMS 47.4MediaMediana
T1 T2 T3 T4 T5
100
80
60
40
20
0
Plán
tula
s con
nec
rosis
(%)
Tratamientos
B
Figura 6. Efecto de los tratamientos de luz T1 (LEDs rojo y azul 3:1), T2 (LEDs rojo y azul 2:2), T3 (LEDs rojo y azul 1:3), T4 (LEDs blancos) y, T5 (luz blanca fluorescente), en la acumulación de materia seca (A) e incidencia de plántulas con necrosis (B) de Oncidium tigrinum cultivadas in vitro. En cada figura, letras distintas indican diferencias significativas (p0.05).
Figure 6. Effect of light treatments T1 (3:1 red and blue LEDs), T2 (2:2 red and blue LEDs), T3 (1:3 red and blue LEDs), T4 (white LEDs), and T5 (white fluorescent light) on dry matter accumulation (A) and in the incidence of necrotic seedlings (B) of in vitro cultured Oncidium tigrinum. Different letters on each figure indicate significant differences (p0.05).
necrosis de tejidos se deba a daños por fotoinhibi-ción o fotoxidación, como lo señalan Araujo et al. (2009) y Casierra-Posada et al. (2011). Sin embargo, fue similar (p0.05) a los demás tratamientos, con excepción del T4 que disminuyó significativamente la incidencia de plántulas necrosadas. Es decir, con luz LED 100 % blanca se obtuvieron plántulas casi sin daño aparente (Figura 6B).
Desarrollo de Laelia autumnalis
En esta especie se detectaron diferencias signifi-cativas entre tratamientos en longitud de plántula y raíz, número de hojas y de raíces, en el peso fresco y seco de plántulas, así como en el contenido de clorofila a, b y total. Las plántulas más largas se ob-tuvieron con los tratamientos con mayor emisión de luz en la región azul: T3 (3.26 cm), T1 (3.04 cm) y T2 (2.93 cm), estadísticamente similares, pero superiores a T4 (2.65 cm) y, T5 (1.88 cm) (Figura 7A). Sin embargo, estas plantas alargadas presenta-ron cambios morfológicos degenerativos, con tallos y hojas más delgados que las plantas del resto de los tratamientos (Figura 8). Esto puede explicarse en parte porque la luz azul, aumenta el consumo de agua por las plantas hasta su máxima capacidad celular, lo cual puede incidir en mayor alargamien-to de los tejidos (Ribeiro et al., 2009). Contrario nuestros resultados, Ribeiro et al. (2009) no encon-traron diferencias en la longitud de las plántulas de Zantedeschia aethiopica por efecto de la calidad de la

CALIDAD DE LUZ LED Y DESARROLLO in vitro DE Oncidium tigrinum Y Laelia autumnalis (ORCHIDACEAE)
1075MURILLO-TALAVERA et al.
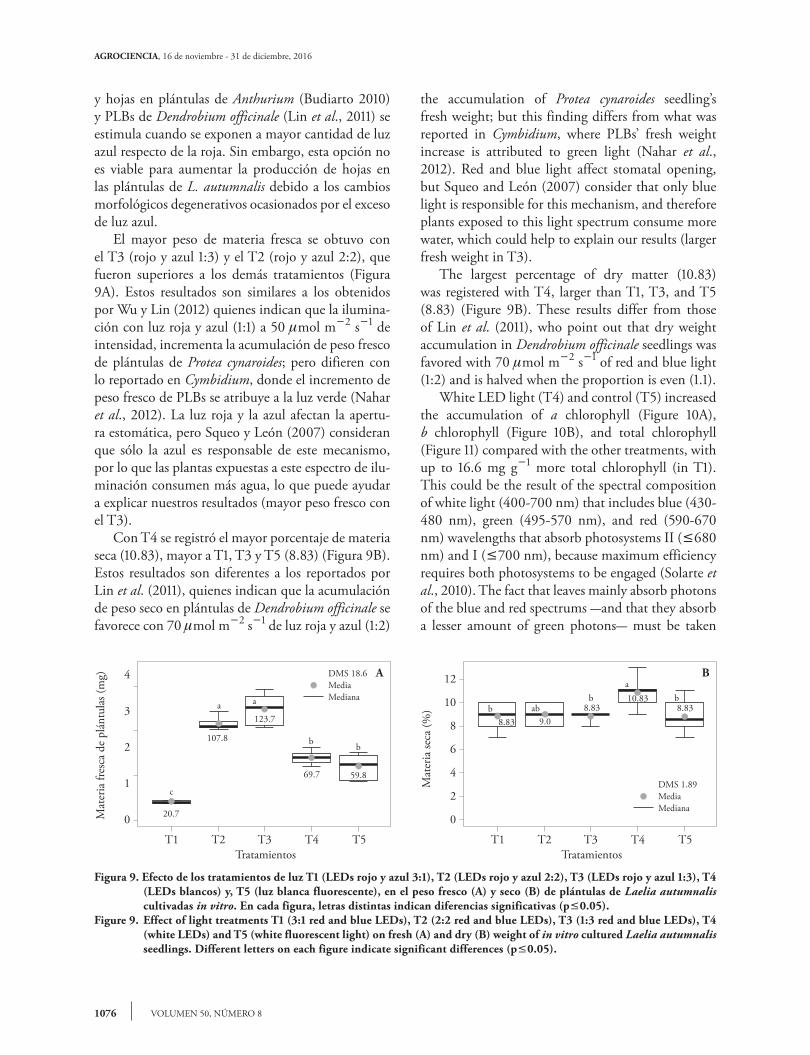
stimulated when exposed to more blue light than red light. However, this is not a viable option to increase leaf production in L. autumnalis seedlings, given the degenerative morphological changes produced by excessive blue light. The greatest fresh matter weight was obtained with T3 (red and blue 1:3) and T2 (red and blue 2:2), which were superior to the other treatments (Figure 9A). These results are similar to those obtained by Wu and Lin (2012) who reported that red and blue light (1:1) at 50 mol m2 s1 intensity increases
3.042.93
3.26
2.65
1.88
c
b
aabab
DMS 0.44MediaMediana
T1 T2 T3 T4 T5
4
3
2
1
0
Long
itud
de p
lánt
ula
(cm
)
Tratamientos
A
5.43
8.23
7.07 6.436.93
abab
aba
b
DMS 2.58MediaMediana
T1 T2 T3 T4 T5
10
8
6
4
2
0
Núm
ero
de h
ojas
por
plá
ntul
a
Tratamientos
B
Figura 7. Efecto de los tratamientos de luz T1 (LEDs rojo y azul 3:1), T2 (LEDs rojo y azul 2:2), T3 (LEDs rojo y azul 1:3), T4 (LEDs blancos) y, T5 (luz blanca fluorescente), en la longitud (A) y número de hojas (B) de plántulas de Laelia autumnalis cultivadas in vitro. En cada figura, letras distintas indican diferencias significativas (p0.05).
Figure 7. Effect of light treatments T1 (3:1 red and blue LEDs), T2 (2:2 red and blue LEDs), T3 (1:3 red and blue LEDs), T4 (white LEDs), and T5 (white fluorescent light) on leaf length (A) and number of leaves (B) of in vitro cultured Laelia autumnalis seedlings. Different letters on each figure indicate significant differences (p0.05).
luz blanca, roja, azul y verde; en cambio, en brotes de Paphiopedilum. Lee et al. (2011) observaron una pérdida de dominancia apical (plantas pequeñas) por efecto de la luz azul. El número de hojas promedio de todos los trata-mientos fue mayor de seis, excepto en el T1 que sólo tuvo cinco, aunque estadísticamente sólo fue diferen-te del T2, con 8.23 hojas por planta (Figura 7B). Este efecto pudo deberse a la baja proporción de la luz azul con relación a la roja en el T1 (1:3) en compara-ción con T2 (2:2). La inducción de brotes laterales
T1 T2 T3 T4 T5
Figura 8. Plántulas de Laelia autumnalis in vitro irradiadas durante 90 días con diferentes combinaciones de luz: T1 (LEDs rojo y azul 3:1), T2 (LEDs rojo y azul 2:2), T3 (LEDs rojo y azul 1:3), T4 (LEDs blancos) y, T5 (luz blanca fluorescente).
Figure 8. In vitro Laelia autumnalis seedlings irradiated with different combinations of light during 90 days: T1 (3:1 red and blue LEDs), T2 (2:2 red and blue LEDs), T3 (1:3 red and blue LEDs), T4 (white LEDs), and T5 (white fluorescent light).
1 cm
1076
AGROCIENCIA, 16 de noviembre - 31 de diciembre, 2016
VOLUMEN 50, NÚMERO 8
y hojas en plántulas de Anthurium (Budiarto 2010) y PLBs de Dendrobium officinale (Lin et al., 2011) se estimula cuando se exponen a mayor cantidad de luz azul respecto de la roja. Sin embargo, esta opción no es viable para aumentar la producción de hojas en las plántulas de L. autumnalis debido a los cambios morfológicos degenerativos ocasionados por el exceso de luz azul. El mayor peso de materia fresca se obtuvo con el T3 (rojo y azul 1:3) y el T2 (rojo y azul 2:2), que fueron superiores a los demás tratamientos (Figura 9A). Estos resultados son similares a los obtenidos por Wu y Lin (2012) quienes indican que la ilumina-ción con luz roja y azul (1:1) a 50 mol m2 s1 de intensidad, incrementa la acumulación de peso fresco de plántulas de Protea cynaroides; pero difieren con lo reportado en Cymbidium, donde el incremento de peso fresco de PLBs se atribuye a la luz verde (Nahar et al., 2012). La luz roja y la azul afectan la apertu-ra estomática, pero Squeo y León (2007) consideran que sólo la azul es responsable de este mecanismo, por lo que las plantas expuestas a este espectro de ilu-minación consumen más agua, lo que puede ayudar a explicar nuestros resultados (mayor peso fresco con el T3). Con T4 se registró el mayor porcentaje de materia seca (10.83), mayor a T1, T3 y T5 (8.83) (Figura 9B). Estos resultados son diferentes a los reportados por Lin et al. (2011), quienes indican que la acumulación de peso seco en plántulas de Dendrobium officinale se favorece con 70 mol m2 s1 de luz roja y azul (1:2)
the accumulation of Protea cynaroides seedling’s fresh weight; but this finding differs from what was reported in Cymbidium, where PLBs’ fresh weight increase is attributed to green light (Nahar et al., 2012). Red and blue light affect stomatal opening, but Squeo and León (2007) consider that only blue light is responsible for this mechanism, and therefore plants exposed to this light spectrum consume more water, which could help to explain our results (larger fresh weight in T3). The largest percentage of dry matter (10.83) was registered with T4, larger than T1, T3, and T5 (8.83) (Figure 9B). These results differ from those of Lin et al. (2011), who point out that dry weight accumulation in Dendrobium officinale seedlings was favored with 70 mol m2 s1 of red and blue light (1:2) and is halved when the proportion is even (1.1). White LED light (T4) and control (T5) increased the accumulation of a chlorophyll (Figure 10A), b chlorophyll (Figure 10B), and total chlorophyll (Figure 11) compared with the other treatments, with up to 16.6 mg g1 more total chlorophyll (in T1). This could be the result of the spectral composition of white light (400-700 nm) that includes blue (430-480 nm), green (495-570 nm), and red (590-670 nm) wavelengths that absorb photosystems II (680 nm) and I (700 nm), because maximum efficiency requires both photosystems to be engaged (Solarte et al., 2010). The fact that leaves mainly absorb photons of the blue and red spectrums -and that they absorb a lesser amount of green photons- must be taken
Figura 9. Efecto de los tratamientos de luz T1 (LEDs rojo y azul 3:1), T2 (LEDs rojo y azul 2:2), T3 (LEDs rojo y azul 1:3), T4 (LEDs blancos) y, T5 (luz blanca fluorescente), en el peso fresco (A) y seco (B) de plántulas de Laelia autumnalis cultivadas in vitro. En cada figura, letras distintas indican diferencias significativas (p0.05).
Figure 9. Effect of light treatments T1 (3:1 red and blue LEDs), T2 (2:2 red and blue LEDs), T3 (1:3 red and blue LEDs), T4 (white LEDs) and T5 (white fluorescent light) on fresh (A) and dry (B) weight of in vitro cultured Laelia autumnalis seedlings. Different letters on each figure indicate significant differences (p0.05).
20.7
107.8
123.7
69.7 59.8
bb
aa
c
DMS 18.6MediaMediana
T1 T2 T3 T4 T5
4
3
2
1
0Mat
eria
fres
ca d
e pl
ántu
las (
mg)
Tratamientos
A
9.08.838.83
10.838.83
ba
babb
DMS 1.89MediaMediana
T1 T2 T3 T4 T5
12
10
8
6
4
2
0
Mat
eria
seca
(%)
Tratamientos
B

CALIDAD DE LUZ LED Y DESARROLLO in vitro DE Oncidium tigrinum Y Laelia autumnalis (ORCHIDACEAE)
1077MURILLO-TALAVERA et al.
y disminuye a la mitad cuando se iguala su propor-ción (1:1). La luz LED blanca (T4) y el testigo (T5) incre-mentaron la acumulación de clorofila a (Figura 10A), clorofila b (Figura 10B) y clorofila total (Figura 11) respecto a los demás tratamientos, con hasta 16.6 mg g1 más clorofila total (en T1). Esto puede deberse a la composición espectral de la luz blanca (400-700 nm), que incluye las longitudes de onda azul (430-480 nm), verde (495-570 nm) y roja (590-670 nm) que absorben los fotosistemas II (680 nm) y I (700 nm), pues para una máxima eficiencia deben participar ambos fotosistemas (Solarte et al., 2010). Hay que considerar que las hojas absorben fotones principalmente de los espectros azul y rojo, y de ma-nera más débil lo hacen en el verde, aunque la ma-yoría de esos fotones son reflejados por las plantas en forma de radiación difusa (Lazo y Ascencio, 2010).
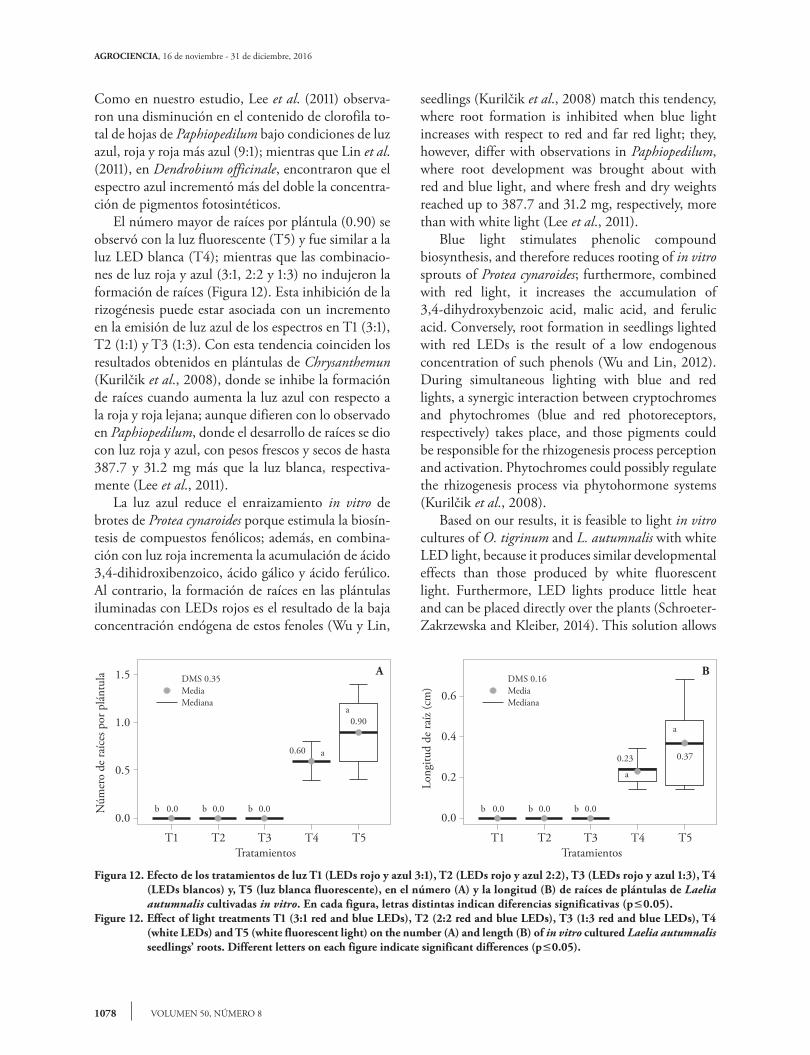
into consideration, although the plants reflect most of those photons as diffuse radiation (Lazo and Ascencio, 2010). Lee et al. (2011) observed a decrease in total chlorophyll content in Paphiopedilum leaves, under blue, red, and red plus blue (9:1) light conditions, which matches the results of our study; while Lin et al. (2011) found that in Dendrobium officinale the blue spectrum increased more than twofold the concentration of photosynthetically active pigments. The highest number of roots per seedling (0.90) was found in the fluorescent light treatment (T5) and was similar to LED white light (T4); whereas that combinations of red and blue light (3:1, 2:2, and 1:3) did not induce root formation (Figure 12). This rhizogenesis inhibition could be related to an increase in the blue spectrum radiation in T1 (3:1), T2 (1:1), and T3 (1:3). Results of Chrysanthemun
1.52.3
5.6
13.910.2
a
a
bc
c
DMS 7.0MediaMediana
T1 T2 T3 T4 T5
25
20
15
10
5
0
-1
Clo
rofil
a a
(mg
g)
Tratamientos
A
0.850.98
1.98
5.08
3.53a
a
b
cb
DMS 2.62MediaMediana
T1 T2 T3 T4 T5
8
6
4
2
0
-1
Clo
rofil
a b
(mg
g)
Tratamientos
B
Figura 10. Efecto de los tratamientos de luz T1 (LEDs rojo y azul 3:1), T2 (LEDs rojo y azul 2:2), T3 (LEDs rojo y azul 1:3), T4 (LEDs blancos) y, T5 (luz blanca fluorescente), en la acumulación de clorofila a (A) y clorofila b (B) de plántulas de Laelia autumnalis cultivadas in vitro. En cada figura, letras distintas indican diferencias significativas (p0.05).
Figure 10. Effect of light treatments T1 (3:1 red and blue LEDs), T2 (2:2 red and blue LEDs), T3 (1:3 red and blue LEDs), T4 (white LEDs), and T5 (white fluorescent light) on the accumulation of a chlorophyll (A) and b chlorophyll (B) of in vitro cultured Laelia autumnalis seedlings. Different letters on each figure indicate significant differences (p0.05).
2.313.30
7.53
18.9613.72
a
a
b
cc
DMS 9.52MediaMediana
T1 T2 T3 T4 T5
30
20
10
0
-1
Clo
rofil
a to
tal (
mg
g)
Tratamientos
Figura 11. Efecto de los tratamientos de luz T1 (LEDs rojo y azul 3:1), T2 (LEDs rojo y azul 2:2), T3 (LEDs rojo y azul 1:3), T4 (LEDs blancos) y, T5 (luz blanca fluorescente), en la acumulación de cloro-fila total de plántulas de Laelia autumnalis cul-tivadas in vitro. En cada figura, letras distintas indican diferencias significativas (p0.05).
Figure 11. Effect of light treatments T1 (3:1 red and blue LEDs), T2 (2:2 red and blue LEDs), T3 (1:3 red and blue LEDs), T4 (white LEDs), and T5 (white fluorescent light) on the accumulation of total chlorophyll of in vitro cultured Laelia autumnalis seedlings. Different letters on each figure indicate significant differences (p0.05).
1078
AGROCIENCIA, 16 de noviembre - 31 de diciembre, 2016
VOLUMEN 50, NÚMERO 8
Figura 12. Efecto de los tratamientos de luz T1 (LEDs rojo y azul 3:1), T2 (LEDs rojo y azul 2:2), T3 (LEDs rojo y azul 1:3), T4 (LEDs blancos) y, T5 (luz blanca fluorescente), en el número (A) y la longitud (B) de raíces de plántulas de Laelia autumnalis cultivadas in vitro. En cada figura, letras distintas indican diferencias significativas (p0.05).
Figure 12. Effect of light treatments T1 (3:1 red and blue LEDs), T2 (2:2 red and blue LEDs), T3 (1:3 red and blue LEDs), T4 (white LEDs) and T5 (white fluorescent light) on the number (A) and length (B) of in vitro cultured Laelia autumnalis seedlings’ roots. Different letters on each figure indicate significant differences (p0.05).
0.60
0.00.00.0
0.90a
a
b b b
DMS 0.35MediaMediana
T1 T2 T3 T4 T5
1.5
1.0
0.5
0.0
Núm
ero
de ra
íces
por
plá
ntul
a
Tratamientos
A
0.23
0.00.00.0
0.37
a
a
b b b
DMS 0.16MediaMediana
T1 T2 T3 T4 T5
0.6
0.4
0.2
0.0
Long
itud
de ra
íz (c
m)
Tratamientos
B
Como en nuestro estudio, Lee et al. (2011) observa-ron una disminución en el contenido de clorofila to-tal de hojas de Paphiopedilum bajo condiciones de luz azul, roja y roja más azul (9:1); mientras que Lin et al. (2011), en Dendrobium officinale, encontraron que el espectro azul incrementó más del doble la concentra-ción de pigmentos fotosintéticos. El número mayor de raíces por plántula (0.90) se observó con la luz fluorescente (T5) y fue similar a la luz LED blanca (T4); mientras que las combinacio-nes de luz roja y azul (3:1, 2:2 y 1:3) no indujeron la formación de raíces (Figura 12). Esta inhibición de la rizogénesis puede estar asociada con un incremento en la emisión de luz azul de los espectros en T1 (3:1), T2 (1:1) y T3 (1:3). Con esta tendencia coinciden los resultados obtenidos en plántulas de Chrysanthemun (Kurilčik et al., 2008), donde se inhibe la formación de raíces cuando aumenta la luz azul con respecto a la roja y roja lejana; aunque difieren con lo observado en Paphiopedilum, donde el desarrollo de raíces se dio con luz roja y azul, con pesos frescos y secos de hasta 387.7 y 31.2 mg más que la luz blanca, respectiva-mente (Lee et al., 2011). La luz azul reduce el enraizamiento in vitro de brotes de Protea cynaroides porque estimula la biosín-tesis de compuestos fenólicos; además, en combina-ción con luz roja incrementa la acumulación de ácido 3,4-dihidroxibenzoico, ácido gálico y ácido ferúlico. Al contrario, la formación de raíces en las plántulas iluminadas con LEDs rojos es el resultado de la baja concentración endógena de estos fenoles (Wu y Lin,
seedlings (Kurilčik et al., 2008) match this tendency, where root formation is inhibited when blue light increases with respect to red and far red light; they, however, differ with observations in Paphiopedilum, where root development was brought about with red and blue light, and where fresh and dry weights reached up to 387.7 and 31.2 mg, respectively, more than with white light (Lee et al., 2011). Blue light stimulates phenolic compound biosynthesis, and therefore reduces rooting of in vitro sprouts of Protea cynaroides; furthermore, combined with red light, it increases the accumulation of 3,4-dihydroxybenzoic acid, malic acid, and ferulic acid. Conversely, root formation in seedlings lighted with red LEDs is the result of a low endogenous concentration of such phenols (Wu and Lin, 2012). During simultaneous lighting with blue and red lights, a synergic interaction between cryptochromes and phytochromes (blue and red photoreceptors, respectively) takes place, and those pigments could be responsible for the rhizogenesis process perception and activation. Phytochromes could possibly regulate the rhizogenesis process via phytohormone systems (Kurilčik et al., 2008). Based on our results, it is feasible to light in vitro cultures of O. tigrinum and L. autumnalis with white LED light, because it produces similar developmental effects than those produced by white fluorescent light. Furthermore, LED lights produce little heat and can be placed directly over the plants (Schroeter-Zakrzewska and Kleiber, 2014). This solution allows
CALIDAD DE LUZ LED Y DESARROLLO in vitro DE Oncidium tigrinum Y Laelia autumnalis (ORCHIDACEAE)
1079MURILLO-TALAVERA et al.
installing several levels in a shelf, increasing the number of seedlings per area unit, and reducing energy expenses due to lighting and cooling. However, it is still necessary to study the effect of photoperiod and photosynthetic photon flux density, which vary among species, and represent a particular ecologic adaptation (Kurilčik et al., 2008). For instance, strawberry seedling development requires 60 mol m2 s1 (Nhut et al., 2003), while chrysanthemum explants only need 40 mol m2 s1 (Kurilčik et al., 2008).
conclusIons
The light spectrum emitted by white LEDs was the most favorable for O. tigrinum and L. autumnalis in vitro seedlings development. Therefore, it is possible to replace white fluorescent lamps with white LEDs in an orchid micropropagation laboratory, given that both kinds of light are highly efficient as photosynthetically active radiation sources and they promote similar photomorphic responses in plants. White light reduces length and fresh matter in L. autumnalis’ seedlings, but increases photosynthetic pigments content and promotes rooting. While lighting O. tigrinum seedlings with a greater proportion of red light versus blue light inhibits rooting, it diminishes the formation of albino plants.
—End of the English version—
pppvPPP
2012). Durante la iluminación simultánea con luz azul y roja, ocurre una interacción sinérgica entre criptocromos y fitocromos (fotorreceptores del azul y rojo, respectivamente) y estos pigmentos pueden ser responsables de la percepción y activación del proceso de rizogénesis. Los fitocromos posiblemente regulan el proceso de rizogénesis vía sistemas de fito-hormonas (Kurilčik et al., 2008). Con base en nuestros resultados, es factible ilumi-nar cultivos in vitro de O. tigrinum y L. autumnalis con luz LED blanca, porque produce efectos sobre el desarrollo similares a los obtenidos con luz blanca fluorescente. Además, el calor que emiten las lám-paras LED es bajo y se pueden colocar directamente sobre las plantas (Schroeter-Zakrzewska y Kleiber, 2014). Esta solución permite instalar varios niveles en un estante, incrementar el número de plántulas por unidad de área y reducir los costos de energía por ilu-minación y enfriamiento. Pero aún se debe estudiar el efecto del fotoperiodo y la densidad de flujo fotónico fotosintético, que dependen de la especie en cuestión y es una adaptación ecológica particular (Kurilčik et al., 2008). Por ejemplo, para el desarrollo de plán-tulas de fresa se requiere 60 mol m2 s1 (Nhut et al., 2003) y en explantes de crisantemo sólo 40 mol m2 s1 (Kurilčik et al., 2008).
conclusIones
El espectro de iluminación emitido por LEDs blancos fue el más favorable para el desarrollo in vi-tro de plántulas de O. tigrinum y L. autumnalis. Por lo tanto, en un laboratorio de micropropagación de orquídeas es posible reemplazar las lámparas de luz blanca fluorescente por LEDs blancos, ya que ambos tipos de iluminación son altamente efectivos como fuentes de radiación fotosintética y promueven en las plantas respuestas fotomorfogénicas similares. La luz blanca reduce la longitud y la materia fresca de las plántulas de L. autumnalis, pero aumenta el conteni-do de pigmentos fotosintéticos y promueve su enrai-zamiento. Mientras que la iluminación de plántulas de O. tigrinum con mayor proporción de luz roja con respecto a la azul inhibe el enraizamiento, pero dis-minuye la formación de plantas albinas.
lIteRAtuRA cItAdA
Araujo, A. G. D., M. Pasqual, L. Y. Miyata, E. M. D Castro, e H. S. Rocha. 2009. Qualidade de luz na biometria e anatomia
foliar de plântulas de Cattleya loddigessi L. (Orchidaceae) micropropagadas. Cienc. Rural 39: 2506-2511.
Budiarto, K. 2010. Spectral quality affects morphogenesis on Anthurium plantlet during in vitro culture. Agrivita 32:234-240.
Casierra-Posada, F., J. E. Peña-Olmos, y C. Ulrichs. 2011. Crecimiento y eficiencia fotoquímica del fotosistema II en plantas de fresa (Fragaria sp.) afectadas por la calidad de la luz: implicaciones agronómicas. Rev. UDCA Act. & Div. Cient. 14: 43-53.
Correll, M. J., and J. Z. Kiss. 2005. The roles of phytochromes in elongation and gravitropism of roots. Plant Cell Physiol. 46: 317-323.
Da Rocha, P. S. G., R. P. de Oliveira, W. B. Scivittaro, e U. L. dos Santos. 2010. Diodos emissores de luz e concentrações de BAP na multiplicação in vitro de morangueiro. Cienc. Rural 40:1922-1928.
Dutta, G. S., and B. Jatothu. 2013. Fundamentals and applications of light emitting diodes (LEDs) in in vitro plant growth and morphogenesis. Plant Biotechnol. Rep. 7: 211-220.

1080
AGROCIENCIA, 16 de noviembre - 31 de diciembre, 2016
VOLUMEN 50, NÚMERO 8
Espejo S., A., y A. R. López-Ferrari. 1998. Las Monocotiledóneas Mexicanas una Sinopsis Florística 1. Consejo Nacional para el Conocimiento y Uso de la Biodiversidad. Universidad Autónoma Metropolitana-Ixtapalapa. México, DF. 90 p.
Jao, R. C., and W. Fang. 2004. Growth of potato plantlets in vitro is different when provided concurrent vs alternating blue and red light photoperiods. HortScience 39: 380-382.
Kim, S. J., E. J. Hahn, J. W. Heo, and K. Y. Paek. 2004. Effects of LED on net photosynthetic rate, growth and leaf stomata of Chrysanthemum plantlets in vitro. Sci. Hort. 101: 143-151.
Kurilčik, A., R. Miklušytė-Čanova, S. Dapkūnienė, S. Žilinskaitė, G. Kurilčik, G. Tamulaitis, P. Duchovskis, and A. Žukauskas. 2008. In vitro culture of Chrysanthemum plantlets using light-emitting diodes. Cent. Eur. J. Biol. 3(2): 161-167.
Lazo J., V., y J. Ascencio. 2010. Efecto de diferentes calidades de luz sobre el crecimiento de Cyperus rotundus. Bioagro 22: 153-158.
Lee E., H. E., A. Laguna C., J. Murguía G., P. Elorza M., L. Iglesias A., B. García R., F. A. Barredo P., y N. Santana B. 2007. Regeneración in vitro de Laelia anceps ssp. dawsonii. Revista Científica UDO Agrícola 7: 59-67.
Lee, N. Y., M. J. Lee, Y. K. Kim, J. C. Park, H. K. Park, J. S. Choi, J. N. Hyun, K. J. Kim, K. H. Park, J. K. Ko, and J. G. Kim. 2010. Effect of light emitting diode radiation on antioxidant activity of barley leaf. J. Korean Soc. Appl. Biol. Chem. 53: 685-590.
Lee Y., I., W. Fang, and C. C. Chen. 2011. Effect of six different LED light qualities on the seedling growth of Paphiopedilum Orchid in vitro. Acta Hort. 907: 389-391.
Lian, M. L., H. N. Murthy, and K. Y. Paek. 2002. Effect of light emitting diodes (LEDs) on the in vitro induction and growth of bulblets of Lilium oriental hybrid ´Pesaro´. Sci. Hort. 94: 365-370.
Lin Y., J. Li, B. Li, T. He, and Z. Chun. 2011. Effects of light quality on growth and development of protocorm-like bodies of Dendrobium officinale in vitro. Plant Cell Tiss. Organ. Cult. 105: 329-335.
Loberant B., and A. Altman. 2010. Micropropagation of plants. In: Flickinger, M. C. (ed). Encyclopedia of Industrial Biotechnology: Bioprocess, Bioseparation, and Cell Technology. J. Wiley & Sons Inc. New, York. pp: 1-16.
Mengxi L., X. Zhigang, Y. Yang, and F. Yijie. 2011. Effects of different spectral lights on Oncidium PLBs induction, proliferation, and plant regeneration. Plant Cell Tiss. Organ. Cult. 106: 1-10.
Miler, N., and M. Zalewska. 2006. The influence of light colour on micropropagation of chrysanthemum. Acta Hort. 725: 347–350.
Nahar, S. J., K. Shimasaki, and S. M. Haque. 2012. Effect of different light and two polisaccharides on the proliferation of protocorm-like-bodies of Cymbidium cultured in vitro. Acta Hort. 956: 307-131.
Nhut D.T., T. Takamura, H. Watanabe, K. Okamoto, and M. Tanaka. 2003. Responses of strawberry plantlets cultured in
vitro under superbright red and blue lightemitting diodes (LEDs). Plant Cell Tiss. Org. 73: 43-52.
Pimentel V., C., R. Machado K., e C. L. Salgueiro L. 2007. Qualidade de luz e producao de pigmentos fotossintéticos em plantas in vitro de Phyllanthus tenellus Roxb. Rev. Bras. Biociencias 5: 213-215.
Porra R., J., A. Thompson, and P. Kreidemann. 1989. Determination of accurate extinctions coefficients and simultaneous equations for assaying chlorophylls a and b extracted with four different solvents: verification of the concentration of chlorophyll standars by atomic absorption spectroscopy. BBA-Bioenergetics 957: 384-394.
Poudel, P. R., I. Kataoka, and R. Mochioka. 2008. Effect of red- and blue-light-emitting diodes on growth and morphogenesis of grapes. Plant Cell Tiss. Organ Cult. 92: 147-153.
R Core Team. 2014. R: A language and environment for statistical computing. R Foundation for Statistical Computing, Vienna, Austria. http://www.R-project.org (Consulta: Noviembre 2014).
Ribeiro, M. D. N. O., M. Pasqual, A. B. da Silva, y V. A. Rodrigues. 2009. Multiplicão in vitro de copo-de-leite: espectros de luz e sacarose. Ciencia Rural 39: 2388-2393.
Roy, M., C. Gonneau, A. Rocheteau, D. Berveiller, J.-C. Thomas, C. Damesin, and M.-A. Selosse. 2013. Why do mixotrophic plants stay green? A comparison between green and chlorophyllous orchid individuals in situ. Ecol. Monogr. 83: 95–117.
Schroeter-Zakrzewska, A., and T. Kleiber. 2014. The effect of light colour and type of lamps on rooting and nutrient status in cuttings of michaelmas daisy. Bulg. J. Agric. Sci. 20: 1426-1434.
Solarte M., E., L. Moreno, y L. M. Melgarejo. 2010. VI. Fotosíntesis y pigmentos vegetales. In: Melgarejo L. M. (ed). Experimentos en Fisiología Vegetal. Universidad Nacional de Colombia. pp: 107-122.
Squeo F., A., y M. F. León. 2007. III. Transpiración. In: Squeo F. A., y L. Cardemil (eds). Fisiología Vegetal. Universidad de la Serena. La Serena, Chile. pp: 67-84.
Stöckel, M., C. Meyer, and G. Gebauer. 2011. The degree of mycoheterotrophic carbon gain in green, variegated and vegetative albino individuals of Cephalanthera damasonium is related to leaf chlorophyll concentrations. New Phytol. 189: 790-796.
Szeszko F., D. R. 2011. La Orquideoflora Mexiquense. Primera edición. Consejo Editorial de la Administración Pública Estatal. México. 362 p.
Valadares, R.B.S., S. Perotto, E. C. Santos, and M. R. Lambais. 2014. Proteome changes in Oncidium sphacelatum (Orchidaceae) at different trophic stages of symbiotic germination. Mycorrhiza 24: 349-360.
Wu, H. C., and C. C. Lin. 2012. Red light-emitting diode light irradiation improves root and leaf formation in difficult to propagate Protea cynaroides L. plantlets in vitro. HortScience 47: 1490-1494.