Building Orientation in Green Facade Performance and Its ...
17
Sustainability 2020, 12, x; doi: FOR PEER REVIEW www.mdpi.com/journal/sustainability Article Building Orientation in Green Facade Performance and Its Positive Effects on Urban Landscape Case Study: An Urban Block in Barcelona *Faezeh Bagheri Moghaddam 1 , Josep Maria Fort Mir 1 , Alia Besné Yanguas 2 , Isidro Navarro Delgado 1 and Ernest Redondo Dominguez 1 1 Escola Tècnica Superior d’Arquitectura de Barcelona, Universitat Politècnica de Catalunya, 08028 Barcelona, Spain; [email protected] (F.B.M.); [email protected] (J.M.F.M.); [email protected] (I.N.D.); [email protected] (E.R.D.) 2 Escola Tècnica Superior d’Arquitectura La Salle, Universitat Ramon Llull, 08022 Barcelona, Spain; [email protected] * Correspondence: Faezeh Bagheri Moghaddam Received: date; Accepted: date; Published: date Abstract: This paper addresses the effect of building orientation efficiency of the green facade in energy consumption, for which the case study is an urban block in Passeig de Gracia, L’Eixample, Barcelona. Nowadays, many countries are faced with the trouble of the deficiency of energy resources and the incapability of saving them. Most of this energy is consumed in the cooling, heating, and artificial ventilation of buildings. For this reason, the development of an integrated strategy like a green facade is essential to transform buildings into structures that consume less energy and to improve the occupants’ comfort conditions. From the perspective of the urban landscape, the green facade can influence the quality of life in cities due to its positive effects such as the purification of air, the absorption of carbon dioxide, and the mitigation of dust, as well as the aesthetic and psychological aspects. Such criteria are based on the adoption of suitable orientation for the green facade, which is the second layer of the facade in an office building with a curtain wall as the main facade. Since the most important factor in the implementation of a green facade is the building’s orientation, the optimum orientation could be the key factor in regards to the reduction of energy consumption and cost and the improvement of overall energy efficiency. We used software that helped simulate the total energy consumption, the cost, and the energy use intensity annually and monthly. Consequently, after testing was carried out, it was proven that a green facade as a second layer with a southeast and/or a southwest orientation results in the maximum energy saving in a coastal city with a Mediterranean climate like Barcelona. Keywords: vertical garden; green facade; building orientation; energy consumption; sustainability; urban landscape; simulation software 1. Introduction In recent decades, countries have faced plenty of issues related to energy supplies and the effects of global warming and urban heat islands (UHIs) on energy consumption [1]. For this reason, architects and urban planners have proposed a newer design approach, namely the sustainable building design, to reduce the heat island effect and energy demand and minimize environmental effects [2]. The green facade is an element of sustainable building design which is gradually gaining popularity, and it is being applied extensively on a large scale [3,4]. Moreover, using plants in the facade (green facade) is a bioclimatic strategy that would be effective in reducing energy consumption in buildings, in addition to other psychological, aesthetic, and economic benefits [5].
Transcript of Building Orientation in Green Facade Performance and Its ...
Sustainability 2020, 12, x; doi: FOR PEER REVIEW www.mdpi.com/journal/sustainability
Article
Building Orientation in Green Facade Performance and Its Positive Effects on Urban Landscape Case Study: An Urban Block in Barcelona
*Faezeh Bagheri Moghaddam 1, Josep Maria Fort Mir 1, Alia Besné Yanguas 2, Isidro Navarro
Delgado 1 and Ernest Redondo Dominguez 1
1 Escola Tècnica Superior d’Arquitectura de Barcelona, Universitat Politècnica de Catalunya, 08028
Barcelona, Spain; [email protected] (F.B.M.); [email protected] (J.M.F.M.);
[email protected] (I.N.D.); [email protected] (E.R.D.) 2 Escola Tècnica Superior d’Arquitectura La Salle, Universitat Ramon Llull, 08022 Barcelona, Spain;
* Correspondence: Faezeh Bagheri Moghaddam
Received: date; Accepted: date; Published: date
Abstract: This paper addresses the effect of building orientation efficiency of the green facade in
energy consumption, for which the case study is an urban block in Passeig de Gracia, L’Eixample,
Barcelona. Nowadays, many countries are faced with the trouble of the deficiency of energy
resources and the incapability of saving them. Most of this energy is consumed in the cooling,
heating, and artificial ventilation of buildings. For this reason, the development of an integrated
strategy like a green facade is essential to transform buildings into structures that consume less
energy and to improve the occupants’ comfort conditions. From the perspective of the urban
landscape, the green facade can influence the quality of life in cities due to its positive effects such
as the purification of air, the absorption of carbon dioxide, and the mitigation of dust, as well as the
aesthetic and psychological aspects. Such criteria are based on the adoption of suitable orientation
for the green facade, which is the second layer of the facade in an office building with a curtain wall
as the main facade. Since the most important factor in the implementation of a green facade is the
building’s orientation, the optimum orientation could be the key factor in regards to the reduction
of energy consumption and cost and the improvement of overall energy efficiency. We used
software that helped simulate the total energy consumption, the cost, and the energy use intensity
annually and monthly. Consequently, after testing was carried out, it was proven that a green facade
as a second layer with a southeast and/or a southwest orientation results in the maximum energy
saving in a coastal city with a Mediterranean climate like Barcelona.
Keywords: vertical garden; green facade; building orientation; energy consumption; sustainability;
urban landscape; simulation software
1. Introduction
In recent decades, countries have faced plenty of issues related to energy supplies and the effects
of global warming and urban heat islands (UHIs) on energy consumption [1]. For this reason,
architects and urban planners have proposed a newer design approach, namely the sustainable
building design, to reduce the heat island effect and energy demand and minimize environmental
effects [2]. The green facade is an element of sustainable building design which is gradually gaining
popularity, and it is being applied extensively on a large scale [3,4]. Moreover, using plants in the
facade (green facade) is a bioclimatic strategy that would be effective in reducing energy
consumption in buildings, in addition to other psychological, aesthetic, and economic benefits [5].

Sustainability 2020, 12, x FOR PEER REVIEW 2 of 17
Many studies have revealed the positive effects of the adoption of the green facade in buildings and
those buildings’ orientation on energy consumption efficiency [6].
A building with the right orientation can double the efficiency of the green facade as a second
layer in the facade [1,2]. Utilizing the appropriate building orientation when applying a vertical
garden could save a lot of money as it would no longer require heating and cooling expenditure costs;
in fact, the building itself would provide a comfortable environment for occupants through energy
reduction and cost reduction [3–5]. By using a green facade, occupants can reduce heating and cooling
consumption. An extra benefit is that there is nothing that can fail or break down with a building that
has the appropriate orientation for the application of a green layer in the building’s facade; as a result,
this strategy is called “passive solar” [6] due to the almost zero maintenance costs that could be
incurred during the lifetime of the green facade. It is important to note that the choice of plants is to
be taken into account as they must be suitable for the specific orientation of the building for such a
facade to be successful. For example, a building orienting south must opt for sun-resistant plants
[7,8].
Building orientation has been one of the primary considerations within construction for
thousands of years in many cultures. One of the original references for building orientation and
passive solar principals was by Socrates about 2300 years ago [6]. “Now in houses with a south aspect,
the sun’s rays penetrate the porticos in winter, but in the summer the path of the sun is right over our
heads and above the roof so that there is shade. If then, this is the best arrangement, we should build
the south side loftier to get the winter sun and the north side lower to keep out the winter winds.”
Pérez et al. [4] summed up the green facades mechanisms when used as a passive system for
energy savings: the shadowing effect of the vegetation shields the building’s surface from solar
radiation, and vegetation also provides thermal insulation, as when the plants’ evapotranspiration
occurs, the evaporative cooling in the substrate and the effect of the wind on the building change.
Nowadays, many countries have adopted different construction methods to obtain benefits from
solar radiation and building orientations, like double skin and green facade as a second skin [2],
especially in glass facades. In fact, it was discovered that building behavior in response to solar
radiation could be changed in different climates by implementing passive solutions [9]. One way to
reinforce passive solutions in buildings is to implement a green facade as a second layer in buildings,
especially in Mediterranean climates as they would benefit the most from an environment without
artificial devices [8].
In fact, one factor that causes the growth of a building’s energy consumption is high
temperatures, because they result in intolerable cooling demand [10–16]. It is estimated that
midlatitude and temperate climates will face a significant increase in annual energy consumption
because of climate change and urban heat island (UHI) scenarios as cooling will be required in
autumn and spring as well [17,18].
The concept of building energy efficiency is related to the energy supply required which
achieves suitable environmental conditions that could allow the reduction of energy consumption
[19]. One of the best methods to reduce the cost of energy in buildings is a suitable heating and cooling
design [20]. Variables of design and construction parameters should be optimized to design energy-
efficient buildings [21]. Parameters that affect building energy requirements have been summarized
by Ekici and Aksoy [22] (Table 1).
Table 1. Parameters that determine building energy requirements [22,23].
Physical–Environmental Parameters Design Parameters
Daily outside temperature (°C)
Solar radiation (W/m2)
Wind direction and speed (m/s)
Shape factor
Transparent surface
Orientation
Thermal–physical properties of building materials
Distance between buildings
Sustainability 2020, 12, x FOR PEER REVIEW 3 of 17
In terms of urbanism, the green facade is one of the strategic implementations of urban green
infrastructure (UGI) that can help urban landscape areas to achieve temperature reductions, causing
the reduction of energy use within urban buildings, and it also has the added benefits of pollution
reduction and the improvement of habitat biodiversity [24]. In high-density cities, the green facade
could contribute to stress recovery and well-being, so the residents could benefit physiologically and
psychologically from this UGI strategy [25].
The aim of this research was to investigate the impact of building orientation for a green facade
on energy consumption. This paper presents a detailed description of the steps to take in order to
benefit from the green facade as a second layer and its optimum orientation in Passeig de Gracia,
L’Eixample area in Barcelona, Spain, by employing Autodesk Green Building Studio as a simulation
software to prove the ability of the Green Building Studio to design high-performance buildings at a
fraction of the time and cost of conventional methods [26,27].
2. Methodology
The methodology is based on the study of reducing energy consumption by applying green
facades in different orientations, which causes an effect on the building’s behavior. In addition, we
discuss different strategies and architectural solutions to understand the reduction of energy
consumption in buildings that have a green facade. Through the analysis of the previous research
which explored the performance of a green facade by using a building simulation, we concluded that
the structure and cavity depth in the application of the green facade are of great importance in regards
to energy consumption reduction. For the first part, we selected an appropriate orientation
(southeast), and we simulated a structure with different cavity depths. As a second simulation, we
tested eight buildings with different orientations and specific cavity depths to understand the
influence of different orientations on green facade performance.
To compare and observe the impact of this study, a single-skin run was added for each
simulation. This is the advantage of using Green Building Studio, as it can recreate many simulations
in one project, making it easy to compare the results in this case. The data created by the initial base
run (no changes made in Green Building Studio and applied project default) were used for tests 1 to
6 with different cavity sizes and also in tests 1 to 8 which simulated different orientations.
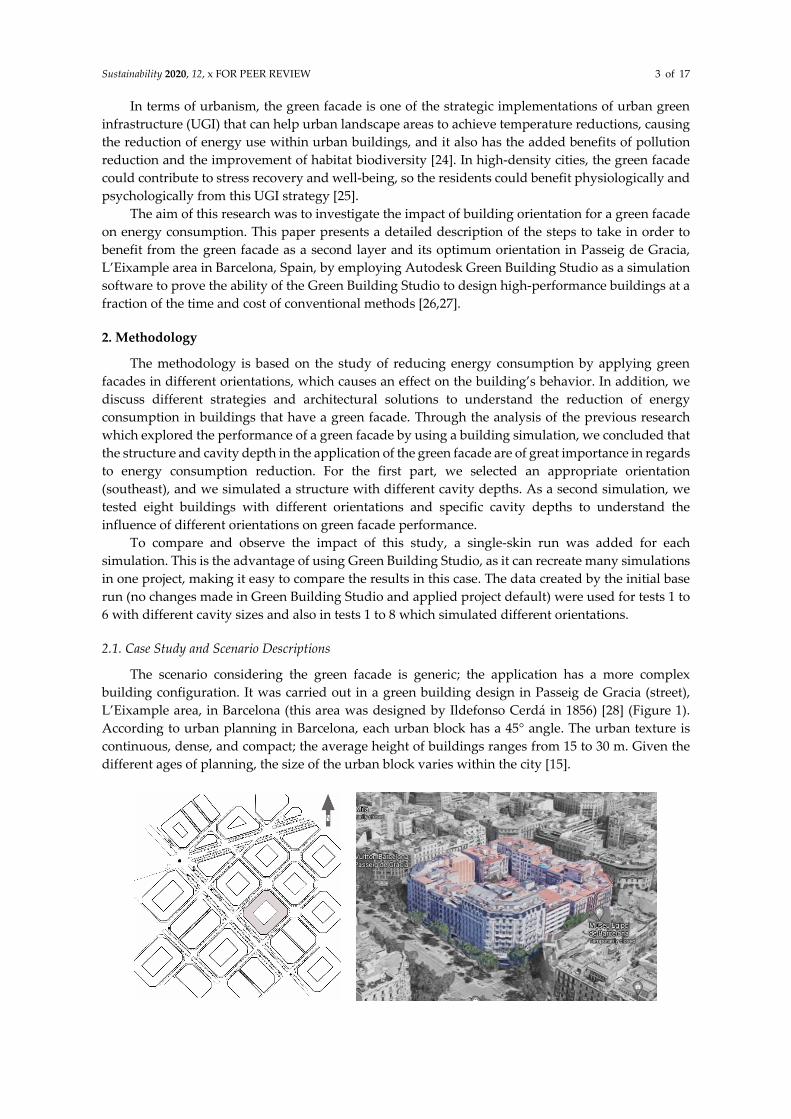
2.1. Case Study and Scenario Descriptions
The scenario considering the green facade is generic; the application has a more complex
building configuration. It was carried out in a green building design in Passeig de Gracia (street),
L’Eixample area, in Barcelona (this area was designed by Ildefonso Cerdá in 1856) [28] (Figure 1).
According to urban planning in Barcelona, each urban block has a 45° angle. The urban texture is
continuous, dense, and compact; the average height of buildings ranges from 15 to 30 m. Given the
different ages of planning, the size of the urban block varies within the city [15].
Sustainability 2020, 12, x FOR PEER REVIEW 4 of 17
Figure 1. The case study is an urban block which is located in Passeig de Gracia, L’Eixample, in
Barcelona. © By Author.
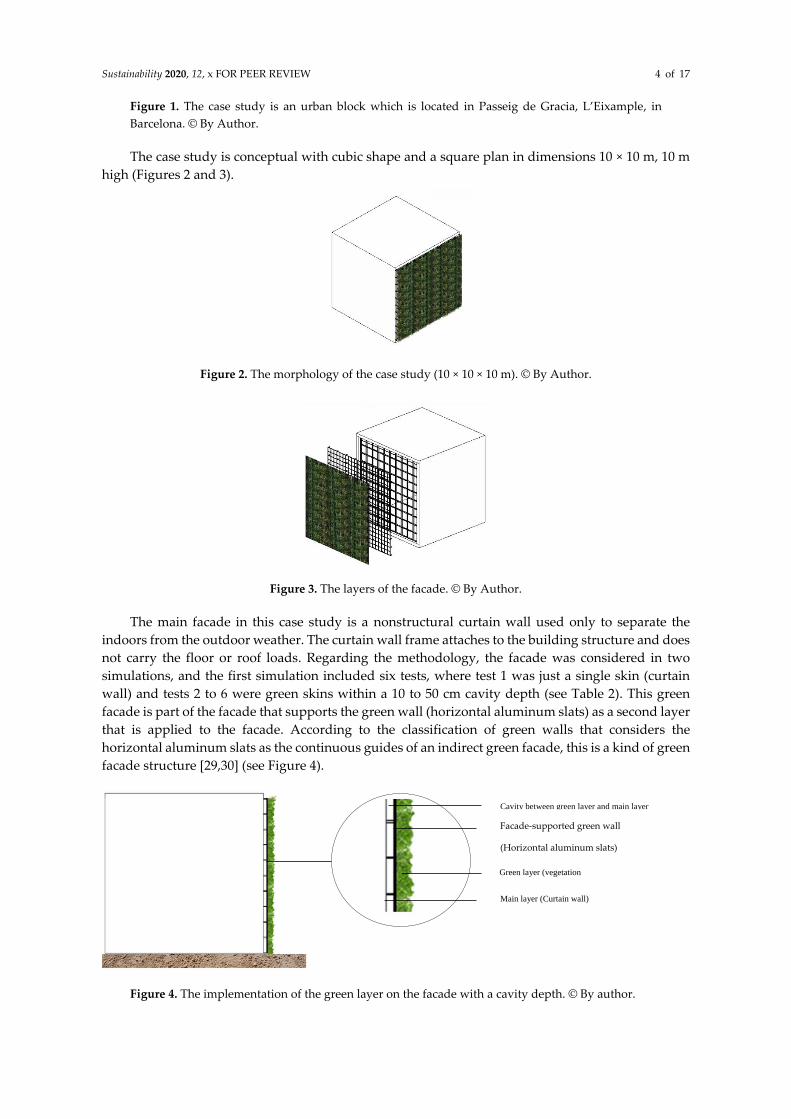
The case study is conceptual with cubic shape and a square plan in dimensions 10 × 10 m, 10 m
high (Figures 2 and 3).
Figure 2. The morphology of the case study (10 × 10 × 10 m). © By Author.
Figure 3. The layers of the facade. © By Author.
The main facade in this case study is a nonstructural curtain wall used only to separate the
indoors from the outdoor weather. The curtain wall frame attaches to the building structure and does
not carry the floor or roof loads. Regarding the methodology, the facade was considered in two
simulations, and the first simulation included six tests, where test 1 was just a single skin (curtain
wall) and tests 2 to 6 were green skins within a 10 to 50 cm cavity depth (see Table 2). This green
facade is part of the facade that supports the green wall (horizontal aluminum slats) as a second layer
that is applied to the facade. According to the classification of green walls that considers the
horizontal aluminum slats as the continuous guides of an indirect green facade, this is a kind of green
facade structure [29,30] (see Figure 4).
Figure 4. The implementation of the green layer on the facade with a cavity depth. © By author.
Cavity between green layer and main layer
Green layer (vegetation
layer) Main layer (Curtain wall)
Facade-supported green wall
(Horizontal aluminum slats)

Sustainability 2020, 12, x FOR PEER REVIEW 5 of 17
Table 2. The number of simulations with the same orientation but different sizes of the cavity depth.
© By author.
Test
Facade Type
Cavity Building
Orientation Facade Structure Single
Layer
Second
Layer
1
Single-
skin
facade
- 0 Southeast Curtain wall (main facade)
2 - Green-skin
facade 10 cm Southeast
Facade-supported green wall
(horizontal aluminum slats)
3 - Green-skin
facade 20 cm Southeast
Facade-supported green wall
(horizontal aluminum slats)
4 - Green-skin
facade 30 cm Southeast
Facade-supported green wall
(horizontal aluminum slats)
5 - Green-skin
facade 40 cm Southeast
Facade-supported green wall
(horizontal aluminum slats)
6 - Green-skin
facade 50 cm Southeast
Facade-supported green wall
(horizontal aluminum slats)
3. Results
The results are divided into two parts. The first section shows the energy consumed within the
different sizes of the cavity in the green layer of the facade. The second section presents simulation
results for energy consumed in different orientations through eight tests.
3.1. Analysis of the Energy Consumed with Different Cavity Depth Sizes in the Green Layer in Facade
By using the simulation program, the energy consumption was studied and analyzed for each
of the five different cavities in the green facade and compared with the single-skin facade (curtain
wall) as the main facade with a southeast orientation in L’Eixample area of Barcelona throughout one
year, as shown in Table 3.
Table 3. Comparison of energy consumption with different cavity depths in southeast orientation. ©
By author.
Name
Floor
Area
(m2)
Energy Use
Intensity
(MJ/m2/year)
Electric
Cost
(/kWh)
Fuel
Cost
(/MJ)
Total Annual Cost Total Annual Energy
Electric Fuel Energy Electric
(kWh)
Fuel
(MJ)
Carbon
Emissions
(Mg)
Green Skin
50cm Cavity 91 1,063.4 € 0.13 € 0.01 € 1,675 € 568 € 2,243 13,397 48,897 --
Green Skin
40cm Cavity 91 1,063.6 € 0.13 € 0.01 € 1,644 € 579 € 2,223 13,150 49,811 --
Green Skin
30cm Cavity 91 1,064.7 € 0.13 € 0.01 € 1,668 € 572 € 2,240 13,342 49,216 --
Green Skin
20cm Cavity 91 1,045.6 € 0.13 € 0.01 € 1,613 € 570 € 2,183 12,901 49,063 --
Green Skin
10cm Cavity 91 1,053.1 € 0.13 € 0.01 € 1,602 € 582 € 2,184 12,817 50,045 --
Single Skin 91 1,081.3 € 0.13 € 0.01 € 2,247 € 396 € 2,643 17,974 34,062 --

Sustainability 2020, 12, x FOR PEER REVIEW 6 of 17
Table 3 shows that the optimum cavity size for this orientation (southeast) was 20 cm because it
reduced the total energy cost (annual), the energy use intensity (EUI), and the total annual electricity
use. However, fuel consumption was increased because of the decreased effect of sunlight due to the
covering of the facade with the vegetation. Nevertheless, it should be noted that nowadays most
heating and cooling devices, as well as lighting and air conditioning systems, use electrical energy.
As a result, reducing electricity consumption is the most effective way to reduce energy consumption.
3.2. Analysis of the Energy Consumed in Different Orientations
After analyzing the first simulation (analysis of the energy consumed with different cavity depth
sizes in the green layer of the facade), a 20 cm cavity depth size was chosen for the second simulation.
In this section, we simulated the green facade building in different orientations with a 20 cm cavity
depth (Table 4). As can be seen in Table 4, the building consumed more electricity for cooling in July,
August, and September than in other months, and, by applying a green layer on the facade, the usage
of electricity was reduced in all cases but the amount of reduction was different depending on the
building’s orientation. The most important data extracted from the simulation software were cooling
and heating consumption; other energy consumption indicators like pumping or boiling water were
not relevant for this research.
Table 4. Energy consumption comparison between a single-skin facade (curtain wall) and a green-
skin facade in different orientations. © By author.
Building
Orientation
Monthly Data
Total Energy (Single-Skin Facade) Total Energy (Green-Skin Facade)
Test 1: South
Test 2: Southeast

Sustainability 2020, 12, x FOR PEER REVIEW 7 of 17
Test 3:
Southwest
Test 4: East
Test 5: North
Test 6:
Northeast
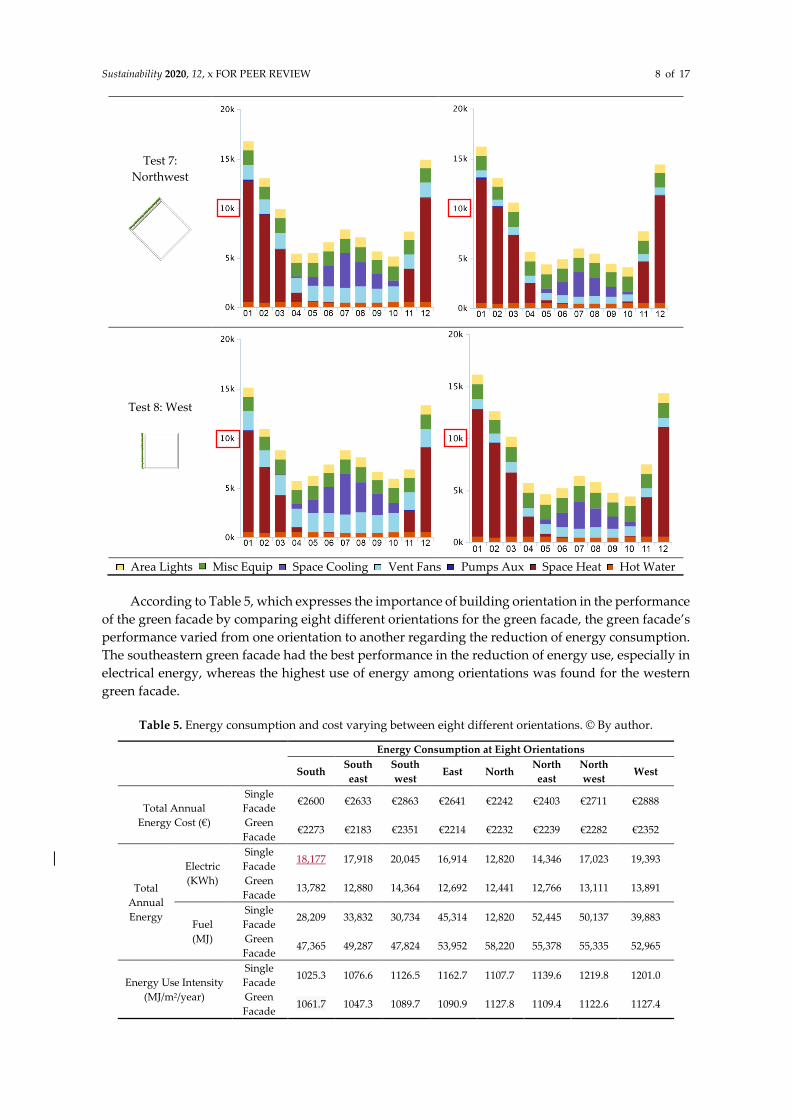
Sustainability 2020, 12, x FOR PEER REVIEW 8 of 17
Test 7:
Northwest
Test 8: West
Area Lights Misc Equip Space Cooling Vent Fans Pumps Aux Space Heat Hot Water
According to Table 5, which expresses the importance of building orientation in the performance
of the green facade by comparing eight different orientations for the green facade, the green facade’s
performance varied from one orientation to another regarding the reduction of energy consumption.
The southeastern green facade had the best performance in the reduction of energy use, especially in
electrical energy, whereas the highest use of energy among orientations was found for the western
green facade.
Table 5. Energy consumption and cost varying between eight different orientations. © By author.
Energy Consumption at Eight Orientations
South South
east
South
west East North
North
east
North
west West
Total Annual
Energy Cost (€)
Single
Facade €2600 €2633 €2863 €2641 €2242 €2403 €2711 €2888
Green
Facade €2273 €2183 €2351 €2214 €2232 €2239 €2282 €2352
Total
Annual
Energy
Electric
(KWh)
Single
Facade 18,177 17,918 20,045 16,914 12,820 14,346 17,023 19,393
Green
Facade 13,782 12,880 14,364 12,692 12,441 12,766 13,111 13,891
Fuel
(MJ)
Single
Facade 28,209 33,832 30,734 45,314 12,820 52,445 50,137 39,883
Green
Facade 47,365 49,287 47,824 53,952 58,220 55,378 55,335 52,965
Energy Use Intensity
(MJ/m2/year)
Single
Facade 1025.3 1076.6 1126.5 1162.7 1107.7 1139.6 1219.8 1201.0
Green
Facade 1061.7 1047.3 1089.7 1090.9 1127.8 1109.4 1122.6 1127.4
Sustainability 2020, 12, x FOR PEER REVIEW 9 of 17
By considering the simulation of a green building in different orientations performed in this
paper, it can be determined that the green facade’s performance in regards to energy reduction results
in different outcomes when angled at different orientations (Table 6). The northern and western green
facades had a shortage of sun radiance, reducing the electrical use slightly and thus causing the use
of energy for heating during winter and part of autumn and spring to not be sustainable. Such
orientations obtain minimal performance of the green facade. In contrast, the total annual electrical
consumption and cost in green facade buildings facing a southwest and/or a southeast orientation
dropped significantly; this was thanks to solar energy, which has proven very effective for the green
facade, that was captured by such orientations. These orientations use the maximum ability of the
green facade for energy consumption, which can also be called passive energy. The green facade also
provides shade, which reduces the use of cooling devices during hot weather; the second layer also
protects the building during the cold weather and wind, consequently causing a change of building
behavior.
Table 6. Annual electric and fuel end-use comparison between two types of facade (green and single
skin) in eight different orientations. © By author.
Annual Electric End-Use Annual Fuel End-Use
HVAC Lights Other HVAC Other
1 South Single Skin 54.3% 18.0% 27.7% 77.2% 22.8%
Green Skin 39.8% 23.7% 36.5% 86.4% 13.6%
2 Southeast Single Skin 53.7% 18.2% 28.1% 81.0% 19.0%
Green Skin 35.5% 25.4% 39.1% 87.0% 13.0%
3 Southwest Single Skin 58.6% 16.3% 25.1% 79.1% 20.9%
Green Skin 42.2% 22.8% 35.0% 86.6% 13.4%
4 East Single Skin 50.9% 19.3% 29.8% 85.8% 14.2%
Green Skin 34.6% 25.7% 39.7% 88.1% 11.9%
5 North Single Skin 35.2% 25.5% 39.3% 88.3% 11.7%
Green Skin 33.3% 26.3% 40.5% 89.0% 11.0%
6 Northeast Single Skin 42.1% 22.8% 35.1% 87.8% 12.2%
Green Skin 35.0% 25.6% 39.4% 88.4% 11.6%
7 Northwest Single Skin 51.2% 19.2% 29.6% 87.2% 12.8%
Green Skin 36.7% 24.9% 38.4% 88.4% 11.6%
8 West Single Skin 57.2% 16.9% 26.0% 83.9% 16.1%
Green Skin 40.2% 23.5% 36.2% 87.9% 12.1%
Here, it is shown that all orientations represent the different performances of the green facade
in energy consumption. The results of the second simulation are divided into eight tests below, and
an annual electric end-use and fuel end-use comparison is made between a single skin (main facade
that is the curtain wall) and a green skin (as a second layer that is vegetation) for each test.
Test 1: South Orientation
In the south green facade, annual electricity consumption decreased by about 24%. Energy use
intensity (EUI) in the southern green facade increased by about 36.5 MJ/m2/year, and the total annual
energy cost decreased by approximately 12.5% (Figures 5 and 6).

Sustainability 2020, 12, x FOR PEER REVIEW 10 of 17
Figure 5. Annual electric and fuel end-use for HVAC, lights, and other (miscellaneous equipment) in
the southern green facade. © By author.
Figure 6. Annual electric and fuel end-use for HVAC, lights, and other (miscellaneous equipment) in
the southern single facade. © By author.
Test 2: Southeast Orientation
In the southeast green facade, annual electric consumption was reduced by about 28%. The total
annual energy cost decreased by approximately 17%, and energy use intensity (EUI) in the southeast
green facade decreased by 29.4 MJ/m2/year (Figures 7 and 8).
Figure 7. Annual electric and fuel end-use for HVAC, lights, and other (miscellaneous equipment) in
the southeast green facade. © By author.

Sustainability 2020, 12, x FOR PEER REVIEW 11 of 17
Figure 8. Annual electric and fuel end-use for HVAC, lights, and other (miscellaneous equipment) in
the southeast single facade. © By author.

Sustainability 2020, 12, x FOR PEER REVIEW 12 of 17
Test 3: Southwest Orientation
The southwest green facade showed a 71.2% reduction of annual electrical use. The total annual
energy cost was reduced by approximately 17.9%, and energy use intensity (EUI) in this orientation
decreased 36.8 MJ/m2/year (Figures 9 and 10).
Figure 9. Annual electric and fuel end-use for HVAC, lights, and other (miscellaneous equipment) in
the southwest green facade. © By author.
Figure 10. Annual electric and fuel end-use for HVAC, lights, and other (miscellaneous equipment)
in the southwest single facade. © By author.
Test 4: East Orientation
For the eastern green facade, annual electricity consumption decreased by about 25%. Energy
use intensity (EUI) in the east green facade fell by about 71.8 MJ/m2/year, and the total annual energy
cost decreased by approximately 16% (Figures 11 and 12).
Figure 11. Annual electric and fuel end-use for HVAC, lights, and other (miscellaneous equipment)
in the eastern green facade. © By author.
Sustainability 2020, 12, x FOR PEER REVIEW 13 of 17
Figure 12. Annual electric and fuel end-use for HVAC, lights, and other (miscellaneous equipment)
in the eastern single facade. © By author.
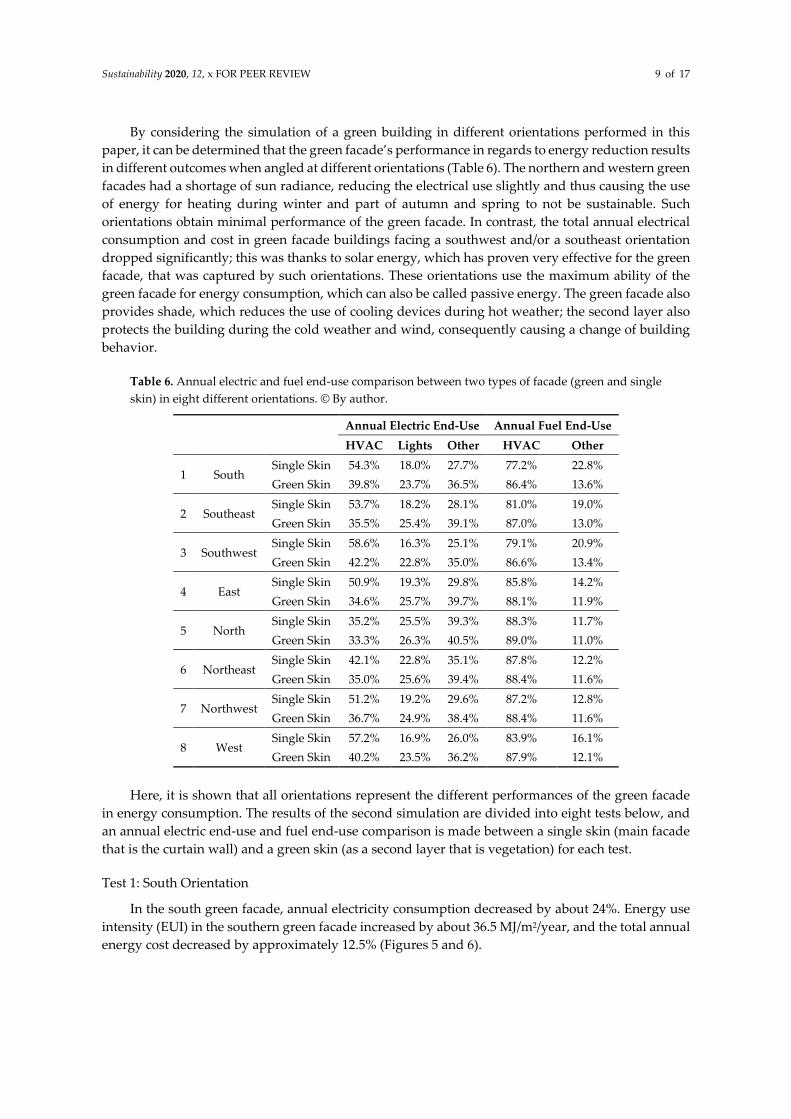
Test 5: North Orientation
In the north green facade, annual electricity consumption decreased by about 3%. Energy use
intensity (EUI) in the north green facade fell by about 20.1 MJ/m2/year, and the total annual energy
cost was reduced by just about 0.5% (Figures 13 and 14).
Figure 13. Annual electric and fuel end-use for HVAC, lights, and other (miscellaneous equipment)
in the northern green facade. © By author.
Figure 14. Annual electric and fuel end-use for HVAC, lights, and other (miscellaneous equipment)
in the northern single facade. © By author.
Sustainability 2020, 12, x FOR PEER REVIEW 14 of 17
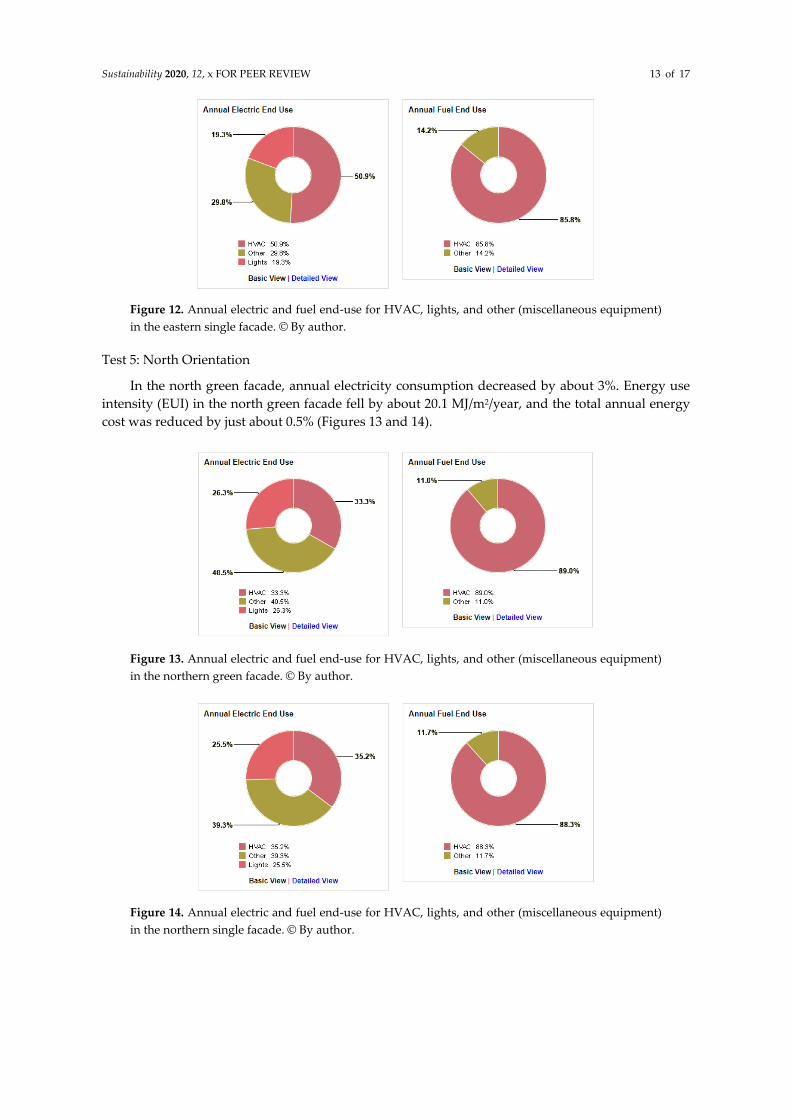
Test 6: Northeast Orientation
In the northeast green facade, annual electricity use was reduced by about 11%. The total annual
energy cost was decreased by just about 7%, and energy use intensity (EUI) in the northeast green
facade fell by about 30 MJ/m2/year (Figures 15 and 16).
Figure 15. Annual electric and fuel end-use for HVAC, lights, and other (miscellaneous equipment)
in the northeast green facade. © By author.
Figure 16. Annual electric and fuel end-use for HVAC, lights, and other (miscellaneous equipment)
in the northeast single facade. © By author.
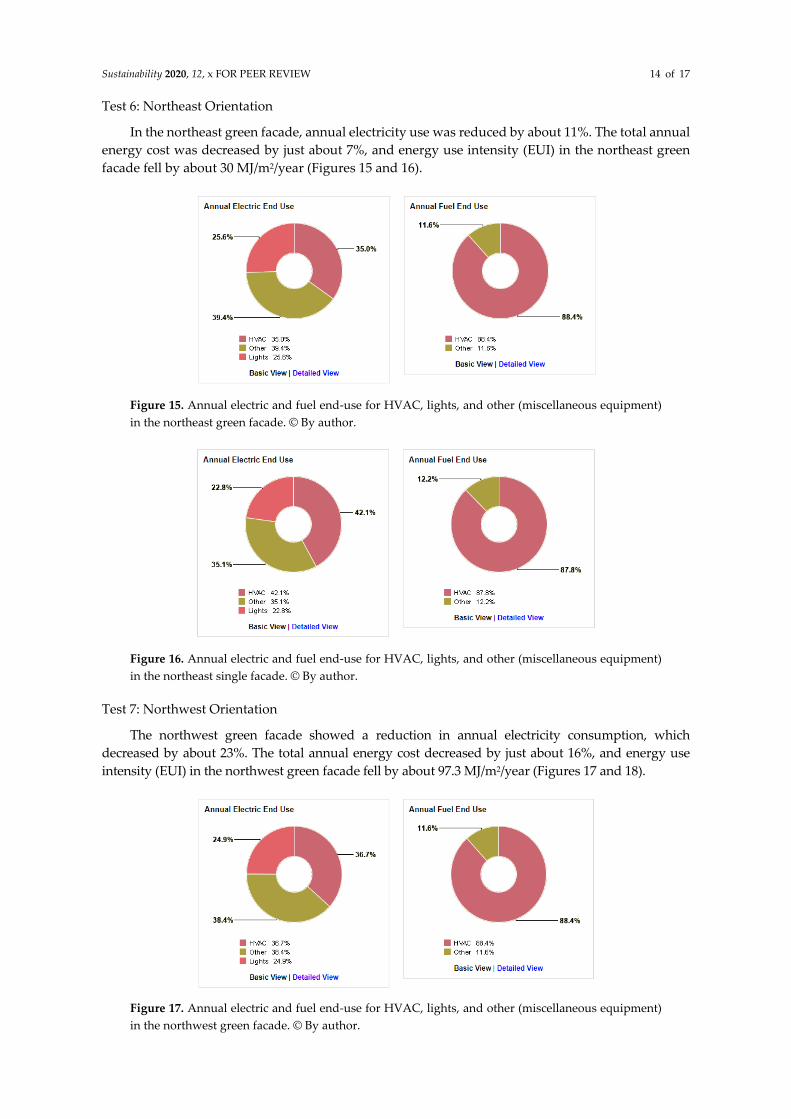
Test 7: Northwest Orientation
The northwest green facade showed a reduction in annual electricity consumption, which
decreased by about 23%. The total annual energy cost decreased by just about 16%, and energy use
intensity (EUI) in the northwest green facade fell by about 97.3 MJ/m2/year (Figures 17 and 18).
Figure 17. Annual electric and fuel end-use for HVAC, lights, and other (miscellaneous equipment)
in the northwest green facade. © By author.

Sustainability 2020, 12, x FOR PEER REVIEW 15 of 17
Figure 18. Annual electric and fuel end-use for HVAC, lights, and other (miscellaneous equipment)
in the northwest single facade. © By author.
Test 8: West Orientation
In the west green facade, annual electricity use decreased by about 28.3%. The total annual
energy cost was reduced by about 18.5%, and energy use intensity (EUI) fell by about 73.6 MJ/m2/year
(Figures 19 and 20).
Figure 19. Annual electric and fuel end-use for HVAC, lights, and other (miscellaneous equipment)
in the west green facade. © By author.
Figure 20. Annual electric and fuel end-use for HVAC, lights, and other (miscellaneous equipment)
in the west single facade. © By author.

Sustainability 2020, 12, x FOR PEER REVIEW 16 of 17
4. Conclusions
These results confirm that building orientation, as well as the geographical location and its
climate, is a basic requirement for the green facade. It is important to consider the solar radiation
quantity that the green facade receives, as it affects the thermal load and controls the thermal behavior
and the amount of thermal comfort of the space [31]. In this study, green facades as a second layer
were found to change the building behavior in response to solar radiation. This means that in the
summer, as well as spring and autumn, occupants could cut down their use of electricity for cooling,
therefore allowing the total energy consumption to be reduced significantly. As mentioned in the
discussion, according to the simulation of the green facade in different orientations, the northern-
and western-orientated green facades’ performances were lower than those of facades in other
orientations, while the southeast- and southwest-orientated green facades’ performances were
remarkable as their energy consumption was reduced by about 28%. Furthermore, for the southeast
orientation, the total annual energy cost decreased by about 28%; for the southwest orientation, this
decrease was 18%. In addition, the selection of an appropriate orientation for the green facade can
affect the quantity of ventilation across the inside of the building, which consequentially affects the
quantity of energy consumed.
Author Contributions: Conceptualization, F.B.M. and I.N.D.; methodology, F.B.M. and I.N.D.; software, F.B.M.;
validation, J.M.F.M, I.N.D., and E.R.D.; formal analysis, F.B.M.; investigation, F.B.M.; resources, F.B.M.; data
curation, F.B.M.; writing—original draft preparation, F.B.M.; writing—review and editing, F.B.M., J.M.F.M,
I.N.D., and A.B.Y.; visualization, F.B.M.; supervision, J.M.F.M and I.N.D.; project administration, F.B.M.; funding
acquisition, E.R.D. All authors have read and agreed to the published version of the manuscript.
Funding: This research was supported by the National Program of Research, Development and Innovation
aimed to the Society Challenges with the references BIA2016-77464-C2-1-R & BIA2016-77464-C2-2-R, both of the
National Plan for Scientific Research, Development and Technological Innovation 2013-2016, Government of
Spain, titled “Gamificación para la enseñanza del diseño urbano y la integración en ella de la participación
ciudadana (ArchGAME4CITY)” and “Diseño Gamificado de visualización 3D con sistemas de realidad virtual
para el estudio de la mejora de competencias motivacionales, sociales y espaciales del usuario
(EduGAME4CITY)”; (AEI/FEDER, UE).
Conflicts of Interest: The authors declare no conflict of interest.
References
1. Krstić-Furundžić, A.; Vujosevic, M.; Petrovski, A. Energy and environmental performance of the office
building facade scenarios. Energy 2019, 183, 437–447, doi:10.1016/j.energy.2019.05.231.
2. Pérez, G.; Coma, J.; Sol, S.; Cabeza, L.F. Green facade for energy savings in buildings: The influence of leaf
area index and facade orientation on the shadow effect. Appl. Energy 2017, 187, 424–437,
doi:10.1016/j.apenergy.2016.11.055.
3. Perini, K.; Rosasco, P. Cost-benefit analysis for green façades and living wall systems. Build. Environ. 2013,
70, 110–121, doi:10.1016/j.buildenv.2013.08.012.
4. Pérez, G.; Rincón, L.; Vila, A.; González, J.M.; Cabeza, L.F. Green vertical systems for buildings as passive
systems for energy savings. Appl. Energy 2011, 88, 4854–4859, doi:10.1016/j.apenergy.2011.06.032.
5. Hunter, A.M.; Williams, N.S.; Rayner, J.P.; Aye, L.; Hes, D.; Livesley, S.J. Quantifying the thermal
performance of green façades: A critical review. Ecol. Eng. 2014, 63, 102–113,
doi:10.1016/j.ecoleng.2013.12.021.
6. Kahn, H, C. Philosophy Before Socrates; 1997; In Ancient Philosophy (Volume 17, Issue 1).
7. Wong, I.; Baldwin, A.N. Investigating the potential of applying vertical green walls to high-rise residential
buildings for energy-saving in sub-tropical region. Build. Environ. 2016, 97, 34–39,
doi:10.1016/j.buildenv.2015.11.028.
8. Perez, G.; Rincon, L.; Vila, A.J.; Gonzalez, J.; Cabeza, L.F. Behaviour of green facades in Mediterranean
Continental climate. Energy Convers. Manag. 2011, 52, 1861–1867, doi:10.1016/j.enconman.2010.11.008.
9. Othman, A.R.; Sahidin, N. Vertical Greening Façade as Passive Approach in Sustainable Design. Proc. Soc.
Behav. Sci. 2016, 222, 845–854, doi:10.1016/j.sbspro.2016.05.185.
Sustainability 2020, 12, x FOR PEER REVIEW 17 of 17
10. Akbari, H.; Bretz, S.; Kurn, D.M.; Hanford, J. Peak power and cooling energy savings of high-albedo roofs.
Energy Build. 1997, 25, 117–126, doi:10.1016/s0378-7788(96)01001-8.
11. Rosenfeld, A.H.; Bretz, S. Mitigation of Urban Heat Islands: Materials, Utility Program, Updates ; 1993.
12. Rosenfeld, A.H.; Akbari, H.; Romm, J.J.; Pomerantz, M. Cool communities: strategies for heat island
mitigation and smog reduction.Pdf, 1997.
13. De la Flor, F.S.; Domínguez, S.A. Modelling microclimate in urban environments and assessing its influence
on the performance of surrounding buildings. Energy Build. 2004, 36, 403–413,
doi:10.1016/j.enbuild.2004.01.050.
14. Hassid, S.; Santamouris, M.; Papanikolaou, N.; Linardi, A.; Klitsikas, N.; Georgakis, C.; Assimakopoulos,
D. Effect of the Athens heat island on air conditioning load. Energy Build. 2000, 32, 131–141,
doi:10.1016/s0378-7788(99)00045-6
15. Salvati, A.; Roura, H.C.; Cecere, C. Assessing the urban heat island and its energy impact on residential
buildings in Mediterranean climate: Barcelona case study. Energy Build. 2017, 146, 38–54,
doi:10.1016/j.enbuild.2017.04.025.
16. Sun, Y.; Augenbroe, G. Urban heat island effect on energy application studies of office buildings. Energy
Build. 2014, 77, 171–179, doi:10.1016/j.enbuild.2014.03.055.
17. Invidiata, A.; Ghisi, E. Impact of climate change on heating and cooling energy demand in houses in Brazil.
Energy Build. 2016, 130, 20–32, doi:10.1016/j.enbuild.2016.07.067.
18. Crawl, D.B. Estimating the impacts of climate change and urbanization on building performance. J. Build.
Perform. Simul. 2008, 1, 91–115, doi:10.1080/19401490802182079.
19. Omer, A.M. Energy, environment and sustainable development. Renew. Sustain. Energy Rev. 2008, 12, 2265–
2300, doi:10.1016/j.rser.2007.05.001.
20. Omer, A.M. Renewable building energy systems and passive human comfort solutions. Renew. Sustain.
Energy Rev. 2008, 12, 1562–1587, doi:10.1016/j.rser.2006.07.010.
21. Feng, Y. Thermal design standards for energy efficiency of residential buildings in hot summer/cold winter
zones. Energy Build. 2004, 36, 1309–1312, doi:10.1016/j.enbuild.2003.08.003.
22. Ekici, B.B.; Aksoy, U.T. Prediction of building energy needs in early stage of design by using ANFIS. Expert
Syst. Appl. 2011, 38, 5352–5358, doi:10.1016/j.eswa.2010.10.021.
23. Pacheco, R.; Ordóñez, J.; Martínez, G. Energy efficient design of building: A. review. Renew. Sustain. Energy
Rev. 2012, 16, 3559–3573, doi:10.1016/j.rser.2012.03.045.
24. Norton, B.A.; Coutts, A.M.; Livesley, S.J.; Harris, R.J.; Hunter, A.M.; Williams, N.S.G. Planning for cooler
cities: A framework to prioritise green infrastructure to mitigate high temperatures in urban landscapes.
Landsc. Urban. Plan. 2015, 134, 127–138, doi:10.1016/j.landurbplan.2014.10.018.
25. Elsadek, M.; Liu, B.; Lian, Z. Green façades: Their contribution to stress recovery and well-being in high-
density cities. Urban. For. Urban. Green. 2019, 46, 126446, doi:10.1016/j.ufug.2019.126446.
26. Aljundi, K.; Pinto, A.; Rodrigues, F. Energy Analysis Using Cooperation Between Bim Tools (Revit and
Green Building Studio) and Energy Plus. In Proceedings of the 1º Congresso Português de Building
Information Modelling, Guimaraes, Portugal, 24–25 November 2016; pp. 309–319,
27. Luziani, S.; Paramita, B. Autodesk Green Building Studio an Energy Simulation Analysis in the Design
Process. KnE Soc. Sci. 2019, 735–749, doi:10.18502/kss.v3i21.5007.
28. Neuman, M. Centenary paper: Ildefons Cerdà and the future of spatial planning: The network urbanism
of a city planning pioneer. Town Plan. Rev. 2011, 82, 117–144, doi:10.3828/tpr.2011.10.
29. Bustami, R.A.; Belusko, M.; Ward, J.; Beecham, S. Vertical greenery systems: A systematic review of
research trends. Build. Environ. 2018, 146, 226–237, doi:10.1016/j.buildenv.2018.09.045.
30. Manso, M.; Castro-Gomes, J. Green wall systems: A review of their characteristics. Renew. Sustain. Energy
Rev. 2015, 41, 863–871, doi:10.1016/j.rser.2014.07.203.
31. Ashmawy, R.E.; Azmy, N.Y. Buildings Orientation and its Impact on the Energy Consumption. Acad. Res.
Community Publ. 2018, 2, 35, doi:10.21625/archive.v2i3.344.
© 2020 by the authors. Submitted for possible open access publication under the terms
and conditions of the Creative Commons Attribution (CC BY) license
(http://creativecommons.org/licenses/by/4.0/).