BACHILLERATO - Fundación PROCLADE | ONGD, … · existe una gran brecha digital, que divide y...
24
2012 2013 BACHILLERATO TUTORÍA
Transcript of BACHILLERATO - Fundación PROCLADE | ONGD, … · existe una gran brecha digital, que divide y...

2012 2013
BACHILLERATOTUTORÍA
BACHILLERATO 2012 2013
2TUTORÍA
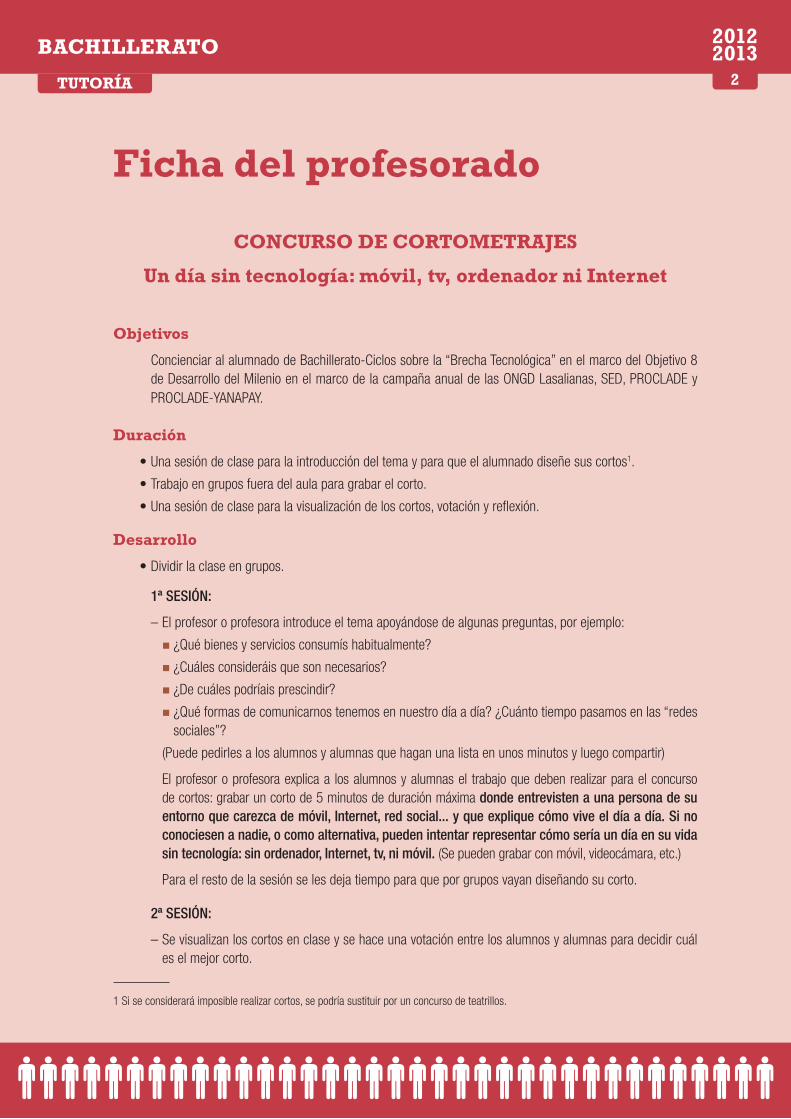
Ficha del profesorado
CONCURSO DE CORTOMETRAJES
Un día sin tecnología: móvil, tv, ordenador ni Internet
Objetivos
Concienciar al alumnado de Bachillerato-Ciclos sobre la “Brecha Tecnológica” en el marco del Objetivo 8 de Desarrollo del Milenio en el marco de la campaña anual de las ONGD Lasalianas, SED, PROCLADE y PROCLADE-YANAPAY.
Duración
•Una sesión de clase para la introducción del tema y para que el alumnado diseñe sus cortos1.
•Trabajo en grupos fuera del aula para grabar el corto.
•Una sesión de clase para la visualización de los cortos, votación y reflexión.
Desarrollo
•Dividir la clase en grupos.
1ª SESIÓN:
– El profesor o profesora introduce el tema apoyándose de algunas preguntas, por ejemplo:
nn ¿Qué bienes y servicios consumís habitualmente?
nn ¿Cuáles consideráis que son necesarios?
nn ¿De cuáles podríais prescindir?
nn ¿Qué formas de comunicarnos tenemos en nuestro día a día? ¿Cuánto tiempo pasamos en las “redes sociales”?
(Puede pedirles a los alumnos y alumnas que hagan una lista en unos minutos y luego compartir)
El profesor o profesora explica a los alumnos y alumnas el trabajo que deben realizar para el concurso de cortos: grabar un corto de 5 minutos de duración máxima donde entrevisten a una persona de su entorno que carezca de móvil, Internet, red social... y que explique cómo vive el día a día. Si no conociesen a nadie, o como alternativa, pueden intentar representar cómo sería un día en su vida sin tecnología: sin ordenador, Internet, tv, ni móvil. (Se pueden grabar con móvil, videocámara, etc.)
Para el resto de la sesión se les deja tiempo para que por grupos vayan diseñando su corto.
2ª SESIÓN:
– Se visualizan los cortos en clase y se hace una votación entre los alumnos y alumnas para decidir cuál es el mejor corto.
1 Si se considerará imposible realizar cortos, se podría sustituir por un concurso de teatrillos.
BACHILLERATO 2012 2013
3TUTORÍA
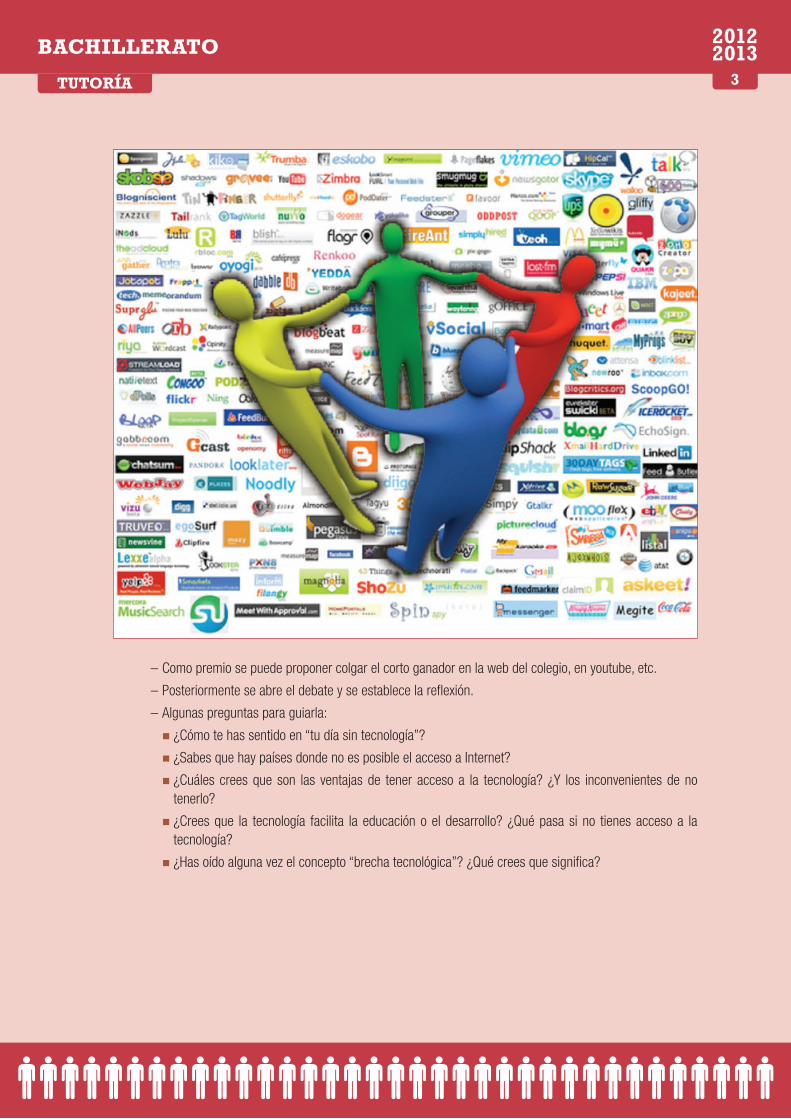
– Como premio se puede proponer colgar el corto ganador en la web del colegio, en youtube, etc.
– Posteriormente se abre el debate y se establece la reflexión.
– Algunas preguntas para guiarla:
nn ¿Cómo te has sentido en “tu día sin tecnología”?
nn ¿Sabes que hay países donde no es posible el acceso a Internet?
nn ¿Cuáles crees que son las ventajas de tener acceso a la tecnología? ¿Y los inconvenientes de no tenerlo?
nn ¿Crees que la tecnología facilita la educación o el desarrollo? ¿Qué pasa si no tienes acceso a la tecnología?
nn ¿Has oído alguna vez el concepto “brecha tecnológica”? ¿Qué crees que significa?
2012 2013
BACHILLERATOCIENCIAS PARA EL MUNDO
CONTEMPORÁNEO
BACHILLERATO 2012 2013
5CIENCIAS PARA EL MUNDO CONTEMPORÁNEO
Ficha del profesorado
Competencias básicas
Se presenta el desarrollo temporal de las actividades propuestas. Todas ellas tienen en su ejecución algún momento de uso de la red, por lo que se puede aprovechar en cualquier momento para hacer una reflexión sobre el meta aprendizaje que actividades como las propuestas necesitan del uso de acceso a la información.
A partir de las indicaciones metodológicas que se dan en estas páginas cada profesor o profesora puede preparar los soportes que considere más adecuados para presentar a sus alumnos y alumnas. En la mayoría de las actividades, que están soportadas en la búsqueda de información en la red, la guía del docente puede ser suficiente para que el alumnado siga las actividades propuestas aunque se recomienda implementar algún soporte concreto para seguirlas por parte del alumno o alumna.
ACTIVIDAD 1.¿DE DÓNDE VIENE Y HACIA DONDE VA?
Objetivos
•Conocer situación geográfica de empresas, productores y materia prima utilizada en la tecnología.
•Hacer aflorar una primera sensibilidad respecto al reparto desigual de beneficios económicos, explotación laboral y ambiental así como otras desigualdades.
•Reflexionar acerca del ciclo de vida de los productos tecnológicos y la necesidad de recambio anticipado de los mismos.
Comentarios metodológicos.
Actividad inicial EXPLORATORIA.
Esta actividad pretende hacer aflorar las ideas previas de los alumnos y alumnas en relación a la producción de tecnología, origen de las materias primas utilizadas y en qué países se quedan los beneficios. Se explorará la localización de las fábricas, el origen de las multinacionales y de las materias primas utilizadas mediante una búsqueda compartida en Internet.
¿Qué marcas de tecnología conoces? ¿Y de telefonía móvil? Selecciona 5 de estas marcas y averigua el origen de la empresa, qué niveles de facturación o de beneficios tienen estas compañías.
Si nos centramos en la producción de algunos productos de tecnología (televisión, teléfono móvil) investiga de las siguientes compañías en que países están las fábricas de estos productos así como las centrales de decisión.
SAMSUNG, APPLE, NOKIA, SONY, PHILIPS.
En la siguiente página de Apple, encontrarás información respecto a la vida útil de sus productos así como las materias primas que se usan para fabricarlos. Identifica de qué países pueden venir estas materias primas.
www.apple.com/es/environment/

BACHILLERATO 2012 2013
6CIENCIAS PARA EL MUNDO CONTEMPORÁNEO
La propuesta metodológica es un trabajo colaborativo, repartiendo la búsqueda de información, quedando ésta reflejada en un mismo medio accesible a todos los alumnos y alumnas. El profesor o profesora actúa como guía de la actividad, asesorando en las diferentes dudas que puedan aparecer. Es importante que ayude.
Material
Ordenadores con conexión a Internet. Si el volcado de la información se realiza sobre mapamundi en soporte papel se necesitará uno así como algún medio de marcado de los países (tres colores). Se propone la gene-ración de un mapamundi en soporte electrónico mediante alguna de las aplicaciones de trabajo colaborativo (google docs, ).
Temporalización
1 sesión de 1 hora.
Trabajo intersesión (se puede convertir en una de las sesiones en aula)
Se propone que entre las dos actividades se realice un visionado del documental. «Coltan, sangre en nuestros móviles» (accesible en diferentes sites en la red). A modo de preparación de la siguiente sesión los alumnos y alumnas pueden preparar 5 preguntas/aspectos que les hayan sorprendido sobre el documental visto.
ACTIVIDAD 2. BRECHA DIGITAL
Objetivos
•Interiorizar por parte del alumnado el uso de tecnologías, móviles o no, en el día a día y que representaría para ellos no tener acceso a las mismas.
•Conocer la realidad de la brecha tecnológica y digital entre Norte y Sur.
BACHILLERATO 2012 2013
7CIENCIAS PARA EL MUNDO CONTEMPORÁNEO
Comentarios metodológicos
2.1. La sesión puede empezar con una breve revisión del visionado del documental. En especial comentar en gran grupo aquellas dudas/preguntas/sensaciones que les ha provocado ver el documental «Coltan, sangre en los móviles».
2.2. El resto de la sesión se puede realizar un comentario en grupo dirigido por el docente, mediante el aná-lisis de datos expuestos por el profesor o profesora mediante una proyección. La sesión debe buscar el comentario por parte del alumnado, debe interpelar a su capacidad de análisis para acabar la sesión con el concepto de brecha digital asumida y soportada en evidencias.
En la actualidad solo el 11% de la población mundial tiene acceso a Internet y el 90% de las personas co-nectadas viven en países desarrollados. Aunque se suele hablar de la sociedad mundial de la información, existe una gran brecha digital, que divide y separa a las personas con acceso o no a las Tecnologías de la Información y la Comunicación.
En el material se adjunta una presentación con datos e imágenes relacionados con la brecha digital.
Trabajo intersesión
Se encarga a los alumnos y alumnas responder a las siguientes preguntas:
a. ¿Qué es la brecha digital? ¿De qué factores depende?
b. Indica cómo influyen en la brecha digital los siguientes factores: los recursos económicos, la geografía, la edad, el sexo, el idioma, el empleo, las limitaciones físicas o discapacidades.
c. ¿Qué factores son más determinantes a la hora de ahondar la brecha digital?
d. ¿Qué cauces de solución se te ocurren para superarlos?
e. El DOI (siglas en inglés del Índice de Oportunidad Digital) mide la brecha digital en función de once indi-cadores.
Indica y analiza dichos indicadores sabiendo que a menor índice mayor brecha.
Material
Ordenador con conexión a Internet, proyector.
Temporalización
2.1. (15 minutos)
2.2. (45 minutos)
BACHILLERATO 2012 2013
8CIENCIAS PARA EL MUNDO CONTEMPORÁNEO
ACTIVIDAD 3. BRECHA ¿SÓLO ALLÍ? ¿Y DESDE AQUÍ?
Objetivos
•Conocer la realidad de acceso a las nuevas tecnologías en el entorno más inmediato del alumnado.
•Conocer iniciativas desde el Norte y el Sur para reducir la fractura digital en el Sur.
Comentarios metodológicos
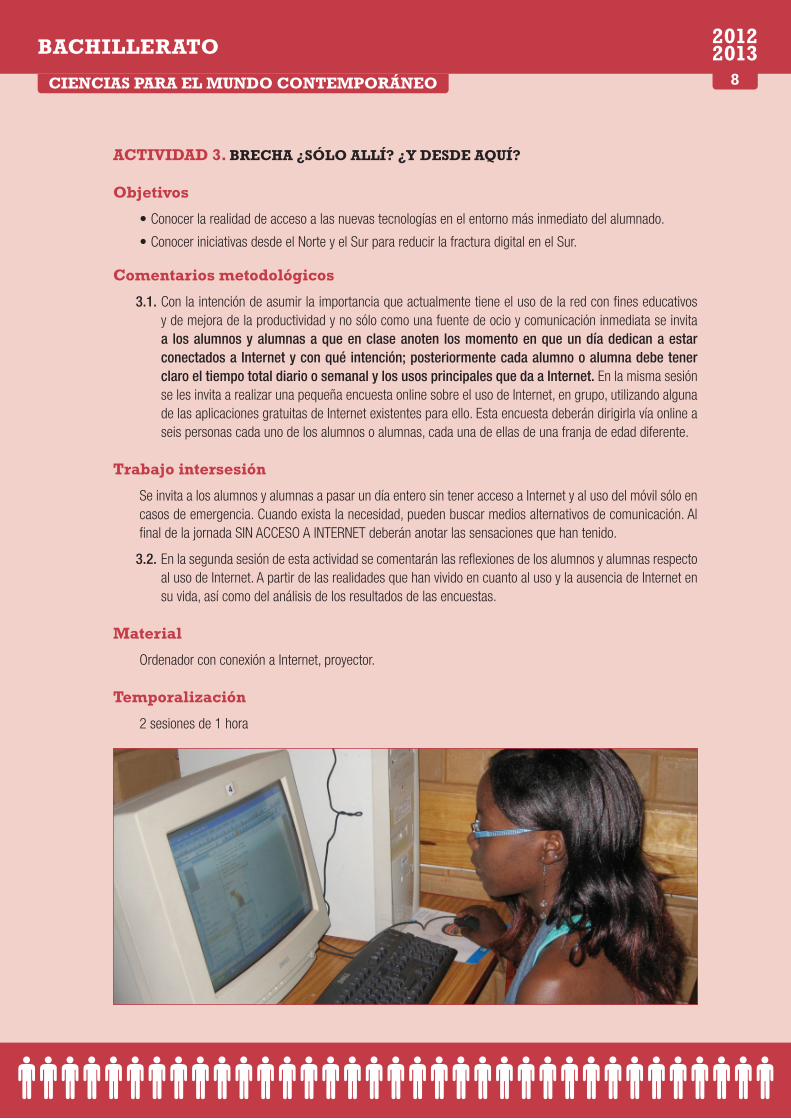
3.1. Con la intención de asumir la importancia que actualmente tiene el uso de la red con fines educativos y de mejora de la productividad y no sólo como una fuente de ocio y comunicación inmediata se invita a los alumnos y alumnas a que en clase anoten los momento en que un día dedican a estar conectados a Internet y con qué intención; posteriormente cada alumno o alumna debe tener claro el tiempo total diario o semanal y los usos principales que da a Internet. En la misma sesión se les invita a realizar una pequeña encuesta online sobre el uso de Internet, en grupo, utilizando alguna de las aplicaciones gratuitas de Internet existentes para ello. Esta encuesta deberán dirigirla vía online a seis personas cada uno de los alumnos o alumnas, cada una de ellas de una franja de edad diferente.
Trabajo intersesión
Se invita a los alumnos y alumnas a pasar un día entero sin tener acceso a Internet y al uso del móvil sólo en casos de emergencia. Cuando exista la necesidad, pueden buscar medios alternativos de comunicación. Al final de la jornada SIN ACCESO A INTERNET deberán anotar las sensaciones que han tenido.
3.2. En la segunda sesión de esta actividad se comentarán las reflexiones de los alumnos y alumnas respecto al uso de Internet. A partir de las realidades que han vivido en cuanto al uso y la ausencia de Internet en su vida, así como del análisis de los resultados de las encuestas.
Material
Ordenador con conexión a Internet, proyector.
Temporalización
2 sesiones de 1 hora
BACHILLERATO 2012 2013
9CIENCIAS PARA EL MUNDO CONTEMPORÁNEO
ACTIVIDAD 4. CUMBRE MUNDIAL SOBRE LA SOCIEDAD DE LA INFORMACIÓN
Objetivos
•Conocer el funcionamiento de las cumbres mundiales.
•Desarrollar mecanismos para conseguir acuerdos.
•Conocer parte de las causas de Brecha digital entre el Norte y el Sur.
Comentarios metodológicos
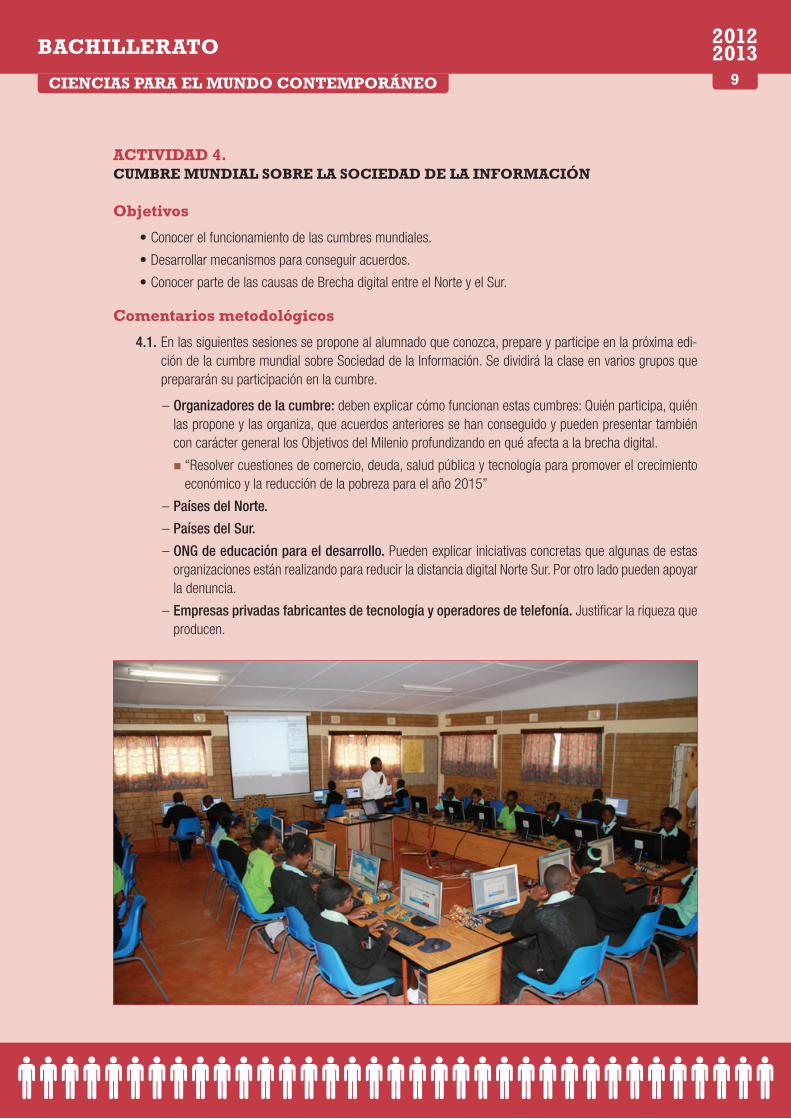
4.1. En las siguientes sesiones se propone al alumnado que conozca, prepare y participe en la próxima edi-ción de la cumbre mundial sobre Sociedad de la Información. Se dividirá la clase en varios grupos que prepararán su participación en la cumbre.
– Organizadores de la cumbre: deben explicar cómo funcionan estas cumbres: Quién participa, quién las propone y las organiza, que acuerdos anteriores se han conseguido y pueden presentar también con carácter general los Objetivos del Milenio profundizando en qué afecta a la brecha digital.
nn “Resolver cuestiones de comercio, deuda, salud pública y tecnología para promover el crecimiento económico y la reducción de la pobreza para el año 2015”
– Países del Norte.
– Países del Sur.
– ONG de educación para el desarrollo. Pueden explicar iniciativas concretas que algunas de estas organizaciones están realizando para reducir la distancia digital Norte Sur. Por otro lado pueden apoyar la denuncia.
– Empresas privadas fabricantes de tecnología y operadores de telefonía. Justificar la riqueza que producen.

BACHILLERATO 2012 2013
10CIENCIAS PARA EL MUNDO CONTEMPORÁNEO
Dedicando dos sesiones en clase, cada grupo debe preparar una presentación, con el soporte que conside-re oportuno, para aportar la información básica (deberemos insistir en que ésta sean datos objetivos en la medida de lo posible) que su grupo defenderá en la cumbre. El profesor o profesora orientará a los alumnos y alumnas en la búsqueda de información y en la interpretación del rol que desarrollará en el debate. La pre-sentación debe acabar con la formulación de la postura que el grupo ha decidido defender en la celebración de la cumbre.
Como punto de partida se propone el siguiente texto que puede leer el profesor o profesora en voz alta como inicio de la actividad:
“La revolución tecnológica constituida por las tecnologías de la información y la comunicación (TIC) está transformando radicalmente nuestras sociedades y si se domina y dirige adecuadamente podría mejorar todos los aspectos de nuestra vida social, económica y cultural. Las TIC pueden ser un motor de desarrollo del Siglo XXI, así como un instrumento eficaz para ayudarnos a lograr todos los objetivos de la Declaración del Milenio, documento fundamental adoptado por un número sin precedentes de dirigentes reunidos en la Cumbre del Milenio para abordar los desafíos en nuestra época.
Sin embargo, la mayoría de la población mundial no se ha beneficiado aún de las nuevas tecnologías, razón por la cual la Cumbre del Milenio reconoció el papel crucial que desempeñan las asociaciones de gobiernos, organismos de desarrollo bilaterales y multilaterales, el sector privado y otros asociados, que tienen por ob-jeto poner las TIC al servicio del desarrollo. Por esta razón, en la ceremonia de apertura del evento mundial TELECOM 99 hice un llamamiento a los gobiernos y a las empresas privadas para que apoyasen la iniciativa emprendida por la UIT en el sentido de convocar la Cumbre Mundial sobre la Sociedad de la Información.
Esta reunión mundial brindará una oportunidad única a todos los actores cruciales para llegar a una visión común en lo que concierne a la forma de salvar la brecha digital y crear una sociedad de la información au-ténticamente mundial. Brindará también la posibilidad de definir soluciones y herramientas y adoptar un plan de acción realista y viable. Como señalé en mi informe a la Cumbre del Milenio, esa disparidad en cuanto a la tecnología digital se puede corregir y se corregirá, y la Cumbre Mundial sobre la Sociedad de la Información es un paso fundamental en este sentido”.
http://www.itu.int/wsis/annan-es.html
BACHILLERATO 2012 2013
11CIENCIAS PARA EL MUNDO CONTEMPORÁNEO
4.2. Celebración de la Cumbre. Empezando por los Organizadores de la cumbre cada grupo aportará la información y la postura de su grupo dedicando unos 5 minutos. Cada postura se puede escribir en un papel grande, en la pizarra o en otro medio, de manera que quede clara en todo momento para todos los integrantes del grupo.
Acabadas las presentaciones se celebrarán 20 minutos de debate entre los grupos con el objetivo de con-seguir una declaración conjunta con tres acciones concretas que se proponen desde la CMSI para reducir la brecha digital Norte Sur.
PÁGINAS WEB, a utilizar en la actividad 4 (se pueden presentar en cualquier momento de la UD para facilitar la información al alumnado).
http://www.itu.int/wsis/docs2/pc3/html/off3/index-es48.html página web que aporta información sobre las diferentes cumbres. Página de la UIT (Unión Internacional de Telecomunicaciones) es el organismo especiali-zado de las Naciones Unidas para las tecnologías de la información y la comunicación, TIC.
http://www.internetworldstats.com/ Información relativa al uso de Internet por los diferentes estados a nivel mundial.
http://one.laptop.org/ Organización que trabaja para asegurar el acceso de las tecnologías a los niños y niñas de países del Sur con intención educativa.
Diversas páginas de denuncia de la situación de fábricas y explotación en países del Sur.
http://pijamasurf.com/2012/01/ninos-de-13-anos-trabajan-16-horas-al-dia-por-70-centavos-de-dolar-para-fabricar-el-iphone
http://www.youtube.com/watch?v=V6sX96sNzJo
http://alt1040.com/2010/03/apple-reconoce-explotacion-infantil-en-sus-fabricas-en-asia
2012 2013
BACHILLERATOINGLÉS
BACHILLERATO 2012 2013
13INGLÉS
Ficha del profesorado
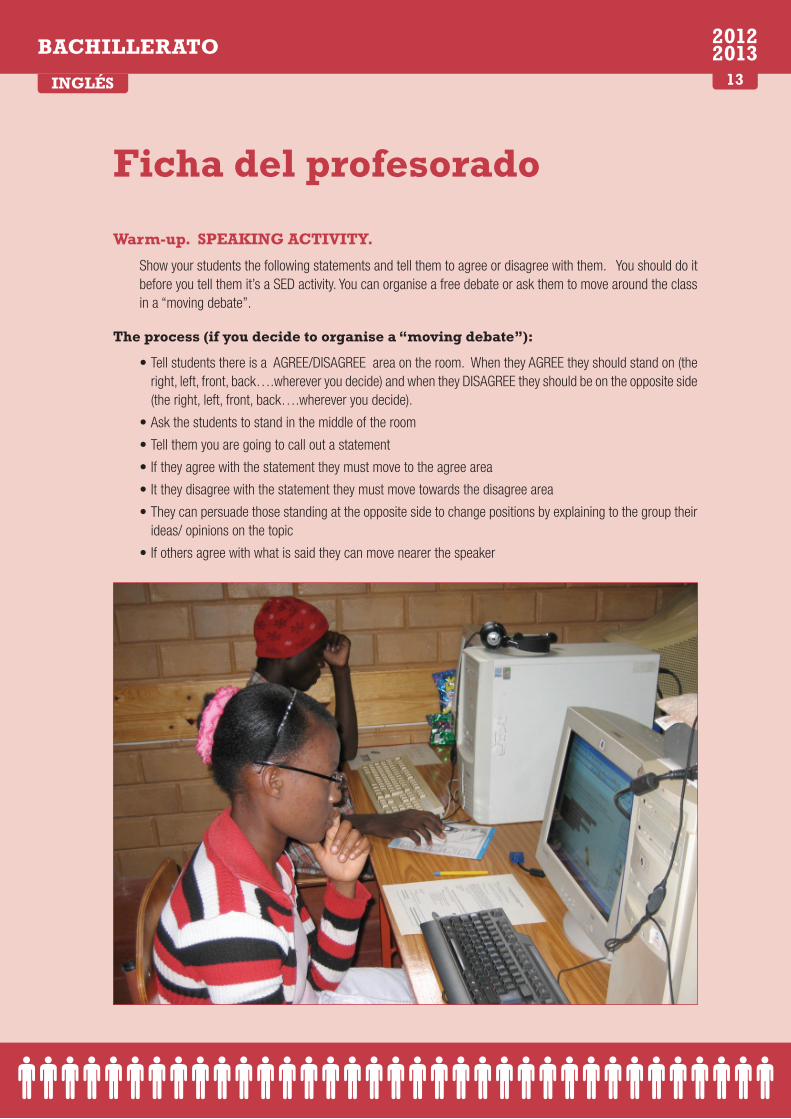
Warm-up. SPEAKING ACTIVITY.
Show your students the following statements and tell them to agree or disagree with them. You should do it before you tell them it’s a SED activity. You can organise a free debate or ask them to move around the class in a “moving debate”.
The process (if you decide to organise a “moving debate”):
•Tell students there is a AGREE/DISAGREE area on the room. When they AGREE they should stand on (the right, left, front, back….wherever you decide) and when they DISAGREE they should be on the opposite side (the right, left, front, back….wherever you decide).
•Ask the students to stand in the middle of the room
•Tell them you are going to call out a statement
•If they agree with the statement they must move to the agree area
•It they disagree with the statement they must move towards the disagree area
•They can persuade those standing at the opposite side to change positions by explaining to the group their ideas/ opinions on the topic
•If others agree with what is said they can move nearer the speaker
BACHILLERATO 2012 2013
14INGLÉS
Statements to initiate the debate: You may call them out, write them on the blackboard, display with a projector.
1. It’s impossible to live without internet. Nowadays it is not difficult to have access to internet. Everybody can get connected to the internet if they really want to.
2. It’s impossible to live without a computer. Nowadays the majority of households have a computer in it.
3. It’s impossible to live without a telephone. Telephones are accessible to everybody. Every household has a fixed-line telephone and several cell-phones. The majority of teenagers have a mobile phone.
4. It’s impossible to live without a TV set. TV is part of life, it is watched by everybody at least 10 minutes a day.
Reflecting on the debate:
Your students may have debated thinking only about themselves. Ask them if what they said is really true for everybody in the world.
Listening /SPEAKING ACTIVITY.
Listen and read the information on the following video. It is 7 minutes long, but you can decide to use only a part of it.
http://www.youtube.com/watch?v=qz7dw3pLr-U
Discuss it with your students. The following questions may help you start the dialogue:
•Were you surprised by any of the data? Did you get new information?
•What is your reaction to what you saw in the video? How do you feel about it? What do you think about it?
•Which of the ideas do you agree with?
•Which of the ideas do you disagree with?
WRITING ACTIVITY
1. Tell your students they are Newspaper Reporters. They should work in groups to write an article for the school magazine comparing life of a teenager in an “enriched” country and another teenager in an “impo-verished” country .
Give instructions about:
– Duration of activity: 40 minutes?
– Length of article: 100 words?
– Special structures to be included in the article (depending on what you are studying at the moment): 2 passive sentences? 3 conditional sentences? 4 comparatives?...
– Information included in the article: specific data about internet, computers, tv, newspapers…
– Any questions you would like them to think about and include in the article: Which are the consequences of the differences in access and use of communication?
At the end of the class they may read the articles aloud to the rest of the class and vote to choose the best article to be sent to the school magazine , to be published in a blog or passed out to other classes….
2. You have information about technology and communication in different countries. You may choose to distri-bute the information in different ways:
BACHILLERATO 2012 2013
15INGLÉS
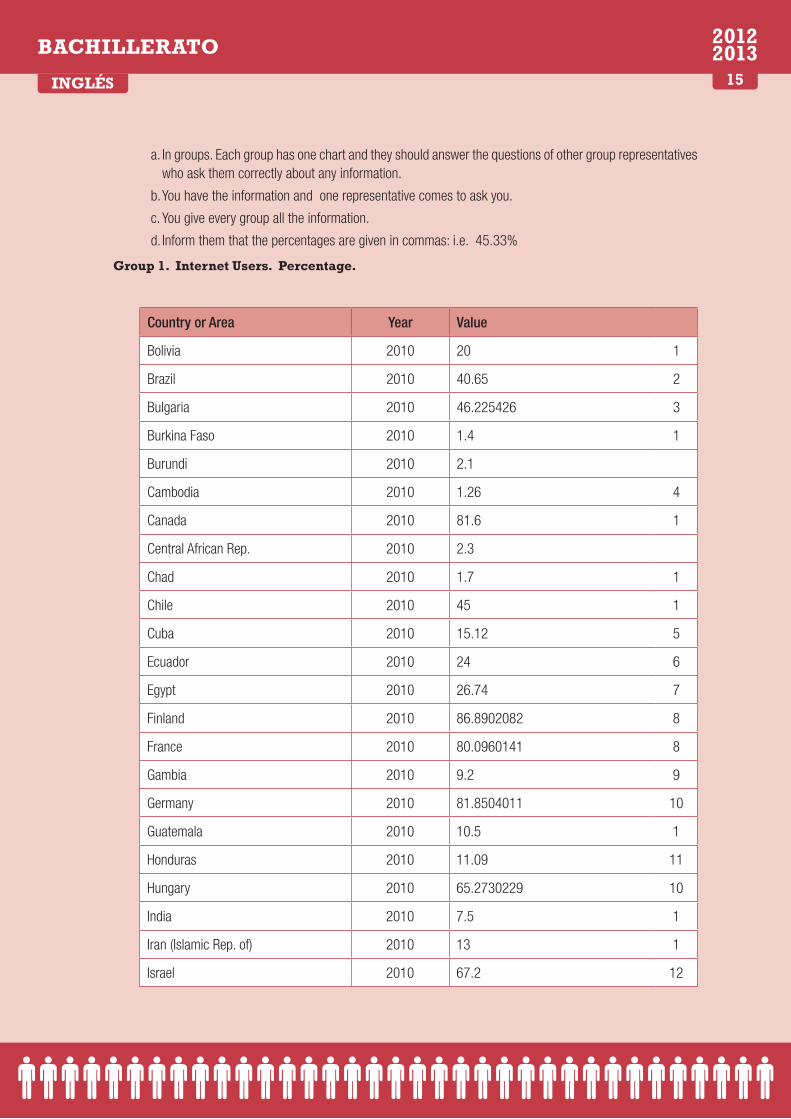
a. In groups. Each group has one chart and they should answer the questions of other group representatives who ask them correctly about any information.
b. You have the information and one representative comes to ask you.
c. You give every group all the information.
d. Inform them that the percentages are given in commas: i.e. 45.33%
Group 1. Internet Users. Percentage.
Country or Area Year Value
Bolivia 2010 20 1
Brazil 2010 40.65 2
Bulgaria 2010 46.225426 3
Burkina Faso 2010 1.4 1
Burundi 2010 2.1
Cambodia 2010 1.26 4
Canada 2010 81.6 1
Central African Rep. 2010 2.3
Chad 2010 1.7 1
Chile 2010 45 1
Cuba 2010 15.12 5
Ecuador 2010 24 6
Egypt 2010 26.74 7
Finland 2010 86.8902082 8
France 2010 80.0960141 8
Gambia 2010 9.2 9
Germany 2010 81.8504011 10
Guatemala 2010 10.5 1
Honduras 2010 11.09 11
Hungary 2010 65.2730229 10
India 2010 7.5 1
Iran (Islamic Rep. of) 2010 13 1
Israel 2010 67.2 12
BACHILLERATO 2012 2013
16INGLÉS
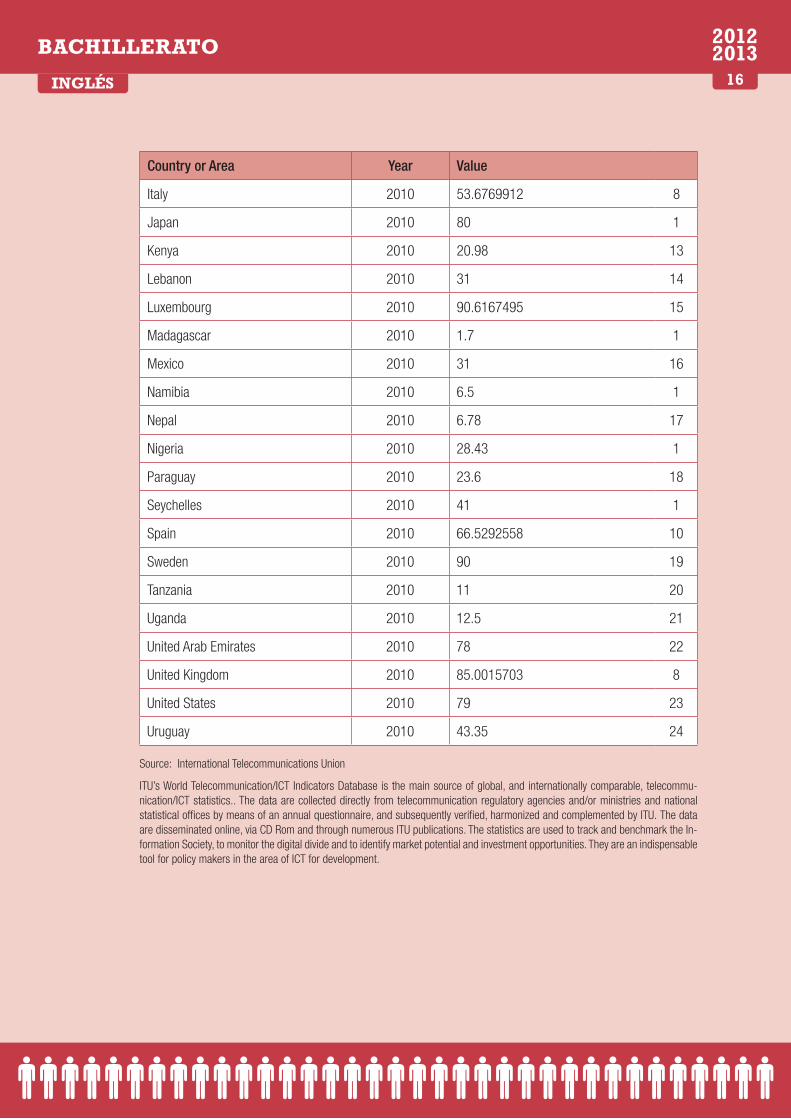
Country or Area Year Value
Italy 2010 53.6769912 8
Japan 2010 80 1
Kenya 2010 20.98 13
Lebanon 2010 31 14
Luxembourg 2010 90.6167495 15
Madagascar 2010 1.7 1
Mexico 2010 31 16
Namibia 2010 6.5 1
Nepal 2010 6.78 17
Nigeria 2010 28.43 1
Paraguay 2010 23.6 18
Seychelles 2010 41 1
Spain 2010 66.5292558 10
Sweden 2010 90 19
Tanzania 2010 11 20
Uganda 2010 12.5 21
United Arab Emirates 2010 78 22
United Kingdom 2010 85.0015703 8
United States 2010 79 23
Uruguay 2010 43.35 24
Source: International Telecommunications Union
ITU’s World Telecommunication/ICT Indicators Database is the main source of global, and internationally comparable, telecommu-nication/ICT statistics.. The data are collected directly from telecommunication regulatory agencies and/or ministries and national statistical offices by means of an annual questionnaire, and subsequently verified, harmonized and complemented by ITU. The data are disseminated online, via CD Rom and through numerous ITU publications. The statistics are used to track and benchmark the In-formation Society, to monitor the digital divide and to identify market potential and investment opportunities. They are an indispensable tool for policy makers in the area of ICT for development.

BACHILLERATO 2012 2013
17INGLÉS
Group 2 Fixed-line Phones per 100 inhabitants
Country or Area Value Year
Afghanistan 0.445693191874134 2010
Andorra 44.9790252639517 2010
Argentina 24.7448949796963 2010
Australia 38.8892162089535 2010
Austria 38.6602052696064 2010
Belgium 43.3135867534797 2010
Brazil 21.6169177107952 2010
Cameroon 2.53321502050448 2010
Canada 50.038226932368 2010
Central African Rep. 0.27266214365614 2010
Chile 20.20316135248 2010
China 21.9470129863562 2010
Cuba 10.336002580925 2010
Dominican Rep. 10.1729973447013 2010
Finland 23.3011330315743 2010
France 56.062179455132 2010
Gambia 2.82209959071832 2010
Hungary 29.8211124293783 2010
India 2.86539192187648 2010
Iran (Islamic Rep. of) 36.2952311519659 2010
Mali 0.744452972707728 2010
Mexico 17.5374075429308 2010
Morocco 11.7345799928967 2010
Pakistan 1.96970122991382 2010
Paraguay 6.27464541281589 2010
Senegal 2.74943283301677 2010

BACHILLERATO 2012 2013
18INGLÉS
Country or Area Value Year
Spain 43.1967831057711 2010
Tanzania 0.389175353947727 2010
United Kingdom 53.711120894029 2010
United States 48.7045161240104 2010
Source: World Telecommunication/ICT Indicators DataSource: International Telecommunications Union
ITU’s World Telecommunication/ICT Indicators Database is the main source of global, and internationally comparable, telecommuni-cation/ICT statistics. It includes time series for more than 100 indicators and around 200 economies. The data are collected directly from telecommunication regulatory agencies and/or ministries and national statistical offices by means of an annual questionnaire, and subsequently verified, harmonized and complemented by ITU.
The data are disseminated online, via CD Rom and through numerous ITU publications, including the Yearbook of Statistics, the Measuring the Information Society Report, the World Telecommunication/ICT Development Report and regional reports. The statistics are used to track and benchmark the Information Society, to monitor the digital divide and to identify market potential and investment opportunities. They are an indispensable tool for policy makers in the area of ICT for development.
Group 3. Mobile cellular telephone subscriptions per 100 population
Country or Area Value Year
Algeria 92.42 2010
Andorra 77.18 2010
Angola 46.69 2010
Australia 101.04 2010
Cameroon 41.61 2010
Canada 70.66 2010
Central African Republic 23.18 2010
Chile 116.00 2010
China 64.04 2010
Egypt 87.11 2010
Gambia 85.53 2010
Hungary 120.32 2010
India 61.42 2010
Ireland 105.18 2010
Kenya 61.63 2010
BACHILLERATO 2012 2013
19INGLÉS
Country or Area Value Year
Mali 47.66 2010
Mexico 80.55 2010
Nicaragua 65.14 2010
Senegal 67.11 2010
Spain 111.75 2010
Turkey 84.90 2010
United Republic of Tanzania 46.80 2010
United States 89.86 2010
SourceMillennium Development Goals DatabaseSource: United Nations Statistics DivisionThe Millennium Development Goals Database presents official data for more than 60 indicators to measure progress towards the Millennium Development Goals. The data and analyses are the product of the work of the Inter-agency and Expert Group (IAEG), coordinated by the United Nations Statistics Division.
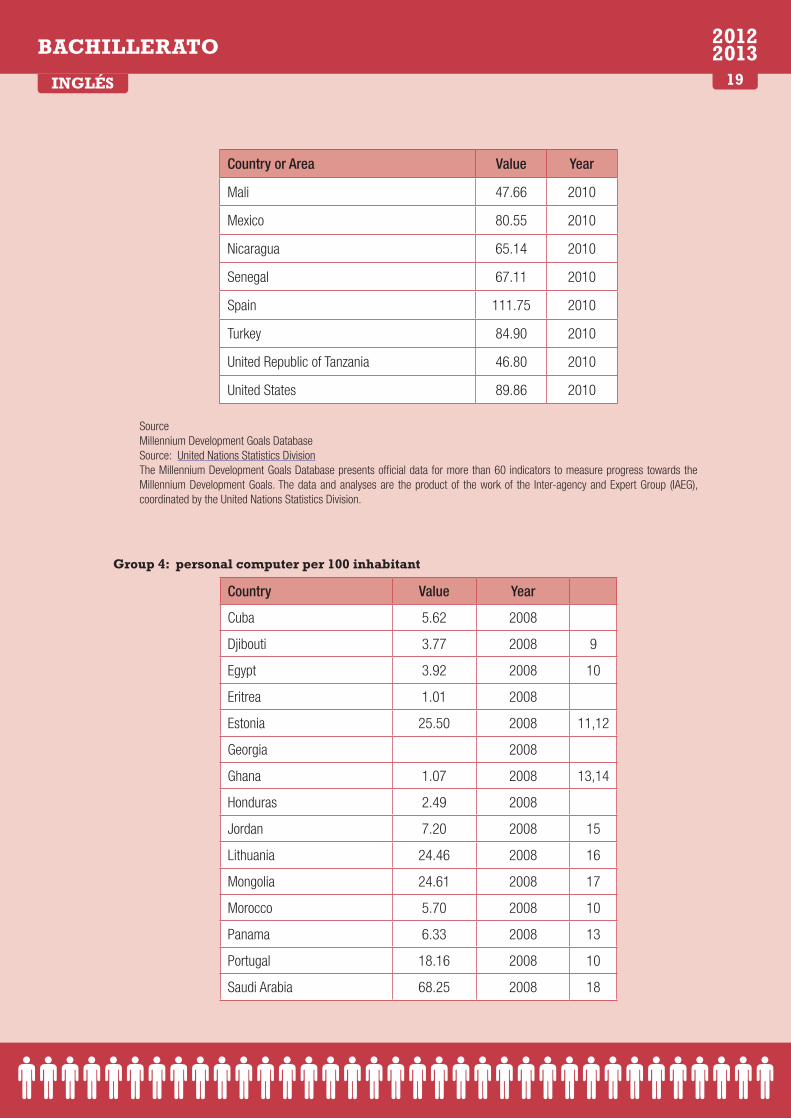
Group 4: personal computer per 100 inhabitant
Country Value Year
Cuba 5.62 2008
Djibouti 3.77 2008 9
Egypt 3.92 2008 10
Eritrea 1.01 2008
Estonia 25.50 2008 11,12
Georgia 2008
Ghana 1.07 2008 13,14
Honduras 2.49 2008
Jordan 7.20 2008 15
Lithuania 24.46 2008 16
Mongolia 24.61 2008 17
Morocco 5.70 2008 10
Panama 6.33 2008 13
Portugal 18.16 2008 10
Saudi Arabia 68.25 2008 18

BACHILLERATO 2012 2013
20INGLÉS
Country Value Year
Serbia 19.31 2008
Slovakia 58.15 2008 10,19
Switzerland 97.60 2008 20
Tunisia 9.81 2008 10
Zimbabwe 7.62 2008 21
Footnotes
1 - Ministry of Public Works Transport and Telcommunication. 2 - Ministry of Communications and Information Technologies. 3 - Telecommunications Regulatory Authority (TRA). 4 - Botswana Telecommunications Authority (BTA).5 - National Statistical Institute 6 - Source : Census and Statistics Department 7 - Computer Industry Almanac, ITU estimate. 8 - Ministerio de Comunicaciones. 9 - ACCT. 10 - ITU estimate. 11 - Ministry of Economic Affairs and Communications. 12 - Includes only estimated number of computers in households. 13 - Estimate. 14 - NCA estimates. 15 - Telecommunications Regulatory Commission. 16 - ITU estimate derived from trade statistics. 17 - Communications Regulatory Commission. 18 - Computer Industry Almanac, ITU estimates. 19 - Estimate based on trade data. 20 - R. Weiss, ITU estimate, Swisscom. 21 - BMI, PTC, ITU estimate.
Group 5: Households with television %
Rank Countries Amount Date
# 2 Norway: 99.97 % 2002
# 3 Switzerland: 99.83 % 2002
# 4 Greece: 99.5 % 2004
# 5 Spain: 99.48 % 2005
= 9 Japan: 99 % 2004
= 9 Canada: 99 % 2003
# 13 Saudi Arabia: 98.68 % 2002
# 23 United States: 97.84 % 2002
# 25 United Kingdom: 97.5 % 2001
# 33 Argentina: 96.97 % 2001
# 34 Samoa: 96.73 % 2003
# 36 Australia: 96.28 % 2003
# 37 Hungary: 96.2 % 2003
# 38 Slovenia: 96 % 2005
# 39 Italy: 95.5 % 2004
# 42 Ireland: 95.3 % 2004
# 43 Libya: 95.06 % 2000

BACHILLERATO 2012 2013
21INGLÉS
Rank Countries Amount Date
= 44 France: 95 % 2004
# 47 Austria: 94.9 % 2005
# 48 Finland: 94.1 % 2005
# 50 Sweden: 93.91 % 2002
# 62 Mexico: 92.7 % 2005
# 64 Turkey: 92.19 % 2004
# 66 Colombia: 92.02 % 2002
# 68 Thailand: 91.93 % 2002
# 71 Tunisia: 91.68 % 2002
# 79 China: 89.17 % 2002
= 85 Egypt: 88.6 % 2002
# 87 Algeria: 88.06 % 2002
# 102 Iran: 76.58 % 2002
# 103 Paraguay: 76.1 % 2004
# 104 Morocco: 76.07 % 2002
# 105 Dominica: 76.01 % 2001
# 117 South Africa: 59.2 % 2004
# 118 Nicaragua: 59.1 % 2001
# 134 Côte d’Ivoire: 34.53 % 2002
# 135 India: 32 % 2002
# 139 Senegal: 28.52 % 2002
# 151 Cameroon: 17.71 % 2002
# 152 Kenya: 17.08 % 2002
# 154 Mali: 14.8 % 2002
# 158 Gambia, The: 12.37 % 2002
# 162 Guinea: 9.47 % 2002
# 164 Angola: 8.97 % 2002
# 165 Somalia: 8.45 % 2002
# 171 Tanzania: 6.1 % 2004
# 172 Congo, Republic of the: 6.02 % 2002
# 174 Niger: 5.45 % 2002
BACHILLERATO 2012 2013
22INGLÉS
Rank Countries Amount Date
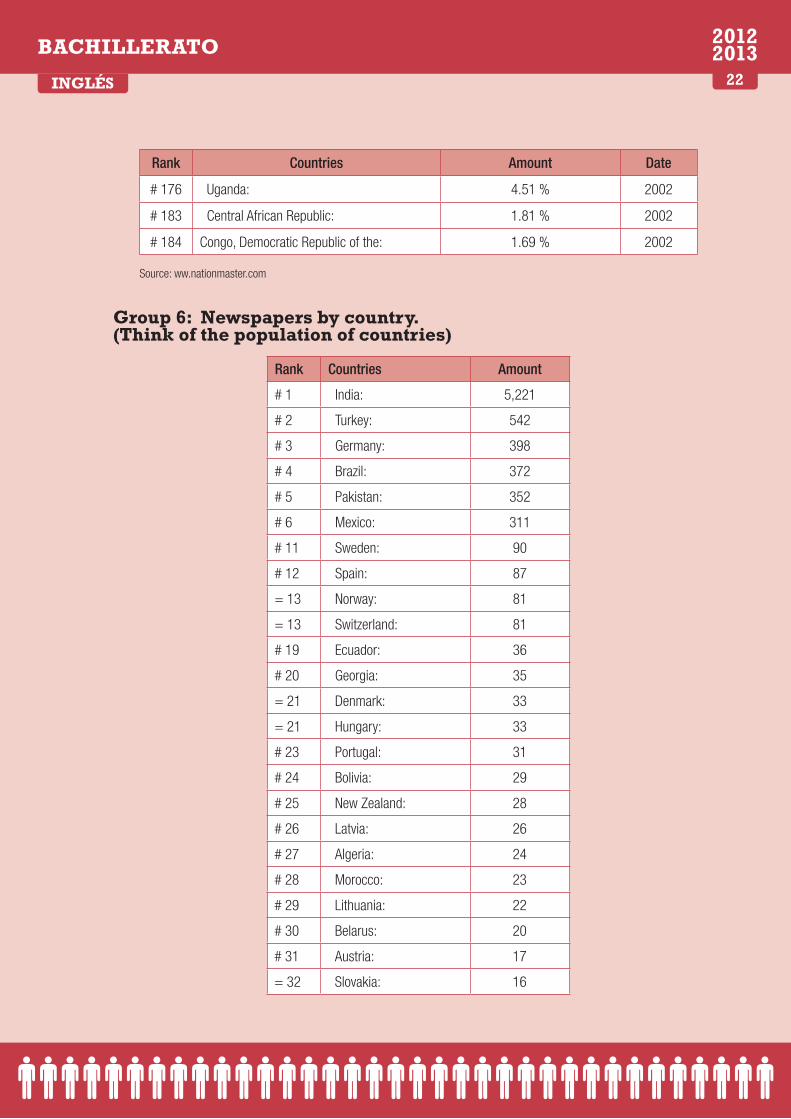
# 176 Uganda: 4.51 % 2002
# 183 Central African Republic: 1.81 % 2002
# 184 Congo, Democratic Republic of the: 1.69 % 2002
Source: ww.nationmaster.com
Group 6: Newspapers by country. (Think of the population of countries)
Rank Countries Amount
# 1 India: 5,221
# 2 Turkey: 542
# 3 Germany: 398
# 4 Brazil: 372
# 5 Pakistan: 352
# 6 Mexico: 311
# 11 Sweden: 90
# 12 Spain: 87
= 13 Norway: 81
= 13 Switzerland: 81
# 19 Ecuador: 36
# 20 Georgia: 35
= 21 Denmark: 33
= 21 Hungary: 33
# 23 Portugal: 31
# 24 Bolivia: 29
# 25 New Zealand: 28
# 26 Latvia: 26
# 27 Algeria: 24
# 28 Morocco: 23
# 29 Lithuania: 22
# 30 Belarus: 20
# 31 Austria: 17
= 32 Slovakia: 16
BACHILLERATO 2012 2013
23INGLÉS
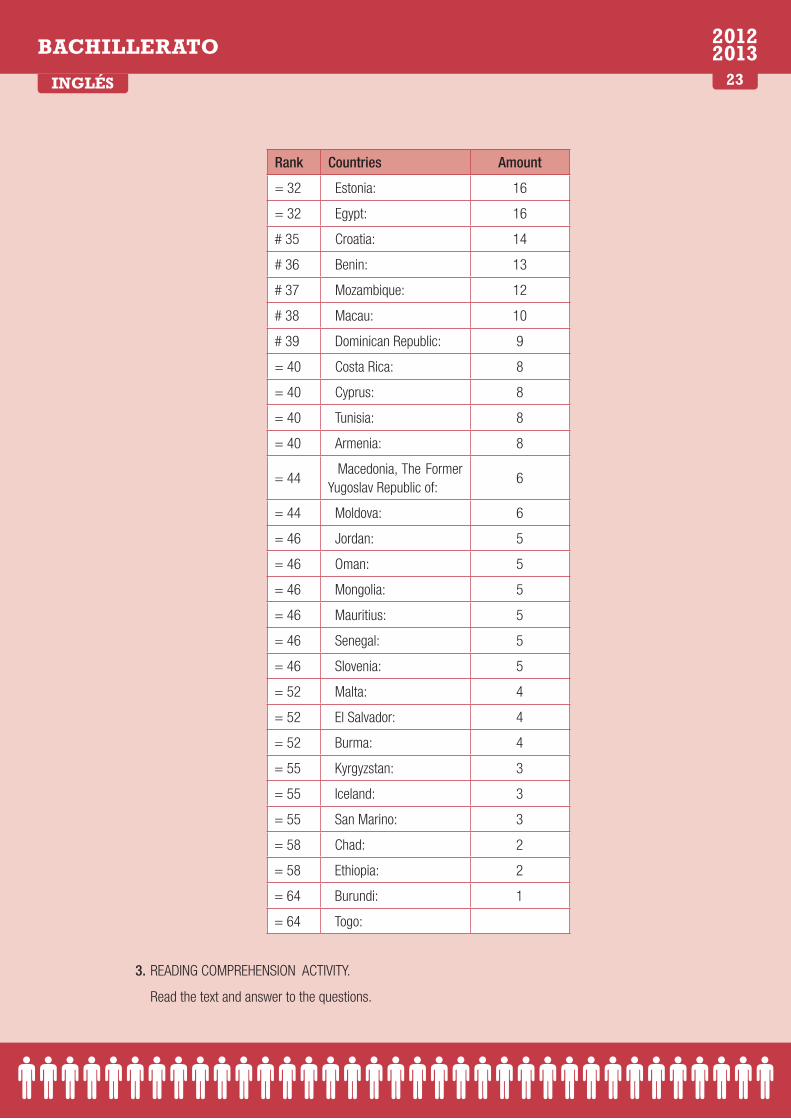
Rank Countries Amount
= 32 Estonia: 16
= 32 Egypt: 16
# 35 Croatia: 14
# 36 Benin: 13
# 37 Mozambique: 12
# 38 Macau: 10
# 39 Dominican Republic: 9
= 40 Costa Rica: 8
= 40 Cyprus: 8
= 40 Tunisia: 8
= 40 Armenia: 8
= 44 Macedonia, The Former Yugoslav Republic of:
6
= 44 Moldova: 6
= 46 Jordan: 5
= 46 Oman: 5
= 46 Mongolia: 5
= 46 Mauritius: 5
= 46 Senegal: 5
= 46 Slovenia: 5
= 52 Malta: 4
= 52 El Salvador: 4
= 52 Burma: 4
= 55 Kyrgyzstan: 3
= 55 Iceland: 3
= 55 San Marino: 3
= 58 Chad: 2
= 58 Ethiopia: 2
= 64 Burundi: 1
= 64 Togo:
3. READING COMPREHENSION ACTIVITY.
Read the text and answer to the questions.
BACHILLERATO 2012 2013
24INGLÉS
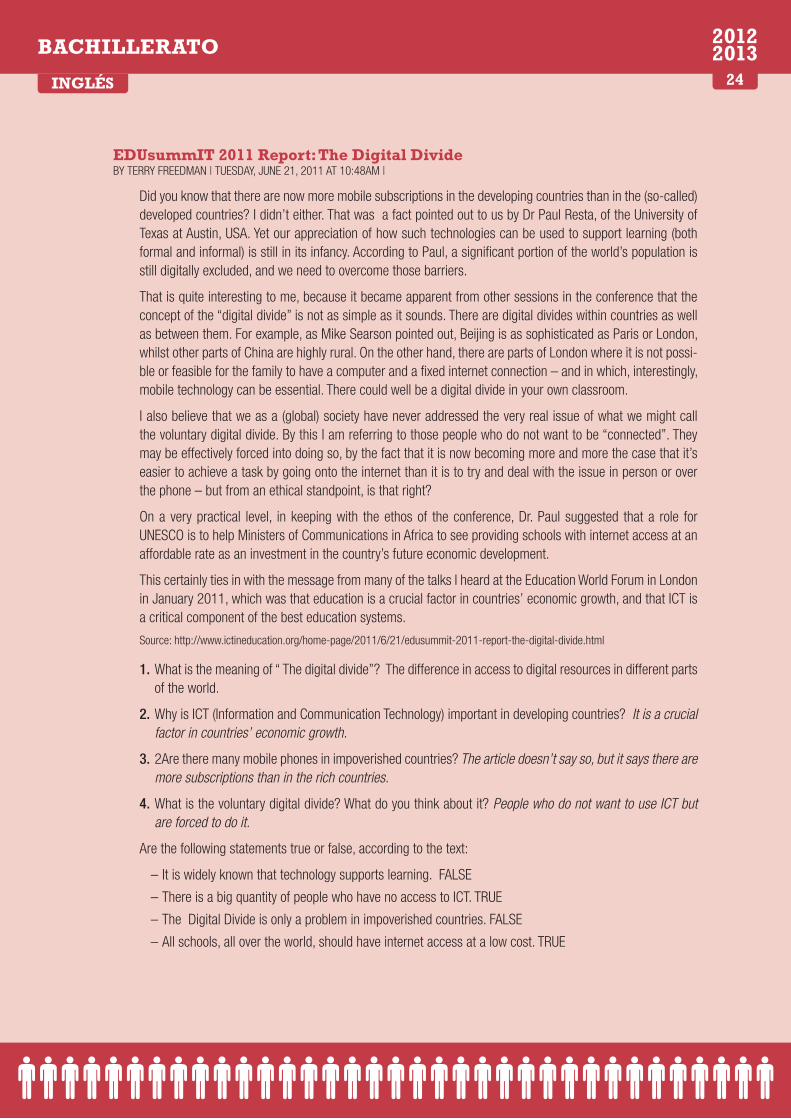
EDUsummIT 2011 Report: The Digital Divide BY TERRY FREEDMAN | TUESDAY, JUNE 21, 2011 AT 10:48AM |
Did you know that there are now more mobile subscriptions in the developing countries than in the (so-called) developed countries? I didn’t either. That was a fact pointed out to us by Dr Paul Resta, of the University of Texas at Austin, USA. Yet our appreciation of how such technologies can be used to support learning (both formal and informal) is still in its infancy. According to Paul, a significant portion of the world’s population is still digitally excluded, and we need to overcome those barriers.
That is quite interesting to me, because it became apparent from other sessions in the conference that the concept of the “digital divide” is not as simple as it sounds. There are digital divides within countries as well as between them. For example, as Mike Searson pointed out, Beijing is as sophisticated as Paris or London, whilst other parts of China are highly rural. On the other hand, there are parts of London where it is not possi-ble or feasible for the family to have a computer and a fixed internet connection – and in which, interestingly, mobile technology can be essential. There could well be a digital divide in your own classroom.
I also believe that we as a (global) society have never addressed the very real issue of what we might call the voluntary digital divide. By this I am referring to those people who do not want to be “connected”. They may be effectively forced into doing so, by the fact that it is now becoming more and more the case that it’s easier to achieve a task by going onto the internet than it is to try and deal with the issue in person or over the phone – but from an ethical standpoint, is that right?
On a very practical level, in keeping with the ethos of the conference, Dr. Paul suggested that a role for UNESCO is to help Ministers of Communications in Africa to see providing schools with internet access at an affordable rate as an investment in the country’s future economic development.
This certainly ties in with the message from many of the talks I heard at the Education World Forum in London in January 2011, which was that education is a crucial factor in countries’ economic growth, and that ICT is a critical component of the best education systems.
Source: http://www.ictineducation.org/home-page/2011/6/21/edusummit-2011-report-the-digital-divide.html
1. What is the meaning of “ The digital divide”? The difference in access to digital resources in different parts of the world.
2. Why is ICT (Information and Communication Technology) important in developing countries? It is a crucial factor in countries’ economic growth.
3. 2Are there many mobile phones in impoverished countries? The article doesn’t say so, but it says there are more subscriptions than in the rich countries.
4. What is the voluntary digital divide? What do you think about it? People who do not want to use ICT but are forced to do it.
Are the following statements true or false, according to the text:
– It is widely known that technology supports learning. FALSE
– There is a big quantity of people who have no access to ICT. TRUE
– The Digital Divide is only a problem in impoverished countries. FALSE
– All schools, all over the world, should have internet access at a low cost. TRUE