Automatizacion y Miniaturizacion de Sistemas de Screening y Determinacion de Residuos de Plaguicidas...
393
-
Upload
angel-r-morales-p -
Category
Documents
-
view
7 -
download
0
description
El objeto de estedocumento se centra en la automatización de las operaciones previas del proceso analítico para conseguir la simplificación y automatización del mismo así como su aplicación directa a muestras con matrices complejas (frutas y hortalizas). Esto permitirá conseguir ventajas sustanciales respecto a las metodologías convencionales, en términos de calidad informativa (más y mejor) y de calidad productiva (mínimos esfuerzos, costes y riesgos para el operador y el medio ambiente).
Transcript of Automatizacion y Miniaturizacion de Sistemas de Screening y Determinacion de Residuos de Plaguicidas...

7/18/2019 Automatizacion y Miniaturizacion de Sistemas de Screening y Determinacion de Residuos de Plaguicidas en Muestra Agroalimentaria
http://slidepdf.com/reader/full/automatizacion-y-miniaturizacion-de-sistemas-de-screening-y-determinacion-de 1/393

7/18/2019 Automatizacion y Miniaturizacion de Sistemas de Screening y Determinacion de Residuos de Plaguicidas en Muestra Agroalimentaria
http://slidepdf.com/reader/full/automatizacion-y-miniaturizacion-de-sistemas-de-screening-y-determinacion-de 2/393
Departamento de Química Analítica y Ecología
Universidad de Córdoba

7/18/2019 Automatizacion y Miniaturizacion de Sistemas de Screening y Determinacion de Residuos de Plaguicidas en Muestra Agroalimentaria
http://slidepdf.com/reader/full/automatizacion-y-miniaturizacion-de-sistemas-de-screening-y-determinacion-de 3/393
AUTOMATIZACION Y MINIATURIZACION DE SISTEMAS DE
SCREENING Y DETERMINACION DE RESIDUOS DE PLAGUICIDASEN MUESTRAS AGROALIMENTARIAS
LOS DIRECTORES,
Fdo. Miguel Valcárcel CasesCatedrático del Departamento deQuímica Analítica y Ecología de
la Universidad de Córdoba
Fdo. Mercedes Gallego FernándezProfesora Titular del Departamentode Química Analítica y Ecología de
la Universidad de Córdoba
Fdo. M. Soledad Cárdenas Aranzana
Profesora Asociada del Departamentode Química Analítica y Ecología de laUniversidad de Córdoba
Trabajo presentado para aspiraral Grado de Doctor en Ciencias Químicas
con la mención “Doctorado Europeo”
LA DOCTORANDA,

7/18/2019 Automatizacion y Miniaturizacion de Sistemas de Screening y Determinacion de Residuos de Plaguicidas en Muestra Agroalimentaria
http://slidepdf.com/reader/full/automatizacion-y-miniaturizacion-de-sistemas-de-screening-y-determinacion-de 4/393

7/18/2019 Automatizacion y Miniaturizacion de Sistemas de Screening y Determinacion de Residuos de Plaguicidas en Muestra Agroalimentaria
http://slidepdf.com/reader/full/automatizacion-y-miniaturizacion-de-sistemas-de-screening-y-determinacion-de 5/393
Miguel Valcárcel Cases, Catedrático del Departamento de Química Analítica yEcología de la Universidad de Córdoba, Mercedes Gallego Fernández, ProfesoraTitular del citado Departamento y M. Soledad Cárdenas Aranzana, ProfesoraAsociada del citado Departamento, en calidad de directores de la Tesis Doctoral presentada por la Licenciada en Ciencias y Tecnología de los Alimentos y en Farmacia,Almudena Columé Díaz.
CERTIFICAN: Que la Tesis Doctoral “AUTOMATIZACION YMINIATURIZACION DE SISTEMAS DE SCREENING YDETERMINACION DE RESIDUOS DE PLAGUICIDAS ENMUESTRAS AGROALIMENTARIAS” ha sido desarrolladatotalmente en los Laboratorios del Departamento de QuímicaAnalítica y Ecología de la Universidad de Córdoba y del AnalyticalChemistry Institute de la Universidad Técnica de Viena, y que anuestro juicio, reúne todos los requisitos exigidos a este tipo detrabajo.
Y para que conste y surta los efectos pertinentes, expiden el presente certificado en laciudad de Córdoba, a 16 de Octubre de 2001.
MIGUEL VALCARCEL CASES MERCEDES GALLEGO FERNÁNDEZ

7/18/2019 Automatizacion y Miniaturizacion de Sistemas de Screening y Determinacion de Residuos de Plaguicidas en Muestra Agroalimentaria
http://slidepdf.com/reader/full/automatizacion-y-miniaturizacion-de-sistemas-de-screening-y-determinacion-de 6/393

7/18/2019 Automatizacion y Miniaturizacion de Sistemas de Screening y Determinacion de Residuos de Plaguicidas en Muestra Agroalimentaria
http://slidepdf.com/reader/full/automatizacion-y-miniaturizacion-de-sistemas-de-screening-y-determinacion-de 7/393
Mediante la defensa de esta Memoria se pretende optar a la obtención de lamención “Doctorado Europeo”, habida cuenta que la doctoranda reúne los requisitos
exigidos para tal mención:
1. Se cuenta con los informes favorables de dos doctores pertenecientes a
Instituciones de Enseñanza Superior de países europeos distintos al nuestro.2. En el Tribunal que ha de evaluar la Tesis existe un miembro de un centro de
Enseñanza Superior de otro país europeo.
3. Parte de la defensa de la Memoria se realizará en la lengua oficial de otro país
europeo.
4. La doctoranda ha realizado una parte del trabajo experimental en el Analytical
Chemistry Institute de la Universidad Tecnológica de Viena (Austria), gracias a
la concesión de la beca Marie Curie para estancias en el extranjero de laComisión Europea para la Investigación.

7/18/2019 Automatizacion y Miniaturizacion de Sistemas de Screening y Determinacion de Residuos de Plaguicidas en Muestra Agroalimentaria
http://slidepdf.com/reader/full/automatizacion-y-miniaturizacion-de-sistemas-de-screening-y-determinacion-de 8/393

7/18/2019 Automatizacion y Miniaturizacion de Sistemas de Screening y Determinacion de Residuos de Plaguicidas en Muestra Agroalimentaria
http://slidepdf.com/reader/full/automatizacion-y-miniaturizacion-de-sistemas-de-screening-y-determinacion-de 9/393
A mis directores de Tesis, Mercedes Gallego, mi profe de Ciencias y
Tecnología de los Alimentos, gracias por orientarme en el maravilloso mundo de la
química; Marisol Cárdenas, que ha trabajado conmigo codo con codo incansablemente;
y Miguel Valcárcel, por brindarme la oportunidad de entrar en el mundo científico.
A mis compañeros del Departamento de Química Analítica, por los buenosratos que hemos compartido dentro y fuera del laboratorio.
A mis compañeros de grupo, especialmente a Andrés y Pepi, por ser mis
amigos además de compañeros. Compartir las horas de trabajo (y almuerzo) con
vosotros ha sido un placer.
A Carmen, Diego y José Manuel, por ayudarme siempre. Las cervecitas al
mediodía han sido fuente de relajación y buenos ratos.
A mis amigos, Carmen, Fé y Elier, que han soportado mis buenos y malos
momentos.
A Bernhard y a mis compañeros de Viena, Peter, Sepp, Mike, Eva, Andrea y
Bárbara. Für meine Freunde aus Wien Peter, Sepp und Mike: ich danke ihnen für die
freundliche Aufnahme in ihrer Arbeitsgruppe und für die vielen gemeinsam verbrachten
Stunden in Labor. Ganz besonders die Abende im Lokal "Big Party", diverse Festl bis 5
Uhr in der Früh und Ausflüge, die mir immer in Erinerung bleiben werden.
A Malin, que ha sido mucho más que una amiga. Muchas gracias a todos por
hacer de mi estancia un recuerdo inolvidable. Till Malin, som är mycket mer än bara en
vän. Tack så mycket kära syster för alla de fina stunder du gav mig och för att du fanns
där även vid de svåra. Kommer aldrig att glömma dig.
A toda mi familia política, especialmente Marga, Juan y Mónica, que me han
hecho sentir en Córdoba como en mi casa.
A mis padres, Pepi y Juan Miguel, a mi hermana Celeste y a mi hermano Juan
Miguel, por todo el apoyo que me han dado desde siempre. Sin ellos nunca hubiera
llegado hasta aquí. A mi cuñado Ilde, por todos los buenos ratos que hemos pasado en

7/18/2019 Automatizacion y Miniaturizacion de Sistemas de Screening y Determinacion de Residuos de Plaguicidas en Muestra Agroalimentaria
http://slidepdf.com/reader/full/automatizacion-y-miniaturizacion-de-sistemas-de-screening-y-determinacion-de 10/393

7/18/2019 Automatizacion y Miniaturizacion de Sistemas de Screening y Determinacion de Residuos de Plaguicidas en Muestra Agroalimentaria
http://slidepdf.com/reader/full/automatizacion-y-miniaturizacion-de-sistemas-de-screening-y-determinacion-de 11/393
Special thanks should be given to Dr. Bernhard Lendl, for offering me the
opportunity to work in his group at the Analytical Chemistry Institute of Technology
University of Vienna. Working with him and his friendly group has been an
unforgettable experience.
I would like to thank to European Researcher Commission for the concession of
a Marie Curie fellowship, which allows me the stage in the Training Site on Advanced
and Applied Vibrational Spectroscopy (ADVIS) in Vienna.

7/18/2019 Automatizacion y Miniaturizacion de Sistemas de Screening y Determinacion de Residuos de Plaguicidas en Muestra Agroalimentaria
http://slidepdf.com/reader/full/automatizacion-y-miniaturizacion-de-sistemas-de-screening-y-determinacion-de 12/393

7/18/2019 Automatizacion y Miniaturizacion de Sistemas de Screening y Determinacion de Residuos de Plaguicidas en Muestra Agroalimentaria
http://slidepdf.com/reader/full/automatizacion-y-miniaturizacion-de-sistemas-de-screening-y-determinacion-de 13/393
A mis padres

7/18/2019 Automatizacion y Miniaturizacion de Sistemas de Screening y Determinacion de Residuos de Plaguicidas en Muestra Agroalimentaria
http://slidepdf.com/reader/full/automatizacion-y-miniaturizacion-de-sistemas-de-screening-y-determinacion-de 14/393

7/18/2019 Automatizacion y Miniaturizacion de Sistemas de Screening y Determinacion de Residuos de Plaguicidas en Muestra Agroalimentaria
http://slidepdf.com/reader/full/automatizacion-y-miniaturizacion-de-sistemas-de-screening-y-determinacion-de 15/393
A Jesús

7/18/2019 Automatizacion y Miniaturizacion de Sistemas de Screening y Determinacion de Residuos de Plaguicidas en Muestra Agroalimentaria
http://slidepdf.com/reader/full/automatizacion-y-miniaturizacion-de-sistemas-de-screening-y-determinacion-de 16/393

7/18/2019 Automatizacion y Miniaturizacion de Sistemas de Screening y Determinacion de Residuos de Plaguicidas en Muestra Agroalimentaria
http://slidepdf.com/reader/full/automatizacion-y-miniaturizacion-de-sistemas-de-screening-y-determinacion-de 17/393
Indice
INDICE
OBJETO 19
INTRODUCCION GENERAL 25
1. Generalidades sobre plaguicidas 31
2. Toma de muestra 60 3. Directrices generales sobre la determinación de plaguicidas 69
4. Metodologías desarrolladas para la determinación de residuos
de plaguicidas organoclorados y piretroides75
Referencias
CAPITULO I. HERRAMIENTAS ANALITICAS 99
CAPITULO II. PLAGUICIDAS ORGANOCLORADOS ENHORTALIZAS Y FRUTAS FRESCAS
113
Introducción
II.1 . Semiautomatic method for the screening and determination
of 23 organochlorine pesticides in horticultural samples by gas
chromatography with electron-capture detection
119
II.2. Simplified method for the determination of chlorinated
fungicides and insecticides in fruits by gas chromatography 139
CAPITULO III. PLAGUICIDAS ORGANOCLORADOS Y
PIRETROIDES EN HORTALIZAS Y FRUTAS LIOFILIZADAS
161
Introducción
III.1. Selective enrichment of 17 pyrethroids from lyophilised
agricultural samples
165
III.2. Multiresidue screening of pesticides in fruits using an
automatic solid-phase extraction system
185
III.3. Semiautomatic multiresidue gas chromatographic method
f th i f t bl f 25 hl i d
211

7/18/2019 Automatizacion y Miniaturizacion de Sistemas de Screening y Determinacion de Residuos de Plaguicidas en Muestra Agroalimentaria
http://slidepdf.com/reader/full/automatizacion-y-miniaturizacion-de-sistemas-de-screening-y-determinacion-de 18/393
Almudena Columé Díaz Tesis Doctoral
CAPITULO IV. PLAGUICIDAS ORGANOCLORADOS Y
PIRETROIDES EN MUESTRAS ACUOSAS
235
Introducción
IV.1. Evaluation of an automatic solid-phase extraction system
for the enrichment of organochlorine pesticides from waters
241
IV.2. Assessment of FTIR spectrometry for pesticide screening of
aqueous samples
263
CAPITULO V. ORGANOCLORADOS Y METABOLITOS DE
PIRETROIDES EN FLUIDOS BIOLOGICOS
283
Introducción
V.1. Solid-phase extraction method for the screening and
determination of pyrethroid metabolites and organochlorine
pesticides in human urine
289
CAPITULO VI. RESULTADOS Y CONCLUSIONES 309
VI.1. Discusión general de los resultados
Referencias
311
VI.2. Conclusiones más relevantes 367
VI.3. Futuras líneas de investigación 370
ANEXOS 375
A. Acrónimos 377
B. Producción científica fruto de esta Memoria 381

7/18/2019 Automatizacion y Miniaturizacion de Sistemas de Screening y Determinacion de Residuos de Plaguicidas en Muestra Agroalimentaria
http://slidepdf.com/reader/full/automatizacion-y-miniaturizacion-de-sistemas-de-screening-y-determinacion-de 19/393
OBJETO
OBJ ETO
AIM

7/18/2019 Automatizacion y Miniaturizacion de Sistemas de Screening y Determinacion de Residuos de Plaguicidas en Muestra Agroalimentaria
http://slidepdf.com/reader/full/automatizacion-y-miniaturizacion-de-sistemas-de-screening-y-determinacion-de 20/393

7/18/2019 Automatizacion y Miniaturizacion de Sistemas de Screening y Determinacion de Residuos de Plaguicidas en Muestra Agroalimentaria
http://slidepdf.com/reader/full/automatizacion-y-miniaturizacion-de-sistemas-de-screening-y-determinacion-de 21/393
Objeto
El objeto de esta Memoria se centra en la automatización de las operaciones
previas del proceso analítico para conseguir la simplificación y automatización del
mismo así como su aplicación directa a muestras con matrices complejas (frutas y
hortalizas). Esto permitirá conseguir ventajas sustanciales respecto a las metodologías
convencionales, en términos de calidad informativa (más y mejor) y de calidad
productiva (mínimos esfuerzos, costes y riesgos para el operador y el medio ambiente).
Además, se evalúa la posible contaminación por las especies determinadas (plaguicidas)
que experimenta la propia doctoranda durante el desarrollo de esta Memoria. Los
objetivos más específicos que se han marcado son:
a) Desarrollar analizadores de flujo automáticos basados en la
extracción en fase sólida para la limpieza de los extractos y
preconcentración de los plaguicidas en muestras hortofrutícolas.
b) Demostrar la utilidad de la liofilización de las muestras
hortofrutícolas en el ámbito de la determinación de residuos de plaguicidas.c) Desarrollar metodologías analíticas simples y rápidas que
permitan el screening/determinación de estos analitos en muestras de
interés agroalimentario, a niveles de concentración inferiores a los Límites

7/18/2019 Automatizacion y Miniaturizacion de Sistemas de Screening y Determinacion de Residuos de Plaguicidas en Muestra Agroalimentaria
http://slidepdf.com/reader/full/automatizacion-y-miniaturizacion-de-sistemas-de-screening-y-determinacion-de 22/393

7/18/2019 Automatizacion y Miniaturizacion de Sistemas de Screening y Determinacion de Residuos de Plaguicidas en Muestra Agroalimentaria
http://slidepdf.com/reader/full/automatizacion-y-miniaturizacion-de-sistemas-de-screening-y-determinacion-de 23/393
Aim
The aim of the work described in this Thesis was to automate the preliminary
operations of the analytical process with a view to simplifying and automating the
process itself, as well as to enable its direct application to samples having complex
matrices (viz. fruits and vegetables). This would result in substantial advantages with
respect to existing conventional methodologies in terms of information quality (viz.
more, better information) and production quality (viz. minimum effort, cost and hazards
for the operator and the environment). In addition, potential contamination with the
studied species (pesticides) of the doctorand herself during development of this work
was assessed. The specific goals of the research were as follows:
a) To develop automatic flow analysers based on solid-phase
extraction for sample clean-up and pesticide preconcentration from fruits
and vegetables.
b) To demonstrate the usefulness of freeze-drying fruit and
vegetables samples with a view to determining pesticide residues.c) To develop straightforward, expeditious analytical
methodologies for the screening and determination of the target analytes at
concentrations below the established Maximum Residues Limits (MRLs) in

7/18/2019 Automatizacion y Miniaturizacion de Sistemas de Screening y Determinacion de Residuos de Plaguicidas en Muestra Agroalimentaria
http://slidepdf.com/reader/full/automatizacion-y-miniaturizacion-de-sistemas-de-screening-y-determinacion-de 24/393

7/18/2019 Automatizacion y Miniaturizacion de Sistemas de Screening y Determinacion de Residuos de Plaguicidas en Muestra Agroalimentaria
http://slidepdf.com/reader/full/automatizacion-y-miniaturizacion-de-sistemas-de-screening-y-determinacion-de 25/393
INTRODUCCION
GENERAL
GENERAL
INTRODUCTION INTRODUCCION

7/18/2019 Automatizacion y Miniaturizacion de Sistemas de Screening y Determinacion de Residuos de Plaguicidas en Muestra Agroalimentaria
http://slidepdf.com/reader/full/automatizacion-y-miniaturizacion-de-sistemas-de-screening-y-determinacion-de 26/393
7/18/2019 Automatizacion y Miniaturizacion de Sistemas de Screening y Determinacion de Residuos de Plaguicidas en Muestra Agroalimentaria
http://slidepdf.com/reader/full/automatizacion-y-miniaturizacion-de-sistemas-de-screening-y-determinacion-de 27/393
Introducción General
En la Introducción General de esta Memoria se aborda en primer lugar una
panorámica general sobre los plaguicidas para continuar con la normativa vigente en
materia de toma de muestra y determinación de residuos de plaguicidas en alimentos de
origen vegetal y aguas potables. Finalmente, se recogen las metodologías desarrolladas
hasta la fecha en la determinación de residuos de plaguicidas organoclorados y
piretroides, concluyendo con las innovaciones aportadas por las nuevas tendencias en
química analítica en relación con la automatización, miniaturización y sistemas de
screening o criba.

7/18/2019 Automatizacion y Miniaturizacion de Sistemas de Screening y Determinacion de Residuos de Plaguicidas en Muestra Agroalimentaria
http://slidepdf.com/reader/full/automatizacion-y-miniaturizacion-de-sistemas-de-screening-y-determinacion-de 28/393

7/18/2019 Automatizacion y Miniaturizacion de Sistemas de Screening y Determinacion de Residuos de Plaguicidas en Muestra Agroalimentaria
http://slidepdf.com/reader/full/automatizacion-y-miniaturizacion-de-sistemas-de-screening-y-determinacion-de 29/393
Introducción General
El uso de plaguicidas en agricultura es actualmente el método más extendido en
el mundo para el control de plagas, así como de especies no deseadas que causen
perjuicio o que interfieran con la producción agropecuaria, por ejemplo, las que causen
daño durante su transporte o almacenamiento. Son elementos indispensables para
garantizar la cantidad, calidad y regularidad de las producciones agrícolas, y
difícilmente se puede imaginar la agricultura, tal como la tenemos concebida
actualmente, sin su utilización [1].
Sin embargo, hay que tener en cuenta que los plaguicidas son biocidas y, por
tanto, sustancias peligrosas. Su utilización supone un riesgo desde diferentes puntos de
vista: peligrosidad en su fabricación y formulación, peligrosidad para el aplicador que
pueda entrar en contacto con ellos al realizar el tratamiento, peligrosidad ecológica,
referida a su acción sobre el medio ambiente con sus secuelas de efectos secundarios
indeseables (desequilibrios biológicos, aparición de nuevas plagas, resistencias,
fitotoxicidades, acción sobre la fauna silvestre terrestre y acuática, etc.) y, por último,
peligrosidad para el consumidor de productos vegetales tratados a causa de los residuos
de plaguicidas que estos alimentos pudieran contener. Los problemas relacionados con
el uso de estas sustancias están adquiriendo una importancia creciente y la opinión
pública está ejerciendo una presión cada vez mayor [2]. De hecho, la reciente crisis delas dioxinas ha puesto claramente de manifiesto los riesgos relacionados con la
contaminación de los alimentos [1].
El sector agroalimentario tiene gran importancia en el conjunto de la economía

7/18/2019 Automatizacion y Miniaturizacion de Sistemas de Screening y Determinacion de Residuos de Plaguicidas en Muestra Agroalimentaria
http://slidepdf.com/reader/full/automatizacion-y-miniaturizacion-de-sistemas-de-screening-y-determinacion-de 30/393
Almudena Columé Díaz Tesis Doctoral
volumen de exportaciones que asciende a 50 000 millones de Euros al año [1]. La
importancia económica y la ubicuidad de los alimentos en nuestra vida sugieren que la
seguridad alimentaria ha de ser uno de los principales intereses del conjunto de la
sociedad y, especialmente de los poderes públicos y de los productores del sector. Una
política efectiva de seguridad alimentaria exige determinar y supervisar los riesgos para
la salud de los consumidores, siendo necesario para ello una serie de Reglamentaciones
y Normativas eficaces que gestionen estos riesgos y supervisen y garanticen la
aplicación de las mismas [1]. En este contexto, tanto la legislación española y
comunitaria, como la de otros países (US-FDA) y organismos internacionales (FAO,OMS), han establecido los llamados Límites Máximos de Residuos (LMRs), que para
un plaguicida y en un alimento determinado, se definen como la concentración máxima
de residuos de un plaguicida, en la superficie o en la parte interna de productos
alimenticios, para que se permita legalmente su uso para consumo humano y/o de
piensos [3,4]. Por “Residuo de plaguicida” se entiende cualquier sustancia
específicamente presente en el alimento o producto agrícola como consecuencia del
uso de un plaguicida, incluyendo cualquier derivado del mismo como productos de
conversión, metabolitos y productos de reacción [5].
Los datos sobre residuos de plaguicidas pueden utilizarse para comprobar elcumplimiento de los LMRs, servir de base a medidas de aplicación de la normativa o
evaluar la exposición de los consumidores a los plaguicidas. La determinación de estos
residuos en alimentos es difícil y resulta por ello fundamental disponer de métodos
7/18/2019 Automatizacion y Miniaturizacion de Sistemas de Screening y Determinacion de Residuos de Plaguicidas en Muestra Agroalimentaria
http://slidepdf.com/reader/full/automatizacion-y-miniaturizacion-de-sistemas-de-screening-y-determinacion-de 31/393
Introducción General Generalidades sobre Plaguicidas
1. GENERALIDADES SOBRE PLAGUICIDAS
La denominación de plaguicida incluye todas aquellas sustancias que se utilizan
para proteger los cultivos y los productos vegetales contra las enfermedades, el ataque
de insectos, los parásitos, las malas hierbas y los microorganismos dañinos [7].
1.1. COMPOSICION
En la formulación de un plaguicida sólo pueden estar presentes cuatro
compuestos, según queda establecido en la legislación española [8]:
• Ingrediente activo, o producto técnico, que es la sustancia que ejerce la
acción. No es un producto puro (pureza 75-95%) y necesita estar formulado con el resto
de los componentes para ejercer una correcta acción sobre las zonas de cultivo.
• Coadyuvantes, sustancias sin acción plaguicida pero que son fundamentales
para que el ingrediente activo realice su acción. Un ejemplo lo constituyen los
tensoactivos, que disminuyen la tensión superficial, con lo que el plaguicida disuelto en
el agua es capaz de extenderse más, aumentando el rendimiento de su aplicación, puesto
que la disolución impregna mucho mejor la superficie a tratar. Algunos son totalmente
inocuos.
• Productos inertes, sustancias sin acción plaguicida, que se usan para
modificar las condiciones de dosificación del plaguicida, por ejemplo, los disolventes.
Hay que señalar que algunos tienen carácter tóxico, como los disolventes orgánicos.
7/18/2019 Automatizacion y Miniaturizacion de Sistemas de Screening y Determinacion de Residuos de Plaguicidas en Muestra Agroalimentaria
http://slidepdf.com/reader/full/automatizacion-y-miniaturizacion-de-sistemas-de-screening-y-determinacion-de 32/393
Almudena Columé Díaz Tesis Doctoral
• Aditivos, sustancias sin acción plaguicida, que se añaden a la formulación
para cumplir determinadas restricciones legales, principalmente relativas a aspectos de
seguridad. Por ejemplo, se añaden repelentes que le dan mal olor a la formulación, o
colorantes que proporcionan un color fuerte a aquellas disoluciones incoloras de
plaguicidas que, por ello, puedan parecer inocuas.
1.2. NOMENCLATURA
Las normas ISO y otros organismos internacionales definen los nombres
comunes de los plaguicidas (ej. Lindano). También existen los nombres comerciales
que son diferentes según la casa comercial y su formulado (Lindano 25% EPAME
Gama 25, Inorgosa; Lindano 80% GAMOAN Flo, Aragonesas). El nombre químico
establecido por la IUPAC es el que identifica inequívocamente a la sustancia activa
(1,2,3,4,5,6-gamma-hexaclorociclohexano) [9].
Además, como identificación también inequívoca e internacional se establecen:
Chemical Abstracts name (C.A. name, (1α,2α,3β,4α,5α,6β,)-gamma-
hexaclorociclohexano), que es el nombre sistemático de acuerdo con las reglas
establecidas en 9th Collective Index period of the Chemical Abstracts Service y el
número de registro que dicho servicio le asigna (CAS RN, [58-89-9]) [9,10].

7/18/2019 Automatizacion y Miniaturizacion de Sistemas de Screening y Determinacion de Residuos de Plaguicidas en Muestra Agroalimentaria
http://slidepdf.com/reader/full/automatizacion-y-miniaturizacion-de-sistemas-de-screening-y-determinacion-de 33/393
Introducción General Generalidades sobre Plaguicidas
1.3. CLASIFICACIONES
Los plaguicidas pueden clasificarse [11] según los siguientes criterios:
• Naturaleza química:
Organoclorados
Piretroides
Piretrinas
Organoazufrados
Organofosforados
Aceites minerales
Clorofenoxi
Carbamatos
Carboxamidas
Tiocarbamatos
Ftalimidas
Organoestánnicos
Bipiridílicos
Dinitrofenoles
Triazinas
Tricloropicolínicos
Derivados de la urea
Compuestos de cobre
Guanidinas y naftoquinonas
Tricloroacéticos
• Toxicidad, según su peligro de ingestión:
Muy tóxicos DL50 oral <25 mg/Kg
Tóxicos DL50 oral: 25-200 mg/Kg
Nocivos DL50 oral: 200-2000 mg/Kg
Siendo la DL50: dosis letal de un tóxico que ingerida de una sola vez, produce
la muerte de un 50% de los animales de ensayo. Se expresa en miligramos del tóxico
por kilo de peso del animal ensayado y da una idea de la toxicidad relativa de diferentes
i

7/18/2019 Automatizacion y Miniaturizacion de Sistemas de Screening y Determinacion de Residuos de Plaguicidas en Muestra Agroalimentaria
http://slidepdf.com/reader/full/automatizacion-y-miniaturizacion-de-sistemas-de-screening-y-determinacion-de 34/393
Almudena Columé Díaz Tesis Doctoral
• Organismos que controlan:
Insecticidas
Acaricidas
Rodenticidas
Funguicidas
Nematicidas
Bactericidas
Molusquicidas
Avicidas
Herbicidas
Ovicidas
• Destino de aplicación:
Fitosanitario
Pecuario
Industria alimentaria
Forestal
Doméstico
Higiene personal
• Modos de acción:
De contacto
Sistémicos
Repelentes
De ingestión
Fumigantes
Defoliantes
Los más utilizados son los organoclorados, piretroides, organofosforados y
carbamatos. De entre ellos, los insecticidas, funguicidas y herbicidas copan el 95% del
mercado de la UE, con una distribución en función del destino de aplicación:
Sector agrario, 85%
Campañas sanitarias, 10%
(eliminación de vectores de enfermedades transmisibles por animales e
insectos)

7/18/2019 Automatizacion y Miniaturizacion de Sistemas de Screening y Determinacion de Residuos de Plaguicidas en Muestra Agroalimentaria
http://slidepdf.com/reader/full/automatizacion-y-miniaturizacion-de-sistemas-de-screening-y-determinacion-de 35/393
Introducción General Generalidades sobre Plaguicidas
1.4. CRONOLOGIA DEL DESARROLLO DE LOS PLAGUICIDAS
La progresión general del desarrollo de los plaguicidas ha variado desde los
altamente tóxicos y peligrosos, persistentes y con capacidad de bioacumulación (como
el DDT), hacia los plaguicidas que se degradan rápidamente en el medio ambiente y son
menos tóxicos para los organismos a los que no van dirigidos [12].
Tabla 1.4.1. Evolución de los plaguicidas.Periodo Ejemplos Procedencia Características1800-1920
Nitrofenoles,clorofenoles, creosato,naftaleno, aceites de petróleo
Química orgánica, productos colateralesde la producción delcarbón, etc.
La mayoría sinespecificidad y tóxicos para los usuarios y losorganismos a los que novan dirigidos
1945-1955
Organoclorados, DDT,HCH, ciclodienosclorados
Síntesis orgánica Persistentes, buenaselectividad, buenas propiedades agrícolas,resistentes, ecológicamentedañinos
1945-1970
Inhibidores de laacetilcolinesterasa,organofosforados,carbamatos
Síntesis orgánica, buenuso del binomioestructura-actividad
Menor persistencia, menostóxicos para los usuarios,algunos problemasmedioambientales
1970-1985
Piretroides sintéticos,avamectacina,mimetizadores dehormonas sexuales, plaguicidas biológicos
Refinamiento del binomio estructura-actividad, nuevossistemas hacia los quevan dirigidos
No demasiado selectivos,resistentes, costosos, persistencia variable
1985- Organismos deingeniería genética
Transferencia de genescon actividad plaguicida a otrosorganismos y dentro de plantas y animales beneficiosos.Alteración genética de plantas para hacerlasresistentes a los efectos
Posibles problemas conmutaciones, disrupción enla ecología microbiológica,monopolio de los productos

7/18/2019 Automatizacion y Miniaturizacion de Sistemas de Screening y Determinacion de Residuos de Plaguicidas en Muestra Agroalimentaria
http://slidepdf.com/reader/full/automatizacion-y-miniaturizacion-de-sistemas-de-screening-y-determinacion-de 36/393
Almudena Columé Díaz Tesis Doctoral
1.5. CONSIDERACIONES TOXICOLOGICAS
Como ya se ha comentado, los plaguicidas son biocidas, es decir, actúan contra
seres vivos. Los plaguicidas que normalmente se utilizan son de naturaleza química
muy variada y, en efecto, existen grandes diferencias en su modo de acción, penetración
en el organismo, metabolismo, eliminación y toxicidad para los seres humanos, lo que
hace difícil las generalizaciones sobre su peligrosidad [2].
La peligrosidad de los residuos de un plaguicida en concreto está determinada
por diversos factores, siendo los más destacados la toxicidad intrínseca de la molécula
del plaguicida, sus características físicas y químicas, las características del producto
técnico y de su formulación, su metabolismo y degradación en la planta después de su
aplicación, transformaciones metabólicas en el organismo humano y del grado de
exposición del hombre a los mismos [2,13].
a) Toxicidad propia de la molécula del plaguicida
Por toxicidad se entiende la cualidad que tiene una sustancia o sus metabolitos,
en ciertas dosis, de ocasionar un perjuicio a la salud. Podemos diferenciar entre
toxicidad aguda y toxicidad crónica, pero desde el punto de vista de los residuos, las
toxicidades agudas (dérmica, oral e inhalatoria) tienen un valor relativo, puesto que el
peligro de ingerir una dosis superior a la DL50 oral aguda, sólo ocurre por error,
ignorancia o suicidio. Por otra parte, plaguicidas con una DL50 oral aguda alta, es decir,
que son poco tóxicos ingeridos de una sola vez pueden ser muy peligrosos por
7/18/2019 Automatizacion y Miniaturizacion de Sistemas de Screening y Determinacion de Residuos de Plaguicidas en Muestra Agroalimentaria
http://slidepdf.com/reader/full/automatizacion-y-miniaturizacion-de-sistemas-de-screening-y-determinacion-de 37/393
Introducción General Generalidades sobre Plaguicidas
interesa más su toxicidad a corto y medio plazo (toxicidad subcrónica) y sobre todo a
largo plazo (toxicidad crónica). Estas toxicidades se determinan utilizando lotes de
animales a los que se les administra repetida y diariamente el tóxico, con diferentes
dietas.
En relación con esta toxicidad crónica interesa conocer los siguientes aspectos
[2]:
-Posibilidades cancerígenas.
-Efectos mutagénicos.
-Efectos teratogénicos o alteraciones en la reproducción.
-Efectos sobre la reacción inmunológica y sistemas endocrino y renal. Acción
hepática.
-Metabolismo de la sustancia en el organismo, con las características
toxicológicas de los metabolitos. Mecanismos de acción de estas sustancias.
-Neurotoxicidad.
-Posibles efectos retardados.
-Potenciación de / por los efectos de otros tóxicos.
Previamente a la homologación y registro de una materia activa, las autoridades
exigen un considerable estudio toxicológico de la misma. Las autoridades comunitarias
europeas fijan las exigencias al respecto en la Directiva relativa al registro y
comercialización de productos fitosanitarios [14]
7/18/2019 Automatizacion y Miniaturizacion de Sistemas de Screening y Determinacion de Residuos de Plaguicidas en Muestra Agroalimentaria
http://slidepdf.com/reader/full/automatizacion-y-miniaturizacion-de-sistemas-de-screening-y-determinacion-de 38/393
Almudena Columé Díaz Tesis Doctoral
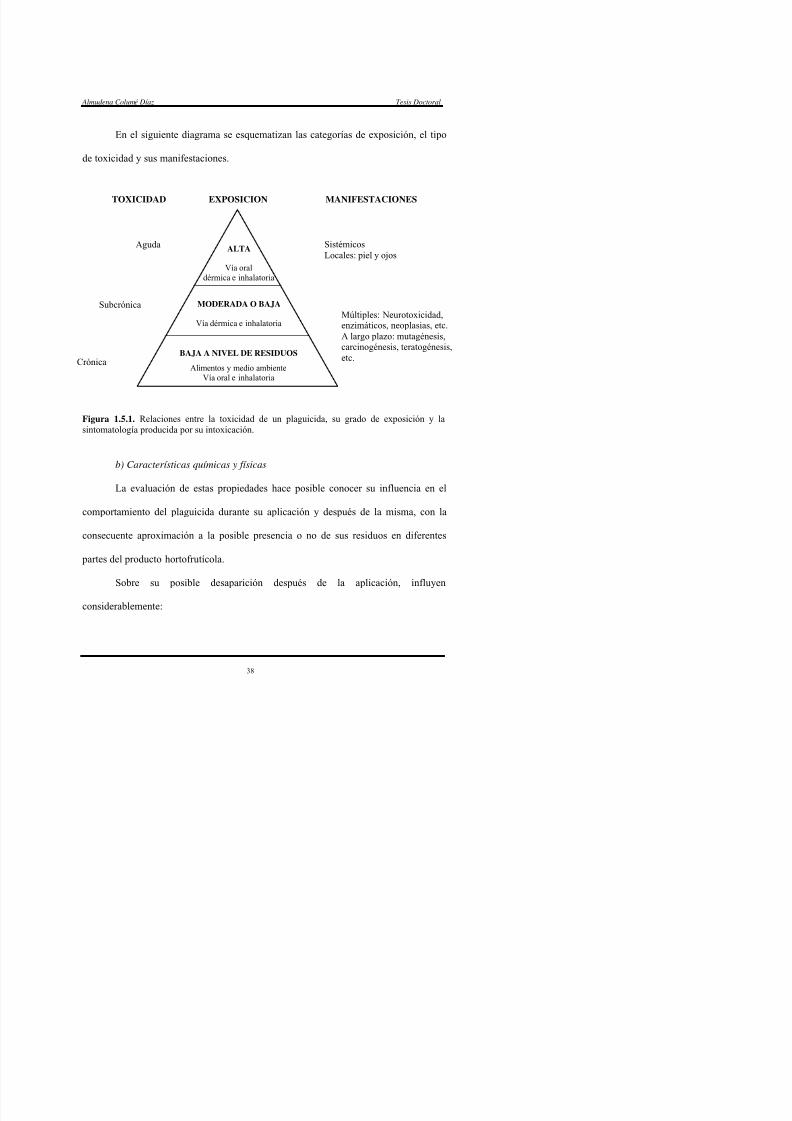
En el siguiente diagrama se esquematizan las categorías de exposición, el tipo
de toxicidad y sus manifestaciones.
Figura 1.5.1. Relaciones entre la toxicidad de un plaguicida, su grado de exposición y lasintomatología producida por su intoxicación.
b) Características químicas y físicas
La evaluación de estas propiedades hace posible conocer su influencia en el
comportamiento del plaguicida durante su aplicación y después de la misma, con la
consecuente aproximación a la posible presencia o no de sus residuos en diferentes
partes del producto hortofrutícola.
Sobre su posible desaparición después de la aplicación, influyen
considerablemente:
ALTA
Vía oraldérmica e inhalatoria
MODERADA O BAJA
Vía dérmica e inhalatoria
BAJA A NIVEL DE RESIDUOS
Alimentos y medio ambienteVía oral e inhalatoria
EXPOSICIONTOXICIDAD MANIFESTACIONES
Aguda
Subcrónica
Crónica
SistémicosLocales: piel y ojos
Múltiples: Neurotoxicidad,
enzimáticos, neoplasias, etc.A largo plazo: mutagénesis,carcinogénesis, teratogénesis,etc.

7/18/2019 Automatizacion y Miniaturizacion de Sistemas de Screening y Determinacion de Residuos de Plaguicidas en Muestra Agroalimentaria
http://slidepdf.com/reader/full/automatizacion-y-miniaturizacion-de-sistemas-de-screening-y-determinacion-de 39/393
Introducción General Generalidades sobre Plaguicidas
-Volatilidad.
-Estabilidad en disolución acuosa.
-Estabilidad a la radiación ultravioleta.
También es de gran interés la capacidad del plaguicida para penetrar en los
tejidos de la planta (o del hombre), lo cual depende de su solubilidad en agua y en
disolventes orgánicos, es decir, su coeficiente de partición en agua-octanol (K OW) [13].
c) Metabolismo y degradación en la planta después de su aplicación
Una de las principales vías de desaparición de los plaguicidas tras su aplicación,
es su degradación química y metabólica, en diferentes proporciones que dependen de
las características químicas del propio compuesto y de otras circunstancias, como son la
temperatura, humedad, luz, superficie de los cultivos, pH del líquido de la formulación,
composición de los suelos y otros factores. El estudio de su metabolismo proporciona
fundamentalmente información sobre la composición cuali y cuantitativa y del
comportamiento del compuesto y sus metabolitos, que a veces pueden ser moléculas
más tóxicas que las originales [2,13].
d) Transformaciones metabólicas en el organismo humano
El plaguicida, una vez absorbido, puede ser metabolizado en el organismo,
almacenado en el tejido adiposo, o bien excretado sin cambio alguno. En los animales
superiores las biotransformaciones sufridas por los plaguicidas se localizan

7/18/2019 Automatizacion y Miniaturizacion de Sistemas de Screening y Determinacion de Residuos de Plaguicidas en Muestra Agroalimentaria
http://slidepdf.com/reader/full/automatizacion-y-miniaturizacion-de-sistemas-de-screening-y-determinacion-de 40/393
Almudena Columé Díaz Tesis Doctoral
principalmente en el hígado. En general, las biotransformaciones [2] podrían
esquematizarse tal como sigue:
Figura 1.5.2. Esquema de las biotransformaciones que puede sufrir un plaguicida en unorganismo animal superior (R. Coscolla, 1993).
e) Características del producto técnico y su formulación
La materia activa de un plaguicida raramente se obtiene en un 100% de pureza,
ya que durante su síntesis pueden quedar impurezas que, a veces, pueden ser peligrosas.
Para una misma sustancia activa, distintos productos técnicos, pueden presentar distinta
peligrosidad desde el punto de vista de los residuos, según el proceso de fabricación, o
según su calidad, pudiendo contener o no, en mayor o menor proporción, determinadas
impurezas con significación toxicológica mayor incluso que la de la propia materia
Metabolito-2(hidrosoluble)Conjugación
Compuestosligados
Metabolito-1
IOxidación
Hígado
Plaguicida
II
Orina, bilis, heces
Eliminación
Acumulación entejido adiposo

7/18/2019 Automatizacion y Miniaturizacion de Sistemas de Screening y Determinacion de Residuos de Plaguicidas en Muestra Agroalimentaria
http://slidepdf.com/reader/full/automatizacion-y-miniaturizacion-de-sistemas-de-screening-y-determinacion-de 41/393
Introducción General Generalidades sobre Plaguicidas
Además, la formulación y los componentes de la misma pueden influir en la
peligrosidad de los residuos. Así, determinados coadyuvantes (disolventes,
tensoactivos, agentes de penetración, etc.) pueden exaltar la toxicidad propia de la
materia activa, por sinergismo o activación [2,13].
Por otro lado, además de todos estos factores que determinan la peligrosidad de
un plaguicida, hay que tener presente el posible efecto de acumulación a través de la
cadena alimentaria. El hombre no sólo ingiere alimentos de origen vegetal, sino
también de origen animal, donde se han podido acumular estos residuos. Cuando se
trata de residuos de cierta persistencia y son solubles en grasas, pueden acumularse en
los tejidos adiposos y grasa en general. De esta manera, puede darse una magnificación
o acumulación progresiva de los residuos a través de la cadena alimentaria [2].
f) Grado de exposición del ser humano a los residuos de plaguicidas
Podemos dividir la exposición en dos grandes grupos, la laboral y la
extralaboral. La primera afectaría a los trabajadores que están en contacto con las
formulaciones de plaguicidas en plantas de fabricación, formulación, transporte,
aplicadores y operarios, mientras que la segunda está relacionada con el consumo de
alimentos, de origen animal o vegetal, y agua [2,11].
En general, la exposición laboral está caracterizada por ser de duración variable
e intermitente, tener niveles de exposición muy diversos a un gran número de productos
cuya absorción dérmica varía en función del tipo de trabajo Así por ejemplo para un

7/18/2019 Automatizacion y Miniaturizacion de Sistemas de Screening y Determinacion de Residuos de Plaguicidas en Muestra Agroalimentaria
http://slidepdf.com/reader/full/automatizacion-y-miniaturizacion-de-sistemas-de-screening-y-determinacion-de 42/393
Almudena Columé Díaz Tesis Doctoral
-Tipo de cultivo: alto, bajo, frondoso, exterior, de invernadero.
-Técnica de aplicación, en función del tamaño de gota.
-Tipo de formulación, siendo en gránulo más seguro que en polvo.
-Condiciones climáticas, viento, temperatura, humedad.
-Tiempo de exposición.
-Actitud del trabajador y su formación.
Las fases de esta exposición laboral podríamos esquematizarlas de la siguiente
forma:
Figura 1.5.3. Exposición a plaguicidas sufrida por un aplicador y su relación con la dosis
absorbida.
Por otro lado, la exposición extralaboral depende de dos factores: a) los
tratamientos agrícolas que se efectúen en una determinada zona, que condicionarán el
tipo de plaguicida, la cantidad de residuos que quede según la dosis utilizada y la
AplicaciónPlaguicidas
Residuos enMedio Ambiente
Exposición Potencialdel Trabajador(Total, sin protección)
Exposición Realdel Trabajador
DosisAbsorbida
Pérdida
Plaguicidas
Exposición
PenetraciónRopa y guantes
Absorción
Dérmica
Oral yRespiratoria

7/18/2019 Automatizacion y Miniaturizacion de Sistemas de Screening y Determinacion de Residuos de Plaguicidas en Muestra Agroalimentaria
http://slidepdf.com/reader/full/automatizacion-y-miniaturizacion-de-sistemas-de-screening-y-determinacion-de 43/393
Introducción General Generalidades sobre Plaguicidas
se efectúen los tratamientos y de su frecuencia; y b) la composición de la dieta media de
la zona considerada, puesto que de esta manera se puede estimar la ingestión diaria
media de los distintos plaguicidas en una población en función de la proporción en que
se encuentran los alimentos en dicha dieta y de los residuos que cada uno de ellos pueda
contener [2].
Así pues, después de estas consideraciones de carácter toxicológico de los
plaguicidas, se podrían esquematizar los controles a llevar a cabo en la siguiente Figura.
Figura 1.5.4. Esquema de los tipos de controles a ejercer ante una exposición a plaguicidas.
SUSTANCIA
En aire, agua, suelos,alimentos
ABSORCIONDISTRIBUCIONMETABOLISMOEXCRECION
En sangre, orina, tejidos,exhudados
EFECTOSADVERSOS
Lesiones preclínicas y clínicas
CONTROL
MEDIOAMBIENTAL
CONTROLCLINICO
VIGILANCIAMEDICA
7/18/2019 Automatizacion y Miniaturizacion de Sistemas de Screening y Determinacion de Residuos de Plaguicidas en Muestra Agroalimentaria
http://slidepdf.com/reader/full/automatizacion-y-miniaturizacion-de-sistemas-de-screening-y-determinacion-de 44/393
Almudena Columé Díaz Tesis Doctoral
1.6. CONCEPTO Y CRITERIOS PARA LA FIJACION DE LMRs
Como hemos visto, la preocupación por los residuos de plaguicidas en los
alimentos, debido a sus características tóxicas, en relación con la salud humana, ha
llevado a que algunos plaguicidas tengan su uso completamente prohibido (DDT,
isómeros del HCH diferentes al lindano, etc.) y otros lo tengan más o menos
restringido. Los plaguicidas que más se utilizan tienen autorizado su empleo en
determinados cultivos pero se fijan unos límites máximos de residuos (LMRs) o
tolerancias en los alimentos con ellos tratados. Como ya se ha definido en el inicio de
esta Introducción, el LMR es la concentración máxima permitida de un residuo, en o
sobre un alimento, que puede aceptarse para el consumo humano (o animal) a largo
plazo, y que está estipulada por la ley [2].
Para fijar estos LMR, las autoridades (españolas, europeas, internacionales)
consideran dos criterios básicos: toxicológico y agronómico. En estos criterios se tiene
en cuenta que, por un lado, la ingestión diaria de plaguicidas sea menor que la que
pudiese provocar efectos tóxicos, y por otro lado, que en la aplicación agrícola del
plaguicida se alcance la eficacia adecuada para combatir la plaga en cuestión [2,13].
a) Criterio toxicológico
Para determinar la ingestión diaria de cada plaguicida que no provoque efectos
adversos en la salud, es necesario llevar a cabo una serie de cálculos para establecer los
valores de determinados parámetros [2 13]

7/18/2019 Automatizacion y Miniaturizacion de Sistemas de Screening y Determinacion de Residuos de Plaguicidas en Muestra Agroalimentaria
http://slidepdf.com/reader/full/automatizacion-y-miniaturizacion-de-sistemas-de-screening-y-determinacion-de 45/393
Introducción General Generalidades sobre Plaguicidas
El primer parámetro es el llamado NEL (non effect level), NOEL (non observed
effect level) o NOAEL (non observed adverse effect level), y representa la cantidad de
plaguicida que, ingerido diariamente durante toda la vida de los animales de
experimentación, no les provoca efectos adversos. El valor de NOEL se expresa en
miligramos de plaguicida por Kilogramo de peso del animal y día (mg/Kg/día). Este
valor se obtiene a partir de experimentos con animales, por lo que es necesario
extrapolarlo a la especie humana. Para ello, el valor del nivel sin efecto, establecido
para la especie animal más sensible, se divide por el coeficiente de seguridad 100,
establecido teniendo en cuenta la variabilidad interespecífica (entre especies) y la
intraespecífica (variabilidad dentro de una misma especie). De esta forma, se obtiene la
cantidad de residuo de plaguicida que, ingerida diariamente durante una vida entera, no
muestra riesgos apreciables, que se conoce como IDA (ingestión diaria admisible) y se
expresa como miligramos de plaguicida por Kilogramo de peso del hombre y día. Una
vez establecido este segundo parámetro, únicamente es necesario calcular el nivel
permisible de residuo para el hombre en alimentos. Para ello, basta con multiplicar el
valor IDA por el peso promedio del hombre (60 Kg) y dividirlo por el factor
alimentario. Este factor alimentario, expresado en Kilogramo, es el promedio per cápita
del consumo del alimento (o alimentos) que pudiesen contener los residuos del
plaguicida que se esté evaluando. De aquí la necesidad de conocer la dieta media de la
zona geográfica en cuestión. Este factor alimentario para productos hortofrutícolas en
los países europeos se estima en 0 4 Kg [2 13]

7/18/2019 Automatizacion y Miniaturizacion de Sistemas de Screening y Determinacion de Residuos de Plaguicidas en Muestra Agroalimentaria
http://slidepdf.com/reader/full/automatizacion-y-miniaturizacion-de-sistemas-de-screening-y-determinacion-de 46/393
Almudena Columé Díaz Tesis Doctoral
Por tanto, teniendo en cuenta todo lo expuesto, para el cálculo del nivel
permisible (expresado en miligramos plaguicida por Kilogramo de alimento, o sea,
ppm) de un plaguicida en un producto vegetal, habría que seguir la ecuación:
Algunos autores [2] opinan que la IDA debería repartirse entre los alimentos de
origen vegetal y el agua de bebida, asignándole a ésta entre 1-10% del valor de la IDA.
b) Criterio agronómico
Basándose en las condiciones establecidas en las Buenas Prácticas Agrícolas, se
efectúan ensayos de campo para estimar la cantidad de residuo de plaguicida que queda
en los alimentos tras efectuar los tratamientos. De esta manera, y puesto que las
condiciones de empleo del plaguicida han de ser las mínimas necesarias y suficientes
para lograr el grado de protección deseado, la cantidad de residuo será la mínima
derivada de ese uso racional del plaguicida [2,13].
Por tanto, el LMR será fijado normalmente como el valor de ese residuo
mínimo que quede en el alimento tras aplicarse el plaguicida según las Buenas Prácticas
Agrícolas, siempre que éste sea inferior al nivel permisible calculado sobre la base de la
IDA Si el valor fuese superior el plaguicida no podría autorizarse o bien estar
Kg)(0.4oalimentariFactor seguridad deFactor
Kghumanocuerpo promedioPeso NOEL permisiblenivel
×
×=
)100(
)60(

7/18/2019 Automatizacion y Miniaturizacion de Sistemas de Screening y Determinacion de Residuos de Plaguicidas en Muestra Agroalimentaria
http://slidepdf.com/reader/full/automatizacion-y-miniaturizacion-de-sistemas-de-screening-y-determinacion-de 47/393
Introducción General Generalidades sobre Plaguicidas
restringido su uso sólo a un número de cultivos de forma que no se superase ese valor
del nivel permisible [2,13].
En algunas ocasiones, el nivel de residuos presentes en un alimento tras el
tratamiento del cultivo con un plaguicida, siempre siguiendo las Buenas Prácticas
Agrícolas, es tan bajo que resulta difícil medirlo con los métodos analíticos actuales. En
base a este hecho nacen los LMRs establecidos al nivel de determinación. Estos límites
están indicados con un asterisco después del valor numérico establecido como LMR
(0.02*), y están referidos al límite de determinación práctico, diferente del establecido
para cada método analítico concreto [13].
Por último, y como conclusión, decir que un LMR muy bajo puede deberse,
además de lo expuesto para el límite de determinación, a que:
-El plaguicida tenga una elevada toxicidad crónica.
-La plaga en cuestión sea de escasa gravedad.
-La plaga requiera poca dosis.
-La aplicación del plaguicida se produzca mucho antes de la recolección, por
ser en ese periodo cuando es posible el ataque de la plaga.
Y en cuanto a un valor cercano a cero, por:
-Plaguicida no autorizado en un país concreto porque no practique el cultivo en
el cual se emplea.
-La plaga que combate el plaguicida no se encuentra presente en determinado
país
7/18/2019 Automatizacion y Miniaturizacion de Sistemas de Screening y Determinacion de Residuos de Plaguicidas en Muestra Agroalimentaria
http://slidepdf.com/reader/full/automatizacion-y-miniaturizacion-de-sistemas-de-screening-y-determinacion-de 48/393
Almudena Columé Díaz Tesis Doctoral
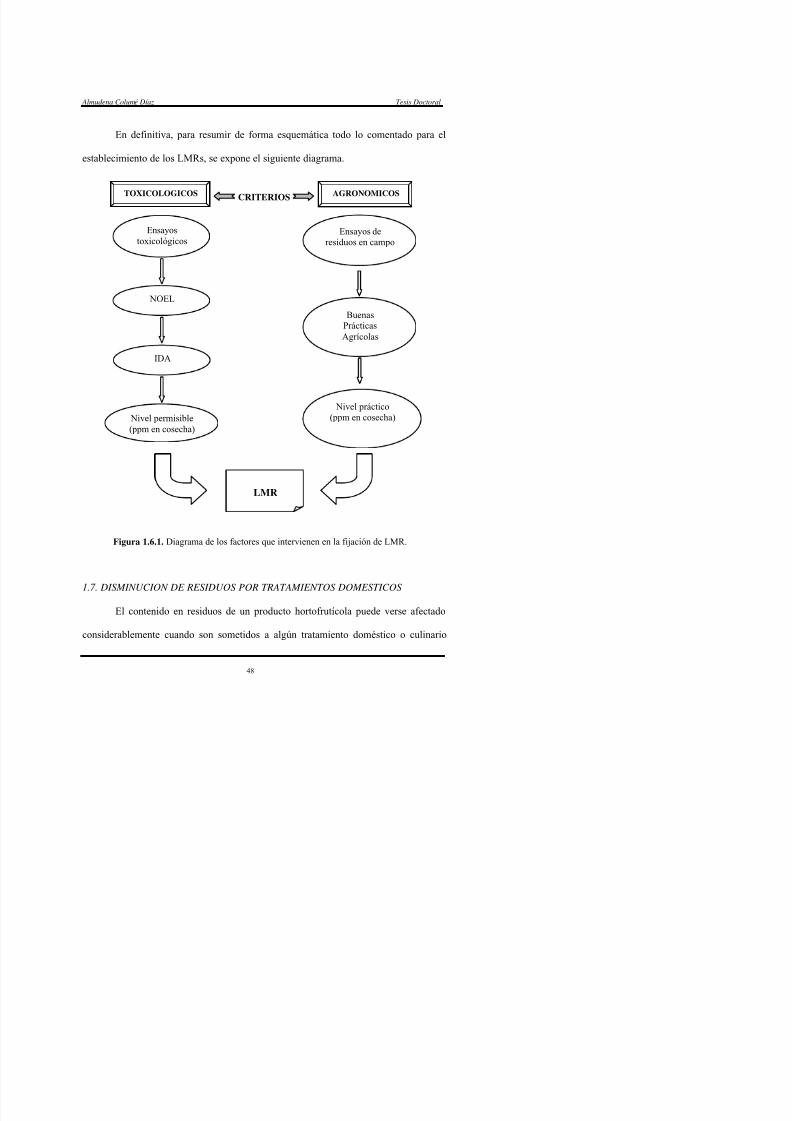
En definitiva, para resumir de forma esquemática todo lo comentado para el
establecimiento de los LMRs, se expone el siguiente diagrama.
Figura 1.6.1. Diagrama de los factores que intervienen en la fijación de LMR.
1.7. DISMINUCION DE RESIDUOS POR TRATAMIENTOS DOMESTICOS
El id id d d h f í l d f d
Ensayostoxicológicos
NOEL
IDA
Nivel permisible(ppm en cosecha)
Ensayos deresiduos en campo
BuenasPrácticasAgrícolas
Nivel práctico(ppm en cosecha)
LMR
TOXICOLOGICOS AGRONOMICOSCRITERIOS
7/18/2019 Automatizacion y Miniaturizacion de Sistemas de Screening y Determinacion de Residuos de Plaguicidas en Muestra Agroalimentaria
http://slidepdf.com/reader/full/automatizacion-y-miniaturizacion-de-sistemas-de-screening-y-determinacion-de 49/393
Introducción General Generalidades sobre Plaguicidas
antes de ser consumidos. Esta eliminación puede ser más o menos intensa dependiendo
del tipo de plaguicida, de su localización en el alimento, del tipo de alimento y de la
naturaleza e intensidad del tratamiento aplicado. Por otro lado, el efecto final de estos
tratamientos es aditivo, por lo cual, la cantidad de residuos presentes en el alimento
puede verse disminuida notablemente e incluso eliminada [2,15].
De esta manera, lavar los productos frescos antes de ser consumidos es un
hábito muy saludable, ya que se pueden reducir y, a menudo, eliminar los posibles
residuos presentes en los vegetales y frutas. Lógicamente, la efectividad de este
tratamiento será mayor cuando se trate de plaguicidas hidrosolubles, aunque el efecto
mecánico del lavado también juega un papel importante. Así, el lavado debe hacerse
con abundante agua y, si es posible, frotarla con un cepillo, puesto que la mayor
proporción de los plaguicidas se queda en la superficie de estos productos
hortofrutícolas. Por esta misma razón, también es importante pelar las frutas y
hortalizas, así como eliminar las primeras hojas de verduras como la lechuga. De hecho,
en los cítricos, con gran cantidad de aceites esenciales en su corteza, los plaguicidas
liposolubles se quedan acumulados en dicha corteza sin pasar a la pulpa. Por último, la
cocción o cualquier tratamiento con calor, favorece la degradación de los residuos, que
normalmente se transformarán en compuestos menos tóxicos o inocuos (hay algunas
excepciones, como los residuos de etilenbisditiocarbamatos, que al degradarse por la
acción del calor dan lugar a un metabolito algo más tóxico) [2,15].

7/18/2019 Automatizacion y Miniaturizacion de Sistemas de Screening y Determinacion de Residuos de Plaguicidas en Muestra Agroalimentaria
http://slidepdf.com/reader/full/automatizacion-y-miniaturizacion-de-sistemas-de-screening-y-determinacion-de 50/393
Almudena Columé Díaz Tesis Doctoral
1.8. LEGISLACION APLICABLE SOBRE LMRs
La normativa sobre los niveles máximos de residuos se inició en Europa en los
años 60 y 70, y ha sufrido numerosas modificaciones posteriores. En España, la primera
lista de LMRs se promulgó en 1979, pero ésta ha sido sustituida y derogada varias
veces hasta la entrada de España en la Unión Europea. A partir de ese momento, la
legislación española sobre plaguicidas surge por trasposición de la europea, a la que se
suman los LMRs que la legislación europea aún no contempla pero que la española ha
ido estableciendo y, por tanto, son de obligado cumplimiento en el territorio español.
La legislación europea recoge estos listados en Directivas que publica en el
Boletín Oficial de las Comunidades Europeas (DOCE). De esta forma, al tratarse de
Directivas Comunitarias afectan a todo el ámbito de la UE, marcando un plazo para su
transposición a la legislación de cada Estado Miembro, trascurrido el cual, son de
obligado cumplimiento en todo el territorio de la UE. A continuación se expone la
relación de las Directivas Comunitarias publicadas en DOCE a fecha de 15 de
Septiembre de 2001, relativas a la fijación de los contenidos máximos de residuos de
plaguicidas en las frutas y hortalizas, teniendo en cuenta que las tres últimas (Directivas
2001/39/CE, 2001/48/CE y 2001/57/CE) no entran en vigor hasta el año 2002.
Legislación Comunitaria:
• Directiva 76/895/CEE, de 23 de noviembre de 1976.
• Directiva 80/428/CEE de 28 de marzo de 1980

7/18/2019 Automatizacion y Miniaturizacion de Sistemas de Screening y Determinacion de Residuos de Plaguicidas en Muestra Agroalimentaria
http://slidepdf.com/reader/full/automatizacion-y-miniaturizacion-de-sistemas-de-screening-y-determinacion-de 51/393
Introducción General Generalidades sobre Plaguicidas
• Directiva 82/528/CEE, de 19 de julio de 1982.
• Directiva 88/298/CEE, de 16 de mayo de 1988.
• Directiva 89/186/CEE, de 06 de marzo de 1989.
• Directiva 90/642/CEE, de 27 de noviembre de 1990.
• Directiva 93/58/CEE, de 29 de junio de 1993.
• Directiva 94/30/CE, de 23 de junio de 1994.
• Directiva 95/38/CE de 17 de julio de 1995.
• Directiva 95/61/CE de 29 de noviembre de 1995.
• Directiva 96/32/CE de 21 de mayo de 1996.
• Directiva 97/41/CE de 25 de mayo de 1997.
• Directiva 97/71/CE de 18 de diciembre de 1997.
• Directiva 98/82/CE de 27 de octubre de 1998.
• Directiva 99/65/CE de 24 de junio de 1999.
• Directiva 99/71/CE de 14 de julio de 1999.
• Directiva 2000/24/CE de 28 de abril de 2000.
• Directiva 2000/42/CE de 22 de junio de 2000.
• Directiva 2000/48/CE de 25 de julio de 2000.
• Directiva 2000/57/CE de 22 de septiembre de 2000.
• Directiva 2000/58/CE de 22 de septiembre de 2000.
• Directiva 2000/81/CE de 18 de diciembre de 2000.

7/18/2019 Automatizacion y Miniaturizacion de Sistemas de Screening y Determinacion de Residuos de Plaguicidas en Muestra Agroalimentaria
http://slidepdf.com/reader/full/automatizacion-y-miniaturizacion-de-sistemas-de-screening-y-determinacion-de 52/393
Almudena Columé Díaz Tesis Doctoral
• Directiva 2001/39/CE de 23 de mayo de 2001.
Entrada en vigor en EEMM: 01-01-02.
• Directiva 2001/48/CE de 28 de junio de 2001.
Entrada en vigor en EEMM: 01-03-02.
• Directiva 2001/57/CE de 25 de julio de 2001.
Entrada en vigor en EEMM: 01-03-02.
Por otro lado, la legislación española publica los listados de LMRs de
plaguicidas y su control en determinados productos de origen vegetal en el Boletín
Oficial del Estado (BOE), mediante Reales Decretos y Ordenes Ministeriales. La
relación de la normativa vigente en el Estado Español a 15 de septiembre de 2001 se
expone seguidamente.
Legislación Española:
• Real decreto 280/1994.
• Orden de 27 de febrero de 1996.
• Orden de 5 de diciembre de 1996.
• Orden de 26 de agosto de 1997.
• Orden de 25 de septiembre de 1997.
• Orden de 14 de mayo de 1998.

7/18/2019 Automatizacion y Miniaturizacion de Sistemas de Screening y Determinacion de Residuos de Plaguicidas en Muestra Agroalimentaria
http://slidepdf.com/reader/full/automatizacion-y-miniaturizacion-de-sistemas-de-screening-y-determinacion-de 53/393
Introducción General Generalidades sobre Plaguicidas
• Real decreto 198/2000.
• Orden de 3 de marzo de 2000.
• Orden de 14 de marzo de 2000.
• Orden de 12 de abril de 2000 .
• Orden de 1 de diciembre de 2000.
• Orden de 22 de enero de 2001.
• Orden de 27 de marzo de 2001.
Teniendo en cuenta la legislación presentada, tanto española como comunitaria,se ha elaborado la relación de los LMRs establecidos para los plaguicidas estudiados en
los diferentes productos hortofrutícolas abordados en esta Memoria y que se exponen a
continuación. Para la correcta interpretación de estas tablas hay que aclarar que en
ocasiones el LMR no ha sido aún establecido por la UE pero sí por España, o que, sólo
ocasionalmente, no es el mismo. Por tanto, si el LMR es común, sólo aparecerá un
valor, mientras que cuando no lo sea se indicará al pie de la Tabla el establecido por la
UE. También se encuentran indicados en la tabla aquellos plaguicidas cuyo uso está
prohibido en España. Merece la pena destacar el hecho de que las Directivas
Comunitarias que aún no han sido traspuestas a la legislación española no afectan a los
plaguicidas contemplados en la Memoria, y que, por tanto, la legislación que
actualmente se les aplica continuará vigente.

7/18/2019 Automatizacion y Miniaturizacion de Sistemas de Screening y Determinacion de Residuos de Plaguicidas en Muestra Agroalimentaria
http://slidepdf.com/reader/full/automatizacion-y-miniaturizacion-de-sistemas-de-screening-y-determinacion-de 54/393
Tabla 1.8.1. Valores de LMR (mg/Kg) establecidos en frutas para los plaguicidas organoclorados contemplados en estaMemoria, según la legislación española y comunitaria.
Plaguicida Naranja Manzana Pera Cereza Melocotón Nectarina Ciruela Fresa Plátano Kiwi Melón
HCH (α+β+δ)a,b 0.02* 0.02* 0.02* 0.02* 0.02* 0.02* 0.02* 0.02* 0.02* 0.02* 0.02* HCB a,b 0.01* 0.01* 0.01* 0.01* 0.01* 0.01* 0.01* 0.01* 0.01* 0.01* 0.01* Diclorán b 0.50 2.00 2.00 0.01 0.01 0.01 0.01 5.00 0.01 0.01 5.00
Lindano 1.00 1.00 1.00 0.50 0.50 0.50 0.50 1.00 1.00 1.00 1.00
Vinclozolina 0.05* 1.00 1.00 0.50 0.05* 0.05* 2.00 5.00 0.05* 10.00 1.00
Heptacloro a 0.01* 0.01* 0.01* 0.01* 0.01* 0.01* 0.01* 0.01* 0.01* 0.01* 0.01*
Diclofuanida 5.00 5.00 5.00 5.00 5.00 5.00 5 .00 10.00 5.00 5.00 5.00
Aldrína,b,c +Dieldrína,b,c
0.01* 0.01* 0.01* 0.01* 0.01* 0.01* 0.01* 0.01* 0.01* 0.01* 0.01*
Dicofol 2.00 0.02* 0.02* 0.02* 0.02* 0.02* 0.02* 0.02* 0.02* 0.02* 0.50
Captán 0.50e 3.00 3.00 2.00 2.00 2.00 2.00 3.00 0.10* 0.10* 0.10*
Procimidona 0.02* 0.02* 1.00 0.02* 2.00 2.00 2.00 5.00 0.02* 5.00 1.00
Clorbenside a 0.01* 0.01* 0.01* 0.01* 0.01* 0.01* 0.01* 0.01* 0.01* 0.01* 0.01*
Clordane a,b 0.01* 0.01* 0.01* 0.01* 0.01* 0.01* 0.01* 0.01* 0.01* 0.01* 0.01* Endosulfánd (α+β+sulfato)
0.50 0.30 0.30 0.05* 0.50 0.50 0.05* 0.05* 0.05* 0.05* 0.30
Endrín a 0.01* 0.01* 0.01* 0.01* 0.01* 0.01* 0.01* 0.01* 0.01* 0.01* 0.01*
Iprodiona 5.00e 10.00 10.00 5.00 5.00 5.00 5.00 10.00 3.00 5.00 0.30
Captafol a 0.02* 0.02* 0.02* 0.02* 0.02* 0.02* 0.02* 0.02* 0.02* 0.02* 0.02*
Metoxicloro 0.01* 0.01* 0.01* 0.01* 0.01* 0.01* 0.01* 0.01* 0.01* 0.01* 0.01*aPlaguicida de uso prohibido en España; bLMR no establecidos por la UE; cSuma de aldrín y dieldrín, expresado como dieldrín;dSuma de alfa y beta endosulfán y sulfato; eValor establecido por la UE en 0.02*; *Indica el límite de determinación analítica.

7/18/2019 Automatizacion y Miniaturizacion de Sistemas de Screening y Determinacion de Residuos de Plaguicidas en Muestra Agroalimentaria
http://slidepdf.com/reader/full/automatizacion-y-miniaturizacion-de-sistemas-de-screening-y-determinacion-de 55/393
Tabla 1.8.2. Valores de LMR (mg/Kg) establecidos en hortalizas para los plaguicidas organoclorados contemplados en estaMemoria, según la legislación española y comunitaria.
Plaguicida Zanahoria Cebolla Tomate Pimiento Berenjena Pepino Coliflor Lechuga Espinaca Acelga Champiñón Patata
HCH (α+β+δ)a,b 0.02* 0.02* 0.02* 0.02* 0.02* 0.02* 0.02* 0.02* 0.02* 0.02* 0.02* 0.02* HCB a,b 0.01* 0.01* 0.01* 0.01* 0.01* 0.01* 0.01* 0.01* 0.01* 0.01* 0.01* 0.01* Diclorán b 0.01 0.01 5.00 0.01 5.00 5.00 0.01 5.00 0.01 0.01 0.01 0.01 Lindano 0.10 1.00 0.50 1.00 1.00 1.00 1.00 2.00 2.00 2.00 1.00 0.10e
Vinclozolina 0.50 1.00 0.05* 3.00 3.00 1.00 0.05* 5.00 0.05* 0.05* 0.05* 0.05*
Heptacloro a 0.01* 0.01* 0.01* 0.01* 0.01* 0.01* 0.01* 0.01* 0.01* 0.01* 0.01* 0.01* Diclofuanida 5.00 5.00 5.00 5.00 5.00 5.00 5.00 10.00 5.00 5.00 5.00 0.10
Aldrín a,b,c +Dieldrín a,b,c
0.01* 0.01* 0.01* 0.01* 0.01* 0.01* 0.01* 0.01* 0.01* 0.01* 0.01* 0.01* Dicofol 0.02* 0.02* 0.02e 0.02* 0.02* 0.20 0.02* 0.02* 0.02* 0.02* 0.02* 0.02*
Captán 0.10* 0.10* 3.00 0.10* 3.00 0.10* 0.10* 2.00 0.10* 0.10* 0.10* 0.10* Procimidona 0.02* 0.20 2.00 2.00 2.00 1.00 0.02* 5.00 0.02* 0.02* 0.02* 0.02*
Clorbenside a 0.01* 0.01* 0.01* 0.01* 0.01* 0.01* 0.01* 0.01* 0.01* 0.01* 0.01* 0.01*
Clordane a,b 0.01* 0.01* 0.01* 0.01* 0.01* 0.01* 0.01* 0.01* 0.01* 0.01* 0.01* 0.01* Endosulfánd (α+β+sulfato)
0.05* 0.05* 0.50 0.05* 0.05* 0.05* 0.05* 0.05* 0.05* 0.05* 0.05* 0.05*
Endrín
a
0.01* 0.01* 0.01* 0.01* 0.01* 0.01* 0.01* 0.01* 0.01* 0.01* 0.01* 0.01*Iprodiona 0.30 5 .00 5.00 5.00 5.00 2.00 0.05 10.00 0.02* 0.02* 0.02* 0.02*
Captafol a 0.02* 0.02* 0.02* 0.02* 0.02* 0.02* 0.02* 0.02* 0.02* 0.02* 0.02* 0.02*
Metoxicloro 0.01* 0.01* 0.01* 0.01* 0.01* 0.01* 0.01* 0.01* 0.01* 0.01* 0.01* 0.01*aPlaguicida de uso prohibido en España; bLMR no establecidos por la UE; cSuma de aldrín y dieldrín, expresado como dieldrín;dSuma de alfa y beta endosulfán y sulfato; eValor establecido por la UE en 1.00; *Indica el límite de determinación analítica.

7/18/2019 Automatizacion y Miniaturizacion de Sistemas de Screening y Determinacion de Residuos de Plaguicidas en Muestra Agroalimentaria
http://slidepdf.com/reader/full/automatizacion-y-miniaturizacion-de-sistemas-de-screening-y-determinacion-de 56/393
Tabla 1.8.3. Valores de LMR (mg/Kg) establecidos en frutas para los plaguicidas piretroides contemplados en esta Memoria,según la legislación española y comunitaria.
Plaguicida Naranja Manzana Pera Cereza Melocotón Nectarina Ciruela Fresa Plátano Kiwi Melón
Butóxido de piperoniloa
0.50 0.50 0.50 0.50 0.50 0.50 0.50 0.50 0.50 0.50 0.50
Bifentrína 0.10 0.20 0.20 0.01* 0.20 0.20 0.01* 0.50 0.01* 0.01* 0.20
Fenpropatrína 2.00 0.10 0.10 0.02 0.02 0.02 0.02 0.02 0.02 0.02 0.10
λ-Cihalotrín 0.02* 0.10 0.10 0.10 0.20 0.20 0.10 0.50 0.02* 0.02* 0.05
Permetrín(cis+trans) 0.50 1.00 1.00 1.00 1.00 1.00 1.00 1.00 0.05* 1.00 0.10 Ciflutrín(I+II+III+IV)
0.02* 0.20 0.20 0.20 0.50 0.50 0.20 0.02* 0.02* 0.02* 0.02*
Cipermetrín(I+II+III+IV)
2.00 1 .00 1.00 1.00 2.00 2.00 1.00 0.05* 0.05* 0.05* 0.20
Cis-Fenvalerato
0.02* 0.05 0.02* 0.02* 0.02* 0.02* 0.02* 0.02* 0.02* 0.02* 0.02*
Trans-Fenvalerato
0.02* 0.02* 0.02* 0.02* 0.02* 0.02* 0.02* 0.02* 0.02* 0.02* 0.02*
Deltametrín 0.05* 0.10 0.10 0.10 0.10 0.10 0.10 0.05* 0.05* 0.05* 0.05* aLMR no establecidos por la UE; *Indica el límite de determinación analítica.

7/18/2019 Automatizacion y Miniaturizacion de Sistemas de Screening y Determinacion de Residuos de Plaguicidas en Muestra Agroalimentaria
http://slidepdf.com/reader/full/automatizacion-y-miniaturizacion-de-sistemas-de-screening-y-determinacion-de 57/393
Tabla 1.8.4. Valores de LMR (mg/Kg) establecidos en hortalizas para los plaguicidas piretroides contemplados en esta Memoria,según la legislación española y comunitaria.
Plaguicida Zanahoria Cebolla Tomate Pimiento Berenjena Pepino Coliflor Lechuga Espinaca Acelga Champiñón Patata
Butóxido dePiperoniloa 0.50 0.50 0.50 0.50 0.50 0.50 0.50 0.50 0.50 0.50 0.50 0.50
Bifentrína 0.01* 0.01* 0.20 0.20 0.01* 0.01* 0.01* 0.01* 0.01* 0.01* 0.01* 0.01*
Fenpropatrína 0.02 0.02 0.50 0.50 0.50 0.10 0.02 0.02 0.02 0.02 0.02 0.02
λ-Cihalotrín 0.02* 0.02* 0.50 0.10 0.50 0.10 0.10 1.00 0.02* 0.02* 0.02* 0.02*Permetrín(cis+trans)
0.05* 0.05* 0.50 0.50 0.50 0.10 0.10 2.00 1.00 1.00 0.05* 0.05* Ciflutrín(I+II+III+IV)
0.02* 0.02* 0.05 0.30* 0.02* 0.10 0.05 0.50 0.02* 0.02* 0.02* 0.02*
Cipermetrín(I+II+III+IV)
0.05* 0.10 0.50 0.50 0.50 0.20 0.50 2.00 0.50 0.50 0.05* 0.05*
Cis-Fenvalerato
0.02* 0.02* 0.05* 0.02* 0.02* 0.02* 0.02* 0.02* 0.02* 0.02* 0.02* 0.02*
Trans-Fenvalerato
0.02* 0.02* 0.02* 0.02* 0.02* 0.02* 0.02* 0.02* 0.02* 0.02* 0.02* 0.02*
Deltametrín 0.05* 0.10 0.20 0.20 0.20 0.10 0.10 0.50 0.50 0.50 0.05* 0.05* b
0.50
c
aLMR no establecidos por la UE; bValor establecido para patatas tempranas; cValor establecido para patatas paraalmacenar; *Indica el límite de determinación analítica.

7/18/2019 Automatizacion y Miniaturizacion de Sistemas de Screening y Determinacion de Residuos de Plaguicidas en Muestra Agroalimentaria
http://slidepdf.com/reader/full/automatizacion-y-miniaturizacion-de-sistemas-de-screening-y-determinacion-de 58/393
Almudena Columé Díaz Tesis Doctoral
En lo referente a las aguas de consumo público, la legislación europea [16] y la
española [17], fijan la presencia de residuos con un único LMR establecido para
plaguicidas de forma individual e independientemente del compuesto que se trate, con
una valor de 0.1 microgramos por litro de muestra acuosa. A su vez, también establece
otro LMR para la cantidad global de plaguicidas presentes, es decir, la suma de las
diferentes cantidades de plaguicidas presentes en la muestra acuosa y, que en este caso,
está fijado en 0.5 microgramos por litro de muestra acuosa.
1.9. PRECEDENTES LEGISLATIVOS DE LOS PLAGUICIDAS OBJETO DE ESTA
TESIS DOCTORAL
Dentro del gran grupo de los plaguicidas, los organoclorados constituyen una
de las familias más antiguas, remontándose su utilización a las décadas de los 40 y 50.
Sus características hacen que sean muy persistentes gracias a su resistencia y capacidad
de acumulación en tejido adiposo y, aunque eficaces, son muy dañinos para el medio
ambiente y el hombre. Es por ello que algunos, generalmente los más antiguos y
tóxicos, están prohibidos, como es el caso del DDT. De hecho, los residuos de DDT, a
pesar de encontrarse prohibido su empleo desde los 70, se encuentran presentes hoy día
en suelos, aguas, etc., debido a su poder de acumulación y resistencia. La legislación
contempla estos hechos adjudicando LMRs al nivel de detección analítica para aquellos
plaguicidas prohibidos y, por otro lado, fijándolos para el resto de plaguicidas
organoclorados en valores en torno a 50 ng/g, en la mayor parte de los casos.

7/18/2019 Automatizacion y Miniaturizacion de Sistemas de Screening y Determinacion de Residuos de Plaguicidas en Muestra Agroalimentaria
http://slidepdf.com/reader/full/automatizacion-y-miniaturizacion-de-sistemas-de-screening-y-determinacion-de 59/393
Introducción General Generalidades sobre Plaguicidas
En cuanto a los piretroides, es éste un grupo de creación mucho más reciente
(años 70-80). Aparecen como los derivados sintéticos de las piretrinas, insecticidas
naturales de origen vegetal bastante caros. Estos plaguicidas son ya menos tóxicos que
los organoclorados gracias, principalmente, a su menor persistencia. Cabría esperar, por
tanto, que sus LMRs fuesen más elevados y, aunque superiores que para la mayoría de
los plaguicidas organoclorados, tampoco lo son de manera excesiva. De hecho, sus
LMRs se sitúan entre 100 y 500 ng/g. Esto se debe a que, como ya ha sido comentado,
los LMRs no se fijan teniendo en cuenta únicamente los criterios toxicológicos de los
plaguicidas, sino también los agrícolas. Así, y puesto que son poco persistentes, tras
efectuar los tratamientos bajo las normas de las Buenas Prácticas Agrícolas, la
presencia de residuos en los productos ha de ser mínima. Aunque la práctica totalidad
de los plaguicidas piretroides tienen su utilización permitida debido a sus
características, no por ello los órganos de vigilancia de la UE (y otros organismos)
dejan de tenerlos en cuenta en sus evaluaciones periódicas. De hecho, el empleo de
fenvalerato se está cuestionando y es por ello que su LMR ha sido reducido en poco
tiempo, hallándose actualmente fijado en el límite de determinación analítica (0.02*
ng/g).

7/18/2019 Automatizacion y Miniaturizacion de Sistemas de Screening y Determinacion de Residuos de Plaguicidas en Muestra Agroalimentaria
http://slidepdf.com/reader/full/automatizacion-y-miniaturizacion-de-sistemas-de-screening-y-determinacion-de 60/393
Almudena Columé Díaz Tesis Doctoral
2. TOMA DE MUESTRA
2.1. TOMA DE MUESTRA EN PRODUCTOS HORTOFRUTICOLAS
El objetivo de la toma de muestra, en el ámbito de la determinación de
plaguicidas, es que se pueda obtener una muestra representativa de un lote para realizar
un análisis, con el fin de determinar su conformidad con los límites máximos de
residuos. En el caso de productos vegetales, los LMR se aplican a una muestra a granel
compuesta, procedente de 1 a 10 muestras primarias [18]. Previa a la descripción del
procedimiento de muestreo, es conveniente definir los términos que a lo largo del
mismo aparecen. Según establece la legislación española [3], la comunitaria [19] y la
Comisión FAO/OMS [18], y siempre en relación con la determinación de plaguicidas,
se define como:
• Lote: cantidad de un producto alimenticio entregado en un momento
determinado, del cual el encargado del muestreo sabe o supone que tiene características
uniformes, como por ejemplo origen, productor, variedad, envasador, tipo de envasado,
marcas, etc. Cada lote será objeto de análisis por separado.
• Muestra elemental, primaria o bruta: una o más muestras tomadas de un solo
lugar en un lote.
• Muestra a granel, global o agregada: el total combinado y perfectamente
mezclado de las muestras primarias tomadas de un lote.

7/18/2019 Automatizacion y Miniaturizacion de Sistemas de Screening y Determinacion de Residuos de Plaguicidas en Muestra Agroalimentaria
http://slidepdf.com/reader/full/automatizacion-y-miniaturizacion-de-sistemas-de-screening-y-determinacion-de 61/393
Introducción General Toma de Muestra
• Muestra de laboratorio: muestra enviada al laboratorio o recibida por éste.
Cantidad representativa de material extraído de la muestra a granel. La muestra de
laboratorio podrá ser la totalidad o una parte de la muestra a granel.
• Muestra analítica o test: material destinado al análisis, preparado a partir de
la muestra de laboratorio separando la porción de producto que ha de analizarse y luego
mezclando, triturando, cortando finamente, etc., para poder disponer de porciones
analíticas con el mínimo error de muestreo.
• Porción analítica o alícuota: cantidad representativa de material extraído de
la muestra analítica, de tamaño adecuado para determinar la concentración de residuos.
• Muestra: una o más unidades seleccionadas entre una población de unidades,
o una porción de material seleccionada entre una cantidad mayor de material. Al efecto
de la determinación de plaguicidas, la intención de una muestra representativa es ser
representativa del lote, de la muestra a granel, etc. con respecto a su contenido en
residuos de plaguicidas y no necesariamente con respecto a otros atributos.
• Muestreo: procedimiento empleado para extraer y constituir una muestra.
• Tamaño de la muestra: número de unidades, o cantidad de material, que
constituyen la muestra.
•
Unidad : parte discreta más pequeña de un lote que deberá extraerse para
formar la totalidad o parte de una muestra primaria. En el caso de frutas y hortalizas,
cada fruta, hortaliza o racimo natural de éstas (uvas) entero constituirá una unidad,

7/18/2019 Automatizacion y Miniaturizacion de Sistemas de Screening y Determinacion de Residuos de Plaguicidas en Muestra Agroalimentaria
http://slidepdf.com/reader/full/automatizacion-y-miniaturizacion-de-sistemas-de-screening-y-determinacion-de 62/393
Almudena Columé Díaz Tesis Doctoral
Durante la toma de muestra y hasta la preparación de la muestra analítica se
deberán tomar precauciones con objeto de evitar cualquier alteración que pueda
modificar el contenido en residuos, afectar a los análisis o a la representatividad de la
muestra analítica. El procedimiento de muestreo [3,18,19] sigue los siguientes pasos:
1. Recogida de muestras primarias o elementales. El número mínimo de
muestras primarias que han de tomarse de un lote viene determinado en la Tabla 2.1.1.
Cada muestra primaria se tomará de un lugar del lote elegido al azar, en la medida de lo
posible. Las muestras primarias deberán contener material suficiente para proporcionar
la muestra o muestras de laboratorio necesarias procedentes del lote.
Tabla 2.1.1. Número mínimo de muestras primarias que han detomarse de un lote.
Peso del lote (Kg) Número mínimo demuestras primarias
<50 350-500 5>500 10
2. Preparación de la muestra a granel o global. Las muestras primarias se
mezclarán y combinarán perfectamente para formar la muestra global.
3. Preparación de la muestra de laboratorio. Cuando la muestra a granel sea
mayor que la necesaria para una muestra de laboratorio, se dividirá para obtener una
porción representativa. Podrá utilizarse un instrumento de muestreo, un sistema de
división en cuatro partes u otro procedimiento apropiado de reducción del tamaño, pero
no deberán cortarse o dividirse las unidades de productos de origen vegetal. Los
7/18/2019 Automatizacion y Miniaturizacion de Sistemas de Screening y Determinacion de Residuos de Plaguicidas en Muestra Agroalimentaria
http://slidepdf.com/reader/full/automatizacion-y-miniaturizacion-de-sistemas-de-screening-y-determinacion-de 63/393
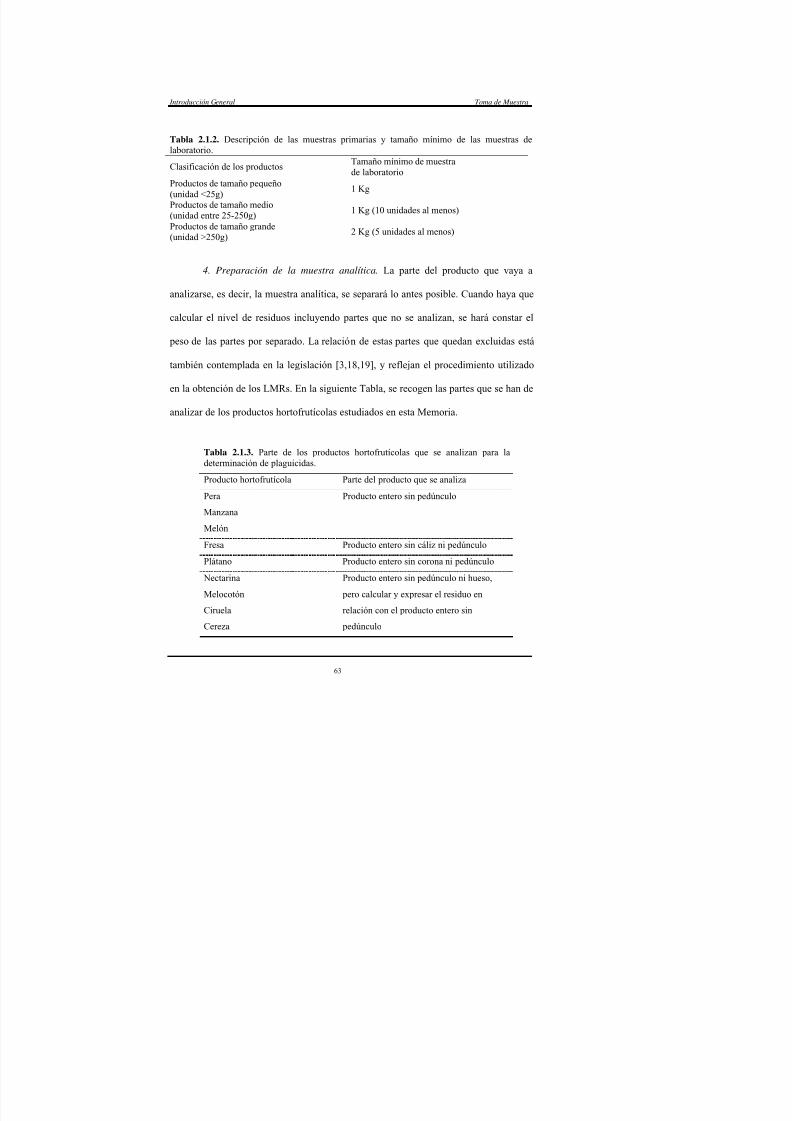
Introducción General Toma de Muestra
Tabla 2.1.2. Descripción de las muestras primarias y tamaño mínimo de las muestras delaboratorio.
Clasificación de los productosTamaño mínimo de muestrade laboratorio
Productos de tamaño pequeño(unidad <25g)
1 Kg
Productos de tamaño medio(unidad entre 25-250g)
1 Kg (10 unidades al menos)
Productos de tamaño grande(unidad >250g) 2 Kg (5 unidades al menos)
4. Preparación de la muestra analítica. La parte del producto que vaya a
analizarse, es decir, la muestra analítica, se separará lo antes posible. Cuando haya que
calcular el nivel de residuos incluyendo partes que no se analizan, se hará constar el
peso de las partes por separado. La relación de estas partes que quedan excluidas está
también contemplada en la legislación [3,18,19], y reflejan el procedimiento utilizado
en la obtención de los LMRs. En la siguiente Tabla, se recogen las partes que se han de
analizar de los productos hortofrutícolas estudiados en esta Memoria.
Tabla 2.1.3. Parte de los productos hortofrutícolas que se analizan para ladeterminación de plaguicidas.
Producto hortofrutícola Parte del producto que se analiza
Pera
Manzana
Melón
Producto entero sin pedúnculo
Fresa Producto entero sin cáliz ni pedúnculo
Plátano Producto entero sin corona ni pedúnculo
Nectarina
Melocotón
Ci l
Producto entero sin pedúnculo ni hueso,
pero calcular y expresar el residuo en
l ió l d t t i

7/18/2019 Automatizacion y Miniaturizacion de Sistemas de Screening y Determinacion de Residuos de Plaguicidas en Muestra Agroalimentaria
http://slidepdf.com/reader/full/automatizacion-y-miniaturizacion-de-sistemas-de-screening-y-determinacion-de 64/393
Almudena Columé Díaz Tesis Doctoral
Tabla 2.1.3. (Continuación).
Producto hortofrutícola Parte del producto que se analiza
Cebolla Producto entero sin tierra1, raíces y las túnicas
fácilmente desprendibles
Lechuga
Espinaca
Acelga
Producto entero sin las hojas exteriores
marchitas, raíces y tierra1
Zanahoria Producto entero sin corona, raíces y tierra1
Pimiento
Tomate
Berenjena
Pepino
Producto entero sin pedúnculo
Patata Producto entero sin tierra1
Coliflor Únicamente la inflorescencia, sin hojas
Champiñón Producto entero sin tierra1 ni medio de cultivo1Para eliminar la tierra se puede utilizar un cepillo suave.
5. Preparación de la porción analítica. La muestra analítica se triturará, si
procede, y se mezclará perfectamente, para que se puedan extraer porciones analíticas
representativas. El método de análisis y la eficacia del mezclado determinarán el
tamaño de la porción analítica. Los métodos para triturar y mezclar no deberán afectar a
los residuos presentes en la muestra analítica. Si las porciones analíticas han de
almacenarse antes del análisis, el método y la duración del almacenamiento no deberán
afectar al nivel de residuos presentes. La Figura 2.1.1 representa de forma esquemática
la totalidad del procedimiento de muestreo descrito.

7/18/2019 Automatizacion y Miniaturizacion de Sistemas de Screening y Determinacion de Residuos de Plaguicidas en Muestra Agroalimentaria
http://slidepdf.com/reader/full/automatizacion-y-miniaturizacion-de-sistemas-de-screening-y-determinacion-de 65/393
Introducción General Toma de Muestra
Lote y muestras brutas: 1, 3, 5, 10 o 15 muestras primarias tomadas de unnúmero igual de lugareselegidos aleatoriamente.
Unidades que forman la muestra agregada:Cuando las muestras de laboratorio se preparana partir del lote, la muestra a granel o global esla suma de las muestras de laboratorio.
Combinación demuestras brutas
Muestra de laboratorio: 1 o más. Muestra test preparadaparcialmente
Partes que no se han de analizar.
Muestra test preparadacompletamente
Alícuota: 1 o más.

7/18/2019 Automatizacion y Miniaturizacion de Sistemas de Screening y Determinacion de Residuos de Plaguicidas en Muestra Agroalimentaria
http://slidepdf.com/reader/full/automatizacion-y-miniaturizacion-de-sistemas-de-screening-y-determinacion-de 66/393
Almudena Columé Díaz Tesis Doctoral
El procedimiento de muestreo seguido en esta Memoria para la determinación
de plaguicidas en frutas y verduras contempla los pasos descritos en este apartado,
teniendo en cuenta que las muestras de laboratorio se prepararon a partir del lote,
siendo, por tanto, la muestra global la suma de las muestras de laboratorio. Así,
podemos esquematizarlo como sigue:
• Muestreo realizado en Capítulo II.
5 Kg (suma de 5 muestras de laboratorio)ó 5 unidades en el caso de
productos de tamaño grande
Eliminar las partes que no se han deanalizar, triturar mezclar y liofilizar.
Muestra Agregada
Muestra Test
10-20 unidades (1 Kg)ó 5 unidades en el caso de
productos de tamaño grande
Eliminar las partes que no se han deanalizar, cortar en trozos y mezclar.
Tomar fracciones de 5gde producto fresco
Muestra Laboratorio
Muestra Test
Alícuota
• Muestreo realizado en Capítulo III.
I d ió G l T d M

7/18/2019 Automatizacion y Miniaturizacion de Sistemas de Screening y Determinacion de Residuos de Plaguicidas en Muestra Agroalimentaria
http://slidepdf.com/reader/full/automatizacion-y-miniaturizacion-de-sistemas-de-screening-y-determinacion-de 67/393
Introducción General Toma de Muestra
Los resultados analíticos deben obtenerse de una o más muestras de laboratorio
y en condiciones idóneas para el análisis. Los resultados no deberán corregirse con
miras a los resultados de los estudios de recuperación. Cuando un residuo exceda un
LMR, se confirmará su identidad y su concentración mediante el análisis de una o más
porciones analíticas adicionales obtenida de la muestra de laboratorio original [18].
2.2. TOMA DE MUESTRA EN MUESTRAS ACUOSAS
La toma de muestras acuosas, en relación con la determinación de plaguicidas,
está establecida en la legislación europea [20], y la española [21]. De esta forma, las
muestras de agua deberán ser representativas de la calidad del agua en el punto de la
extracción. Los recipientes que contengan las muestras, los agentes o métodos
utilizados para su conservación y transporte o almacenamiento, así como su preparación
para el análisis, no deberán ocasionar una modificación significativa de sus resultados.
Teniendo en cuenta todo ello, la toma de muestras acuosas procedentes de agua
de abastecimiento público, se realizó tras dejar correr el agua diez minutos, para evitar
recoger los posibles depósitos acumulados en las tuberías de conducción de la misma,
siendo el volumen de muestra de 5 litros. Por otro lado, las aguas procedentes de ríos,
lagunas, pozos y pantanos, fueron tomadas a diferentes profundidades (superficial,
media y profunda), con un volumen de muestra de 1.5 L en cada una, para finalmente
ser homogenizadas y constituir así la muestra global.
Los recipientes utilizados fueron botellas de vidrio para evitar la posible
Almudena Columé Díaz Tesis Doctoral

7/18/2019 Automatizacion y Miniaturizacion de Sistemas de Screening y Determinacion de Residuos de Plaguicidas en Muestra Agroalimentaria
http://slidepdf.com/reader/full/automatizacion-y-miniaturizacion-de-sistemas-de-screening-y-determinacion-de 68/393
Almudena Columé Díaz Tesis Doctoral
analitos de la radiación solar directa. Además, para su conservación se añadió tiosulfato
sódico y se ajustó el pH entre 5 y 6. De esta forma se evita, las interferencias del cloro
si ha sido añadido para la potabilización de las aguas recogidas de la red de
abastecimiento público, o de los ácidos húmicos y fúlvicos, si están presentes en las
muestras. El ajuste del pH evita la degradación de los analitos bajo condiciones
alcalinas, puesto que la mayoría de las muestras presentaron un pH en torno a 8. Las
muestras se mantuvieron refrigeradas a 4ºC hasta el momento de su análisis.
Introducción General Directrices sobre Determinación de Plaguicidas
7/18/2019 Automatizacion y Miniaturizacion de Sistemas de Screening y Determinacion de Residuos de Plaguicidas en Muestra Agroalimentaria
http://slidepdf.com/reader/full/automatizacion-y-miniaturizacion-de-sistemas-de-screening-y-determinacion-de 69/393
Introducción General Directrices sobre Determinación de Plaguicidas
3. DIRECTRICES GENERALES SOBRE LA DETERMINACION DE
PLAGUICIDAS
Para originar una información de calidad y propiciar la confianza y satisfacción
de sus clientes, los laboratorios que realizan las determinaciones de residuos de
plaguicidas en diferentes matrices deberán tener implantado un sistema de calidad
basado en la norma ISO 17025-1999, la cual especifica los requisitos de gestión y
técnicos para asegurar la calidad. Además, la Unión Europea [6] y la Comisión
FAO/OMS [22] han elaborado una serie de documentos específicos en los que se
expone los factores de los que depende la fiabilidad de los resultados analíticos en el
análisis de residuos de plaguicidas. Dichos factores quedan agrupados en tres bloques:
la experiencia del analista, los recursos básicos necesarios y la disponibilidad de
métodos analíticos validados.
En relación con el analista encargado, éste ha de estar convenientemente
cualificado y poseer experiencia y competencia en el análisis de residuos, y el personaldebe poseer una sólida formación y experiencia en el uso correcto de los equipos y la
aplicación de las técnicas de laboratorio apropiadas.
Los recursos básicos están referidos tanto a los del laboratorio como a los de
equipos y suministros. El laboratorio y sus instalaciones deben estar proyectados de
forma que las distintas tareas se efectúen en zonas bien determinadas, con la máxima
seguridad y la mínima posibilidad de contaminación de las muestras. Asimismo, el
laboratorio deberá estar suficientemente abastecido de electricidad agua y distintos
Almudena Columé Díaz Tesis Doctoral
7/18/2019 Automatizacion y Miniaturizacion de Sistemas de Screening y Determinacion de Residuos de Plaguicidas en Muestra Agroalimentaria
http://slidepdf.com/reader/full/automatizacion-y-miniaturizacion-de-sistemas-de-screening-y-determinacion-de 70/393
lmudena Columé íaz esis octo al
material de vidrio, material para cromatografía, etc. La calibración es fundamental en
los instrumentos de medición. Será necesario contar con una gama suficiente de
plaguicidas de referencia de pureza conocida y convenientemente alta. Todos los
patrones analíticos, las disoluciones concentradas y los reactivos deberán etiquetarse
claramente con la fecha de caducidad y almacenarse en las condiciones adecuadas. Es
importante garantizar la estabilidad de los compuestos de referencia. Asimismo, es
importante que durante el almacenamiento las disoluciones patrón de los plaguicidas no
se descompongan por efecto de la luz o el calor o se concentren a causa de la
evaporación del disolvente.
En cuanto al análisis propiamente dicho, son numerosos los factores a tener en
cuenta. Por ello, se exponen a continuación de forma resumida los aspectos más
importantes.
• Toma, transporte, tratamiento y conservación de las muestras.
En el Sección 2 de esta Introducción ya han sido tratados ampliamente varios
de estos aspectos. Señalar que deben transportarse al laboratorio en recipientes limpios
y sólidamente envasadas, quedando identificadas de forma clara e indeleble. Los
métodos de tratamiento y conservación no pueden afectar de forma significativa a los
residuos estudiados. En condiciones ideales, las muestras deben almacenarse a
temperatura de refrigeración (1-5ºC), sin exponerlas a la luz solar directa, y ser
analizadas en el plazo de pocos días. Para periodos más largos la temperatura de
almacenamiento será de 20ºC aproximadamente
Introducción General Directrices sobre Determinación de Plaguicidas
7/18/2019 Automatizacion y Miniaturizacion de Sistemas de Screening y Determinacion de Residuos de Plaguicidas en Muestra Agroalimentaria
http://slidepdf.com/reader/full/automatizacion-y-miniaturizacion-de-sistemas-de-screening-y-determinacion-de 71/393
• Extracción y concentración.
Las porciones analíticas deben desintegrarse totalmente antes de la extracción o
durante la misma, para maximizar la eficacia de la extracción. Si se sabe que la
temperatura, pH, etc. afectan a la eficacia de la extracción o a la estabilidad del
plaguicida, será necesario controlar estos parámetros. Los extractos y la disolución
analítica final no deberán exponerse a la luz solar directa. Es necesario extremar el
cuidado cuando deba evaporarse un extracto hasta su secado, ya que de esta manera
pueden perderse de las superficies cantidades traza de muchos plaguicidas.
• Calibración analítica e integración cromatográfica.
En una secuencia de determinaciones, cada secuencia debe iniciarse y
terminarse con una calibración. Cuando un patrón de calibración de un plaguicida esté
formado por una mezcla de isómeros, podrá aceptarse generalmente que la respuesta del
detector es similar, teniendo en cuenta la molaridad, con cada componente. Cuando el
plaguicida se detecte como producto derivado o de degradación, las disoluciones de
calibración deben prepararse a partir de un patrón de referencia de dicho producto
derivado o de degradación, cuando se pueda. La calibración con patrones isómeros
mezclados puede utilizar la suma de las áreas (alturas) de picos, o la medida
correspondiente a un solo componente, según la posibilidad que se muestre más exacta.
• Métodos analíticos.
En principio, el método analítico debe ser capaz de proporcionar una
ió tibl ( d l i id ñ did i l i
Almudena Columé Díaz Tesis Doctoral
7/18/2019 Automatizacion y Miniaturizacion de Sistemas de Screening y Determinacion de Residuos de Plaguicidas en Muestra Agroalimentaria
http://slidepdf.com/reader/full/automatizacion-y-miniaturizacion-de-sistemas-de-screening-y-determinacion-de 72/393
compuestos investigados por el método, y, a ser posible, con una recuperación media de
cada compuesto situada entre el 80 y el 100%. Cuando los resultados se expresen en
peso seco deberá ser constante el método utilizado para determinar el peso seco.
• Determinaciones de recuperación.
La recuperación de los plaguicidas debe determinarse mediante adición del
analito a una muestra de matriz blanca, similar a la estudiada. El nivel de adición podrá
ser de una a diez veces el nivel mínimo de cuantificación, el LMR o algún otro nivel
importante para muestras concretas. Es preferible saber que el material blanco elegido
no contiene niveles mensurables del analito.
• Confirmación de los resultados.
Principios de confirmación:
- Es imposible demostrar la ausencia completa de residuos. La adopción del
límite de comunicación o nivel práctico más bajo (NPMB) al nivel mínimo
cuantificable (NMC) evita el elevado coste de demostrar la presencia o ausencia de
residuos a niveles tan bajos que los datos dejan de tener sentido. Estos valores de
NPMB en relación con los LMRs establecidos quedan establecidos en la Tabla 3.1.
Tabla 3.1. Valores de NPMB con relación a los LMR establecidos.LMR (mg/Kg) NPMB (mg/Kg)
≥5 0.5
0.5-5 0.1
(aumentando hasta 0.5 en los LMR más elevados)
0.05-0.5 0.02
(aumentando hasta 0 1 en los LMR más elevados)
Introducción General Directrices sobre Determinación de Plaguicidas

7/18/2019 Automatizacion y Miniaturizacion de Sistemas de Screening y Determinacion de Residuos de Plaguicidas en Muestra Agroalimentaria
http://slidepdf.com/reader/full/automatizacion-y-miniaturizacion-de-sistemas-de-screening-y-determinacion-de 73/393
- Los resultados al NMC o por encima necesitan una prueba adicional para
considerarse confirmados. El requisito mínimo es el nuevo análisis de los extractos, con
una calibración adecuada de los plaguicidas detectados.
Enfoques de la confirmación:
- La confirmación del analito detectado debe ser cuali y cuantitativa.- Los ensayos basados en detector de captura de electrones tienden a necesitar
la confirmación debido a su falta de especificidad.
- Cuando un residuo supere el LMR o cuando no deba estar presente en la
muestra, el resultado deberá confirmarse por el método menos inequívoco
disponible y mediante análisis de una o más porciones analíticas adicionales.
Confirmación por espectrometría de masas:
- Puede proporcionar la confirmación casi inequívoca de residuos de la mayoría
de los plaguicidas, pero los datos de confirmación deben cumplir unos
requisitos mínimos. El espectro de masas de referencia debe proceder del patrón de referencia o de una disolución de éste en disolvente puro.
- Los espectros de exploración completa ( desde m/z 50 hasta más allá de la
región de iones moleculares) proporcionan la identificación más concluyente,
pero la sensibilidad puede mejorarse mediante la exploración de una banda
limitada de masas o mediante monitorización selectiva de iones. En lo que
respecta a la cuantificación, los iones que se controlen deberán ser los más
específicos de la sustancia analizada los que sufran menos interferencias y en
Almudena Columé Díaz Tesis Doctoral
7/18/2019 Automatizacion y Miniaturizacion de Sistemas de Screening y Determinacion de Residuos de Plaguicidas en Muestra Agroalimentaria
http://slidepdf.com/reader/full/automatizacion-y-miniaturizacion-de-sistemas-de-screening-y-determinacion-de 74/393
• Expresión de los resultados.
Para el cálculo de los resultados, los datos de los residuos no deben corregirse
para tener en cuenta la recuperación. Cuando se hayan analizado dos o más pociones
analíticas, se comunicará la media aritmética de los resultados más exactos obtenidos
con cada porción. Cuando se realice una buena trituración o mezclado de las muestras,
la RDS de los resultados entre las porciones analíticas no deberá superar el 30% si el
residuo medido se encuentra en una concentración significativamente superior al límite
de detección. En cuanto a la incertidumbre de las medidas, ésta constituye un indicador
cuantitativo útil de la confianza que puede asignarse a los resultados, y puede usarse la
desviación estándar de la repetibilidad o de la reproducibilidad interna. Los datos sobre
la incertidumbre deben referirse al plaguicida concreto y es conveniente que se hayan
obtenido a partir de la matriz correspondiente, a un nivel próximo al de la muestra.
En general, al comunicar los resultados, para aquellos inferiores a 0.1 mg/Kg,
deberá redondearse a una cifra significativa; los resultados entre 0.1 y 10 mg/Kg, debenredondearse a dos cifras significativas; y los resultados por encima de 10 mg/Kg pueden
redondearse a tres cifras significativas o al número entero más próximo.
Por último, cuando los residuos medidos en las muestras tomadas de un lote no
superen los LMR, el lote será conforme a los LMR. Sólo deberán comunicarse los datos
comprobados, que se expresarán tal como se definen en los LMR.
Introducción General Metodologías para la Determinación de Residuos de Plaguicidas

7/18/2019 Automatizacion y Miniaturizacion de Sistemas de Screening y Determinacion de Residuos de Plaguicidas en Muestra Agroalimentaria
http://slidepdf.com/reader/full/automatizacion-y-miniaturizacion-de-sistemas-de-screening-y-determinacion-de 75/393
4. METODOLOGIAS PARA LA DETERMINACION DE RESIDUOS DE
PLAGUICIDAS ORGANOCLORADOS Y PIRETROIDES
El desarrollo de métodos analíticos para la determinación de residuos de
plaguicidas responde a necesidades toxicológicas (el compuesto a identificar es
potencialmente perjudicial para la salud del hombre o del medio ambiente), o bien a lanecesidad de identificar un residuo final en una muestra (medidas de inspección y
monitorización en alimentos y muestras medioambientales). En cualquiera de los dos
casos, es necesario identificar y cuantificar pequeñas cantidades de estos compuestos.
En esta revisión bibliográfica, que no pretende ser exhaustiva sino ofrecer una
panorámica general, se han abordado las metodologías desarrolladas para la
determinación de residuos de plaguicidas organoclorados y piretroides en matrices
biológicas, medioambientales y de alimentos, incluyendo el pretratamiento de la
muestra y las técnicas cromatográficas de determinación y confirmación. Todos estos
aspectos se han sistematizado en la Tabla 4.1. La parte final de esta sección recoge los
avances en automatización, miniaturización y técnicas de screening en este campo.
4.1. PRETRATAMIENTO DE LA MUESTRA: EXTRACCION Y LIMPIEZA
El primer paso en el pretratamiento de la muestra para la determinación de este
tipo de plaguicidas no polares es la extracción, que puede ser simple o repetitiva (con el
mismo disolvente, combinando finalmente los extractos). El extractante y el método
empleado dependen fundamentalmente de la naturaleza de la muestra Así como se
Almudena Columé Díaz Tesis Doctoral

7/18/2019 Automatizacion y Miniaturizacion de Sistemas de Screening y Determinacion de Residuos de Plaguicidas en Muestra Agroalimentaria
http://slidepdf.com/reader/full/automatizacion-y-miniaturizacion-de-sistemas-de-screening-y-determinacion-de 76/393
solo disolvente, principalmente acetona, acetonitrilo y acetato de etilo, o bien con una
mezcla binaria de los mismos e incluso ternaria, en la que la acetona se combina con
otros disolventes menos polares (principalmente n-hexano).
Para las muestras acuosas se emplea generalmente una extracción simple con
un disolvente no polar (n-hexano o diclorometano).Sin embargo, junto con los analitos también se extraen otros compuestos
procedentes de la matriz. Por ello, es necesaria una etapa de limpieza del extracto, la
cual depende del sistema de detección empleado. Así, si el detector utilizado es
suficientemente selectivo, no se necesita una limpieza demasiado rigurosa del extracto,
pero si no es así, entonces esta etapa debe ser lo suficientemente efectiva para eliminar
la mayor parte posible de los coextractos que pueden interferir en la determinación.
Además, puesto que la concentración de los analitos en este extracto no permitiría
alcanzar los LMRs establecidos, es necesario incluir una etapa de preconcentración
(evaporación del extracto y redisolución en un volumen menor).
Las técnicas de limpieza y preconcentración más utilizadas son la extracción
líquido-líquido (LLE) y la extracción en fase sólida (SPE). La extracción líquido-
líquido es una técnica muy conocida y utilizada para la separación de los plaguicidas de
sus coextractos. En este caso, se utiliza en la primera extracción un disolvente polar,
como la acetona, para después realizar la partición con un disolvente totalmente no
polar. De esta forma, los plaguicidas quedan en la fase orgánica no polar, mientras que
los coextractos quedan en la fase polar
Introducción General Metodologías para la Determinación de Residuos de Plaguicidas

7/18/2019 Automatizacion y Miniaturizacion de Sistemas de Screening y Determinacion de Residuos de Plaguicidas en Muestra Agroalimentaria
http://slidepdf.com/reader/full/automatizacion-y-miniaturizacion-de-sistemas-de-screening-y-determinacion-de 77/393
Sin embargo, las tendencias actuales están reemplazando la extracción líquido-
líquido a favor de la extracción en fase sólida (ver Tabla 4.1). Es posible emplear SPE
como única etapa de limpieza, o bien como una adicional tras la extracción líquido-
líquido. Así, para muestras complejas, como son las frutas y hortalizas y los fluidos
biológicos, generalmente se usa una extracción líquido-líquido seguida de una
extracción en fase sólida [23,24,28,30,36], para intentar eliminar la mayor parte posible
de coextractos en el extracto final.
Los adsorbentes que se utilizan para la preconcentración de plaguicidas
organoclorados y piretroides son aquellos que retienen la fracción liposoluble del
extracto, la cual luego puede ser eluida con disolventes de baja polaridad. Los sólidos
adsorbentes más utilizados en estos casos se recogen en la Tabla 4.1, entre los que
destacan el Florisil y la sílica-gel o sílica. RP-C18 se ha empleado fundamentalmente
con muestras de aguas.
La cromatografía en gel (GPC), también es una técnica de limpieza utilizada en
el análisis de residuos de plaguicidas. Esta técnica se emplea para la separación de
proteínas y biomoléculas, en base al tamaño molecular, partición o adsorción. Así, las
diferentes fracciones del eluido pueden contener diferentes tipos de compuestos,
separando los plaguicidas de sus coextractos. Los geles más utilizados son Bio-Beads
SX-3 [27,37,41] y Envirogel [26]. Esta técnica es eficaz en limpieza de extractos, pero
consume grandes volúmenes de disolventes orgánicos y requiere mucho tiempo.
También existen otras técnicas relativamente recientes que están empezando a
Almudena Columé Díaz Tesis Doctoral

7/18/2019 Automatizacion y Miniaturizacion de Sistemas de Screening y Determinacion de Residuos de Plaguicidas en Muestra Agroalimentaria
http://slidepdf.com/reader/full/automatizacion-y-miniaturizacion-de-sistemas-de-screening-y-determinacion-de 78/393
-Extracción con fluidos supercríticos (SFE) [61-63]. Presenta la ventaja de que
ahorra tiempo y disolventes, siendo el disolvente más utilizado el dióxido de carbono
por su temperatura (31ºC) y su presión (73 atm.) críticas moderadas. Además, el CO2
no es inflamable, ni tóxico, y no es demasiado caro. El metanol puede utilizarse como
modificador para ajustar el poder de disolución del fluido.
-Microextracción en fase sólida (SPME) [64-67]. Los analitos se adsorben en
una fibra recubierta con polímeros, bien al sumergirla en la muestra si ésta es líquida, o
bien utilizando la técnica de espacio de cabeza si son sólidas. La desorción de los
analitos se realiza por calentamiento brusco, colocando la fibra directamente en el
portal de inyección de un cromatógrafo de gases, o bien, con disolventes en la interfase
SPME/LC.
-Extracción con disolventes asistida por microondas (MAE) [39,41]. Esta
técnica utiliza la energía de las microondas para favorecer y acelerar la extracción con
disolventes, siendo más eficaz que la clásica extracción Soxhlet.
-Microextracción con disolventes (SME) [68,69]. Es una extracción líquido-
líquido que emplea microvolúmenes de un disolvente orgánico para la extracción de
analitos desde una fase acuosa.
Introducción General Metodologías para la Determinación de Residuos de Plaguicidas
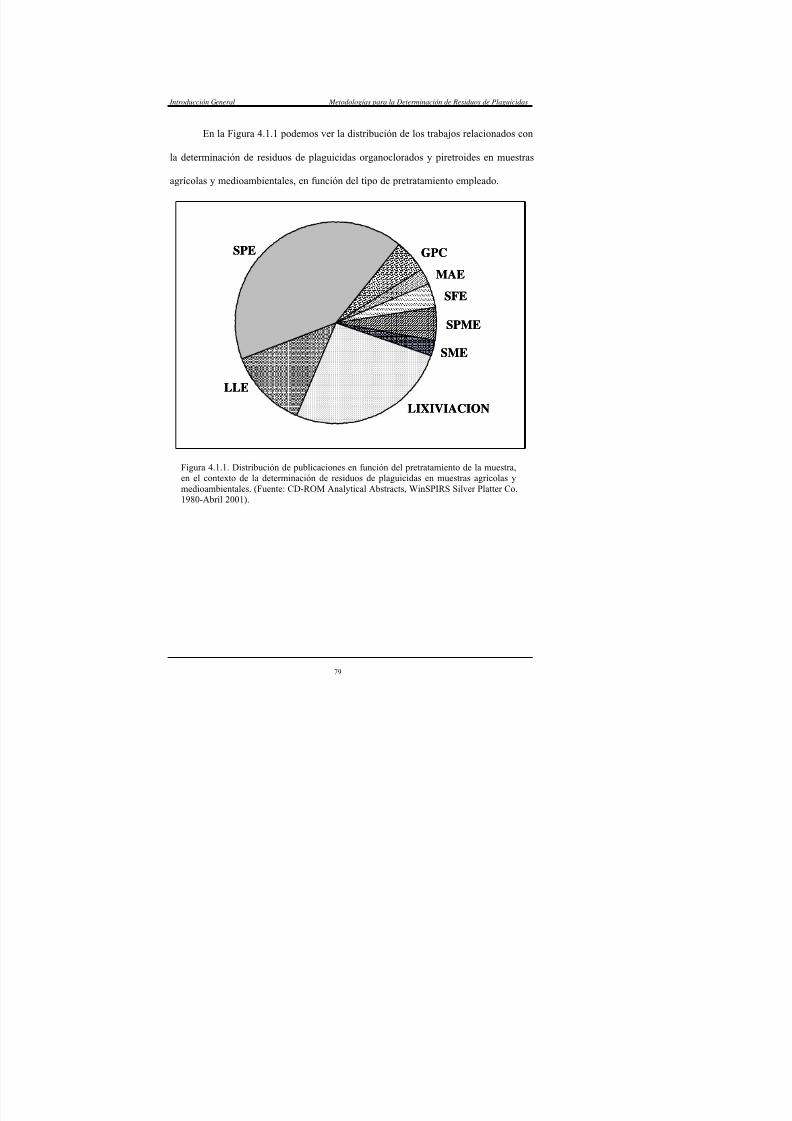
7/18/2019 Automatizacion y Miniaturizacion de Sistemas de Screening y Determinacion de Residuos de Plaguicidas en Muestra Agroalimentaria
http://slidepdf.com/reader/full/automatizacion-y-miniaturizacion-de-sistemas-de-screening-y-determinacion-de 79/393
En la Figura 4.1.1 podemos ver la distribución de los trabajos relacionados con
la determinación de residuos de plaguicidas organoclorados y piretroides en muestras
agrícolas y medioambientales, en función del tipo de pretratamiento empleado.
Figura 4.1.1. Distribución de publicaciones en función del pretratamiento de la muestra,en el contexto de la determinación de residuos de plaguicidas en muestras agrícolas ymedioambientales. (Fuente: CD-ROM Analytical Abstracts, WinSPIRS Silver Platter Co.1980-Abril 2001).
SPE
LLE
LIXIVIACION
GPC
MAE
SFE
SPME
SME
SPE
LLE
LIXIVIACION
GPC
MAE
SFE
SPME
SME
Almudena Columé Díaz Tesis Doctoral

7/18/2019 Automatizacion y Miniaturizacion de Sistemas de Screening y Determinacion de Residuos de Plaguicidas en Muestra Agroalimentaria
http://slidepdf.com/reader/full/automatizacion-y-miniaturizacion-de-sistemas-de-screening-y-determinacion-de 80/393
4.2. SEPARACION CROMATOGRAFICA
La mayor parte de los métodos analíticos para la determinación de plaguicidas
organoclorados y piretroides están basados en técnicas de separación cromatográficas.
Los plaguicidas organoclorados suelen determinarse por cromatografía de gases y, dado
su carácter fuertemente halogenado, empleando como detector el de captura de
electrones (ECD). La espectrometría de masas (MS) también está ampliamente
extendida y, aunque en menor medida, se encuentran referencias del empleo de los
detectores de conductividad electrónica (DEC) [24,57] y de emisión atómica (AED)
[27] para la determinación de residuos de plaguicidas organoclorados.
Por otro lado, la cromatografía de gases es también la técnica de primera
elección para el análisis de residuos de piretroides. Muchos de los piretroides poseen
varios átomos de halógenos en su molécula (ej. bifentrín, fenpropatrín, cipermetrín,
ciflutrín, permetrín, fenvalerato, deltametrín, λ-cihalotrín), lo que los hace muy
sensibles al detector de captura de electrones. También es posible llevar a cabo
derivatizaciones para introducir un grupo sensible al ECD en la molécula de aquellos
piretroides que no posean átomos de halógenos (ej. alletrín, resmetrín, fenotrín,
tetrametrín) [35]. El detector de ionización de llama (FID) puede utilizarse para la
determinación de piretroides no halogenados [43,55], aunque su sensibilidad no es muy
alta.
Por último, la cromatografía líquida (LC) permite la cuantificación de aquellos
compuestos que no son volátiles o son termolábiles sin necesidad de derivatización
Introducción General Metodologías para la Determinación de Residuos de Plaguicidas

7/18/2019 Automatizacion y Miniaturizacion de Sistemas de Screening y Determinacion de Residuos de Plaguicidas en Muestra Agroalimentaria
http://slidepdf.com/reader/full/automatizacion-y-miniaturizacion-de-sistemas-de-screening-y-determinacion-de 81/393
fundamentalmente en el estudio teórico de separación de enantiómeros [70-72],
mientras que asociada al detector de espectrometría de masas (MS) se utiliza en el
análisis de residuos de piretroides en muestras medioambientales y de alimentos
[73,74].
4.3. CONFIRMACION POR ESPECTROMETRIA DE MASAS
La espectrometría de masas es una herramienta excelente para confirmar
resultados obtenidos empleando detectores que, aunque proporcionen una elevada
sensibilidad (fundamental para alcanzar los LMR), no permiten una identificación
inequívoca del compuesto. Un espectro completo de masas de un plaguicida
proporciona una información estructural del mismo que sólo le corresponde a él. La
mayoría de los estudios que se han realizado hasta hoy día utilizan la técnica de
ionización por impacto electrónico (EI) a una determinada energía (normalmente 70
eV). La espectrometría de masas acoplada a GC ha sido empleada para este propósito
en la determinación de residuos de plaguicidas organoclorados y piretroides
[31,34,48,50].
Almudena Columé Díaz Tesis Doctoral

7/18/2019 Automatizacion y Miniaturizacion de Sistemas de Screening y Determinacion de Residuos de Plaguicidas en Muestra Agroalimentaria
http://slidepdf.com/reader/full/automatizacion-y-miniaturizacion-de-sistemas-de-screening-y-determinacion-de 82/393
Tabla 4.1. Métodos desarrollados para la determinación de residuos de plaguicidas en losámbitos medioambiental, agroalimentario y clínico.
Pretratamiento de la muestraRef Muestra Analito
Lixiviación LLE SPE OtroDetección
cromatográfica
23 Frutas yhortalizas
Piretroides Acetonitriloo
Acetona
Florisil GC-ECD
24 Frutas yhortalizas
Organoclorados Acetona Carbónactivado
GC-DEC
25 Frutas Piretroides Acetona Florisil GC-ECDGPC GC-MS26 Hierbas Organoclorados
y piretroidesAcetona Diclorometano
Envirogel
GPC GC-AED27 Alimentos Organoclorados Acetona DiclorometanoBio Beads SX-3
28 Frutas yhortalizas
Piretroides Acetona Hexano Florisil GC-ECD
29 Tejidoanimal
Organoclorados Acetonitrilo RP-C18 GC-ECD
30 Frutas yhortalizas Piretroides Acetonitrilo Hexano Florisil GC-ECD
31 Huevos de pescado
Piretroides Acetonitrilo Alúmina+ Sílica
GC-ECD/MS
32 Frutas yhortalizas
Organoclorados Acetato etilo GC-MS
33 Lechuga Organoclorados Acetato etilo GC-ECD
34 Fruta dela pasión
Piretroides Acetato etilo Alúmina+ Sílica
GC-ECD/MS
Florisil GC-ECD35 Polvo Piretroidesno halogenados
Acetato etiloDerivatización
36 Frutas yhortalizas
Organoclorados Isopropanol Éter petróleo Florisil GC-ECD
GPC GC-MS37 Alimentosgrasos
Organoclorados Diclorometano
BioBeads SX-3
38 Frutas Piretroides Acetona +hexano
Florisil GC-ECD
Introducción General Metodologías para la Determinación de Residuos de Plaguicidas
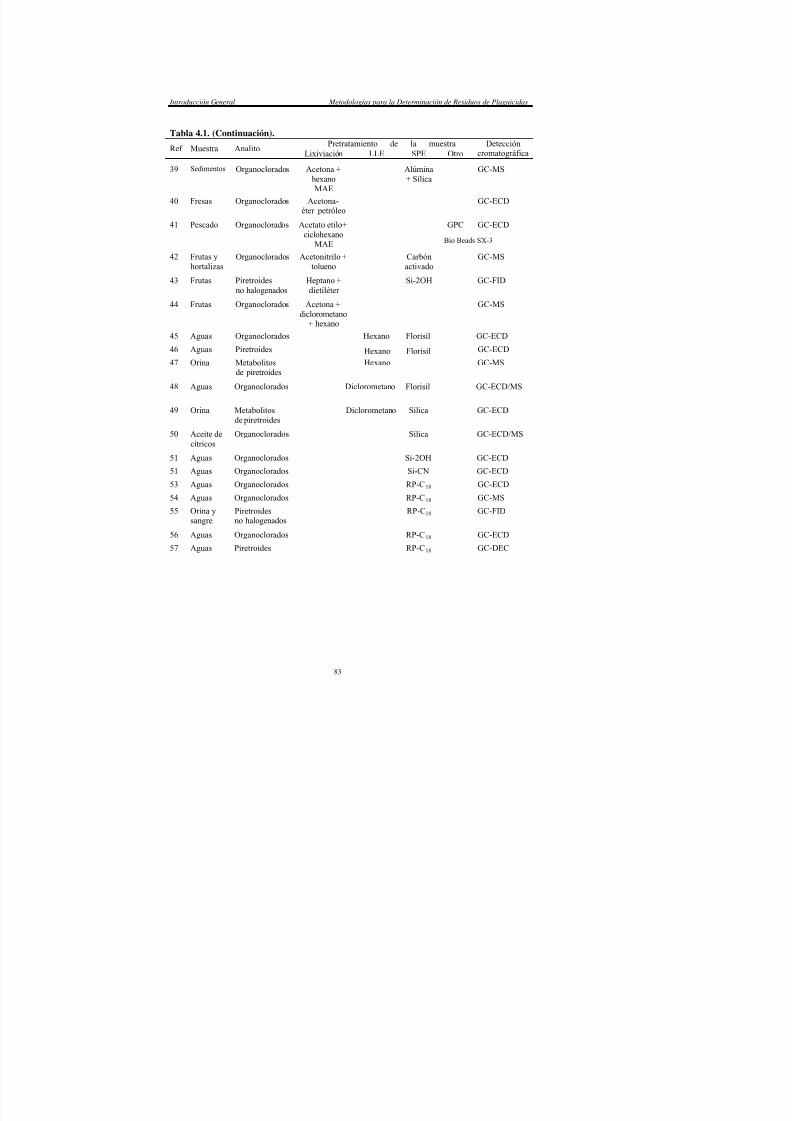
7/18/2019 Automatizacion y Miniaturizacion de Sistemas de Screening y Determinacion de Residuos de Plaguicidas en Muestra Agroalimentaria
http://slidepdf.com/reader/full/automatizacion-y-miniaturizacion-de-sistemas-de-screening-y-determinacion-de 83/393
Tabla 4.1. (Continuación). Pretratamiento de la muestra
Ref Muestra AnalitoLixiviación LLE SPE Otro
Deteccióncromatográfica
39 Sedimentos Organoclorados Acetona +hexanoMAE
Alúmina+ Sílica
GC-MS
40 Fresas Organoclorados Acetona-éter petróleo
GC-ECD
GPC GC-ECD41 Pescado Organoclorados Acetato etilo+
ciclohexanoMAE Bio Beads SX-3
42 Frutas yhortalizas
Organoclorados Acetonitrilo +tolueno
Carbónactivado
GC-MS
43 Frutas Piretroidesno halogenados
Heptano +dietiléter
Si-2OH GC-FID
44 Frutas Organoclorados Acetona +diclorometano
+ hexano
GC-MS
45 Aguas Organoclorados Hexano Florisil GC-ECD
46 Aguas Piretroides Hexano Florisil GC-ECD
47 Orina Metabolitosde piretroides
Hexano GC-MS
48 Aguas Organoclorados Diclorometano Florisil GC-ECD/MS
49 Orina Metabolitosde piretroides
Diclorometano Sílica GC-ECD
50 Aceite decítricos
Organoclorados Sílica GC-ECD/MS
51 Aguas Organoclorados Si-2OH GC-ECD
51 Aguas Organoclorados Si-CN GC-ECD
53 Aguas Organoclorados RP-C18 GC-ECD
54 Aguas Organoclorados RP-C18 GC-MS
55 Orina ysangre
Piretroidesno halogenados
RP-C18 GC-FID
56 Aguas Organoclorados RP-C18 GC-ECD
57 Aguas Piretroides RP-C18 GC-DEC
Almudena Columé Díaz Tesis Doctoral

7/18/2019 Automatizacion y Miniaturizacion de Sistemas de Screening y Determinacion de Residuos de Plaguicidas en Muestra Agroalimentaria
http://slidepdf.com/reader/full/automatizacion-y-miniaturizacion-de-sistemas-de-screening-y-determinacion-de 84/393
Tabla 4.1. (Continuación). Pretratamiento de la muestra
Ref Muestra AnalitoLixiviación LLE SPE Otro
Deteccióncromatográfica
58 Orina Metabolitosde piretroides
RP-C18 GC-MS
59 Aguas Piretroides RP-C18 GC-ECD
60 Aguade lluvia
Organoclorados AmberlitaXAD-2
GC-ECD
61 Aguas Organoclorados SFE GC-ECD
62 Aguas Organoclorados SFE GC-MS
63 Hortalizas Piretroides SFE GC-MS
64 Aguas Piretroides SPME GC-ECD
65 Aguas Organoclorados SPME GC-MS
66 Aguas Organoclorados SPME GC-ECD
67 Aguas Organoclorados SPME GC-ECD
68 Aguas Organoclorados SME(hexano)
GC-ECD
69 Aguas Organoclorados SME(hexano)
GC-ECD
Introducción General Metodologías para la Determinación de Residuos de Plaguicidas
7/18/2019 Automatizacion y Miniaturizacion de Sistemas de Screening y Determinacion de Residuos de Plaguicidas en Muestra Agroalimentaria
http://slidepdf.com/reader/full/automatizacion-y-miniaturizacion-de-sistemas-de-screening-y-determinacion-de 85/393
4.4. AUTOMATIZACION Y MINIATURIZACION
La química analítica actual, al igual que otros campos científicos y
tecnológicos, tiende a la automatización, miniaturización y simplificación de los
procesos analíticos. Sin embargo, la mayoría de los métodos desarrollados en el ámbito
del análisis de residuos de plaguicidas son métodos manuales. La transformación de un
método manual en automático, casi siempre implica un grado más o menos intenso de
miniaturización y simplificación. La automatización total o parcial de un proceso
analítico implica la eliminación, o reducción, de la intervención humana. Con los
sistemas en línea, todas las etapas del proceso tienen lugar de forma continua y
automática, haciendo uso de un módulo de tratamiento automático (MTA) que está
conectado directamente (a través de tubos de conexión y válvulas) al instrumento de
medida. La mayoría de los sistemas automáticos en línea desarrollados se basan en
configuraciones en flujo (FA, flow analysis) de alta o baja presión, siendo el elemento
clave la interfase. Así, por ejemplo, el diseño más simple de una interfase entre un
MTA y un cromatógrafo de gases, utiliza una válvula de inyección, tal como se muestra
en la Figura 4.4.1.
Almudena Columé Díaz Tesis Doctoral

7/18/2019 Automatizacion y Miniaturizacion de Sistemas de Screening y Determinacion de Residuos de Plaguicidas en Muestra Agroalimentaria
http://slidepdf.com/reader/full/automatizacion-y-miniaturizacion-de-sistemas-de-screening-y-determinacion-de 86/393
Figura 4.4.1. Conexión de un MTA basado en una configuración en flujo a uncromatógrafo de gases.
Sin embargo, también existe otra alternativa mixta en la que se utiliza un MTA
para desarrollar todas las operaciones previas del proceso analítico, pero sin estar
conectado directamente al instrumento, aunque esta última etapa también se puede
automatizar utilizando un automuestreador. Esta es la alternativa preferida en los
laboratorios de rutina, que suelen dedicar el día de trabajo al tratamiento de las
muestras, disponiendo de los extractos finales en los viales del automuestreador para
que el instrumento los analice durante la noche. Un ejemplo de este tipo de sistemas se
encuentra esquematizado en la figura siguiente.
MTA VMuestrareal
Detector4-5 µL
Gas (fase móvil) Desecho
Válvula de inyección
Purga del septum
División del flujo
Columnacromatográfica
Introducción General Metodologías para la Determinación de Residuos de Plaguicidas

7/18/2019 Automatizacion y Miniaturizacion de Sistemas de Screening y Determinacion de Residuos de Plaguicidas en Muestra Agroalimentaria
http://slidepdf.com/reader/full/automatizacion-y-miniaturizacion-de-sistemas-de-screening-y-determinacion-de 87/393
Figura 4.4.2. Esquema de un MTA fuera de línea con el cromatógrafo de gases.
La aplicación de los módulos de tratamiento automático en el análisis de
residuos de plaguicidas supone una serie de ventajas, entre las que destacan la
disminución del consumo de reactivos y disolventes, la disminución en el volumen de
productos de desecho, así como de la intervención humana y del tiempo necesario para
desarrollar el análisis. Todo ello redunda en una disminución del coste del análisis y del
riesgo de contaminación del operario [75].
En los últimos años, el análisis en flujo se ha desarrollado enormemente,
automatizando operaciones clásicas en química, como son la extracción líquido-líquido,
separaciones por precipitación, reacciones de derivatización, extracción en fase sólida ytécnicas de preconcentración, que actualmente se pueden llevar a cabo de forma
continua. En este contexto, podemos ver que del total de 10447 referencias (Fuente:
Bomba peristáltica
VI
VI
Portador
Eluyente
Columnaadsorbente
Desecho
GC
150 µL
Desecho
Muestra
MTA
Almudena Columé Díaz Tesis Doctoral
ili ió d é i á i 113 á l i d l d i ió d

7/18/2019 Automatizacion y Miniaturizacion de Sistemas de Screening y Determinacion de Residuos de Plaguicidas en Muestra Agroalimentaria
http://slidepdf.com/reader/full/automatizacion-y-miniaturizacion-de-sistemas-de-screening-y-determinacion-de 88/393
utilización de técnicas automáticas, 113 están relacionadas con la determinación de
residuos de plaguicidas. La aparición de trabajos dedicados a la automatización en
relación a plaguicidas, se ha ido incrementando, como podemos observar en la Figura
4.4.3.
Figura 4.4.3. Evolución de las publicaciones relacionadas con la automatización demetodologías para la determinación de residuos de plaguicidas. (Fuente: CD-ROMAnalytical Abstracts, WinSPIRS Silver Platter Co. 1980-Abril 2001).
Uno de los primeros trabajos que aparece en la bibliografía sobre la
determinación de plaguicidas utilizando métodos automatizados (1990) se debe a A.
Farrán et al. [76] quienes determinaron plaguicidas organofosforados en agua utilizando
un sistema continuo de inyección en flujo en el cual se realizaba, de manera automática,
1985 1986 1987 1988 1989 1990 1991 1992 1993 1994 1995 1996 1997 1998 1999 20000
2
4
6
8
10
12
14
16
1985 1986 1987 1988 1989 1990 1991 1992 1993 1994 1995 1996 1997 1998 1999 20000
2
4
6
8
10
12
14
16
1985 1986 1987 1988 1989 1990 1991 1992 1993 1994 1995 1996 1997 1998 1999 20000
2
4
6
8
10
12
14
16
Introducción General Metodologías para la Determinación de Residuos de Plaguicidas
l t ió d l l i id h t l t i ió d f

7/18/2019 Automatizacion y Miniaturizacion de Sistemas de Screening y Determinacion de Residuos de Plaguicidas en Muestra Agroalimentaria
http://slidepdf.com/reader/full/automatizacion-y-miniaturizacion-de-sistemas-de-screening-y-determinacion-de 89/393
la extracción del plaguicida con heptano y la posterior separación de fases con un
separador de membrana, conectado de forma continua con LC-UV.
4.5. SISTEMAS DE SCREENING
Los sistemas de screening o criba están constituidos por las herramientas y los
procesos analíticos que proporcionan con gran rapidez información analítica [75]. Están
directamente relacionados con la automatización, miniaturización y simplificación, que
son las tendencias básicas comentadas en el apartado anterior. Estos sistemas se
caracterizan por:
1. Presentar un mayor énfasis cualitativo que cuantitativo.
2. Rapidez.
3. Ofrecer una respuesta binaria SI/NO que requiere una confirmación
mediante la aplicación de una metodología analítica adicional.
4. Empleo inmediato de la respuesta binaria obtenida para la toma de
decisiones.
Los sistemas desarrollados pueden dividirse en dos grandes grupos,
dependiendo de cuál sea el objeto del screening.
• Sistemas de screening de muestras. Tienen como objetivo identificar y
seleccionar un grupo de muestras en un conjunto de las mismas que tengan
un analito (o grupo de los mismos) por encima de un determinado nivel de
concentración
Almudena Columé Díaz Tesis Doctoral
• Sistemas de screening de analitos Se refieren a la identificación de un

7/18/2019 Automatizacion y Miniaturizacion de Sistemas de Screening y Determinacion de Residuos de Plaguicidas en Muestra Agroalimentaria
http://slidepdf.com/reader/full/automatizacion-y-miniaturizacion-de-sistemas-de-screening-y-determinacion-de 90/393
• Sistemas de screening de analitos. Se refieren a la identificación de un
analito o grupo de los mismos en un determinado tipo de muestra o sistema.
La presente Memoria centra uno de sus objetivos en el desarrollo de métodos
automáticos basados en el análisis en flujo para la determinación de residuos
plaguicidas en muestras agroalimentarias. Además, estos métodos han de ser rápidos
(screening de muestras) y eficaces, para ser factible su implantación en laboratorios de
rutina, y suficientemente sensibles para alcanzar los LMR establecidos en la legislación.
Introducción General Metodologías para la Determinación de Residuos de Plaguicidas
La Memoria se encuentra estructurada de forma que al inicio de cada capítulo

7/18/2019 Automatizacion y Miniaturizacion de Sistemas de Screening y Determinacion de Residuos de Plaguicidas en Muestra Agroalimentaria
http://slidepdf.com/reader/full/automatizacion-y-miniaturizacion-de-sistemas-de-screening-y-determinacion-de 91/393
La Memoria se encuentra estructurada de forma que al inicio de cada capítulo
se muestra la combinación de muestras, analitos, metodologías y detectores que entran
a formar parte del mismo. El esquema al que se hace referencia es el siguiente:
De esta forma se pretende ofrecer una información inicial sobre los tópicos que
se pretenden abordar en cada uno de los capítulos.
FLUIDOSBIOLOGICOSAGUAS
ORGANOCLORADOS
PIRETROIDES
DERIVATIZACION
EVAPORACION
LIOFILIZACION
SPE
FTIRGC-MSGC-ECD
MUESTRAS
HORTALIZASFRUTAS
Almudena Columé Díaz Tesis Doctoral
REFERENCIAS

7/18/2019 Automatizacion y Miniaturizacion de Sistemas de Screening y Determinacion de Residuos de Plaguicidas en Muestra Agroalimentaria
http://slidepdf.com/reader/full/automatizacion-y-miniaturizacion-de-sistemas-de-screening-y-determinacion-de 92/393
REFERENCIAS
[1] Comisión de las Comunidades Europeas, Libro Blanco sobre Seguridad
Alimentaria, Bruselas, 2000.
[2] R. Coscolla, Residuos de Plaguicidas en Alimentos Vegetales, Mundi-Prensa,
Madrid, 1993.
[3] Real Decreto 280/1994, BOE nº 58, Ministerio de la Presidencia, Madrid,
1994.
[4] Directiva Comunitaria 76/895/CEE , DO L 340, Comunidad Europea,
Bruselas, 1976.
[5] Programa Conjunto FAO/OMS sobre Normas Alimentarias, Codex
Alimentarius, Comisión del Codex Alimentarius, Roma, 1997.
[6] Recomendación Comunitaria 153/99/COL, DO L 74, Comunidad Europea,
Bruselas, 1999.
[7] H. D. Belitz, W. Grosch, Química de los Alimentos, Acribia S.A., Zaragoza,
1997.
[8] Real Decreto 3349/1983, BOE nº 20, Ministerio de la Presidencia, Madrid,
1983.
[9] C. Tomlin (Editor), The Pesticide Manual, 10th edn., British Crop Protection,
The Royal Society of Chemistry, London, 1994.
[10] C. Liñán Vicente (Editor), Vademécum de productos Fitosanitarios y
Nutricionales 14th edn Agrotécnicas S L Madrid 1998
Introducción General Referencias
[11] E. Alday et al., Toxicología Laboral Básica, Instituto Nacional de Seguridad e

7/18/2019 Automatizacion y Miniaturizacion de Sistemas de Screening y Determinacion de Residuos de Plaguicidas en Muestra Agroalimentaria
http://slidepdf.com/reader/full/automatizacion-y-miniaturizacion-de-sistemas-de-screening-y-determinacion-de 93/393
[11] E. Alday et al., x g , Instituto Nacional de Seguridad e
Higiene en el Trabajo, Sevilla, 1989.
[12] E. D. Ongley, Control of Water Pollution from Agriculture, FAO/OMS, Roma,
1996.
[13] FAO, Manual on the Submission and Evaluation of Pesticide Residues Data
for the Estimation of Maximun Residue Levels in Food and Feed , Roma, 1997.
[14] Directiva Comunitaria 91/414/CEE , DO L 230, Comunidad Europea,
Bruselas, 1991.
[15] Excepted from FDA Consumer, FDA Reports on Pesticides in Foods, FDA,
1993.
[16] Directiva Comunitaria 80/778/CEE , DO L 229, Comunidad Europea,
Bruselas, 1980.
[17] Real Decreto 1138/1990, BOE nº 226, Ministerio de la Presidencia, Madrid,
1990.
[18] Programa Conjunto FAO/OMS sobre Normas Alimentarias, Métodos de
Muestreo Recomendados para la Determinación de Plaguicidas a Efectos del
Cumplimiento de los LMRs, Roma, 1999.
[19] Directiva Comunitaria 79/700/CEE , DO L 207, Comunidad Europea,
Bruselas, 1980.
[20] Directiva Comunitaria 80/778/CEE , DO L 229, Comunidad Europea,
Bruselas 1979
Almudena Columé Díaz Tesis Doctoral
[21] Orden de 8 de Febrero de 1998, BOE nº 53, Ministerio de la Presidencia,

7/18/2019 Automatizacion y Miniaturizacion de Sistemas de Screening y Determinacion de Residuos de Plaguicidas en Muestra Agroalimentaria
http://slidepdf.com/reader/full/automatizacion-y-miniaturizacion-de-sistemas-de-screening-y-determinacion-de 94/393
[ ] , , ,
Madrid, 1998.
[22] Programa Conjunto FAO/OMS sobre Normas Alimentarias, Directrices sobre
Buenas Prácicas en el Análisis de Residuos de Plaguicidas, Roma, 1993.
[23] G. F. Pang, Y. Z. Cao, C. L. Fan, J. J. Zhang, X. M. Li, J. AOAC 82 (1999)
186.
[24] F. J. Schenck, V. Howard-King, Bull. Environ. Contam. Toxicol. 63 (1999)
277.
[25] A. di Muccio, D. A. Barbini, T. Generali, P. Pelosi, A. Ausili, F. Vergori, I.
Camoni, J. Chromatogr. A 765 (1997) 39.
[26] P. D. Johnson, D. A. Rimmer, R. H. Brown , J. Chromatogr. A 765 (1997) 3.
[27] H. J. Stan, M. Linkerhaegner, J. Chromatogr. A 750 (1996) 369.
[28] M. Imanaka, M. Kadota, K. Kumashiro, T. Mori, J. AOAC 79 (1996) 538.
[29] M. V. Russo, Chromatographia 51 (2000) 71.
[30] G. F. Pang, Y. Z. Chao, C. L. Fan, J. J. Zhang, X. M. Li, T. S. Zhao, J. AOAC
78 (1995) 1481.
[31] E. Bolygo, S. T. Hadfield, J. High Resolut. Chromatogr. 13 (1990) 457.
[32] A. Agüera, L. Piedra, M. D. Hernando, A. R. Fernández-Alba, M. Contreras,
Analyst 125 (2000) 1397.
[33] S. A. Denloye, G. R. van der Hoff, E. A. Hogendoorn, R. A. Baumann, J.
Agric Food Chem 47 (1999) 2729
Introducción General Referencias
[35] T. J. Class, R. Bacher, W. Boehner, M. Bergmann, GIT Fachz Lab. 39 (1995)

7/18/2019 Automatizacion y Miniaturizacion de Sistemas de Screening y Determinacion de Residuos de Plaguicidas en Muestra Agroalimentaria
http://slidepdf.com/reader/full/automatizacion-y-miniaturizacion-de-sistemas-de-screening-y-determinacion-de 95/393
305.
[36] A. Ramesh, M. Balasubramanian, J. AOAC 82 (1999) 725.
[37] A. Sannino, P. Mambriani, M. Bandini, L. Bolzoni, J. AOAC 79 (1996) 1434.
[38] S. Navickiene, L. Polese, P. V. Minelli, M. L. Ribeiro, Chromatographia 49
(1999) 212.
[39] I. Silgoner, R. Krska, E. Lombas, O. Gans, E. Rosenberg, M. Grasserbauer,
Fresenius J. Anal. Chem. 362 (1998) 120.
[40] A. Stensvand, A. Cristiansen, J. Agric. Food Chem. 48 (2000) 917.
[41] M. Weichbrodt, W. Vetter, B. Luckas, J. AOAC 83 (2000) 1334.
[42] L. E. Sojo, A. Brocke, J. Fillion, S. M. Price, J. Cromatogr. A 788 (1997) 141.
[43] F. Modeste, M. Cauren, P. Devaux, J. High Resolut. Chromatogr. 19 (1996)
535.
[44] E. Lacassie, M. F. Dreyfuss, J. L. Daguet, M. Vignaud, P. Marquet, G.
Lachatre, J. Chromatogr. A 805 (1998) 319.
[45] S. Muralidharan, Bull. Environ. Contam. Toxicol. 65 (2000) 35.
[46] H. Lutnicka, T. Bogacka, L. Wolska, Water Research 33 (1999) 3441.
[47] G. Leng, K. H. Kuehn, A. Leng, W. Gries, J. Lewalter, H. Idel,
Chromatographia 46 (1997) 265.
[48] A. M. A. Abd-Allah, J. AOAC 82 (1999) 391.
[49] C Aprea A Stridori G Sciarra J Chromatogr B 695 (1997) 227
Almudena Columé Díaz Tesis Doctoral
[50] M. Saitta, G. di Bella, F. Salvo, S. lo Curto, G. Dugo, J. Agric. Food Chem. 48

7/18/2019 Automatizacion y Miniaturizacion de Sistemas de Screening y Determinacion de Residuos de Plaguicidas en Muestra Agroalimentaria
http://slidepdf.com/reader/full/automatizacion-y-miniaturizacion-de-sistemas-de-screening-y-determinacion-de 96/393
(2000) 797.
[51] M. V. Russo, Chromatographia 52 (2000) 93.
[52] M. V. Russo, G. Goretti, T. Nevigato, Chromatographia 50 (1999) 446.
[53] L. Wolska, M. Wiergowski, K. Galer, T. Gorecki, J. Namiesnik, Chemosphere
39 (1999) 1477.
[54] J. B. Fournier, M. El’Hourch, J. Fournier, Analusis 27 (1999) 726.
[55] J. Liu, O. Suzuki, Forensic Sci. Int. 99 (1999) 159.
[56] M. A. Fernández, C. Alonzo, M. J. González, L. M. Hernández, Chemosphere
38 (1999) 33.
[57] M. J. Hengel, C. R. Mourer, T. Shibamoto, Bull. Environ. Contam. Toxicol. 59
(1997) 171.
[58] J. Angerer, A. Ritter, J. Chromatogr. B 695 (1997) 217.
[59] G. Rene van der Hoff, F. Pelusio, U. A. T. Brinkman, R. A. Baumann, P. van
Zoonen, J. Chromatogr. A 719 (1996) 59.
[60] M. F. Sincik, R. M. Hoff, W. M. J. Strachan, C. W. Sweet, I. Basu, R. A. Hites,
Environ. Sci. Technol. 34 (2000) 361.
[61] I. N. Glazkov, I. A. Revelsky, I. P. Efimov, Y. A. Zolotov , J. Microcolumn
Separations 11 (1999) 729.
[62] R. Fuoco, A. Ceccarini, M. Onor, L. Marrara, J. Chromatogr. A 846 (1999)
387
Introducción General Referencias
[63] R. J. Argauer, K.I. Eller, R. M. Pfeil, R. T. Brown, J. Agric. Food Chem. 45

7/18/2019 Automatizacion y Miniaturizacion de Sistemas de Screening y Determinacion de Residuos de Plaguicidas en Muestra Agroalimentaria
http://slidepdf.com/reader/full/automatizacion-y-miniaturizacion-de-sistemas-de-screening-y-determinacion-de 97/393
(1997) 180.
[64] W. R. Barrionuevo, F. M. Lancast, J. High Resolut. Chromatogr. 23 (2000)
485.
[65] M. Guidotti, G. Ravaioli, Ann. Chim. 89 (1999) 919.
[66] C. Aguilar, A. Peñalver, E. Pocurull, J. Ferre, F. Borrull, R. M. Marce, J.
Chromatogr. A 844 (1999) 425.
[67] P. Popp, A. Paschke, Chromatographia 49 (1999) 686.
[68] L. S. de Jager, A. R. J. Andrews, Analyst 125 (2000) 1943.
[69] L. S. de Jager, A. R. J. Andrews, Chromatographia 50 (1999) 733.
[70] A. Navas Díaz, F. García Sánchez, A. García Pareja, J. Chromatogr. Sci. 36
(1998) 36.
[71] M. Dondi, M. Flieger, J. Olsovska, C. M. Polcaro, M. Sinibaldi, J. Chromatogr.
A 859 (1999) 133.
[72] E. I. Davidyuk, V. F. Demchenko, M. A. Klisenko, J. Anal. Chem. 52 (1997)
1058.
[73] A. Lamiri, A. Medvedovici, F. David, V. David, P. Sandra, Chem. Anal. 44
(1999) 977.
[74] I. A. Fleet, J. J. Monaghan, D. B. Gordon, G. A. Lord, Analyst 121 (1996) 55.
[75] M. Valcárcel, M. S. Cárdenas, Automatización y Miniaturización en Química
Analítica, Springer, Barcelona, 2000.
[76] A Farran J L Cortina J de Pablo D Barceló Anal Chim Acta 243 (1990)

7/18/2019 Automatizacion y Miniaturizacion de Sistemas de Screening y Determinacion de Residuos de Plaguicidas en Muestra Agroalimentaria
http://slidepdf.com/reader/full/automatizacion-y-miniaturizacion-de-sistemas-de-screening-y-determinacion-de 98/393
CAP ITULO I:

7/18/2019 Automatizacion y Miniaturizacion de Sistemas de Screening y Determinacion de Residuos de Plaguicidas en Muestra Agroalimentaria
http://slidepdf.com/reader/full/automatizacion-y-miniaturizacion-de-sistemas-de-screening-y-determinacion-de 99/393
HERRAMIENTAS ANALITICAS
CHAPTER I:
AN ALYTICAL TOOLS
CAPITULO I

7/18/2019 Automatizacion y Miniaturizacion de Sistemas de Screening y Determinacion de Residuos de Plaguicidas en Muestra Agroalimentaria
http://slidepdf.com/reader/full/automatizacion-y-miniaturizacion-de-sistemas-de-screening-y-determinacion-de 100/393
Herramientas Analíticas Capítulo I

7/18/2019 Automatizacion y Miniaturizacion de Sistemas de Screening y Determinacion de Residuos de Plaguicidas en Muestra Agroalimentaria
http://slidepdf.com/reader/full/automatizacion-y-miniaturizacion-de-sistemas-de-screening-y-determinacion-de 101/393
Para el desarrollo experimental de esta Memoria se ha recurrido a diferentes
herramientas analíticas, desde reactivos, disolventes y material de vidrio, a
cromatógrafos y espectrómetros, así como los diferentes componentes que entran a
formar parte de los módulos automáticos de flujo continuo. En este capítulo de la
Memoria se enumeran dichas herramientas junto con sus características más relevantes.
I.1. ESTANDARES Y REACTIVOS
I.1.1 Estándares de plaguicidas/metabolitos
a) Estándares de plaguicidas organoclorados y piretroides. La pureza de todos
estos estándares es del 99% y pertenecen a la casa comercial Riedel-DeHaën.
La mayoría de ellos son sólidos y todos vienen presentados en frascos de color
topacio para evitar su degradación con la luz. Además, para su correcta
conservación se mantuvieron en un lugar seco y a menos de 20 ºC. La relación
d di h á d d l i id l i i
Almudena Columé Díaz Tesis Doctoral
a.1) Estándares de plaguicidas organoclorados:

7/18/2019 Automatizacion y Miniaturizacion de Sistemas de Screening y Determinacion de Residuos de Plaguicidas en Muestra Agroalimentaria
http://slidepdf.com/reader/full/automatizacion-y-miniaturizacion-de-sistemas-de-screening-y-determinacion-de 102/393
• α,β,γ ,δ-Hexaclorohexano
(1:1:1:1, p/p), (α,β,γ ,δ-HCH)
• Lindano, (γ -HCH)
• Hexaclorobenceno, (HCB)
• α,β-Endosulfán (3:1, p/p)
• Endosulfán sulfato
• Heptacloro
• Aldrín
• Dieldrín
• Endrín
• Dicofol
• Clordane
• Clorbenside
• Iprodiona
• Captafol
• Metoxicloro
• Diclorán
• Vinclozolina
• Diclofluanida
• Captán
• Procimidona
a.2) Estándares de plaguicidas piretroides:
• Butóxido de piperonilo
• Bifentrín
• Fenpropatrín
• λ-Cihalotrín
• Cipermetrín (I+II+III+IV)
• Ciflutrín (I+II+III+IV)
• α-Cipermetrín
• β-Ciflutrín
• Permetrín
• Fenvalerato
• Deltametrín
Herramientas Analíticas Capítulo I
Ciflutrín y cipermetrín están formados por 4 isómeros: 1(RS)cis,α(RS) que es

7/18/2019 Automatizacion y Miniaturizacion de Sistemas de Screening y Determinacion de Residuos de Plaguicidas en Muestra Agroalimentaria
http://slidepdf.com/reader/full/automatizacion-y-miniaturizacion-de-sistemas-de-screening-y-determinacion-de 103/393
el isómero I; 1(RS)trans,α(RS), isómero III; 1(RS)cis,α(SR), isómero II; y
1(RS)trans,α(SR), isómero IV; α-cipermetrín es el isómero III de cipermetrín y β-
ciflutrín es la mezcla de los isómeros II y IV de ciflutrín en la proporción 1:2.
b) Estándares de metabolitos de piretroides. La pureza de todos estos estándares
es del 99.5% y pertenecen a la casa comercial Dr. Ehrenstorfer. Todos ellos
vienen preparados en disolución de metanol, a concentraciones de 2 y 20 ppm,
presentados en ampollas de color topacio para evitar su degradación con la
luz. Para su correcta conservación se mantuvieron a 4ºC. La relación de
dichos estándares de plaguicidas es la siguiente:
• Ácido carboxílico cis y trans-3-(2,2-diclorovinil)-2,2-dimetil-
(1-ciclopropano), (cis y trans-DCCA)
• Ácido carboxílico cis-3-(2,2-dibromovinil)-2,2-dimetil-(1-
ciclopropano), (cis-DBCA)
• Ácido 3-fenoxibenzoico, (PBA)
I.1.2. Sólidos adsorbentes
Aunque fueron varios los sólidos adsorbentes que se ensayaron, únicamente dos
de ellos son los que finalmente se utilizaron en esta Memoria. Con estos sólidos se
Almudena Columé Díaz Tesis Doctoral
rellenaron las columnas adsorbentes utilizadas en las configuraciones continuas en

7/18/2019 Automatizacion y Miniaturizacion de Sistemas de Screening y Determinacion de Residuos de Plaguicidas en Muestra Agroalimentaria
http://slidepdf.com/reader/full/automatizacion-y-miniaturizacion-de-sistemas-de-screening-y-determinacion-de 104/393
flujo, para realizar el proceso automatizado de la extracción en fase sólida.
• RP-C18. Las características de este adsorbente, que presenta la casa comercial
Sigma en un envase de 10 g, son las de un polvo de tamaño de partícula 15-40
µm, con un diámetro de 60 Å y un área superficial de 500 m2/g.
• Sílica. La casa comercial Varian presenta cartuchos Bond Elut con fase de
sílica de 500 mg. Dicha cantidad ocupa un volumen de 3 cm 3 en el cartucho.
Sin embargo, los cartuchos no fueron utilizados como tales, sino que se
vaciaron y con su contenido se rellenaron las columnas adsorbentes utilizadas.
I.1.3. Reactivos derivatizadores
En el Cap. V de esta Memoria se aborda la determinación de plaguicidas
organoclorados y de metabolitos de piretroides en muestras de orina. Pero debido al
hecho de que dichos metabolitos no son suficientemente volátiles ni sensibles al ECD, para su determinación por cromatografía de gases es necesario derivatizarlos. Los
reactivos empleados, suministrados por Aldrich, son:
• 1,1,1,3,3,3-hexafluoroisopropanol, (HFIP)
• diisopropilcarbodiimida, (DIC)
En esta derivatización, los metabolitos (DCCA, DBCA y PBA) son
hexafluorados, mediante un enlace éster con la molécula de HFIP. El papel de DIC es el
Herramientas Analíticas Capítulo I
5:8:85 (v/v/v). De esta forma, la reacción de derivatización se lleva a cabo

7/18/2019 Automatizacion y Miniaturizacion de Sistemas de Screening y Determinacion de Residuos de Plaguicidas en Muestra Agroalimentaria
http://slidepdf.com/reader/full/automatizacion-y-miniaturizacion-de-sistemas-de-screening-y-determinacion-de 105/393
simultáneamente a la elución.
I.1.4. Otros reactivos
• Disolventes orgánicos. Se han utilizado para preparar las disoluciones de
patrones, sus diluciones, como eluyentes de los sistemas de flujo y para
limpiar las columnas adsorbentes y acondicionarlas antes de hacer pasar por
ellas cada muestra. Estos disolventes, de calidad HPLC y suministrados por
Merck, son: éter de petróleo, acetona, n-hexano, acetato de etilo, etanol,
isopropanol, acetonitrilo y metanol.
• Ácidos y bases. En diferentes capítulos de esta Memoria ha sido necesario el
ajuste de pH (muestras acuosas y de orina y disolución de Brine), para lo cual
se han empleado disoluciones de hidróxido sódico, hidróxido potásico, ácido
clorhídrico y de ácido nítrico de concentraciones variables. También se ha
utilizado ácido sulfúrico concentrado para la hidrólisis ácida de las muestras
de orina (Cap. V), y la llamada disolución de Brine (Cap. II.2), compuesta por
una disolución reguladora de fosfato potásico saturada con cloruro sódico.
Todos ellos, de grado analítico o superior, fueron suministrados por la casa
comercial Merck.
• Otros reactivos. Bajo este epígrafe tan amplio se engloban los siguientes
Almudena Columé Díaz Tesis Doctoral
extracto orgánico procedente de la extracción de frutas frescas (Cap. II.2)
t d i t d id l i t d fl j lf t ódi hid (M k)

7/18/2019 Automatizacion y Miniaturizacion de Sistemas de Screening y Determinacion de Residuos de Plaguicidas en Muestra Agroalimentaria
http://slidepdf.com/reader/full/automatizacion-y-miniaturizacion-de-sistemas-de-screening-y-determinacion-de 106/393
antes de ser introducido en el sistema de flujo; sulfato sódico anhidro (Merck),
para secar las fases orgánicas antes de ser inyectadas en los sistemas
cromatográficos; tiosulfato sódico (Merck), empleado como agente declorante
en muestras acuosas (Cap. IV). En el módulo automático de
evaporación/redisolución, utilizado para el cambio de disolvente en el Cap. II,
así como en la evaporación del disolvente orgánico necesaria en el Cap. IV.2,
se empleó gas nitrógeno de calidad 1, suministrado por Air Liquide.
• Material de vidrio común en laboratorio, clase A. Todo el material de vidrio
se lavó antes de ser utilizado, manteniéndolo sumergido en una disolución
jabonosa durante 12 horas, y posteriormente de forma secuencial con agua
destilada, acetona y el disolvente con el que se fuera a utilizar.
I.2. COMPONENTES DE LOS SISTEMAS DE FLUJO CONTINUO
Los sistemas de flujo empleados en esta Memoria han estado enfocados a la
automatización de las técnicas de extracción, de cambio de disolvente y de extracción
en fase sólida, evitando tediosos procedimientos manuales que conllevan mayor gasto
de disolventes y tiempo, así como una mayor intervención por parte del operario. En
estos sistemas de flujo se han empleado los siguientes componentes:
• Bombas peristálticas (Gilson Minipuls 2), para la aspiración de las muestras y
Herramientas Analíticas Capítulo I
• Tubos de bomba, de cloruro de polivinilo para muestras acuosas y Solvaflex
di l t á i d dif t diá t

7/18/2019 Automatizacion y Miniaturizacion de Sistemas de Screening y Determinacion de Residuos de Plaguicidas en Muestra Agroalimentaria
http://slidepdf.com/reader/full/automatizacion-y-miniaturizacion-de-sistemas-de-screening-y-determinacion-de 107/393
para disolventes orgánicos, de diferentes diámetros.
• Tubos de conducción de PTFE, de 0.5 mm de diámetro interno, para fabricar
reactores, bucles y serpentines.
• Conectores de PTFE (Omnifit), para unir los tubos de conducción con los
diferentes componentes del sistema de flujo.
• Válvulas de inyección, Rheodyne, de 6 vías, donde se insertan las
minicolumnas adsorbentes o los bucles que determinan el volumen de
disolvente eluyente necesario en cada metodología desarrollada.
• Minicolumnas adsorbentes. La mayor parte de ellas son de propia fabricación
en el laboratorio, a partir de tubos de vidrio de 4 mm de diámetro interno,
donde se empaqueta el sólido adsorbente (RP-C18 o sílica) y se sellan con
pequeñas porciones de algodón o lana de vidrio para evitar pérdidas del
material adsorbente. Sin embargo, en otras ocasiones (Cap. II.1, IV.1 y V.1)
se ha empleado una columna de vidrio comercial (Omnifit) de 2 cm de
longitud y 2.5 mm de diámetro interno.
Almudena Columé Díaz Tesis Doctoral
• Unidad de evaporación/redisolución. En el Cap. II los plaguicidas
organoclorados se extraen de las muestras hortofrutícolas con disolventes

7/18/2019 Automatizacion y Miniaturizacion de Sistemas de Screening y Determinacion de Residuos de Plaguicidas en Muestra Agroalimentaria
http://slidepdf.com/reader/full/automatizacion-y-miniaturizacion-de-sistemas-de-screening-y-determinacion-de 108/393
organoclorados se extraen de las muestras hortofrutícolas con disolventes
orgánicos, los cuales no permiten una retención cuantitativa de los plaguicidas
en las columnas adsorbentes diseñadas para la extracción en fase sólida. Por
ello es necesaria una etapa de cambio de disolvente, desde el disolvente
orgánico a agua destilada. Para automatizar esta etapa se desarrolló la unidad
de evaporación/redisolución que se muestra en la Figura I.1. En esta unidad, la
fase orgánica cae, gota a gota, en un tubo de vidrio, provisto de un tapón con
tres orificios, que contiene 5 mL de agua destilada y, simultáneamente, es
evaporada mediante una corriente de N2 que borbotea, ayudando a la
homogeneización de la disolución.
Bomba peristáltica
...
1.0mL/minMuestra(disolución orgánica)
N2
Sistema de flujo para SPE
Bomba peristáltica
......
1.0mL/minMuestra(disolución orgánica)
N2
Sistema de flujo para SPE
Herramientas Analíticas Capítulo I
• Unidades de filtración. Al igual que en el caso de las minicolumnas
adsorbentes se han empleado unidades de filtración de fabricación propia

7/18/2019 Automatizacion y Miniaturizacion de Sistemas de Screening y Determinacion de Residuos de Plaguicidas en Muestra Agroalimentaria
http://slidepdf.com/reader/full/automatizacion-y-miniaturizacion-de-sistemas-de-screening-y-determinacion-de 109/393
adsorbentes, se han empleado unidades de filtración de fabricación propia,
elaboradas con tubos de vidrio de distintas longitudes y de 4 mm de diámetro
interno y rellenas de algodón (Cap. III y V.1), o un filtro comercial (Omnifit
3303, con disco de papel Whatman nº 1) (Cap. II.1). En cualquier caso, las
unidades de filtración se situaron a la entrada del canal de la muestra para
evitar la aspiración de pequeñas partículas sólidas en suspensión (que
ocasionalmente pudiesen aparecer en los extractos), que pudieran obstruir el
sistema de flujo.
• Unidad de decoloración. Esta unidad utilizada para decolorar el extracto
orgánico procedente de la extracción de frutas frescas (Cap. II.2), también es
de fabricación en el laboratorio. Para ello se utilizó un tubo de vidrio de 5 cm
de longitud y 4 mm de diámetro interno que se rellenó con el material
decolorante. Además, esta unidad también hizo las veces de filtro, por lo que
no fue necesario incluir una unidad de filtración adicional.
I.3. INSTRUMENTOS
Para el desarrollo de esta Memoria se utilizaron dos cromatógrafos de gases,
con diferentes detectores, y un espectrómetro de infrarrojo.
• Cromatógrafo de gases Hewlett-Packard modelo 5890 A, equipado con un
63
Almudena Columé Díaz Tesis Doctoral
empaquetadas y otro para columnas capilares y semicapilares. Sin embargo,
únicamente se ha utilizado el ECD y el portal para columnas capilares (Cap.

7/18/2019 Automatizacion y Miniaturizacion de Sistemas de Screening y Determinacion de Residuos de Plaguicidas en Muestra Agroalimentaria
http://slidepdf.com/reader/full/automatizacion-y-miniaturizacion-de-sistemas-de-screening-y-determinacion-de 110/393
C y p p p (C p
II, III y IV.1). El volumen de inyección de muestra fue de 1 µL (medido con
una jeringa de precisión Hamilton de 5 µL), empleándose el modo de división
de flujo (1:25) y nitrógeno de calidad 2 (Air Liquide) como gas portador a un
caudal de 1 mL/min. La temperatura del portal de inyección se fijó en 225ºC.
La separación de los plaguicidas se realizó en una columna capilar HP-5
de 30 m x 0.25 mm, de fase estacionaria 5% fenilmetilpolisiloxano, con un
espesor de película de 0.25 µm. El detector se mantuvo a 325ºC, empleándose
como gas auxiliar N2 a un caudal de 60 mL/min. Las señales procedentes del
detector fueron recogidas y transducidas por un integrador Hewlett-Packard
modelo 3392.
• Cromatógrafo de gases Thermo Instruments modelo GC8060 series, acoplado
a un espectrómetro de masas Thermo Instruments modelo MD800. Lainterfase consiste en una línea de transferencia que introduce el capilar de la
columna cromatográfica en la cámara de ionización del analizador
cuadrupolar, la cual se mantuvo a 200ºC para evitar la condensación de los
analitos. Se inyectó 1 µL del extracto orgánico, empleando una jeringa de
precisión Hamilton de 5 µL y manteniendo una división flujo 1:25. El gas
portador fue Helio ultrapuro (Air Liquide) a un caudal de 1 mL/min. La
Herramientas Analíticas Capítulo I
5MS) para una mejor compatibilidad con el detector. El instrumento está
controlado por el software MASSLAB, de Thermo Instruments, instalado en un
7/18/2019 Automatizacion y Miniaturizacion de Sistemas de Screening y Determinacion de Residuos de Plaguicidas en Muestra Agroalimentaria
http://slidepdf.com/reader/full/automatizacion-y-miniaturizacion-de-sistemas-de-screening-y-determinacion-de 111/393
p , ,
ordenador personal donde también se encuentran instaladas las bibliotecas de
espectros Pesticide y Nist . Este cromatógrafo ha sido utilizado como técnica
de confirmación de los resultados positivos de plaguicidas en productos
hortofrutícolas y muestras acuosas (Cap. II, III, IV.1), y también para la
determinación y cuantificación de los mismos en fluidos biológicos (Cap. V).
• Espectrómetro de infrarrojo con Transformada de Fourier (FTIR) Bruker,
modelo IFS 66, equipado con una celda horizontal de reflectancia total
atenuada (ATR) de SensIR Technologies, modelo Dura SamplIR, y un
detector de sulfato de triglicina (DTGS). El espectrómetro se controló
mediante el software OPUS OS/2 3.0/IR (Bruker). Los espectros se
recogieron en el rango de 4000 a 500 cm-1 (infrarrojo medio), y cada espectro
requirió 128 scans a una resolución espectral de 4 cm -1. Este espectrómetro
fue utilizado en la determinación de plaguicidas en muestras acuosas en el
Cap. IV.2.
• Otros instrumentos:
o Balanza analítica de precisión (Ohaus, modelo Explorer).
o pH-metro (Crison, modelo micropH 2000).
Almudena Columé Díaz Tesis Doctoral
I.4. APARATOS
Los aparatos empleados en esta Memoria se enumeran a continuación:

7/18/2019 Automatizacion y Miniaturizacion de Sistemas de Screening y Determinacion de Residuos de Plaguicidas en Muestra Agroalimentaria
http://slidepdf.com/reader/full/automatizacion-y-miniaturizacion-de-sistemas-de-screening-y-determinacion-de 112/393
• Liofilizador Hetosicc, modelo CD 53-1, equipado con una cámara de
liofilización que cuenta con 3 bandejas de distribución. Este aparato se utilizó
en la liofilización de muestras hortofrutícolas requerida en el Cap. III.
• Baño de aceite termostatado (Selecta), utilizado para la hidrólisis ácida de
muestras de orina en el Cap. V.
• Agitador magnético (Selecta, modelo SBS), utilizado en la automatización de
la etapa de extracción de muestras hortofrutícolas (Cap. II.2, III).
CAP ITU LO II:
PLAGUICIDAS ORGANOCLORADOS
EN HORTALIZAS Y FRU TAS FR ESCAS
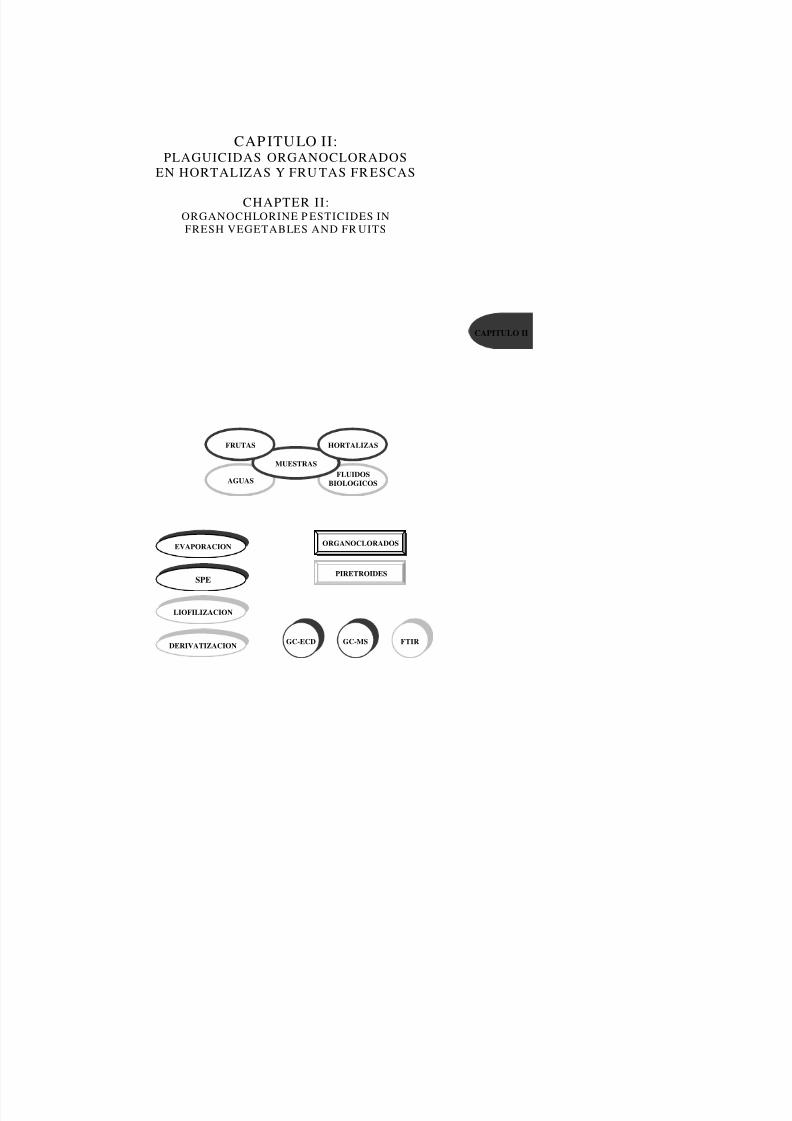
7/18/2019 Automatizacion y Miniaturizacion de Sistemas de Screening y Determinacion de Residuos de Plaguicidas en Muestra Agroalimentaria
http://slidepdf.com/reader/full/automatizacion-y-miniaturizacion-de-sistemas-de-screening-y-determinacion-de 113/393
EN HORTALIZAS Y FRU TAS FR ESCAS
CHAPTER II:
ORGANOCHLORINE P ESTICIDES IN
FRESH VEGETABLES AND FR UITS
CAPITULO II
FLUIDOSBIOLOGICOSAGUAS
ORGANOCLORADOS
PIRETROIDES
EVAPORACION
SPE
MUESTRAS
HORTALIZASFRUTAS

7/18/2019 Automatizacion y Miniaturizacion de Sistemas de Screening y Determinacion de Residuos de Plaguicidas en Muestra Agroalimentaria
http://slidepdf.com/reader/full/automatizacion-y-miniaturizacion-de-sistemas-de-screening-y-determinacion-de 114/393
Organoclorados en Hortalizas y Frutas Frescas Capítulo II

7/18/2019 Automatizacion y Miniaturizacion de Sistemas de Screening y Determinacion de Residuos de Plaguicidas en Muestra Agroalimentaria
http://slidepdf.com/reader/full/automatizacion-y-miniaturizacion-de-sistemas-de-screening-y-determinacion-de 115/393
Los métodos analíticos para la determinación de plaguicidas [1] se pueden
englobar en dos grandes grupos:
1. Métodos multiresiduos (MRMs), capaces de determinar simultáneamente
más de un residuo en un solo análisis [2,3]. Tienen un amplio espectro de
aplicabilidad por lo que son eficaces en el análisis de muestras de las que se
desconoce qué tratamiento con plaguicidas se ha aplicado.
2. Métodos diseñados para la determinación de un sólo plaguicida [4,5],
utilizados cuando se sabe qué residuo se pretende determinar y/o cuando el
residuo de interés no puede ser determinado por un MRM. A veces también
se aplican a la determinación de varios compuestos análogos, como es el
caso de la determinación de plaguicidas ditiocarbamatos (ej. zirám, tirám,
metirám) [6,7].
La metodología de los MRMs requiere, por definición, determinadas etapas que
permitan la separación de los analitos entre sí para que cada uno pueda ser identificado
Almudena Columé Díaz Tesis Doctoral
está restringida a analitos que puedan evaporarse sin sufrir degradación térmica,
mientras que LC ofrece una alternativa para los compuestos termolábiles [8]. Sin
7/18/2019 Automatizacion y Miniaturizacion de Sistemas de Screening y Determinacion de Residuos de Plaguicidas en Muestra Agroalimentaria
http://slidepdf.com/reader/full/automatizacion-y-miniaturizacion-de-sistemas-de-screening-y-determinacion-de 116/393
embargo, debido a la relativa simplicidad y robustez de GC, es ésta la técnica de
elección para la separación de los analitos en la determinación de residuos de
plaguicidas, siempre que sea aplicable.
A su vez, los MRMs se pueden subdividir en:
• MRM selectivos, cuando el MRM está diseñado para determinar residuos
de plaguicidas de una sola familia [9-12].
• MRM multiclase, cuando está diseñado para determinar residuos de
plaguicidas de varias familias [2,3,13].
En este capítulo de la Memoria se aborda el desarrollo de MRM selectivos, para
la determinación de plaguicidas organoclorados en muestras frescas de hortalizas (Cap.
II.1) y frutas (Cap. II.2). En estas metodologías se han introducido módulos de
tratamiento automático de las muestras, basados en sistemas de flujo continuo. Se ha
empleado cromatografía de gases para la separación de los analitos, puesto que estos
presentan las características adecuadas para ello; y gracias a la presencia de átomos
halogenados en la molécula de estos plaguicidas, se seleccionó el detector de captura de
electrones, empleándose la espectrometría de masas como herramienta para la
confirmación de los resultados positivos en relación con la presencia de residuos de
Organoclorados en Hortalizas y Frutas Frescas Capítulo II
REFERENCIAS
[1] FDA, Pesticide Analytical Manual, 3rd Ed., US-FDA, 1999.

7/18/2019 Automatizacion y Miniaturizacion de Sistemas de Screening y Determinacion de Residuos de Plaguicidas en Muestra Agroalimentaria
http://slidepdf.com/reader/full/automatizacion-y-miniaturizacion-de-sistemas-de-screening-y-determinacion-de 117/393
[2] J. Fillion, F. Sauve, J. Selwyn, J. AOAC 83 (2000) 698.
[3] W. N. Sawaya, F. A. Al-Awadhi, T. Saeed, A. Al-Omair, N. Ahmad, A.
Husain, S. Khalafawi, H. Al-Omirah, B. Dashti, H. Al-Amiri, J. Al-Saqer, J.
AOAC 82 (1999) 1458.
[4] M J. Incorvia-Mattina, W. Iammucci-Berger, L. Dykas, J. Agric. Food Chem.
48 (2000) 1909.
[5] S. Navickiene, L. Polese, E. V. Minelli, M. L. Ribeiro, Chromatographia 49
(1999) 212.
[6] A. R. Cassella, R. Jorgensen-Cassella, S. Garrigues, R. E. Santelli, R. C. de
Campos, M. de la Guardia, Analyst 125 (2000) 1829.
[7] H. van Lishaut, W. Schwack, J. AOAC 83 (2000) 720.
[8] A. Kaihara, K. Yoshii, Y. Tsumura, Y. Nakamura, S. Ishimitsu, Y. Tonogai, J.
Health-Sci. 46 (2000) 336.
[9] E. N. Barkatina, A. L. Pertsovsky, V. I. Murokh, N. D. Kolomiets, O. V.
Shulyakovskaya, O. N. Venger, V. I. Makarevich, Bull. Environ. Contam.
Toxicol. 63 (1999) 235.
[10] E. N. Barkatina, V. I. Murokh, N. D. Kolomietz, A. L. Pertsovskii, O. V.
Shulyakovskaya, J. Anal. Chem. 53 (1998) 861.
Almudena Columé Díaz Tesis Doctoral
[12] G. F. Pang, Y. Z. Cao, C. L. Fan, J. J. Zhang, X. M. Li, J. AOAC 82 (1999)
186.

7/18/2019 Automatizacion y Miniaturizacion de Sistemas de Screening y Determinacion de Residuos de Plaguicidas en Muestra Agroalimentaria
http://slidepdf.com/reader/full/automatizacion-y-miniaturizacion-de-sistemas-de-screening-y-determinacion-de 118/393
[13] J. Cook, M. P. Beckett, B. Reliford, W. Hammock, M. Engel, J. AOAC 82
(1999) 1419.
Organoclorados en Hortalizas y Frutas Frescas Capítulo II
JOURNAL OFCHROMATOGRAPHY A
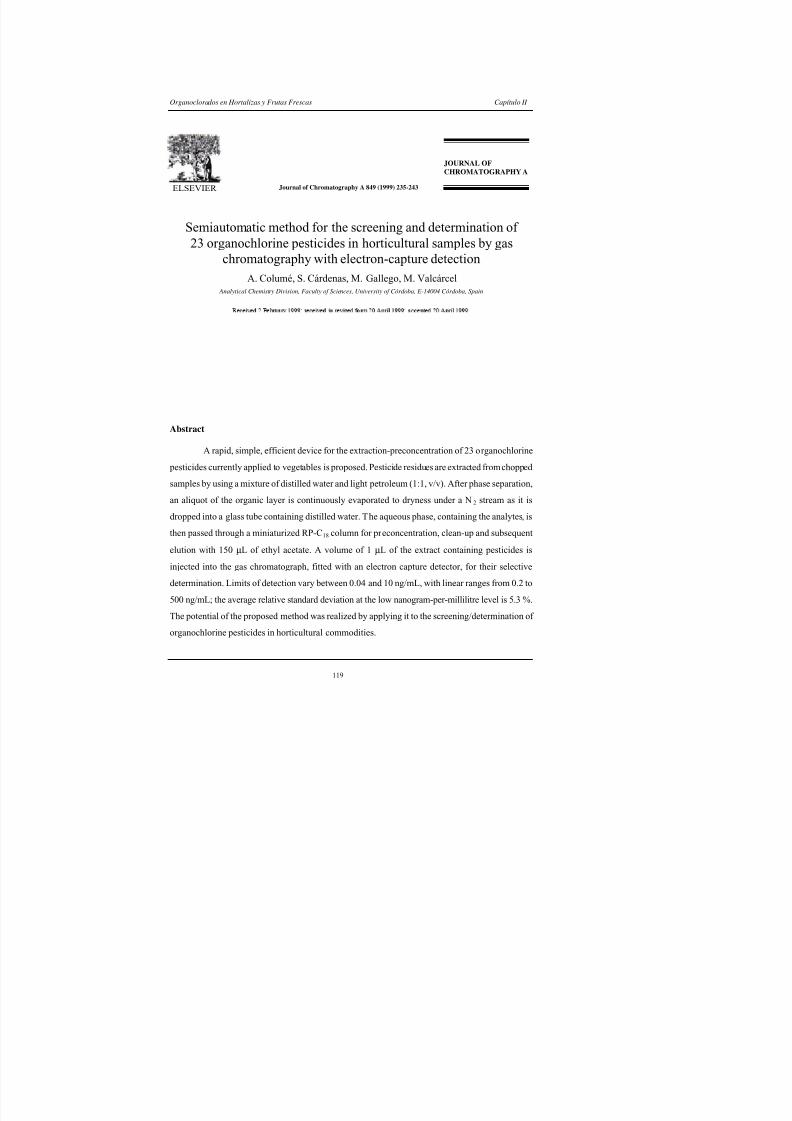
7/18/2019 Automatizacion y Miniaturizacion de Sistemas de Screening y Determinacion de Residuos de Plaguicidas en Muestra Agroalimentaria
http://slidepdf.com/reader/full/automatizacion-y-miniaturizacion-de-sistemas-de-screening-y-determinacion-de 119/393
Abstract
A rapid, simple, efficient device for the extraction-preconcentration of 23 organochlorine
pesticides currently applied to vegetables is proposed. Pesticide residues are extracted from chopped
samples by using a mixture of distilled water and light petroleum (1:1, v/v). After phase separation,
an aliquot of the organic layer is continuously evaporated to dryness under a N 2 stream as it is
dropped into a glass tube containing distilled water. The aqueous phase, containing the analytes, is
then passed through a miniaturized RP-C18 column for preconcentration, clean-up and subsequent
elution with 150 µL of ethyl acetate. A volume of 1 µL of the extract containing pesticides is
injected into the gas chromatograph, fitted with an electron capture detector, for their selectivedetermination. Limits of detection vary between 0.04 and 10 ng/mL, with linear ranges from 0.2 to
500 ng/mL; the average relative standard deviation at the low nanogram-per-millilitre level is 5.3 %.
Semiautomatic method for the screening and determination of
23 organochlorine pesticides in horticultural samples by gaschromatography with electron-capture detectionA. Columé, S. Cárdenas, M. Gallego, M. Valcárcel
Analytical Chemistry Division, Faculty of Sciences, University of Córdoba, E-14004 Córdoba, Spain
Journal of Chromatography A 849 (1999) 235-243ELSEVIER
Almudena Columé Díaz Tesis Doctoral
1. INTRODUCTION
Public concern over pesticide residues has risen over the past decade to the point

7/18/2019 Automatizacion y Miniaturizacion de Sistemas de Screening y Determinacion de Residuos de Plaguicidas en Muestra Agroalimentaria
http://slidepdf.com/reader/full/automatizacion-y-miniaturizacion-de-sistemas-de-screening-y-determinacion-de 120/393
where it has become a significant food safety issue. This concern has materialized in the
joint issuance by the European Union and the governments of its member countries of
maximum residue limits (MRLs) for pesticide residues in a variety of agricultural foods [1].
Analytical methods for pesticide residues are mainly used to control foods for human
consumption (particularly fruits and vegetables, which usually receive direct applications of
pesticides) [2]. Organochlorine pesticides (OCPs) are of special interest in this context as
their high chemical stability results in their persistence and bioaccumulation in the
environment and animal tissues [3]. Sensitive, rapid, reliable methods for the routine
determination of OCP residues in fruit and vegetables are thus much needed. The high
sensitivity required arises from the need to meet established MRLs which can be as low as
10 ng/Kg depending on the particular pesticide and sample type [1].
The more frequently used methods for analysing OCP residues involve gas
chromatographic separation and selective detection by electron capture [4-9], electrolytic
conductivity [9-11], atomic emission [9,12] detectors or mass spectrometry for confirmation
of positives [4,13,14]. However, these detectors are inadequately selective in many cases
and several extraction and clean-up steps are required to avoid deterioration of the
chromatographic column. Methods involving sample preparation for OCP determination
have been developed for different types of matrices. In most cases, the analytes are extracted
Organoclorados en Hortalizas y Frutas Frescas Capítulo II
propanol/light petroleum [6] or acetonitrile [9,11-14]. At present, multiresidue solvent
extraction with ethyl acetate is superseding earlier extraction methods by virtue of its

7/18/2019 Automatizacion y Miniaturizacion de Sistemas de Screening y Determinacion de Residuos de Plaguicidas en Muestra Agroalimentaria
http://slidepdf.com/reader/full/automatizacion-y-miniaturizacion-de-sistemas-de-screening-y-determinacion-de 121/393
simplicity and expeditiousness, which result in decreased costs. However, this solvent also
extracts a number of indigenous compounds present in most agricultural commodities [4]; in
this regard, the use of solid-phase clean-up in combination with selective liquid-liquid back-
extractions is recommended to diminish the presence of potential interferents in the final
extract [4,6,9]. In any case, evaporation to dryness is needed to preconcentrate the analytes
and make them compatible with the chromatographic system, taking into account that no
losses are observed for these compounds.
The purpose of this work was to develop a simple, efficient one-step extraction
method for the screening and determination of organochlorine pesticides in vegetables.
After manual extraction of the chopped sample, the extract is cleaned-up, preconcentrated
and eluted on a short RP-C18 column, all on-line; in this way, up to 23 OCP residues can be
identified and determined. The high preconcentration factor achieved enables the
determination of pesticide residues at their MRLs.
2. EXPERIMENTAL
2.1. Chemicals, standards and samples
All chemicals and sorbents were of analytical grade or better. The following
organochlorine pesticides, Pestanal quality, were studied: aldrin, captan, captafol,
Almudena Columé Díaz Tesis Doctoral
endosulfan sulphate, endrin, hexachlorobenzene (HCB), heptachlor, iprodione, α-, β-, δ-
and γ -hexachlorohexane (α-, β-, δ- and γ -HCH 1:1:1:1), lindane (γ -HCH), methoxychlor,

7/18/2019 Automatizacion y Miniaturizacion de Sistemas de Screening y Determinacion de Residuos de Plaguicidas en Muestra Agroalimentaria
http://slidepdf.com/reader/full/automatizacion-y-miniaturizacion-de-sistemas-de-screening-y-determinacion-de 122/393
procymidone, and vinclozolin, all of which were obtained from Riedel-de-Haën (Seelze,
Germany). 2,4-Dichlorophenol (internal standard), and RP-C18 HPLC sorbent were supplied
by Sigma (Madrid, Spain). All other reagents and solvents [ethyl acetate, acetone,
dichloromethane, light petroleum (b.p. 50-70ºC), ethanol and sodium sulphate] were
purchased from Merck (Darmstadt, Germany).
Stock standard solutions of the OCPs were prepared in acetone (except HCB, which
was dissolved in dichloromethane), at concentrations of 5 mg/mL, and stored in glass
stoppered bottles in the dark at 4°C.
Vegetables were purchased at a local market in Córdoba, Spain. Because legally
tolerated limits of pesticide residues have been set for raw materials, samples were analysed
unwashed and in the raw state [15]. Sampling was done according to the protocol
established by legislation [16]. Thus, a raw sample consisting of 10-20 units (∼1 Kg) was
initially selected and subsequently reduced to 3-5 units following the most appropriate
procedure (mainly quartering). These units are then cut into slices about 1 cm thick and then
chopped into smaller pieces to obtain the 5g fractions required by the proposed method.
2.2. Apparatus
Experiments were carried out by using a Hewlett-Packard 5890A gas
Organoclorados en Hortalizas y Frutas Frescas Capítulo II
Chromatographic separation was achieved by using a fused silica capillary column (30 m x
0.25 mm i.d.) coated with 5% phenyl-methylpolysiloxane (film thickness 0.25 µm)
(S l M d id S i ) P k d i h H l P k d 3392 A

7/18/2019 Automatizacion y Miniaturizacion de Sistemas de Screening y Determinacion de Residuos de Plaguicidas en Muestra Agroalimentaria
http://slidepdf.com/reader/full/automatizacion-y-miniaturizacion-de-sistemas-de-screening-y-determinacion-de 123/393
(Supelco, Madrid, Spain). Peak areas were measured with a Hewlett-Packard 3392 A
integrator. The injector and detector temperatures were kept at 225°C and 325°C
throughout. The column temperature was raised from 120°C (hold 2 min) to 180°C (hold 4
min) at 8°C/min, then to 255°C (hold 10 min) at 8 °C/min and finally to 270°C (hold 2 min)
at 10°C/min.
Two Gilson Minipuls-2 peristaltic pumps fitted with poly(vinyl chloride) and
Solvaflex pumping tubes for aqueous solutions and ethanol, respectively, were employed.
Two Rheodyne 5041 injection valves, PTFE tubing and commercially available connectors
were also used. The sorbent column was prepared by packing a commercial Omnifit glass
column (2 cm x 2.5 mm i.d.) with ∼40 mg of RP-C18 sorbent material; small cotton beads
were used on the ends to prevent material losses. The sorbent column was conditioned with
distilled water for 3 min prior retention. An Omnifit 3303 PTFE filter furnished with a
paper disk (Whatman No. 1) was used to filtrate the organic phase; the filter was modified
by using circular channels in both ends to increase the chamber inner volume to 100µL and
the filtration area to ∼3 cm2. It was washed upstream with water after ∼5 analyses.
2.3. Procedure
The flow system designed for the determination of OCPs is depicted in Figure 1.
Almudena Columé Díaz Tesis Doctoral
extractant (distilled water-light petroleum,1:1, v/v) were added. The mixture was
mechanically shaken for ∼10 min and allowed to settle for 2-3 min. Then, the organic phase,
containing the anal tes as contin o sl aspirated for 5 min (5 mL) and filtered; the filtrate
7/18/2019 Automatizacion y Miniaturizacion de Sistemas de Screening y Determinacion de Residuos de Plaguicidas en Muestra Agroalimentaria
http://slidepdf.com/reader/full/automatizacion-y-miniaturizacion-de-sistemas-de-screening-y-determinacion-de 124/393
containing the analytes, was continuously aspirated for 5 min (5 mL) and filtered; the filtrate
was collected in a 10 mL graduated glass tube containing 5 mL of distilled water and
evaporated to dryness under a N2 stream as it dropped into the tube; also, bubbling N2 in the
tube favoured homogenization of the solution. As P1 was stopped and P2 started, the
aqueous solution was aspirated at a flow-rate of 0.5 mL/min and passed through the RP-C18
sorbent column, located in the loop of an injection valve (IV1). Simultaneously, the loop of
the second injection valve (IV2) was filled with eluent (ethyl acetate) containing the internal
standard (1 µg/mL 2,4-dichlorophenol) by means of a syringe. On switching both injection
valves, the loop contents were carried by an air stream at a flow-rate of 0.2 mL/min. The
eluent was passed through the column and eluted analytes collected in a glass vial
containing anhydrous sodium sulphate. A 1 µL aliquot of the dried solution was injected
into the GC-ECD system for analysis. The organic phase remaining in the funnel can besequentially aspirated into the flow system in order to perform replicate analyses per sample.
After each sample, the sorbent column was washed with 3 mL of ethanol to remove
potentially adsorbed interferents and then conditioned with 3 mL of water. To simplify tube
changeover during the evaporation step (see Figure 1), a cylindrical piece of PTFE tubing
with three small holes for insertion of the three channels and a larger one to allow solvent
evaporation was used. The tubes were washed with water between samples to avoid
Organoclorados en Hortalizas y Frutas Frescas Capítulo II
Eluent
N2
Air 0 2
150 µL
Eluent
N2
Air 0 2
150 µL

7/18/2019 Automatizacion y Miniaturizacion de Sistemas de Screening y Determinacion de Residuos de Plaguicidas en Muestra Agroalimentaria
http://slidepdf.com/reader/full/automatizacion-y-miniaturizacion-de-sistemas-de-screening-y-determinacion-de 125/393
3. RESULTS AND DISCUSSION
3.1. Clean-up and preconcentration device
Preliminary experiments were carried out in order to find the best sorbent and
eluent for the solid-phase extraction (SPE) system. For this purpose, RP-C18, Amberlite
XAD-2, Florisil, silica gel, alumina, LiChrolut-EN and activated carbon were tested. First,
the adsorption efficiency was examined by using columns packed with 70 mg of each
Figure 1. Experimental set-up used for the screening and determination of OCPs in horticulturalsamples. P=peristaltic pump; IV=injection valve; W=waste; GC-ECD=gas chromatography-electron-capture detector.
P1Filter
Air
mL/min0.5
P2
0.2
W
RP-C18
Na2SO4
GC-ECD
IV1
IV2
...
1.0
mL/min
P1Filter
Air
mL/min0.5
P2
0.2
W
RP-C18
Na2SO4
GC-ECD
IV1
IV2
......
1.0
mL/min
Almudena Columé Díaz Tesis Doctoral
0.5 mL/min through each column. Fractions of 1 mL sample were collected in glass vials
before and after the sorbent column and extracted with 1 mL of ethyl acetate; after
evaporation to dryness under N2 the residue was redissolved in 200 µL of ethyl acetate a 1

7/18/2019 Automatizacion y Miniaturizacion de Sistemas de Screening y Determinacion de Residuos de Plaguicidas en Muestra Agroalimentaria
http://slidepdf.com/reader/full/automatizacion-y-miniaturizacion-de-sistemas-de-screening-y-determinacion-de 126/393
evaporation to dryness under N2, the residue was redissolved in 200 µL of ethyl acetate, a 1
µL aliquot of the extract being analysed by GC. After each sample was processed, the
column was rinsed with ethyl acetate and water for 1 min to remove potentially adsorbed
analytes. High retention (> 80%) was obtained in all instances; however, activated carbon,
silica gel and RP-C18 exhibited the best sorption properties. Different eluents (ethyl acetate,
n-hexane and light petroleum) were evaluated with the three sorbents. Incomplete elution
was obtained with activated carbon (<10%) and silica gel (< 50%) whichever the solvent.
RP-C18 was thus selected as it exhibited optimal sorption and desorption properties. Ethyl
acetate was the best eluent (∼100% elution), if even surpassed n-hexane and light petroleum
supplied with 2-propanol in order to increase their polarity. The amount of sorbent material
was optimized by varying the length of the column (packed with 20-80 mg of RP-C18).
Chromatographic signals increased with increasing amount of sorbent up to 30 mg, beyondwhich they remained virtually constant. A working column packed with 40 mg RP-C18, and
ethyl acetate as eluent, were adopted for further experiments.
Optimization experiments were carried out by aspirating 5 mL of a standard
solution containing 20-60 ng/mL of each OCP in distilled water, into the SPE system. The
eluate from the sorbent column (200 µL) was collected in 5 mL glass vials containing
anhydrous sodium sulphate and 1 µL fractions were injected into the chromatograph.
Organoclorados en Hortalizas y Frutas Frescas Capítulo II
standards adjusted with HNO3 or NaOH solutions. Pesticides exhibited three distinct types
of variation in this respect. Thus, lindane, α-, β- and δ-HCH, captafol, chlordane,
dichlofuanid, dicloran, dicofol, endosulfan sulphate and methoxychlor were not affected by

7/18/2019 Automatizacion y Miniaturizacion de Sistemas de Screening y Determinacion de Residuos de Plaguicidas en Muestra Agroalimentaria
http://slidepdf.com/reader/full/automatizacion-y-miniaturizacion-de-sistemas-de-screening-y-determinacion-de 127/393
dichlofuanid, dicloran, dicofol, endosulfan sulphate and methoxychlor were not affected by
pH over the range studied. On the other hand, aldrin, chlorbensid, dieldrin, endrin, HCB
and heptachlor were optimally retained under weakly alkaline conditions, whereas captan,
α- and β-endosulfan, iprodione, procymidone and vinclozolin were best extracted in a
weakly acidic medium. Some of these compounds, however, decompose in the alkaline
medium [17] and give spurious results. For this reason, and taking into account the poor
retention of some under acid conditions, the pesticides were prepared in distilled water prior
to continuous SPE as a compromise.
The effect of the sample flow-rate through the column during the preconcentration
step was studied between 0.3 and 0.9 mL/min. Signals remained almost constant throughout
this range; exceptionally, the signals for chlorbensid and α- and β- endosulfan decreased
above 0.6 mL/min. A flow-rate of 0.5 mL/min was selected for all OCPs. The effect of the
eluent (ethyl acetate) flow-rate was studied over the range 0.1-0.5 mL/min, using an air
stream as carrier. Chlorbensid and dicloran elution was markedly affected by the eluent
flow-rate; in fact, a very low flow-rate was required to ensure efficient elution, so 0.2
mL/min was chosen. The influence of the eluent volume was studied by changing the loop
of IV2. Obviously, as the eluent volume was increased, desorption was more efficient but
also the analytes were more dilute. Because of these two opposing effects, the only way to
Almudena Columé Díaz Tesis Doctoral
constant volume using the same solvent. Thus, the column effluent (between 50 and 500µL
of ethyl acetate) was always diluted to 500 µL with ethyl acetate. The desorption efficiency
increased with increasing injected volume up to 150 µL and remained constant above this

7/18/2019 Automatizacion y Miniaturizacion de Sistemas de Screening y Determinacion de Residuos de Plaguicidas en Muestra Agroalimentaria
http://slidepdf.com/reader/full/automatizacion-y-miniaturizacion-de-sistemas-de-screening-y-determinacion-de 128/393
increased with increasing injected volume up to 150 µL and remained constant above this
value. An ethyl acetate injected volume of 150 µL was selected as optimal. A second
injection with the same eluent volume revealed the absence of carry-over; complete elution
of analytes was thus obtained with a single injection of 150 µL of ethyl acetate.
3.2. Analytical figures of merit
All the pesticides studied exhibited good gas chromatographic properties and could
be identified in a direct manner as they were well resolved under these chromatographic
conditions. Analytical curves for standards of organochlorine pesticides were obtained by
using the SPE system depicted in Figure 1 and passing 5 mL of aqueous standards
containing variable concentrations (0.1-500 ng/mL) of the pesticides through the sorbent
column. The curves were constructed by plotting the analyte-to-I.S. peak area ratio against
the analyte concentration. 2,4-Dichlorophenol was used as I.S. in preference to others
because it was found to be compatible with the chromatographic behaviour of the analytes
as well as with ECD; it was added to the eluent at a concentration of 1 µg/mL. The results
obtained are listed in Table 1. All the OCPs tested fitted a straight line with a correlation
coefficient of 0.990-0.999. Limits of detection, calculated on the basis of a signal/noise ratio
of 3/1 are also given in Table 1. The lowest was that of dicloran (the most sensitive). For the
Organoclorados en Hortalizas y Frutas Frescas Capítulo II
iprodione resulted in the highest detection limit (10 ng/mL); in any case, its MRL in
agricultural commodities ranges from 20 ng/mL to 10 µg/mL, so there should be no
problem to detect it.
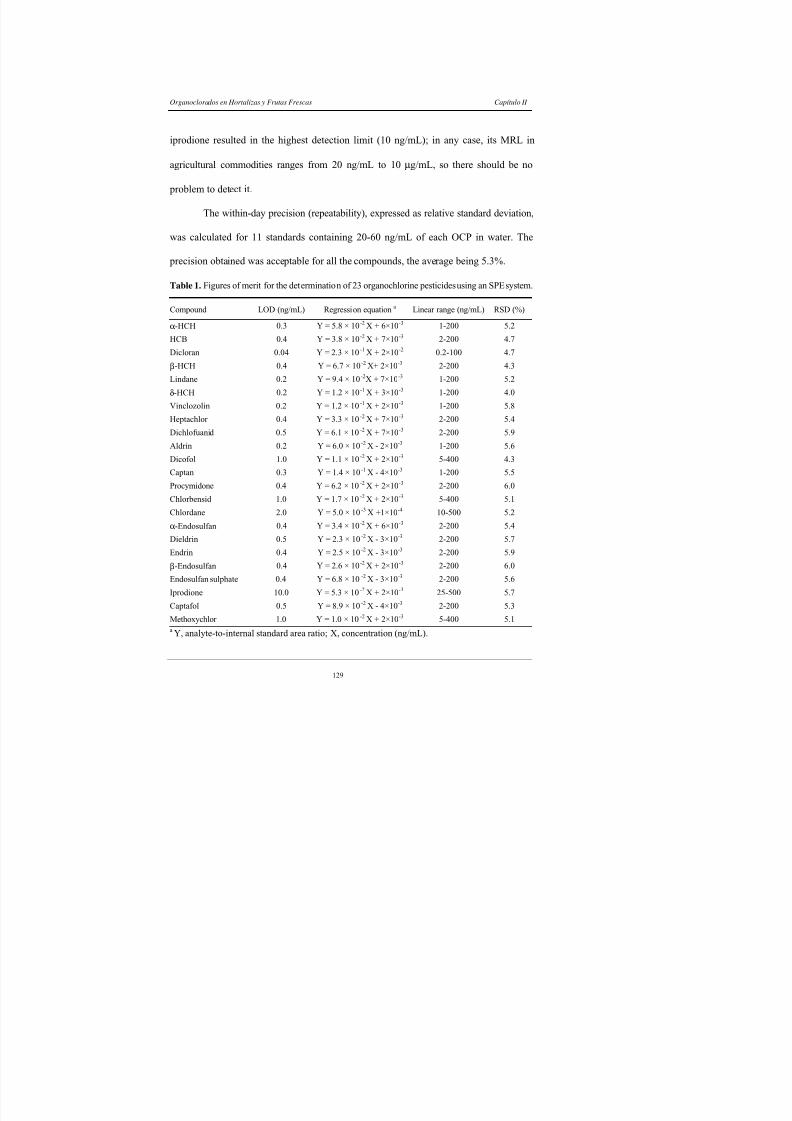
7/18/2019 Automatizacion y Miniaturizacion de Sistemas de Screening y Determinacion de Residuos de Plaguicidas en Muestra Agroalimentaria
http://slidepdf.com/reader/full/automatizacion-y-miniaturizacion-de-sistemas-de-screening-y-determinacion-de 129/393
The within-day precision (repeatability), expressed as relative standard deviation,
was calculated for 11 standards containing 20-60 ng/mL of each OCP in water. The
precision obtained was acceptable for all the compounds, the average being 5.3%.
Table 1. Figures of merit for the determination of 23 organochlorine pesticides using an SPE system.
Compound LOD (ng/mL) Regression equationa Linear range (ng/mL) RSD (%)
α-HCH 0.3 Y = 5.8 × 10⁻² X + 6×10⁻³ 1-200 5.2
HCB 0.4 Y = 3.8 × 10⁻² X + 7×10⁻³ 2-200 4.7
Dicloran 0.04 Y = 2.3 × 10⁻¹
X + 2×10⁻²
0.2-100 4.7β-HCH 0.4 Y = 6.7 × 10⁻² X+ 2×10⁻³ 2-200 4.3
Lindane 0.2 Y = 9.4 × 10⁻²X + 7×10⁻³ 1-200 5.2
δ-HCH 0.2 Y = 1.2 × 10⁻¹ X + 3×10⁻³ 1-200 4.0
Vinclozolin 0.2 Y = 1.2 × 10⁻¹ X + 2×10⁻³ 1-200 5.8
Heptachlor 0.4 Y = 3.3 × 10⁻² X + 7×10⁻³ 2-200 5.4
Dichlofuanid 0.5 Y = 6.1 × 10⁻² X + 7×10⁻³ 2-200 5.9
Aldrin 0.2 Y = 6.0 × 10⁻² X - 2×10⁻³ 1-200 5.6
Dicofol 1.0 Y = 1.1 × 10⁻²
X + 2×10⁻³
5-400 4.3Captan 0.3 Y = 1.4 × 10⁻¹ X - 4×10⁻³ 1-200 5.5
Procymidone 0.4 Y = 6.2 × 10⁻² X + 2×10⁻³ 2-200 6.0
Chlorbensid 1.0 Y = 1.7 × 10⁻² X + 2×10⁻³ 5-400 5.1
Chlordane 2.0 Y = 5.0 × 10⁻³ X +1×10⁻⁴ 10-500 5.2
α-Endosulfan 0.4 Y = 3.4 × 10⁻² X + 6×10⁻³ 2-200 5.4
Dieldrin 0.5 Y = 2.3 × 10⁻² X - 3×10⁻³ 2-200 5.7
Endrin 0.4 Y = 2.5 × 10⁻² X - 3×10⁻³ 2-200 5.9
β-Endosulfan 0.4 Y = 2.6 × 10⁻²
X + 2×10⁻³
2-200 6.0Endosulfan sulphate 0.4 Y = 6.8 × 10⁻² X - 3×10⁻³ 2-200 5.6
Iprodione 10.0 Y = 5.3 × 10⁻² X + 2×10⁻³ 25-500 5.7
Captafol 0 5 Y = 8 9 × 10⁻² X - 4×10⁻³ 2-200 5 3
Almudena Columé Díaz Tesis Doctoral
3.3. Screening and determination of OCPs in horticultural samples
The main purpose of this work was to develop an extraction procedure, as simple as
possible, that would allow both quantitative extraction and preconcentration of OCPs from

7/18/2019 Automatizacion y Miniaturizacion de Sistemas de Screening y Determinacion de Residuos de Plaguicidas en Muestra Agroalimentaria
http://slidepdf.com/reader/full/automatizacion-y-miniaturizacion-de-sistemas-de-screening-y-determinacion-de 130/393
samples and clean extracts from a variety of horticultural commodities. In order to select the
best possible extractant, different samples of 5.0 g of chopped lettuce (test sample) were
spiked with 500 ng of the pesticides and allowed to stand overnight to simulate the
weathering process. Then, 25 mL of extractant were added to each test sample and the
mixture was mechanically shaken for 10 min. An aqueous medium of variable pH was
initially tested for extraction prior to direct insertion into the manifold; the recoveries thus
obtained were all below 40% (due to their poor solubilities in water). Therefore, acetone,
acetonitrile, ethyl acetate and light petroleum were assayed as extractants because they are
common organic solvents for these samples [4-14]. As the extract also contained other
compounds present in the sample and the sorption of OCPs on the column was only
achieved in aqueous media, several additional steps were required prior SPE
preconcentration. Four 5 mL aliquots of the organic phases were evaporated to dryness
under N2 and the residue was redissolved in 5 mL of distilled water for continuous
introduction into the SPE system. Although high recoveries were obtained in all cases, light
petroleum diminished the presence of peaks due to the matrix; also, the time required for
evaporation of the acetone or acetonitrile phases was too long, probably due to the presence
of a large amount of co-extractives (mainly natural pigments), which resulted in dirtier
Organoclorados en Hortalizas y Frutas Frescas Capítulo II
with the pumping tubes, so it allows the on-line aspiration and simultaneous filtration of the
extract in order to prevent solid particles from entering the flow system and clogging the
sorbent column. Careful examination of the results, in terms of relative standard deviation of

7/18/2019 Automatizacion y Miniaturizacion de Sistemas de Screening y Determinacion de Residuos de Plaguicidas en Muestra Agroalimentaria
http://slidepdf.com/reader/full/automatizacion-y-miniaturizacion-de-sistemas-de-screening-y-determinacion-de 131/393
the peak area for each pesticide, revealed that it was much higher than that for the standards.
This can be ascribed to the presence of coextractives hindering the redissolution step.
From the previous method, two modifications were introduced in the extraction
procedure. One was the use of a mixture of water and light petroleum as extractant in order
to remove potentially interfering water-soluble compounds; the other, avoiding redissolution
of the dry residue. The finally adopted extractant was water-light petroleum (1:1, v/v) and
the filtered organic phase was evaporated under a nitrogen stream as it dropped into a glass
tube containing 5 mL of distilled water. Good precision was obtained by operating in this
way so fortified samples were extracted and evaporated as described above. Finally, the
effect of the ratio of amount of sample to extractant volume (w/v) was optimized. For this
purpose, different samples of 5.0 g of chopped lettuce were fortified with variable amounts
of pesticides depending on the extractant volume, and allowed to stand overnight. Then the
samples were extracted with 10, 20, 50 and 100 mL of water/light petroleum (1:1, v/v),
respectively. A portion of 5 mL of the organic phase (always containing 500 ng of each
OCP) was treated following the procedure above-described. Satisfactory results were
obtained in all cases, so the sample/extractant ratio can be varied between 2 and 20 mL of
extractant per gram of sample with little difference. In order to obtain replicate results, a
Almudena Columé Díaz Tesis Doctoral
2.5 to 25 g of sample can be extracted with 50 mL of extractant. This operational sequence
was the most efficient procedure, and was applied to the determination of OCPs in nine
different horticultural commodities.
7/18/2019 Automatizacion y Miniaturizacion de Sistemas de Screening y Determinacion de Residuos de Plaguicidas en Muestra Agroalimentaria
http://slidepdf.com/reader/full/automatizacion-y-miniaturizacion-de-sistemas-de-screening-y-determinacion-de 132/393
No samples containing pesticide residues at detectable concentrations could be
found, so a recovery test was carried out. For this purpose, the analytes were added to each
uncontaminated vegetable according to use and occurrence/appearance [15,18]. Since all the
pesticides studied are administered by foliar application [18], most of their residues remain
on plant surfaces. Therefore, in order to ensure acceptable simulation of the real situation,
the fortification process was carried out as follows: 1 mL of acetone containing variable
amounts of OCPs between 75 and 1000 ng was added to 5.0 g of chopped sample and
allowed stand overnight at room temperature in a closed fume hood to avoid contamination.
Each sample was spiked three times and then analysed in triplicate (n=9), using the
proposed method. The recoveries obtained (Table 2) ranged from 64 to 112% and are
comparable to or better than those provided by existing methods for the determination of
these compounds in horticultural samples. No interference from the matrices studied was
observed, which testifies to the high selectivity of the proposed method. By way of example,
Figure 2 shows the gas chromatograms for a spinach sample unfortified and fortified with
the OCPs listed in Table 2.
Organoclorados en Hortalizas y Frutas Frescas Capítulo II
Table 2. Percent recovery (± SD) of organochlorine pesticides added tohorticultural samples*.
Commodity Compound Recovery
Onion Dichlofuanid c 95 ± 6Dichloran 87 ± 5

7/18/2019 Automatizacion y Miniaturizacion de Sistemas de Screening y Determinacion de Residuos de Plaguicidas en Muestra Agroalimentaria
http://slidepdf.com/reader/full/automatizacion-y-miniaturizacion-de-sistemas-de-screening-y-determinacion-de 133/393
Dichloran 87 ± 5Heptachlor 102 ± 6Procymidone a 83 ± 5Vinclozolin 93 ± 6
Lettuce Captan 75 ± 4Chlordane 92 ± 5Dichloran 96 ± 5α - HCH 94 ± 6β - HCH 93 ± 4δ - HCH 93 ± 5Heptachlor 94 ± 5Lindane 97 ± 6Procymidone a 86 ± 6
Carrot Aldrin 104 ± 6
Captan 70 ± 4Chlorbensid 96 ± 5Dicofol c 84 ± 4Dieldrin 88 ± 6HCB 102 ± 5Heptachlor 105 ± 7Methoxychlor c 96 ± 6
Green pepper Aldrin 97 ± 6Chlorbensid 79 ± 4Dichloran
98 ± 5Dicofol c 90 ± 5Dieldrin 97 ± 6Endrin 91 ± 6α - Endosulfan b 93 ± 6β - Endosulfan 104 ± 7Endosulfan Sulphate 96 ± 6Lindane 100 ± 6Procymidone a 99 ± 6Vinclozolin 93 ± 7
Aubergine Captafolc
81 ± 6Captan 66 ± 4Chlorbensid 91 ± 5Dicofol c 93 ± 5HCB 103 ± 6
Almudena Columé Díaz Tesis Doctoral
Table 2 (continue).Commodity Compound Recovery
Tomato Captan 64 ± 3Chlordane 91 ± 5HCB 100 ± 5

7/18/2019 Automatizacion y Miniaturizacion de Sistemas de Screening y Determinacion de Residuos de Plaguicidas en Muestra Agroalimentaria
http://slidepdf.com/reader/full/automatizacion-y-miniaturizacion-de-sistemas-de-screening-y-determinacion-de 134/393
α - HCH 96 ± 5β - HCH 85 ± 4δ - HCH 103 ± 5Lindane 101 ± 6
Vinclozolin 93 ± 6Spinach Endrin 93 ± 6
α - Endosulfan b 88 ± 6β - Endosulfan 92 ± 6Endosulfan Sulphate 97 ± 7α - HCH 95 ±5β - HCH 94 ± 4δ - HCH 93 ± 4Heptachlor 96 ± 6Lindane 99 ± 5
Methoxychlor c 99 ± 6Vinclozolin 102 ± 6
Potato Aldrin 97 ± 6Chlorbensid 89 ± 5Chlordane 86 ± 4Dicofol c 99 ± 5Dieldrin 95 ± 6Endrin 100 ± 6α - Endosulfan b 96 ± 6β - Endosulfan 102 ± 6Endosulfan Sulphate 103 ± 7HCB 99 ± 5α - HCH 103 ± 5β - HCH 102 ± 4δ - HCH 102 ± 4Lindane 103 ± 5Methoxychlor c 106 ± 6
Cucumber Aldrin 112 ± 7Chlordane 109 ± 6
Dichloran 98 ± 5Dieldrin 92 ± 6Endrin 103 ± 6Lindane 97 ± 6Procymidone a 96 ± 6
Organoclorados en Hortalizas y Frutas Frescas Capítulo II
1.7 min1
f i e d
1.7 min1
f i e d

7/18/2019 Automatizacion y Miniaturizacion de Sistemas de Screening y Determinacion de Residuos de Plaguicidas en Muestra Agroalimentaria
http://slidepdf.com/reader/full/automatizacion-y-miniaturizacion-de-sistemas-de-screening-y-determinacion-de 135/393
4. CONCLUSIONS
A rapid, sensitive method involving semiautomatic sample treatment and low
solvent consumption was developed and proved effective for the screening of the more
commonly used OCPs in the matrices studied. An evaporation step is used to facilitate
Figure 2. Gas chromatograms for a 5.0 g sample of spinach unfortified and fortified with 11 OCPs at
the concentrations listed in Table 2. 1=internal standard; 2=α-HCH; 3=β-HCH; 4=lindane; 5=δ-HCH; 6=vinclozolin; 7=heptachlor; 8=α-endosulfan; 9=endrin; 10=β-endosulfan; 11=endosulfansulphate and 12=methoxychlor.
1.7 min
7
8
910
11
12
4 5 623
U n f o r t
i f i e d
F o r t i f
1.7 min
7
8
910
11
12
4 5 623
U n f o r t
i f i e d
F o r t i f
Almudena Columé Díaz Tesis Doctoral
liquid extraction, the most common choice in this context, cannot be used here because
back-extraction of the pesticides from light petroleum to aqueous phase is unfeasible at any
pH. The proposed method is an effective alternative to more costly and time-consuming

7/18/2019 Automatizacion y Miniaturizacion de Sistemas de Screening y Determinacion de Residuos de Plaguicidas en Muestra Agroalimentaria
http://slidepdf.com/reader/full/automatizacion-y-miniaturizacion-de-sistemas-de-screening-y-determinacion-de 136/393
conventional methods, as well as to highly sophisticated clean-up procedures.
ACKNOWLEDGMENTS
This work was supported by grant PB-95-0977 from Spain's DGICyT.
Organoclorados en Hortalizas y Frutas Frescas Capítulo II
REFERENCES
[1] Community Directive 93/58 EEC . Off. J. Eur. Commun. L 211/6, European
Community, Brussels, 1993.
th

7/18/2019 Automatizacion y Miniaturizacion de Sistemas de Screening y Determinacion de Residuos de Plaguicidas en Muestra Agroalimentaria
http://slidepdf.com/reader/full/automatizacion-y-miniaturizacion-de-sistemas-de-screening-y-determinacion-de 137/393
[2] FAO. Agriculture towards 2010; C 93/24 Document of 27th Session of FAO
Conference, Rome, 1993.
[3] C. Nerín, A.R. Tornés, C. Domeño, J. Cacho, Fresenius J. Anal. Chem. 352 (1995)
364.
[4] A.R. Fernández-Alba, A. Valverde, A. Agüera, M. Contreras, J. Chromatogr. A
686 (1994) 263.
[5] Y. Nakamura, Y. Tonogai, Y. Sekiguchi, Y. Tsumura, N. Nishida, K. Takakura, M.
Isechi, K. Yuasa, M. Nakamura, N. Kifune, K. Yamamoto, S. Teresawa, T.
Oshima, M. Miyata, K. Kamakura, Y. Ito, J. Agric. Food Chem. 42 (1994) 2508.
[6] H.M. Pylypiw Jr., J. AOAC Int . 76 (1993) 1369.
[7] L. Kadenczki, Z. Arpad, I. Gardi, A. Ambrus, L. Gyorfi, G. Reese, W. Ebing, J.
AOAC Int . 75 (1992) 53.
[8] A. Valverde-García, E. González-Pradas, J. Martínez-Vidal, A. Agüera-López, J.
Agric. Food Chem. 39 (1991) 2188.
[9] S.M. Lee, P.L. Wylie, J. Agric. Food Chem. 39 (1991) 2192.
[10] J.A. Casanova, J. AOAC Int . 79 (1996) 936.
[11] S.M. Lee, M.L. Papathakis, H.C. Feng, G.F. Hunter, J.E. Carr, Fresenius J. Anal.
Almudena Columé Díaz Tesis Doctoral
[12] K. Ting, P. Kho, J. AOAC Int . 74 (1991) 991.
[13] J. Fillion, R. Hindle, M. Lacroix, J. Selwyn, J. AOAC Int. 78 (1995) 1252.
[14] W. Liao, T. Joe, W.G. Cusik, J. AOAC Int . 74 (1991) 554.
[15] R C ll R id d Pl i id Ali V l M di P

7/18/2019 Automatizacion y Miniaturizacion de Sistemas de Screening y Determinacion de Residuos de Plaguicidas en Muestra Agroalimentaria
http://slidepdf.com/reader/full/automatizacion-y-miniaturizacion-de-sistemas-de-screening-y-determinacion-de 138/393
[15] R. Coscolla, Residuos de Plaguicidas en Alimentos Vegetales, Mundi-Prensa,
Madrid, 1993.
[16] Community Directive 79/700/EEC . Off. J. Eur. Commun., European Community,
Brussels, 1979
[17] C. Tomlin (Editor), The Pesticide Manual, 10th edn., British Crop Protection, The
Royal Society of Chemistry, London, 1994.
[18] C. Liñán Vicente (Editor), Vademécum de Productos Fitosanitarios y
Nutricionales, 14th edn., Agrotécnicas S.L., Madrid, 1998.
Organoclorados en Hortalizas y Frutas Frescas Capítulo II
Journal of Chromatography A 882 (2000) 193-203ELSEVIER
JOURNAL OFCHROMATOGRAPHY A

7/18/2019 Automatizacion y Miniaturizacion de Sistemas de Screening y Determinacion de Residuos de Plaguicidas en Muestra Agroalimentaria
http://slidepdf.com/reader/full/automatizacion-y-miniaturizacion-de-sistemas-de-screening-y-determinacion-de 139/393
Abstract
A fast, reliable method for the determination of more than twenty chlorinated
fungicides and insecticides in a variety of fruit samples is presented. The pesticides are extracted
from chopped samples with magnetic stirring, after adding 13 mL of acetone:phosphate
buffer/Brine solution (12:1, v/v), with 5 mL of n-hexane. The continuous module employed
allows, sequential decolourization of the organic phase, solvent changeover and solid-phase
extraction for clean-up and preconcentration purposes. A 1 µL aliquot of the pesticides in ethyl
acetate (eluent) is finally injected into the gas chromatograph for their separation and
identification. The method provides excellent clean-up despite the complexity of the matricesinvolved. Fruit samples (5-20 g) containing 0.1-1250 ng/g pesticides were analysed with a high
precision (4-6%). After contamination of the fruit samples for 12 h, average recoveries > 90 % at
Simplified method for the determination of chlorinated fungicidesand insecticides in fruits by gas chromatography
A. Columé, S. Cárdenas, M. Gallego, M. Valcárcel Analytical Chemistry Division, Faculty of Sciences, University of Córdoba, E-14004 Córdoba, Spain
Almudena Columé Díaz Tesis Doctoral
1. INTRODUCTION The number of pesticides that are routinely applied to agricultural commodities
to both lessen the detrimental effect of weeds, insects or diseases, and boost crop
production, has dramatically increased in recent years. As a consequence, the

7/18/2019 Automatizacion y Miniaturizacion de Sistemas de Screening y Determinacion de Residuos de Plaguicidas en Muestra Agroalimentaria
http://slidepdf.com/reader/full/automatizacion-y-miniaturizacion-de-sistemas-de-screening-y-determinacion-de 140/393
production, has dramatically increased in recent years. As a consequence, the
determination of pesticide residues in crops has been strictly regulated by governments
in all countries, with two basic aims, namely to detect the presence of forbidden
pesticides on a particular commodity and to determine whether the concentrations of
the pesticides used exceed their maximum residue limit (MRLs) [1,2]. The
determination of pesticide residues in fresh fruits requires rapid, robust, efficient
methods because of the short time between harvest and sale in markets. Undoubtedly,
chlorinated fungicides and insecticides constitute one of the most important groups of
hazardous organic contaminants owing to their high persistence and impact on human
health [3].
A literature survey of available methods for the determination of chlorinated
residues in fruits leads to the conclusion that these matrices are among the most
troublesome. The procedures used are tedious and time-consuming, and involve several
extraction and clean-up steps to remove the huge amount of potentially interfering
compounds (mainly plant pigments and endogenous acids), which are generally present
at higher concentrations than the pesticide residues themselves. The large volumes of
organic solvents employed in the first step (typically acetone [4-7], acetonitrile [8-11]
d l h l [12 13]) 0 200 j h d f b h h
Organoclorados en Hortalizas y Frutas Frescas Capítulo II
sometimes results in emulsification, which can lower the accuracy and reproducibility
of the analytical results [14]. In this regard, solid-phase extraction (SPE) is an effective
tool for clean-up purposes. However, liquid-liquid extraction (LLE) cannot be replaced
by SPE although it can be used at a later stage The typically low concentrations of

7/18/2019 Automatizacion y Miniaturizacion de Sistemas de Screening y Determinacion de Residuos de Plaguicidas en Muestra Agroalimentaria
http://slidepdf.com/reader/full/automatizacion-y-miniaturizacion-de-sistemas-de-screening-y-determinacion-de 141/393
by SPE, although it can be used at a later stage. The typically low concentrations of
pesticides in fruits and their also low MRLs (in some cases a few ng/Kg) call for an
additional preconcentration step by evaporation under a nitrogen stream; this is done by
redissolving the dry residue in the most appropriate solvent for chromatographic
separation. The separation, detection and identification of chlorinated pesticides has
usually been carried out by gas chromatography (GC), using highly selective detectors
such as electron-capture [4,5,11-13,15,16], or atomic emission [11,17] models for
screening, and mass spectrometric ones for confirmation [5,6,8,9,13,18]. Recently, a
semi-automatic method for the determination of organochlorine pesticides in vegetables
was proposed [16]. The method uses a single LLE step to separate the analytes from the
matrix; after simultaneous evaporation/redissolution of the residue in distilled water,
analytes are preconcentrated/cleaned-up on an RP-C18 column, eluted with ethyl acetate
and injected into a gas chromatograph for analysis.
This work was aimed at developing a method as simple as possible, involving
minimal sample manipulation, for the screening and the sensitive and selective
determination of chlorinated fungicides and insecticides in fruits. LLE of the analytes
from the chopped sample is unavoidable, and is followed by automated clean-up. For
Almudena Columé Díaz Tesis Doctoral
identification and quantitation of up to 23 residual chlorinated fungicides andinsecticides residues in amounts below their MRLs. In addition, the high efficiency of
the clean-up procedure provides good blanks and avoids the interference of
coextractives.
7/18/2019 Automatizacion y Miniaturizacion de Sistemas de Screening y Determinacion de Residuos de Plaguicidas en Muestra Agroalimentaria
http://slidepdf.com/reader/full/automatizacion-y-miniaturizacion-de-sistemas-de-screening-y-determinacion-de 142/393
2. EXPERIMENTAL
2.1. Standards and sampling
Stock standard solutions of aldrin, captan, captafol, chlorbensid, chlordane,
dichlofuanid, dicloran, dicofol, dieldrin, α- and β-endosulfan (3:1, w/w), endosulfan
sulphate, endrin, hexachlorobenzene (HCB), heptachlor, iprodione, α-, β-, δ- and γ -
hexachlorohexane (α-, β-, δ- and γ -HCH 1:1:1:1, w/w), lindane (γ -HCH),
methoxychlor, procymidone, and vinclozolin [all obtained from Riedel-de-Haën
(Seelze, Germany)], were prepared in acetone (by exception, HCB was dissolved in
dichloromethane), at concentrations of 5 mg/mL, and stored in glass stoppered bottles
at 4°C in the dark. A 2 M potassium phosphate buffer/Brine solution was prepared by
dissolving 87 g of K 2HPO4 and 68 g of KH2PO4 in ∼250 mL of distilled water. The pH
was adjusted to 7.0 with dilute HCl or KOH and the solution made up to volume (500
mL). Finally, sodium chloride was added to the buffer solution up to saturation under
constant stirring. 2,4-Dichlorophenol (internal standard), activated carbon and RP-C18
HPLC sorbent were supplied by Sigma (Madrid, Spain). All other reagents and
l i l i l d b h d f M k (D d
Organoclorados en Hortalizas y Frutas Frescas Capítulo II
Fruits were purchased at local markets in Córdoba, Spain. Because the legally
tolerated limits of pesticide residues have been set for raw materials, samples were
analysed unwashed, in a raw state [19]. Sampling was done according to the legally
established protocol [20]. Thus, a raw laboratory sample consisting of 10-50 units
7/18/2019 Automatizacion y Miniaturizacion de Sistemas de Screening y Determinacion de Residuos de Plaguicidas en Muestra Agroalimentaria
http://slidepdf.com/reader/full/automatizacion-y-miniaturizacion-de-sistemas-de-screening-y-determinacion-de 143/393
established protocol [20]. Thus, a raw laboratory sample consisting of 10 50 units
(depending on the fruit) was reduced to 3-20 units following the most appropriate
procedure (mainly quartering). For melon, 5 units were cut into slices of ∼200 g and
then reduced similarly to the other fruits. These units were cut into slices and some of
them were chopped into smaller pieces to obtain the 5-20 g fractions required by the
proposed method.
2.2. Instruments and apparatus
Chlorinated fungicides and insecticides were chromatographed on a fused silica
capillary column (30 m x 0.25 mm i.d.) coated with 5% phenyl-methylpolysiloxane
(film thickness 0.25 µm) (Supelco, Madrid, Spain). Analyses were performed on a
Hewlett-Packard 5890A gas chromatograph equipped with a 63 Ni electron-capture
detection (ECD) system. Nitrogen, at a flow-rate of 1.0 mL/min, was used as carrier
gas. The injector port and detector temperatures were kept at 225°C and 325°C
throughout. The oven temperature program was as follows: 120°C, held for 2 min;
8°C/min ramp to 180°C (hold 4 min); 8°C/min ramp to 255°C (hold 10 min) and
10°C/min ramp to 270°C (hold 2 min). Peak areas were measured with a Hewlett-
Almudena Columé Díaz Tesis Doctoral
computer running MASSLAB software (Thermo, Madrid, Spain); the chromatographic
column and temperature program were both similar to those used with ECD. Ultrapure
helium (6.0 Air Liquide), at a flow-rate of 1.0 mL/min, was employed as carrier gas.
The injection port and transfer line temperatures were maintained at 225°C and 300°C,

7/18/2019 Automatizacion y Miniaturizacion de Sistemas de Screening y Determinacion de Residuos de Plaguicidas en Muestra Agroalimentaria
http://slidepdf.com/reader/full/automatizacion-y-miniaturizacion-de-sistemas-de-screening-y-determinacion-de 144/393
respectively. The ion source temperature was 200°C for the 70 eV electron impact
mode, with scanning from m/z 50 to 500. In all analyses, 1 µL of the organic extract
was injected in the split mode (1:25 ratio).
The flow system comprised two peristaltic pumps (Gilson Minipuls-2) and two
Rheodyne 5041 injection valves. Poly(vinyl chloride) and Solvaflex pumping tubes for
aqueous solutions and n-hexane/methanol, respectively, PTFE tubing (0.5 mm i.d.) and
commercially available connectors were also employed. A sorbent column was
prepared by packing a commercial Omnifit glass column (2 cm x 2.5 mm i.d.) with ∼40
mg of RP-C18 sorbent material; small cotton beads were used on the ends to prevent
material losses. A home-made glass column (5 cm x 4 mm i.d.) packed with ∼100 mg
of activated carbon was also constructed to decolourize the organic extracts from the
fruit samples. A magnetic stirrer (Selecta, Barcelona, Spain) was also employed
2.3. Procedure
The flow system used to extract the chlorinated fungicides and insecticides
from the fruits is depicted in Figure 1. A 5-20 g amount of chopped sample was
Organoclorados en Hortalizas y Frutas Frescas Capítulo II
acetone:phosphate buffer/Brine solution mixture, (12:1 v/v) was added, followed by 5
mL of extractant (n-hexane); once stoppered, the slurry was magnetically stirred for 5
min. After 1 min of standing, a volume of 2 mL of the upper organic phase, containing
the pesticides, was aspirated at 1 mL/min (sampling time 2 min) and passed through an

7/18/2019 Automatizacion y Miniaturizacion de Sistemas de Screening y Determinacion de Residuos de Plaguicidas en Muestra Agroalimentaria
http://slidepdf.com/reader/full/automatizacion-y-miniaturizacion-de-sistemas-de-screening-y-determinacion-de 145/393
activated carbon column for decolourization (0% adsorption of pesticides) and also to
prevent suspended particles from reaching the continuous unit. The eluate was
evaporated under a N2 stream as it dropped into 5 mL of distilled water held in a glass
tube. The nitrogen also helps to homogenize the solution. Once
evaporation/redissolution was complete, the second pump was started, which allowed
the analytes, dissolved in the 5 mL of water, to be instantaneously retained on the
sorbent column, located in the loop of IV1, at a flow-rate of 0.5 mL/min (bold line in
Figure 1). The loop of IV2 (150 µL) was simultaneously filled with ethyl acetate
(eluent) containing the internal standard (2,4-dichlorophenol, 1 µg/mL) by means of a
syringe. In the elution step, both valves were switched simultaneously and the analytes
eluted at 0.2 mL/min, using air as carrier. The whole organic extract (150 µL) was
collected in a glass vial containing anhydrous sodium sulphate and a 1 µL aliquot
injected into the gas chromatograph for analysis. Between samples, the activated carbon
and the sample aspiration channel were flushed with 3 mL of methanol; the RP-C18
sorbent column and connectors were flushed with 3 mL of 0.2 M ammonium hydroxide
to remove potentially retained interferents and then conditioned with 3 mL of water.
Almudena Columé Díaz Tesis Doctoral
Under these conditions, the activated carbon column was serviceable for about 25
analysis while the sorbent column remained active for 3 months.
mL/min mL/min
N2
Sorbent mL/min mL/min
N2
Sorbent

7/18/2019 Automatizacion y Miniaturizacion de Sistemas de Screening y Determinacion de Residuos de Plaguicidas en Muestra Agroalimentaria
http://slidepdf.com/reader/full/automatizacion-y-miniaturizacion-de-sistemas-de-screening-y-determinacion-de 146/393
3. RESULTS AND DISCUSSION
3.1. Selection and optimisation of the clean-up/preconcentration process
Pesticide residue analyses usually involve the extraction of the analytes from
the fruit by using an organic solvent. Preliminary experiments were thus focused on
examining the retention of the analytes, in an organic medium, onto a sorbent column,
in order to minimize sample pretreatment (simultaneous preconcentration and clean-
up). Various sorbents [RP-C18, Florisil, silica-gel, activated carbon, Serdolit, alumina,
LiChrolut-EN and Amberlites (XAD-2 and XAD-7)] were assayed by preparing
Figure 1. Scheme of the clean-up/preconcentration steps used for the screening anddetermination of chlorinated fungicides and insecticides in fruits. P=peristaltic pump;IV=injection valve; W=waste; AC=activated carbon; GC=gas chromatograph with ECD or MSdetector.
Fruitsample
AC
P1 P2
mL/min mL/min
1.0 0.5
0.2
IV2
IV1
Air
Eluent
W
GC
150 µL
Fruitsample
AC
P1 P2
mL/min mL/min
1.0 0.5
0.2
IV2
IV1
Air
Eluent
W
GC
150 µL
Organoclorados en Hortalizas y Frutas Frescas Capítulo II
favourable situation (1 g of silica-gel as sorbent and 4 mL of n-hexane as sample
medium) only a preconcentration factor of four was achieved. In addition, the retention
of the analytes spiked to a strawberry sample was found to be lower than that with the
standards; also, the chromatograms were very dirty, hindering identification of some

7/18/2019 Automatizacion y Miniaturizacion de Sistemas de Screening y Determinacion de Residuos de Plaguicidas en Muestra Agroalimentaria
http://slidepdf.com/reader/full/automatizacion-y-miniaturizacion-de-sistemas-de-screening-y-determinacion-de 147/393
analytes and poor reproducibility was obtained.
From these results, the chemical conditions found in previous experiments for
the automatic clean-up and preconcentration of organochlorine pesticides from
vegetables [16], were assayed in the present work. Thus, aqueous medium for the
extraction of organochlorine pesticides prior to direct insertion into the manifold for
their adsorption on RP-C18, was discarded as it provided low recoveries (∼40%).
Therefore, organic extractants are required, which involves a solvent changeover step to
aqueous medium before preconcentration on RP-C18 sorbent. In the proposed method, a
flow system similar to that depicted Figure 1 was used, and the first variable studied
was the organic extractant. Thus, the chopped test fruit sample was placed together with
the extractant in a glass bottle and, after magnetic stirring, aliquots of the organic
extract were continuously aspirated into the clean-up/preconcentration system (Figure
1). Acetone and acetonitrile are commonly used extractants for this purpose on account
of their miscibility with plant material, so they were tested with the strawberry samples.
However, both extractants provided poor results (polar coextractives and pigments were
also extracted, redissolved and eluted, leading to dirty chromatograms). Phase
Almudena Columé Díaz Tesis Doctoral
saturated NaCl in phosphate buffer [11], which prevents partitioning of endogenous
organic acids (viz., citric, oxalic and tannic acids) into the aqueous-acetone layer. This
method was assayed and the effect of the ratio acetone:phosphate buffer/Brine solution
(v/v) optimised. For this purpose, different samples of 5.0 g of strawberries were spiked

7/18/2019 Automatizacion y Miniaturizacion de Sistemas de Screening y Determinacion de Residuos de Plaguicidas en Muestra Agroalimentaria
http://slidepdf.com/reader/full/automatizacion-y-miniaturizacion-de-sistemas-de-screening-y-determinacion-de 148/393
with 100 ng per gram of fruit (1 mL of acetone containing 500 ng/mL of the pesticides
to 5 g of fruit) and, after 12 h of standing (to simulate native analytes), the mixed
solution was added, with a fixed acetone volume of 12 mL (for quantitative extraction)
and a variable buffer volume (1 to 10 mL); this slurry was extracted with 5 mL of n-
hexane. The cleanest extracts were obtained by using 12 mL of acetone and 1 mL of
phosphate buffer/Brine solution, so this combination was selected for further
experiments. The need of the buffer solution can be inferred from Figure 2, which
shows the chromatograms for an uncontaminated strawberry blank, without (A) and
with buffer addition (B). Finally, the n-hexane volume was varied between 5 and 20
mL, taking into account that the final concentration of the pesticides in the organic
phase remained constant, by spiking variable concentrations of the pesticides to the
strawberry test sample. No significant differences were observed over the interval
studied, so a volume of 5 mL of n-hexane was selected in order to increase the
sensitivity of the proposed method; aliquots of 2 mL were inserted into the solid-phase
separation unit as shown in Figure 1.
As the n-hexane phase was yellowish, a glass column packed with 100 mg of
i d b l d h h l i i h l i d
Organoclorados en Hortalizas y Frutas Frescas Capítulo II
A) A)
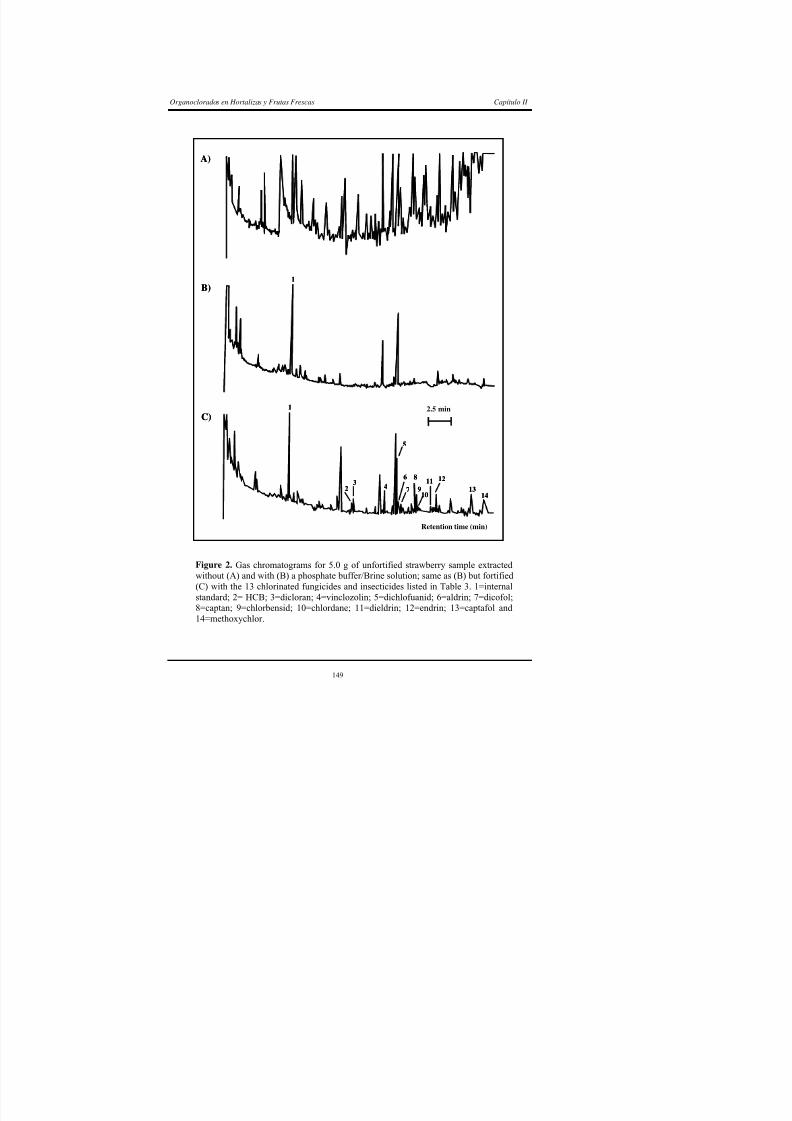
7/18/2019 Automatizacion y Miniaturizacion de Sistemas de Screening y Determinacion de Residuos de Plaguicidas en Muestra Agroalimentaria
http://slidepdf.com/reader/full/automatizacion-y-miniaturizacion-de-sistemas-de-screening-y-determinacion-de 149/393
Figure 2. Gas chromatograms for 5.0 g of unfortified strawberry sample extracted
without (A) and with (B) a phosphate buffer/Brine solution; same as (B) but fortified(C) with the 13 chlorinated fungicides and insecticides listed in Table 3. 1=internalstandard; 2= HCB; 3=dicloran; 4=vinclozolin; 5=dichlofuanid; 6=aldrin; 7=dicofol;8=captan; 9=chlorbensid; 10=chlordane; 11=dieldrin; 12=endrin; 13=captafol and
1
1
2 3
4
5
6 7
8 9 10
11 12 13
14
2.5 min C)
B)
Retention time ( min )
1
1
2 3
4
5
6 7
8 9 10
11 12 13
14
2.5 min C)
B)
Retention time ( min )
2.5 min
Retention time (min)
Almudena Columé Díaz Tesis Doctoral
remove natural pigments present in the fruits. This resulted in cleaner chromatograms
and an increased RP-C18 column lifetime; moreover, activated carbon did not retain
pesticides (0% adsorption) when they are passed in a low polarity solvent as n-hexane;
so, this column was only used for clean-up purposes. The n-hexane phase containing
7/18/2019 Automatizacion y Miniaturizacion de Sistemas de Screening y Determinacion de Residuos de Plaguicidas en Muestra Agroalimentaria
http://slidepdf.com/reader/full/automatizacion-y-miniaturizacion-de-sistemas-de-screening-y-determinacion-de 150/393
the analytes was then evaporated and redissolved in 5 mL of distilled water as in
previous work [16]. In this aqueous medium, several sorbent materials (viz. RP-C18,
Amberlite XAD-2, silica gel and activated carbon) were assayed, and RP-C18 exhibited
the best sorption properties (∼90%). Different eluents (ethyl acetate, n-hexane and
petroleum ether) were evaluated using RP-C18 as sorbent. Ethyl acetate was the best
eluent (∼100%). Taking into account that the sorbent and eluent were coincident with
those of the elsewhere described method [16], the optimal values found for the
variables (viz. amount of sorbent material, sample and eluent flow-rate and eluent
volume) were also adopted here (see Figure 1).
3.2. Analytical GC performance
All the pesticides studied exhibited good gas chromatographic properties and
could be identified in a direct manner without overlap. The strawberry blank was spiked
with the 23 pesticides. The addition procedure was as follows: 1 mL of standard
solutions in acetone containing all pesticides at variable concentrations was spiked to
individual amounts of 5 g of fruit blanks, in the interval 0.4-1250 ng/g, held in 50 mL
l b ttl th t b l th t t d ith 13 L f t b ff
Organoclorados en Hortalizas y Frutas Frescas Capítulo II
procedure ensured that the analytes in the strawberry sample would be present primarily
in a deposited state; as a result, the recoveries for the 23 pesticides in these spiked
strawberries were higher than 95 %, relative to aqueous standards directly inserted into
the solid-phase extraction unit (100%). Based on these results, the fruit blank was used

7/18/2019 Automatizacion y Miniaturizacion de Sistemas de Screening y Determinacion de Residuos de Plaguicidas en Muestra Agroalimentaria
http://slidepdf.com/reader/full/automatizacion-y-miniaturizacion-de-sistemas-de-screening-y-determinacion-de 151/393
to run calibration graphs for the 23 pesticides. The regression equations were obtained
by plotting the analyte-to-internal standard peak area ratio against the analyte
concentration, using eight points per curve. The sensitivity (slope of the calibration
graph) and the linear ranges are listed in Table 1.
The limits of detection were calculated as the minimum concentrations
providing chromatographic signals three times higher than background noise; iprodioneexhibited the highest limit of detection (25 ng/g) by virtue of its slightly broadened
peak. Repeatabilities (obtained from 11 injections of the same sample containing 5-25
ng/g of each pesticide except iprodione, which was used at 80 ng/g), expressed as
relative standard deviation, are also listed in Table 1. In any case, the sensitivity of the
method can be increased 4 times by using greater amount of fruit (viz. 20 g), with
negligible changes in precision. The m/z values used for identification in the electron
impact ionization mode are shown in Table 1.
Almudena Columé Díaz Tesis Doctoral
Table 1. Figures of merit for the determination of chlorinated fungicides and insecticides using
an SPE system.Compound Sensitivitya (10-2) Linear range (ng/g) LOD (ng/g) RSD (%) m/z b
α-HCH 2.3 2.5-500 0.7 5.4 111,181,219
HCB 1.5 5.0-500 1.0 4.9 249,282,284
Dicloran 9.2 0.4-250 0.1 4.6 124,176,206
β-HCH 2.7 5.0-500 1.0 4.6 109,181,219
Lindane 3.8 2.5-500 0.5 5.6 111,181,219

7/18/2019 Automatizacion y Miniaturizacion de Sistemas de Screening y Determinacion de Residuos de Plaguicidas en Muestra Agroalimentaria
http://slidepdf.com/reader/full/automatizacion-y-miniaturizacion-de-sistemas-de-screening-y-determinacion-de 152/393
δ-HCH 4.8 2.5-500 0.5 4.0 111,181,219
Vinclozolin 4.8 2.5-500 0.5 5.7 187,212,285 Heptachlor 1.3 5.0-500 1.0 5.5 100,272,370
Dichlofuanid 2.5 5.0-500 1.2 5.8 123,224,332
Aldrin 2.4 2.5-500 0.5 5.4 66,263,298
Dicofol 0.9 6.2-500 1.2 4.8 111,139,250
Captan 5.6 2.5-500 0.7 5.0 79,264,299
Procymidone 2.5 5.0-500 1.0 5.9 67,96,283
Chlorbensid 0.7 12.5-1000 2.5 6.0 125,127,268
Chlordane 0.2 25.0-1250 5.0 5.1 202,373,408α-Endosulfan 1.4 5.0-500 1.0 5.8 195,241,339
Dieldrin 0.9 5.0-500 1.2 6.0 79,378,380
Endrin 1.0 5.0-500 1.0 5.9 67,317,319
β-Endosulfan 1.1 5.0-500 1.0 5.7 195,241,339
Endosulfan sulphate 2.7 5.0-500 1.0 5.4 272,387,420
Iprodione 2.1 63.0-1250 25.0 5.3 56,314,329
Captafol 3.6 5.0-500 1.2 5.7 79,347 ,349
Methoxychlor 0.4 12.5-1000 2.5 5.9 227,228,344 a Relative area (analyte/internal standard peak area ratio)/ng/g. b m/z values in italics are M+ values; those in bold face correspond to the base peak.
3.3. Application to fruit samples
Various types of fruit were used to examine the effect of the matrix on
recoveries, separation and interfering peaks. For this purpose, 40 fruit samples of 10
different types (namely, nectarine, melon, peach, pear, apple, orange, red plum, cherry,
Organoclorados en Hortalizas y Frutas Frescas Capítulo II
was done as described in Section 2.1 and laboratory samples were analysed as soon asreceived, using the procedure described in Section 2.3. Initially, 5.0 g of each fruit was
weighed and analysed; when negative results were obtained, the sample amount was
increased to 20 g. In all instances, quantitation was done by ECD and positive findings

7/18/2019 Automatizacion y Miniaturizacion de Sistemas de Screening y Determinacion de Residuos de Plaguicidas en Muestra Agroalimentaria
http://slidepdf.com/reader/full/automatizacion-y-miniaturizacion-de-sistemas-de-screening-y-determinacion-de 153/393
were confirmed by MS. Only six samples were found to contain chlorinated residues at
detectable levels. The results thus obtained, for 5 g of sample are listed in Table 2. As
can be seen, the concentrations found were lower than the EU maximum residue limits
(see Table 2) for all compounds examined. The presence of the residues was confirmed
by GC-MS, using 20 g of sample as the sensitivity was ten times lower than with ECD.
By way of example, Figure 3A shows the chromatogram for the peach samplecontaining only vinclozolin, obtained with electron capture detection. Figure 3B
illustrates the identification of vinclozolin by comparing the mass spectrum for the
corresponding peak with that in the library. Spectral comparison resulted in coincidence
above 85%.
Table 2. Summary of the chlorinated fungicides and insecticides found in fruit samples (±SD,n=6) analysed by using the proposed method and GC-ECD.
Sample Pesticide found Concentration (ng/g) MRLa (µg/g)
Peach Vinclozolin 6.0 ± 0.3 2
Nectarine Captan 5.0 ± 0.2 2
Banana Dicofol 7.3 ± 0.4 2
Strawberry Dichlofuanid 6.4 ± 0.4 10Apple Lindane 4.5± 0.3 1
Strawberry Vinclozolin 4.8 ± 0.3 5
Almudena Columé Díaz Tesis Doctoral
2
1A )
2
1
2
1A )

7/18/2019 Automatizacion y Miniaturizacion de Sistemas de Screening y Determinacion de Residuos de Plaguicidas en Muestra Agroalimentaria
http://slidepdf.com/reader/full/automatizacion-y-miniaturizacion-de-sistemas-de-screening-y-determinacion-de 154/393
Figure 3. Chromatogram for a chlorinated pesticide found in a peach sample (A): 1=internalstandard; 2=vinclozolin. Full-scan EI mass spectra for vinclozolin in the fruit sample and
2 5 7 5 1 2 5 1 7 5 2 2 5 3 2 5 3 7 52 7 5 4 2 5 m /z0
%
1 0 0
0
%
1 0 0
5 0
5 1
5 5
5 4
5 3
6 28 1
8 8
9 71 0 9
1 2 4
1 4 5
1 5 9
1 7 8
1 8 7
1 8 72 1 2
2 1 4
2 1 5
2 1 6
2 4 1
2 8 5
2 8 7
5 5
5 45 3
8 8
9 7
1 0 9
1 2 4
1 4 5
1 5 9
1 7 81 8 7
2 1 2
2 1 4
2 1 5
2 1 6
2 4 1
2 8 5
2 8 7
7 3
1 9 8
2 1 3
2 1 7
2 4 3
2 8 9
2 7
3 9
B )
198
Scan EI+3.12e4
R:866 NIST 40275: VINCLOZOLINHit 1
Organoclorados en Hortalizas y Frutas Frescas Capítulo II
Recoveries of the proposed method were assessed by adding, to each previouslyanalysed uncontaminated fruit, the pesticides according to use and
occurrence/appearance [19,21,22]. In order to ensure reliable simulation of the actual
leaf applications [22], 5.0 g of chopped sample was spiked with 1 mL of acetone
t i i i bl t ti f hl i t d ti id d f i id b t 25

7/18/2019 Automatizacion y Miniaturizacion de Sistemas de Screening y Determinacion de Residuos de Plaguicidas en Muestra Agroalimentaria
http://slidepdf.com/reader/full/automatizacion-y-miniaturizacion-de-sistemas-de-screening-y-determinacion-de 155/393
containing variable concentrations of chlorinated pesticides and fungicides between 25
and 125 ng/mL, except for iprodione (400 ng/mL), and allowed to stand overnight at
room temperature in a closed fume hood to avoid contamination. Each sample was
spiked three times and then analysed in duplicate (n=6), using the proposed method; the
results obtained are listed in Table 3. All compounds were correctly identified and
average recoveries (90-101%) were acceptable for all matrices. The lower values
obtained for captan, procymidone and vinclozolin (77-80%) can be ascribed to their
being either partially irreversibly bound to the matrices or degraded during
contamination time. Matrix interferences were reduced during the clean-up steps.
Figure 2 shows the chromatograms for a strawberry sample, both unfortified (B) and
after fortifying with the 13 chlorinated fungicides and inseticides listed in Table 3 (C).
4. CONCLUSIONS
The aim of this work was satisfactorily fulfilled, especially with regard to
obtaining clean extracts from the fruits. These matrices are among the most
troublesome to analyse, not only because of the bright colour of the natural pigments
Almudena Columé Díaz Tesis Doctoral
Table 3. Percent recovery (mean of six determinations ± SD) of chlorinated fungicides
and insecticides added to fruit samples at 5-25 ng/g.
Commodity Compound Recovery (%) Commodity Compound Recovery (%) Nectarine Aldrin 101 ± 6 Orange Aldrin 99 ± 6
Captan 75 ± 4 Captafol 100 ± 5Chlorbensid 97 ± 6 Captan 79 ± 4Dichlofuanid 107 ± 7 Chlorbensid 99 ± 6Dieldrin 96 ± 5 Chlordane 92 ± 5α-Endosulfan 91 ± 5 Dichlofuanid 102 ± 6β-Endosulfan 109 ± 5 Dichloran 88 ± 4

7/18/2019 Automatizacion y Miniaturizacion de Sistemas de Screening y Determinacion de Residuos de Plaguicidas en Muestra Agroalimentaria
http://slidepdf.com/reader/full/automatizacion-y-miniaturizacion-de-sistemas-de-screening-y-determinacion-de 156/393
Endosulfan sulphate 83 ± 6 Dicofol 109 ± 4Endrin 103 ± 5 Dieldrin 99 ± 7HCB 97 ± 7 Endrin 96 ± 4α-HCH 87 ± 5 HCB 96 ± 5β-HCH 89 ± 5 Heptachlor 88 ± 6δ-HCH 101 ± 6 Lindane 103 ± 5Lindane 103 ± 5 Procymidone 84± 5Procymidone 83 ± 7 Methoxychlor 90 ± 5
Vinclozolin 81 ± 4Melon Aldrin 100 ± 6
Chlorbensid 98 ± 6 Red plum Aldrin 89 ± 5Dichlofuanid 99 ± 6 Captafol 89 ± 6Dichloran 83 ± 5 Chlorbensid 93 ± 6
Dicofol 102 ± 4 Chlordane 91 ± 6Dieldrin 105 ± 7 Dichloran 84 ± 5Endrin 104 ± 6 Dieldrin 100 ± 5HCB 92 ± 5 Endrin 108 ± 7α-HCH 91 ± 6 HCB 99 ± 6β-HCH 96 ± 5 Heptachlor 94 ± 6δ-HCH 103 ± 4 Methoxychlor 92 ± 4Heptachlor 88 ± 5 Procymidone 70 ± 5Lindane 91 ± 6 Vinclozolin 71 ± 5Methoxychlor 102 ± 6Procymidone 72 ± 4 Cherry Aldrin 90 ± 6Vinclozolin 81 ± 5 Chlorbensid 99 ± 6
Chlordane 85 ± 5Peach Aldrin 95 ± 5 Dichlofuanid 90 ± 6
Dichloran 95 ± 6 Dichloran 82 ± 6Dieldrin 101 ± 6 Dicofol 90 ± 7α-Endosulfan 92 ± 6 Dieldrin 91 ± 6β-Endosulfan 106 ± 7 α-Endosulfan 103 ± 6Endosulfan sulphate 91 ± 6 β-Endosulfan 101 ± 7Endrin 101 ± 6 Endrin 96 ± 5HCB 91 ± 4 HCB 84 ± 6Methoxychlor 100 ± 4 α-HCH 95 ± 7Procymidone 78 ± 5 β-HCH 96 ± 7Vinclozolin 80 ± 5 δ-HCH 97 ± 5
Lindane 99 ± 5Methoxychlor 98 ± 6Vinclozolin 71 ± 4
Organoclorados en Hortalizas y Frutas Frescas Capítulo II
Table 3 (continue).
Commodity Compound Recovery (%) Commodity Compound Recovery (%)Pear Aldrin 105 ± 6 Strawberry Aldrin 98 ± 6
Captafol 94 ± 4 Captafol 95 ± 5Chlorbensid 103 ± 6 Captan 87 ± 5Dichlofuanid 90 ± 5 Chlorbensid 95 ± 6Dichloran 95 ± 4 Chlordane 81 ± 5Dicofol 105 ± 5 Dichlofuanid 94 ± 6Dieldrin 92 ± 5 Dichloran 91 ± 5α-Endosulfan 93 ± 6 Dicofol 98 ± 5

7/18/2019 Automatizacion y Miniaturizacion de Sistemas de Screening y Determinacion de Residuos de Plaguicidas en Muestra Agroalimentaria
http://slidepdf.com/reader/full/automatizacion-y-miniaturizacion-de-sistemas-de-screening-y-determinacion-de 157/393
β-Endosulfan 97 ± 6 Dieldrin 93 ± 6
Endosulfan sulphate 92 ± 5 Endrin 101 ± 5Endrin 93 ± 5 HCB 87 ± 5Methoxychlor 104 ± 6 Methoxychlor 92 ± 5Procymidone 78 ± 6 Vinclozolin 81 ± 5Vinclozolin 70 ± 4
Banana Aldrin 90 ± 5Apple Aldrin 90 ± 6 Captafol 90 ± 6
Chlorbensid 91 ± 6 Chlorbensid 102 ± 7Chlordane 93 ± 6 Dicofol 90 ± 4Dichlofuanid 102 ± 6 Dieldrin 95 ± 6Dichloran 98 ± 7 α-Endosulfan 106 ± 5Dicofol 90 ± 5 β-Endosulfan 96 ± 6
Dieldrin 94 ± 5 Endrin 102 ± 7α-Endosulfan 95 ± 6 HCB 98 ± 4β-Endosulfan 98 ± 6 α-HCH 92 ± 5Endosulfan sulphate 90 ± 5 β-HCH 98 ± 5Endrin 90 ± 6 δ-HCH 102 ± 5HCB 88 ± 4 Heptachlor 99 ± 5Heptachlor 82 ± 5 Lindane 106 ± 7
Lindane 93 ± 7 Vinclozolin 78 ± 5
Vinclozolin 82 ± 6Iprodione 86 ± 5
pesticides from the sample could not be avoided with any of the approaches tested. The
sensitivity of the method complies with the limits established by legislation; the method
uses amounts of a few grams of sample that can be increased if required. This is
therefore a competitive, simple, fast and inexpensive method.
ACKNOWLEDGMENTS
Almudena Columé Díaz Tesis Doctoral
REFERENCES
[1] Community Directive 93/58 EEC . Off. J. Eur. Commun. L 211/6, European
Community, Brussels, 1993.
[2] FAO. Agriculture towards 2010; C 93/24 Document of 27th Session of FAO
Conference, Rome, 1993.

7/18/2019 Automatizacion y Miniaturizacion de Sistemas de Screening y Determinacion de Residuos de Plaguicidas en Muestra Agroalimentaria
http://slidepdf.com/reader/full/automatizacion-y-miniaturizacion-de-sistemas-de-screening-y-determinacion-de 158/393
[3] S.T. Hadfield, J.K. Sadler, E. Bolygo, I.R. Hill, Pestic. Sci. 34 (1992) 207.
[4] D. Beil, M. Moeller, A. Paschke, H. Steinhart, J. Ring, Dtsch. Lebensm.
Rundsch. 93 (1997) 242.
[5] C.M. Torres, Y. Pico, J. Manes, J. Chromatogr. A 778 (1997) 127.
[6] M. Anastassiades, E. Scherbaum, Dtsch. Lebensm. Rundsch. 93 (1997) 316.
[7] J.A. Casanova, J. AOAC Int . 79 (1996) 936.
[8] Y. Akiyama, N. Yoshioka, M. Tsuji, Shokuhin. Eiseigaku. Zasshi. 39 (1998)
303.
[9] L.E. Sojo, A. Brocke, J. Fillion, S.M. Price, J. Chromatogr. A 788 (1997) 141.
[10] K.A. Barnes, R.J. Fussell, J.R. Startin, M.K. Pegg, S.A. Thorpe, S.L. Reynolds,
Rapid Commun. Mass Spectrom. 11 (1997) 117.
[11] S.M. Lee, P.L. Wylie, J. Agric. Food Chem. 39 (1991) 2192.
[12] F. Sicbaldi, A. Sarra, G.L. Copeta, J. Chromatogr. A 765 (1997) 23.
[13] A.R. Fernández-Alba, A. Valverde, A. Agüera, M. Contreras, J. Chromatogr. A
686 (1994) 263.
[14] Okih hi Ob S i l 123 (1998) 11
Organoclorados en Hortalizas y Frutas Frescas Capítulo II
[15] P. Cabras, A. Angioni, V.L. Garau, F.M. Pirisi, V. Brandolini, F. Cabitza, M.
Cubeddu, J. Agric. Food. Chem. 46 (1998) 3772.
[16] A. Columé, S. Cárdenas, M. Gallego, M. Valcárcel, J. Chromatogr. A 849
(1999) 235.
[17] K. Ting, P. Kho, J. AOAC Int . 74 (1991) 991.

7/18/2019 Automatizacion y Miniaturizacion de Sistemas de Screening y Determinacion de Residuos de Plaguicidas en Muestra Agroalimentaria
http://slidepdf.com/reader/full/automatizacion-y-miniaturizacion-de-sistemas-de-screening-y-determinacion-de 159/393
[ ] g, , ( )
[18] J. Fillion, R. Hindle, M. Lacroix, J. Selwyn, J. AOAC Int . 78 (1995) 1252.
[19] R. Coscolla, Residuos de Plaguicidas en Alimentos Vegetales, Mundi-Prensa,
Madrid (Spain), 1993.
[20] Community Directive 79/700/EEC . Off. J. Eur. Commun., European
Community, Brussels, 1979.
[21] C. Tomlin (Editor), The Pesticide Manual, 10th edn., British Crop Protection,
London, 1994.
[22] C. Liñán Vicente (Editor), Vademécum de Productos Fitosanitarios y
Nutricionales, 14th edn., Agrotécnicas S.L., Madrid (Spain), 1998.

7/18/2019 Automatizacion y Miniaturizacion de Sistemas de Screening y Determinacion de Residuos de Plaguicidas en Muestra Agroalimentaria
http://slidepdf.com/reader/full/automatizacion-y-miniaturizacion-de-sistemas-de-screening-y-determinacion-de 160/393
CAPITU LO III:
PLAGUICIDAS ORGANOCLORADOS
Y PIRETR OIDES EN HORTALIZAS
Y FR UTAS LIOFILIZADAS
CHAPTER III:
ORGANOCHLORINE AN D PYRETHROID
PESTICIDES IN LYOPHILISED

7/18/2019 Automatizacion y Miniaturizacion de Sistemas de Screening y Determinacion de Residuos de Plaguicidas en Muestra Agroalimentaria
http://slidepdf.com/reader/full/automatizacion-y-miniaturizacion-de-sistemas-de-screening-y-determinacion-de 161/393
PESTICIDES IN LYOPHILISED
VEGETABLES AND FR UITS
CAPITULO III
FLUIDOSBIOLOGICOS AGUAS
ORGANOCLORADOS
PIRETROIDES
EVAPORACION
SPE
MUESTRAS
HORTALIZASFRUTAS

7/18/2019 Automatizacion y Miniaturizacion de Sistemas de Screening y Determinacion de Residuos de Plaguicidas en Muestra Agroalimentaria
http://slidepdf.com/reader/full/automatizacion-y-miniaturizacion-de-sistemas-de-screening-y-determinacion-de 162/393
Organoclorados y Piretroides en Hortalizas y Frutas Liofilizadas Capítulo III
En este Cap. III de la Memoria se aborda el desarrollo de un MRM selectivo,
para la determinación de plaguicidas piretroides (Cap. III.1), y de MRMs multiclase

7/18/2019 Automatizacion y Miniaturizacion de Sistemas de Screening y Determinacion de Residuos de Plaguicidas en Muestra Agroalimentaria
http://slidepdf.com/reader/full/automatizacion-y-miniaturizacion-de-sistemas-de-screening-y-determinacion-de 163/393
para la determinación de plaguicidas organoclorados y piretroides (Cap. III.2 y III.3),
ambos en muestras de frutas y hortalizas liofilizadas. De nuevo en este capítulo se ha
utilizado la cromatografía de gases acoplada a los detectores de captura de electrones y
espectrometría de masas, así como también se han automatizado los procesos analíticos.
Los métodos descritos para la determinación de estos plaguicidas en productos
hortofrutícolas emplean muestras frescas para su extracción directa [1,2]. Sin embargo,
la liofilización ha sido utilizada en la determinación de estos residuos en muestras
liofilizadas de alimentos de origen animal [3,4], de suelos y sedimentos [5], e incluso en
muestras acuosas utilizando un soporte inerte sobre el que quedan adsorbidos los
plaguicidas tras la sublimación del agua que constituye la muestra [6]. La liofilización
constituye también una alternativa ventajosa en el pretratamiento de muestras
hortofrutícolas. El alto contenido en agua de estos productos los hace muy perecederos,
siendo además el vehículo en el que tienen lugar numerosas reacciones químicas y
biológicas, que pueden ocasionar también la degradación del plaguicida presente. De
hecho, además de simplificar la metodología de extracción, la liofilización aumenta la
Almudena Columé Díaz Tesis Doctoral
REFERENCIAS
[1] A. R. Fernández Alba, A. Valverde, A. Aguera, M. Contreras, J. Chromatogr.
A 686 (1994) 263.
[2] H. B. Wan, M. K. Wong, P. Y. Lim, C. Y. Mok, J. Chromatogr. A 662 (1994)
147.

7/18/2019 Automatizacion y Miniaturizacion de Sistemas de Screening y Determinacion de Residuos de Plaguicidas en Muestra Agroalimentaria
http://slidepdf.com/reader/full/automatizacion-y-miniaturizacion-de-sistemas-de-screening-y-determinacion-de 164/393
[3] M. Weichbrodt, W. Vetter, E. Scholz, B. Luckas, K. Reinhardt, Int. J. Environ.
Anal. Chem 73 (1999) 309.
[4] M. J. Gradwell, T. W. M. Fan, A. N. Lane, Anal. Biochem. 263 (1998) 139.
[5] A. Pastor, E. Vázquez, R. Ciscar, M. de la Guardia, Anal. Chim. Acta 344
(1997) 241.
[6] C. Charreteur, N. Kerbaol, J. J. Peron, Analusis 24 (1996) 336.
Organoclorados y Piretroides en Hortalizas y Frutas Liofilizadas Capítulo III
Selective enrichment of seventeen pyrethroids from lyophilisedagricultural samples
Journal of Chromatography A 912 (2001) 83-90ELSEVIER
JOURNAL OFCHROMATOGRAPHY A

7/18/2019 Automatizacion y Miniaturizacion de Sistemas de Screening y Determinacion de Residuos de Plaguicidas en Muestra Agroalimentaria
http://slidepdf.com/reader/full/automatizacion-y-miniaturizacion-de-sistemas-de-screening-y-determinacion-de 165/393
Abstract
The screening of agricultural samples to determine 17 synthetic pyrethroids was
investigated. Samples were lyophilised without losses of the insecticides, and then extracted
with n-hexane. A simple, continuous preconcentration-elution system was developed, which
included a silica sorbent column (packed with 50 mg) and used an air stream to carry the eluent
(ethyl acetate) which minimised the eluate volume thus increasing the preconcentration factor;so no evaporation step was required. Pyrethroids were determined by gas chromatography-
electron capture detection (GC-ECD) by using a 5% phenylmethylpolysiloxane-coated fused-
silica capillary column; gas chromatography/mass spectrometry was used to identify the
pyrethroids detected by GC-ECD monitoring. Limits of detection varied between 0.1 and 0.8
ng/mL (except for piperonyl butoxide, 25 ng/mL) with linear ranges from 1 to 200 ng/mL; the
precision of the method was high (3-6 %). Recoveries of 17 insecticides from 14 different
agricultural samples fortified at levels of 20-100 ng/g ranged from 66 to 102 % (bifenthrin and
deltamethrin were those providing the lowest values, 66-87 %). Pyrethroids were detected in
agricultural samplesA. Columé, S. Cárdenas, M. Gallego, M. Valcárcel
Analytical Chemistry Division, Campus de Rabanales, University of Córdoba, E-140 71 Córdoba, Spain
Received 29 June 2000; received in revised form 9 October 2000; accepted 9 January 2001
Almudena Columé Díaz Tesis Doctoral
1. INTRODUCTION
Pyrethroids are a relatively new developed group of insecticides widely used in
the control of agricultural, forestry and stored products pests [1]. Considering that they
are harmless for mammals under normal circumstances and the absence of toxic
metabolites, their maximum residue limits (MRLs) are, in general, higher than those of

7/18/2019 Automatizacion y Miniaturizacion de Sistemas de Screening y Determinacion de Residuos de Plaguicidas en Muestra Agroalimentaria
http://slidepdf.com/reader/full/automatizacion-y-miniaturizacion-de-sistemas-de-screening-y-determinacion-de 166/393
organophosphorous, organochlorine or carbamate pesticides [2]. Notwithstanding their
relatively low toxicity, the residue analysis of pyrethroids in crops, foods and
environmental matrices is of importance in agricultural and environmental sciences.
Almost all the analytical methods for the determination of pyrethroid residues in
agricultural commodities are based on the use of chromatographic techniques [3-23],
mainly gas chromatography (GC).
Despite the chromatographic technique used, extensive sample pretreatment is
required, including preconcentration and clean-up steps. In a general procedure,
representative subsamples from fresh vegetables/fruits are homogenised and extracted
once or several times using either a single solvent [5-9,13,14] or a binary solvent
mixture [10]. When a water miscible solvent is used, subsequent liquid-liquid partition
with an immiscible one such as n-hexane [5,13,14] or toluene [7,8] is included. The
clean-up of the final organic extract is then carried out by solid-phase extraction [5-
10,21] or gel permeation chromatography [6,15]. Supercritical fluid extraction [18,19]
as well as the matrix solid-phase dispersion [11,20] have also been proposed for this
d i i All h h d h b li d h d i i f id f
Organoclorados y Piretroides en Hortalizas y Frutas Liofilizadas Capítulo III
sample pretreatment, particularly for sample preservation. In the case of agricultural
and food analysis, the use of freeze-drying led to the solution of a variety of problems
encountered in the storage of these type of samples [24].
The aim of this work was to develop a simple and fast method, which allows
the screening of agricultural samples for the determination of synthetic pyrethroids. The

7/18/2019 Automatizacion y Miniaturizacion de Sistemas de Screening y Determinacion de Residuos de Plaguicidas en Muestra Agroalimentaria
http://slidepdf.com/reader/full/automatizacion-y-miniaturizacion-de-sistemas-de-screening-y-determinacion-de 167/393
organic extractant was added to the lyophilised samples and the analytes retained on a
silica column inserted into a flow configuration more simple than that described
elsewhere for organochlorine pesticides [25] with the view of carrying out the analyte
preconcentration and matrix clean-up in a single step. The high sensitivity and
selectivity of the proposed method allows the determination of 16 synthetic pyrethroids
and piperonyl butoxide (a synergist found in combination with pyrethroids) in
lyophilised fruit and vegetable samples at concentrations lower than their MRLs.
2. EXPERIMENTAL
2.1. Chemicals and standards
All reagents were of analytical grade or better. Bifenthrin, lambda-cyhalothrin,
deltamethrin, fenpropathrin, fenvalerate (cis and trans isomers), permethrin (cis and
trans isomers), cyfluthrin isomers, β-cyfluthrin, cypermethrin isomers, α-cypermethrin,
synergist piperonyl butoxide and endosulfan sulphate (internal standard, IS) were
obtained from Riedel-de-Haën (Seelze, Germany). Cyfluthrin and cypermethrin have
Almudena Columé Díaz Tesis Doctoral
isomer III of cypermethrin and β-cyfluthrin is the mixture of isomers II and IV of
cyfluthrin at ratio 1:2. The silica sorbent was obtained from Varian (Zug, Switzerland).
Solvents (ethyl acetate, n-hexane, isopropanol, acetonitrile) were purchased from
Merck (Darmstadt, Germany).
Stock standard solutions of each pyrethroid and piperonyl butoxide (synergist

7/18/2019 Automatizacion y Miniaturizacion de Sistemas de Screening y Determinacion de Residuos de Plaguicidas en Muestra Agroalimentaria
http://slidepdf.com/reader/full/automatizacion-y-miniaturizacion-de-sistemas-de-screening-y-determinacion-de 168/393
for pyrethrins) were prepared in n-hexane at concentrations of 5 mg/mL and stored in
glass stoppered bottles in the dark at 4 °C.
2.2. Instruments and apparatus
Experiments were carried out by using a Hewlett-Packard 5890 A gas
chromatograph equipped with a 63 Ni electron-capture detection (ECD) system.
Chromatographic separation was achieved by using a fused-silica capillary column (30
m x 0.25 mm i.d.) coated with 5% phenylmethylpolysiloxane (film thickness 0.25 µm)
(Supelco, Madrid, Spain). Peak areas were measured with a Hewlett-Packard 3392 A
integrator. The injector and detector temperatures were maintained at 225°C and 325°C
throughout. The column temperature was raised from 170°C (hold 2 min) to 255°C
(hold 15 min) at 10°C/min and then to 285°C (hold 6 min) at 8°C/min. Nitrogen (6.0,
Air Liquide, Seville, Spain) at a flow-rate of 1 mL/min was used as carrier gas.
Confirmatory analyses were carried out on a Fisons 8000 GC instrument interfaced to a
Fisons MD800 mass spectrometer and controlled by a computer running MASSLAB
Organoclorados y Piretroides en Hortalizas y Frutas Liofilizadas Capítulo III
Liquide), as carrier gas (1 mL/min). The injection port and transfer line temperatures
were maintained at 225°C and 300°C, respectively. The ion source temperature was
200°C for the 70 eV electron impact mode, with scanning from m/z 70 to 500. In all
analyses, 1 µL of the organic extract was injected in the split mode (1:25 ratio).
The flow system consisted of a Gilson Minipuls-2 peristaltic pump fitted with
7/18/2019 Automatizacion y Miniaturizacion de Sistemas de Screening y Determinacion de Residuos de Plaguicidas en Muestra Agroalimentaria
http://slidepdf.com/reader/full/automatizacion-y-miniaturizacion-de-sistemas-de-screening-y-determinacion-de 169/393
Solvaflex pumping tubes, two Rheodyne 5041 injection valves, PTFE tubing (0.5 mm
i.d.) and commercially available connectors. A laboratory-made glass column (2 cm x 4
mm i.d.) packed with ∼ 50 mg of silica was also employed; small cotton beads were
used on the ends to prevent material losses. The sorbent column was sequentially
conditioned with 0.5 mL of acetonitrile and 1 mL of n-hexane prior retention. A glass
column (3 cm x 5 mm i.d., packed with cotton wool) was also constructed for filtration
purposes. A Hetossic laboratory freeze-dryer, type CD-53-1 (Birkerod, Denmark) was
also employed.
2.3. Sample preparation
Vegetables and fruits were purchased at local markets in Córdoba. Because the
legally established limits of pyrethroid residues have been set for raw materials,
samples were analysed unwashed, in a raw state [26]. Sampling was done according to
the legally established protocol [27]. Thus, a raw global sample consisting of ∼5 Kg
was reduced by quartering to ∼500 g and then pulped in a high-speed blender and
Almudena Columé Díaz Tesis Doctoral
conserved in glass containers, at -20ºC in the dark, until analysis, the concentration of
pyrethroids remaining constant for at least three months. An accurately weighed
amount of 0.1-1 g of lyophilised sample was placed into a 100 mL amber glass bottle
with 15 mL of n-hexane and 0.1 mL of 0.75 µg/mL endosulfan sulphate (IS). Once
stoppered, the mixture was shaken (10 min) and 5 mL of the n-hexane phase was
7/18/2019 Automatizacion y Miniaturizacion de Sistemas de Screening y Determinacion de Residuos de Plaguicidas en Muestra Agroalimentaria
http://slidepdf.com/reader/full/automatizacion-y-miniaturizacion-de-sistemas-de-screening-y-determinacion-de 170/393
continuously aspirated and filtered into the manifold of Figure 1.
2.4. Screening procedure
The continuous preconcentration and elution system designed is shown in
Figure 1. In the preconcentration step, a volume of 5 mL of standard solution or treated
sample containing 1-200 ng/mL of each pyrethroid in n-hexane, was continuously
introduced into the system at 2 mL/min. A cotton column was used to filter fine
particles in order to avoid clogging the sorbent column. The analytes were retained on
the silica column (50 mg), located in the loop of injection valve (IV1), the sample
matrix being sent to waste. Simultaneously, the loop of the second valve (IV2) was
filled with the eluent (ethyl acetate) Prior to the elution, by switching IV 1, residual
organic solution inside the column and the connectors were flushed by passing an air
stream through the carrier line of the IV2 at 1 mL/min for 4 min. In the elution step, IV2
was switched and 175 µL of the eluent were injected into an air stream and passed
through the sorbent column to elute the pyrethroids (position in bold lines). The extract
Organoclorados y Piretroides en Hortalizas y Frutas Liofilizadas Capítulo III
was collected in a glass vial and 1 µL aliquot injected into the gas chromatograph. After
each determination, the sorbent column was cleaned with 0.5 mL of isopropanol to
remove residual compounds from the matrix and then conditioned with 0.5 mL of
acetonitrile and 1 mL of n-hexane.

7/18/2019 Automatizacion y Miniaturizacion de Sistemas de Screening y Determinacion de Residuos de Plaguicidas en Muestra Agroalimentaria
http://slidepdf.com/reader/full/automatizacion-y-miniaturizacion-de-sistemas-de-screening-y-determinacion-de 171/393
Figure 1. Scheme of the solid-phase extraction unit designed for the screening anddetermination of pyrethroids and piperonyl butoxide in lyophilised agricultural samples.F=filter; P=peristaltic pump; IV=injection valve; W=waste; GC=gas chromatograph with ECDor MS detector.
GC1 mL/min
Air
P
IV1
IV2
175 µL
Sample
F
Ethyl acetate
2 mL/min
SilicaW
GC1 mL/min
Air
P
IV1
IV2
175 µL
Sample
F
Ethyl acetate
2 mL/min
SilicaW
Almudena Columé Díaz Tesis Doctoral
3. RESULTS AND DISCUSSION
3.1. Lyophilisation of the samples
Fresh vegetables and fruits contain abundant amount of water normally more
than 80% , which favours biodegradations and hydrolysis reactions. Lyophilisation of
fresh samples provides at least three advantages, namely: to facilitate both the storage
d i f h l d i lif h i d I hi

7/18/2019 Automatizacion y Miniaturizacion de Sistemas de Screening y Determinacion de Residuos de Plaguicidas en Muestra Agroalimentaria
http://slidepdf.com/reader/full/automatizacion-y-miniaturizacion-de-sistemas-de-screening-y-determinacion-de 172/393
and conservation of the samples, and to simplify the extraction procedure. In this way,
preliminary experiments were focused on the lyophilisation of the samples; spinach and
apple were selected as vegetable and fruit sample tests, respectively.
For this purpose, chopped fresh test samples (∼100 g) were spiked with the 17
analytes studied at a concentration of 50 ng/g; the resulting mixture was split in two
fractions. One half was manually extracted first with acetone and then with n-hexane,
according to the standard method [14] and the other half was lyophilised, directly
extracted with n-hexane, and the standard method followed. Results of these
experiments (repeated four times) provided the following conclusions: (i) studied
pyrethroids and the synergist were not evaporated during the lyophilisation process; (ii)
although the percentages of recovery were similar (∼80%) in the two parallel sets, the
precision was higher in lyophilised samples than in fresh ones; and (iii) the direct
extraction of the lyophilised samples with n-hexane provided cleaner extracts than those
of fresh ones.
Organoclorados y Piretroides en Hortalizas y Frutas Liofilizadas Capítulo III
3.2. Solid-phase extraction unit
The optimisation of the solid-phase extraction (SPE) system was done by using
a standard solution containing 100 ng/mL of each pyrethroid and 1 µg/mL of piperonyl
butoxide (according to its lower sensitivity by ECD) in n-hexane. Several sorbents
(LiChrolut-EN, RP-C18, Florisil, alumina, Bond Elut-CN, Bond Elut-2OH and silica)
d i 5 L f t d d l ti Th h l l t ll t d i l

7/18/2019 Automatizacion y Miniaturizacion de Sistemas de Screening y Determinacion de Residuos de Plaguicidas en Muestra Agroalimentaria
http://slidepdf.com/reader/full/automatizacion-y-miniaturizacion-de-sistemas-de-screening-y-determinacion-de 173/393
were assayed using 5 mL of standard solution. The whole eluate was collected in glass
vials, evaporated to dryness under N2 and the residue redissolved in 200 µL of ethyl
acetate. Complete retention was only achieved with silica (>95 %); the other sorbents
provided lower efficiency (viz. 10-40%). Different organic solvents (ethyl acetate,
acetonitrile, isopropanol and acetone) were assayed as eluent. Ethyl acetate was the best
eluent (∼ 100 % elution). A column packed with 50 mg of silica and an eluent volume
of 175 µL were selected as optimum. The influence of the sample and eluent flow-rates
were examined over the range 0.2-4.0 mL/min. Complete retention and elution were
achieved at flow-rates lower than 2.4 and 1.2 mL/min, respectively. A sample and
eluent flow-rates of 2.0 and 1.0 mL/min were finally chosen.
In order to attain the highest enrichment factor, the breakthrough volume was
evaluated by passing different volumes of standard solutions, containing 100 ng of each
pyrethroid and 1 µg of piperonyl butoxide, in n-hexane. Sample volumes up to 25 mL
can be used with negligible changes in the chromatographic signal. However, a sample
volume of 5 mL is enough to reach concentrations lower than the MRLs established for
Almudena Columé Díaz Tesis Doctoral
sulphate was selected as internal standard among others compounds as it was
quantitatively retained on the silica column and eluted with ethyl acetate; it was added
directly to the standards or samples, at concentration of 5 ng/mL.
To ensure the applicability of the optimised SPE unit to real samples, 0.5 g of
lyophilised test samples (spinach and apple) were extracted with 10 mL of n-hexane for
10 min The yellowish extracts were spiked with 100 ng of each pyrethroid (1 µg of
7/18/2019 Automatizacion y Miniaturizacion de Sistemas de Screening y Determinacion de Residuos de Plaguicidas en Muestra Agroalimentaria
http://slidepdf.com/reader/full/automatizacion-y-miniaturizacion-de-sistemas-de-screening-y-determinacion-de 174/393
10 min. The yellowish extracts were spiked with 100 ng of each pyrethroid (1 µg of
piperonyl butoxide) and a volume of 5 mL was aspirated into the SPE system. The
peaks corresponding to target compounds were correctly identified in both
chromatograms against those corresponding to sample matrices, without overlapping.
Therefore, the proposed system can be applied to the determination of these pesticides
in agricultural samples.
3.3.Linearity and precision
Calibration graphs were obtained by using aliquots of 5 mL of n-hexane
containing each pesticide at known concentrations (1-200 ng/mL for pyrethroids and
50-1500 ng/mL for piperonyl butoxide). In the case of mixture of isomers, the global
analytical signal was obtained by summing the peak areas of all isomers. Figures of
merit are listed in Table 1. The precision of the method as relative standard deviation
(RSD, n=20) was acceptable for all pesticides.
Organoclorados y Piretroides en Hortalizas y Frutas Liofilizadas Capítulo III
Table 1. Analytical figures of merit of the proposed method.
CompoundSensitivitya
(10-2)Linear range
(ng/mL)LOD (ng/mL) RSD (%) m/z b
Piperonyl butoxide 0.5 50-1500 25 4.4 149, 176, 338
Bifenthrin 16.5 1-200 0.1 5.3 152, 165, 181
Fenpropathrin 17.9 1-200 0.1 5.0 97, 181, 349
λ-Cyhalothrin 22.9 1-200 0.1 3.3 141, 181, 209
Permethrin 5.6 2-200 0.8 6.2 163, 183, 390
Cyfluthrin 28 8 1-200 0 4 4 7 77 163 227

7/18/2019 Automatizacion y Miniaturizacion de Sistemas de Screening y Determinacion de Residuos de Plaguicidas en Muestra Agroalimentaria
http://slidepdf.com/reader/full/automatizacion-y-miniaturizacion-de-sistemas-de-screening-y-determinacion-de 175/393
Cyfluthrin 28.8 1 200 0.4 4.7 77, 163, 227β-Cyfluthrin 19.2 1-200 0.2 4.9 77, 163, 227
Cypermethrin 14.0 1-200 0.4 3.8 77, 181, 209
α-Cypermethrin 21.2 1-200 0.1 3.1 77, 181, 209
Fenvalerate 18.0 1-200 0.2 5.7 169, 181, 419
Deltamethrin 14.3 1-200 0.2 6.3 181, 209, 253aRelative area (analyte/internal standard peak area ratio) ng/mL; sample volume, 5 mL. bm/z values in italics are M+ ions; those in bold face correspond to the base peak.
3.4. Screening and determination of pyrethroids in agricultural samples
Prior to the screening of agricultural samples, the n-hexane volume and the
extraction time were optimised. For this purpose, several amount of 1 g of lyophilised
test samples (fortified with variable amounts of pesticides depending on the extractant
volume) were extracted with 15, 25 and 50 mL of n-hexane and the mixture was
mechanically shaken for different times (5 to 20 min). In all cases, 5 mL of the extract
was introduced into the SPE system. The influence of the volume of extractant was
negligible and the optimum extraction time was 10 min.
A total of 100 agricultural samples of 14 different types (namely: spinach,
chard, tomato, green pepper, potato, cauliflower, mushroom, strawberry, apple, pear,
Almudena Columé Díaz Tesis Doctoral
following the proposed method. Initially, 0.1 g of lyophilised sample was weighed and
analysed; when negative results were obtained, the sample amount was increased to 1 g;
in all instances, quantitation was done by ECD. Positive findings were confirmed by
MS, using 2 g of lyophilised sample with 30 mL of extractant and aspirating 25 mL of
extract into the SPE unit. As can be seen in Table 2, only eight samples were found to
contain pyrethroids at detectable levels and in all cases the concentrations found were
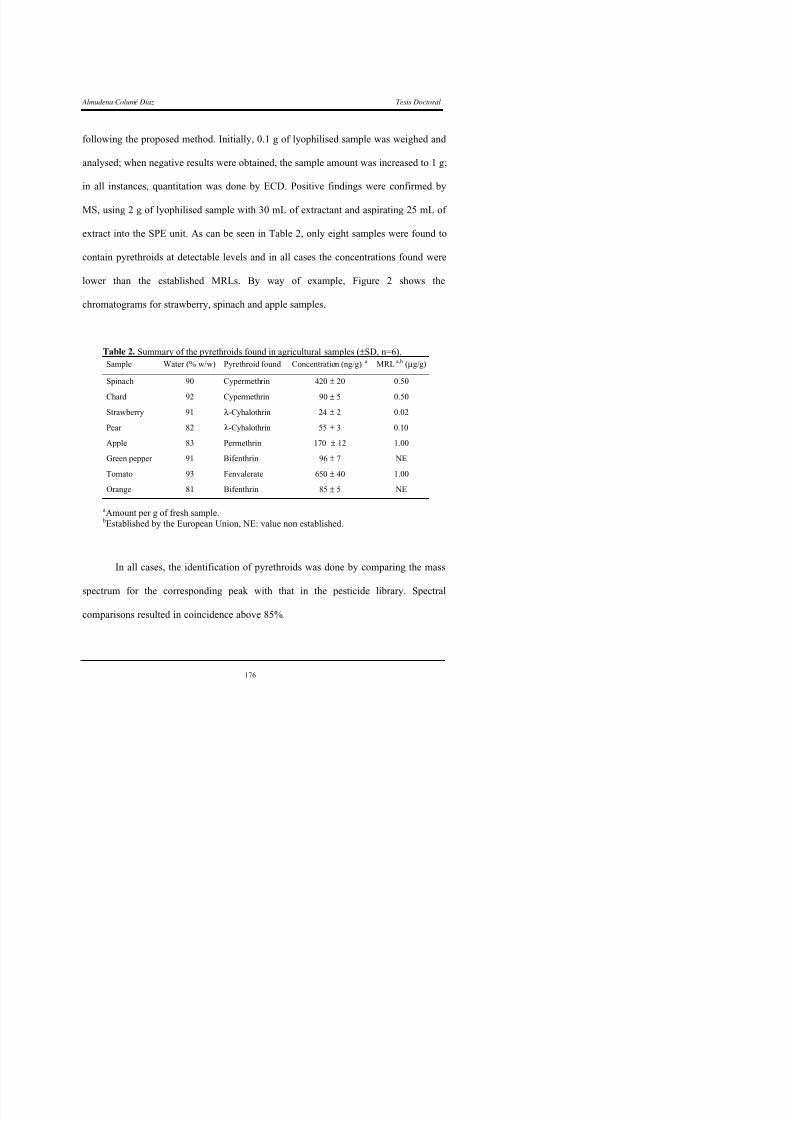
7/18/2019 Automatizacion y Miniaturizacion de Sistemas de Screening y Determinacion de Residuos de Plaguicidas en Muestra Agroalimentaria
http://slidepdf.com/reader/full/automatizacion-y-miniaturizacion-de-sistemas-de-screening-y-determinacion-de 176/393
contain pyrethroids at detectable levels and in all cases the concentrations found were
lower than the established MRLs. By way of example, Figure 2 shows the
chromatograms for strawberry, spinach and apple samples.
Table 2. Summary of the pyrethroids found in agricultural samples (±SD, n=6).
Sample Water (% w/w) Pyrethroid found Concentration (ng/g) a
MRL a,b
(µg/g)Spinach 90 Cypermethrin 420 ± 20 0.50
Chard 92 Cypermethrin 90 ± 5 0.50
Strawberry 91 λ-Cyhalothrin 24 ± 2 0.02
Pear 82 λ-Cyhalothrin 55 ± 3 0.10
Apple 83 Permethrin 170 ± 12 1.00
Green pepper 91 Bifenthrin 96 ± 7 NE
Tomato 93 Fenvalerate 650 ± 40 1.00Orange 81 Bifenthrin 85 ± 5 NE
aAmount per g of fresh sample. bEstablished by the European Union, NE: value non established.
In all cases, the identification of pyrethroids was done by comparing the mass
spectrum for the corresponding peak with that in the pesticide library. Spectral
Organoclorados y Piretroides en Hortalizas y Frutas Liofilizadas Capítulo III
1
2
A )
1
2
A )

7/18/2019 Automatizacion y Miniaturizacion de Sistemas de Screening y Determinacion de Residuos de Plaguicidas en Muestra Agroalimentaria
http://slidepdf.com/reader/full/automatizacion-y-miniaturizacion-de-sistemas-de-screening-y-determinacion-de 177/393
Figure 2 GC ECD chromatograms for (A) 5 g of strawberry; (B) 2 5 g of spinach and
0 .0 2 0 .0 2 5 .0 3 0 .0 3 5 .0 4 0 .05 .0 1 0 .0 1 5 .0
1
7
8
1 34 5
6
Re te n t io n t im e (m in )
C )
B )
0 .0 2 0 .0 2 5 .0 3 0 .0 3 5 .0 4 0 .05 .0 1 0 .0 1 5 .0
1
7
8
1 34 5
6
Re te n t io n t im e (m in )
C )
B )
Retention time (min)
Almudena Columé Díaz Tesis Doctoral
Finally, in order to assess the potential of the proposed method, 14
uncontaminated agricultural samples, including those listed above, were spiked at three
different levels. Fortification process was carried out as follows: 2 mL of acetone
containing 1-5 µg of each pyrethroid (10-50 µg of piperonyl butoxide) was added to
50 g of the blended commodity, slightly shaken and left stand for ∼20 min for acetone
evaporation. Samples were then frozen prior to lyophilisation. Each sample was spiked

7/18/2019 Automatizacion y Miniaturizacion de Sistemas de Screening y Determinacion de Residuos de Plaguicidas en Muestra Agroalimentaria
http://slidepdf.com/reader/full/automatizacion-y-miniaturizacion-de-sistemas-de-screening-y-determinacion-de 178/393
p p p y p p p
three times and analysed in duplicate (n=6). Tables 3 and 4 list the average recovery
values obtained for each analyte spiked to the seven vegetable and seven fruit samples
studied at the three spiked concentrations [average results of seven samples and each
sample analysed six times (n=42)]. From the results obtained, several conclusions can
be addressed, namely: (i) average recoveries increased as the amount spiked increased;
(ii) average recovery values were slightly higher for vegetables than for fruits
(especially for permethrin and β-cyfluthrin); (iii) bifenthrin and deltamethrin provided
the lowest recoveries in all the samples studied (∼66-87 %), probably as consequence of
their higher degradation during sample treatment by interaction with food fluids.
Among the samples studied, spinach for vegetables and strawberry for fruits provided
recovery values that fitted the average values given in Tables 3 and 4, respectively, and
can therefore be used as model samples. Figure 3 shows the chromatograms for an
unfortified and fortified tomato sample. The efficiency of the clean-up step is also
showed in the upper part of this Figure. Few peaks from the matrix appear in the
Organoclorados y Piretroides en Hortalizas y Frutas Liofilizadas Capítulo III
chromatograms, the majority of them located at the beginning of the chromatogram,
before the internal standard, so, they do not interfere with analyte determination.
Table 3. Average recovery (± standard deviation) of spiked pyrethroids from the sevenvegetable samples tested. For details, see text.
Compound 20 ng/ga 40 ng/ga 100 ng/ga
Piperonyl butoxide b 87 ± 2 91 ± 2 96 ± 4
Bifenthrin 67 ± 3 69 ± 4 73 ± 5
Fenpropathrin 86 ± 3 94 ± 3 98 ± 4

7/18/2019 Automatizacion y Miniaturizacion de Sistemas de Screening y Determinacion de Residuos de Plaguicidas en Muestra Agroalimentaria
http://slidepdf.com/reader/full/automatizacion-y-miniaturizacion-de-sistemas-de-screening-y-determinacion-de 179/393
λ-Cyhalothrin 87 ± 6 95 ± 4 102 ± 5
Permethrin 83 ± 2 87 ± 3 93 ± 6
Cyfluthrin 91 ± 7 93 ± 5 96 ± 2
β-Cyfluthrin 87 ± 1 92 ± 3 96 ± 4
Cypermethrin 91 ± 6 96 ± 6 99 ± 7
α-Cypermethrin 87 ± 4 90 ± 4 97 ± 3
Fenvalerate 86 ± 4 90 ± 4 94 ± 2
Deltamethrin 75 ± 2 77 ± 5 84 ± 4
aConcentration spiked; bSpiked level was 10 times higher than for pyrethroids.
Table 4. Average recovery (± standard deviation) of spiked pyrethroids from the seven fruitsamples tested. For details, see text.
Compound 20 ng/ga 40 ng/ga 100 ng/ga
Piperonyl butoxide b 85 ± 6 93 ± 4 96 ± 2
Bifenthrin 66 ± 2 72 ± 6 74 ± 5
Fenpropathrin 85 ± 2 95 ± 4 99 ± 4
λ-Cyhalothrin 91 ± 4 97 ± 6 101 ± 4
Permethrin 86 ± 2 92 ± 5 100 ± 5
Cyfluthrin 88 ± 4 95 ± 4 99 ± 4
β-Cyfluthrin 91 ± 6 95 ± 4 99 ± 4
Cypermethrin 90 ± 7 94 ± 3 98 ± 4
α-Cypermethrin 87 ± 4 91 ± 2 97 ± 2
Fenvalerate 84 ± 6 91 ± 4 96 ± 3
Deltamethrin 76 ± 5 82 ± 6 87 ± 5
Almudena Columé Díaz Tesis Doctoral
1A )
1A )

7/18/2019 Automatizacion y Miniaturizacion de Sistemas de Screening y Determinacion de Residuos de Plaguicidas en Muestra Agroalimentaria
http://slidepdf.com/reader/full/automatizacion-y-miniaturizacion-de-sistemas-de-screening-y-determinacion-de 180/393
Figure 3. GC-ECD chromatograms for a sample of tomato (4 g) unfortified without (A) andwith (B) clean-up step and fortified (C) with 40 ng/g of each pyrethroid and 400 ng/g ofpiperonyl butoxide Peaks: 1=internal standard; 2=piperonyl butoxide; 3=bifenthrin;
2 0 .0 2 5 .0 3 0 .0 3 5 .0 4 0 .05 .0 1 0 .0 1 5 .0
R e ten t ion t im e (m in )
0 .0
1
2
34
5
87
6
9
1 0 1 11 21 31 4
1 5
1 6
1 71 8
1
C )
B )
2 0 .0 2 5 .0 3 0 .0 3 5 .0 4 0 .05 .0 1 0 .0 1 5 .0
R e ten t ion t im e (m in )
0 .0
1
2
34
5
87
6
9
1 0 1 11 21 31 4
1 5
1 6
1 71 8
1
C )
B )
Retention time (min)
Organoclorados y Piretroides en Hortalizas y Frutas Liofilizadas Capítulo III
4. CONCLUSIONS
The proposed method is simple and sensitive enough for application to
agricultural samples containing the analytes at concentrations lower than the MRLs. Its
most salient advantage over conventional methods is that it requires a single manual
extraction with an organic solvent; the following steps corresponding to
preconcentration, clean-up and elution are carried out in an automatic way, using an

7/18/2019 Automatizacion y Miniaturizacion de Sistemas de Screening y Determinacion de Residuos de Plaguicidas en Muestra Agroalimentaria
http://slidepdf.com/reader/full/automatizacion-y-miniaturizacion-de-sistemas-de-screening-y-determinacion-de 181/393
extraordinary simple flow injection configuration. The simplicity of the method
developed can be ascribed to sample lyophilisation which minimised the presence of
natural pigments as well as other concomitants in the final extract. Although the
lyophilisation of the agricultural samples is the most time-consuming step, it allows
simultaneous processing of a large number of samples.
ACKNOWLEDGMENTS
This work was supported by a grant PB-95-0977 from Spain’s CICyT.
Almudena Columé Díaz Tesis Doctoral
REFERENCES
[1] J.H. Davies, In: J.P. Leahey (Ed.), The Pyrethroid Insecticides, Taylor &
Francis, London, 1985.
[2] Community Directive 93/58 EEC , Off. J. Eur. Commun. L 211/6, European
Community, Brussels, 1993.
[3] A. Andersson, H. Palsheden, Fresenius J. Anal. Chem. 339 (1991) 365.l ( )
7/18/2019 Automatizacion y Miniaturizacion de Sistemas de Screening y Determinacion de Residuos de Plaguicidas en Muestra Agroalimentaria
http://slidepdf.com/reader/full/automatizacion-y-miniaturizacion-de-sistemas-de-screening-y-determinacion-de 182/393
[4] J.P. Kutter, T.J. Class, Chromatographia 33 (1992) 103.
[5] Y. Nakamura, Y. Tonogai, Y. Tsumura, Y. Ito, J. AOAC Int . 76 (1993) 1348.
[6] E. Papadopoulou-Mourkidou, in J. Sherma and T. Cairnes (Editors),
Comprehensive Analytical Profile of Important Pesticides, CRC Press, New
York, 1993, p. 3-146.
[7] G.F. Pang, C.L. Fan, Y.Z. Chao, T.S. Zhao , J. Chromatogr. A 667 (1994) 348.
[8] H.B. Wan, M.K. Wong, P.Y. Lim, C.Y. Mok , J. Chromatogr. A 662 (1994)
147.
[9] A.R. Fernández-Alba, A. Valverde, A. Agüera, M. Contreras, J. Chromatogr. A
686 (1994) 263.
[10] G.F. Pang, C.L. Fan, Y.Z. Chao, T.S. Zhao , J. AOAC Int . 77 (1994) 738.
[11] Y.C. Ling, I.P. Huang, J. Chromatogr. A 695 (1995) 75.
[12] G.F. Pang, Y.Z. Chao, X.S. Liu, C.L. Fan, J. AOAC Int . 78 (1995) 1474.
[13] G.F. Pang, Y.Z. Chao, C.L. Fan, J.J. Zhang, X.M. Li, T.S. Zhao, J. AOAC Int.
8 (199 ) 1481
Organoclorados y Piretroides en Hortalizas y Frutas Liofilizadas Capítulo III
[14] G.F. Pang, Y.Z. Chao, C.L. Fan, J.J. Zhang, X.M. Li, Y.M. Liu, T.S. Zhao, J.
AOAC Int . 78 (1995) 1489.
[15] Z. Chen, Y. Wang , J. Chromatogr. A 754 (1996) 367.
[16] H.J. Stan, M. Linkerhaegner, J. Chromatogr. A 750 (1996) 369.
[17] C. M. Torres, Y. Pico, J. Manes, J. Chromatogr. A 754 (1996) 301.
[18] R. Stefani, M. Buzzi, R. Grazzi, J. Chromatogr. A 782 (1997) 123.[19] R J A K I Ell R M Pf il R T B J A i F d Ch 45

7/18/2019 Automatizacion y Miniaturizacion de Sistemas de Screening y Determinacion de Residuos de Plaguicidas en Muestra Agroalimentaria
http://slidepdf.com/reader/full/automatizacion-y-miniaturizacion-de-sistemas-de-screening-y-determinacion-de 183/393
[19] R.J. Argauer, K.I. Eller, R.M. Pfeil, R.T. Brown, J. Agric. Food Chem. 45
(1997) 180.
[20] H.S. Dorea, F. M. Lancas , J. Microcolumn Sep. 11 (1999) 367.
[21] H. Obana, K. Akutsu, M. Okihashi, S. Kakimoto, S. Hori, Analyst 124 (1999)
1159.
[22] D. Kasaj, A. Rieder, L. Krenn, B. Kopp, Chromatographia 50 (1999) 607.
[23] G. R. van der Hoff, P. van Zoonen , J. Chromatogr. A 843 (1999) 301.
[24] M.D. Luque de Castro, A. Izquierdo , J. Autom. Chem. 12 (1990) 267.
[25] A. Columé, S. Cárdenas, M. Gallego, M. Valcárcel, J. Chromatogr. A 849
(1999) 235.
[26] R. Coscolla, Residuos de Plaguicidas en Alimentos Vegetales, Mundi-Prensa,
Madrid, 1993.
[27] Community Directive 79/700/EEC , Off. J. Eur. Commun., European
Community, Brussels, 1979.

7/18/2019 Automatizacion y Miniaturizacion de Sistemas de Screening y Determinacion de Residuos de Plaguicidas en Muestra Agroalimentaria
http://slidepdf.com/reader/full/automatizacion-y-miniaturizacion-de-sistemas-de-screening-y-determinacion-de 184/393
Organoclorados y Piretroides en Hortalizas y Frutas Liofilizadas Capítulo III
Multiresidue screening of pesticides in fruits using an automaticsolid-phase extraction system
A. Columé, S. Cárdenas, M. Gallego, M. Valcárcel Analytical Chemistry Division, Campus de Rabanales, University of Córdoba, E-14071 Córdoba, Spain
J. Agric. Food Chem. 49 (2001) 1109-1116
Journal of
Agriculturaland FoodChemistry

7/18/2019 Automatizacion y Miniaturizacion de Sistemas de Screening y Determinacion de Residuos de Plaguicidas en Muestra Agroalimentaria
http://slidepdf.com/reader/full/automatizacion-y-miniaturizacion-de-sistemas-de-screening-y-determinacion-de 185/393
Abstract
About 20 pesticides were determined in lyophilised fruits using a semi-automatic
multiresidue method, based on solid-phase extraction (SPE) with a silica column. The
lyophilisation of the sample besides the SPE procedure selected, provided clean extracts despite
the complexity of the matrices studied. In addition, the lyophilisation process allows sample preservation for at least three months without changes in the concentration of the pesticides.
Determination and quantitation of organochlorine and pyrethroid residues was carried out using
a gas chromatograph equipped with an electron capture detector (GC-ECD) and a mass
spectrometric detector (GC-MS) for confirmation purposes. Organochlorine pesticides provided
average recoveries (spiked at three concentration levels in eight different fruits) near 93 ± 4 %,
being lower (89 ± 8 %) for pyrethroids as consequence of their higher degradation/interaction
with the sample matrix. On the other hand, the detection limits achieved for all pesticides (0.5-8
ng per g of lyophilised fruit) allow their determination at the MRLs established by the European
Received 22 September 2000; received in revised form 7 December 2000; accepted 17 December 2000
Almudena Columé Díaz Tesis Doctoral
1. INTRODUCTION
Pesticides are necessary and essential in agricultural production. With their use,
the risk of residues remaining on the food consumed is present. For this reason,
governments and international organisations have published a list of pesticides and their
tolerances or maximum residues limits (MRLs) [1]. Fresh fruits must be screened for
pesticide residues before marketing, but because of their short life-time, a rapid, simple
analytical process as well as high accuracy in the identification and quantitation of the

7/18/2019 Automatizacion y Miniaturizacion de Sistemas de Screening y Determinacion de Residuos de Plaguicidas en Muestra Agroalimentaria
http://slidepdf.com/reader/full/automatizacion-y-miniaturizacion-de-sistemas-de-screening-y-determinacion-de 186/393
analytical process as well as high accuracy in the identification and quantitation of the
analytes detected is required. Organochlorine and pyrethroid pesticides are a large
group of fungicides and insecticides extensively used in recent decades against pests all
over the world [2]. Organochlorine pesticides (OCPs) are very persistent because of
their high lipophilic properties and stability [3,4]. Pyrethroids are less harmful for
mammals; only the parent pyrethroids show toxicity as the existence of significant toxic
metabolites has not yet been proved [2]. In any case, the identification and quantitation
of pyrethroid residues, along with OCPs, is necessary to monitor and regulate their
usage on crop to protect the consumers from unsafe levels.
Most determinations of OCPs and pyrethroids have been developed using
chromatographic techniques, mainly gas chromatography (GC). Some of these
pesticides have one or more halogen atoms in their chemical structure, so the electron
capture detector (ECD) is used because of its high selectivity [5-8]. For confirmation
purposes, mass spectrometry (MS) is also employed [5,6].
i l i i i hi h ll
Organoclorados y Piretroides en Hortalizas y Frutas Liofilizadas Capítulo III
provide clean extracts. Basically, a homogenised sample is extracted, once or several
times, with a single solvent, typically acetonitrile [9,10], ethyl acetate [6,11,12],
acetone [5,7] or n-hexane [13]; or a solvent mixture, such as toluene-acetonitrile [14],
acetone-dichloromethane-hexane [15], acetone-n-hexane [16] or acetone- petroleum
ether [17]. Normally, there are too many co-extractives and the extracts obtained must
be cleaned-up by liquid-liquid partition (LLP) and/or solid phase extraction (SPE). If a
polar solvent is used as the first extractant, a LLP is subsequent carried out with a non
7/18/2019 Automatizacion y Miniaturizacion de Sistemas de Screening y Determinacion de Residuos de Plaguicidas en Muestra Agroalimentaria
http://slidepdf.com/reader/full/automatizacion-y-miniaturizacion-de-sistemas-de-screening-y-determinacion-de 187/393
p , q
polar solvent [7]. The SPE can be applied on RP-C18 [9], silica-gel [11], Florisil [7,16]
or alumina [6].
The majority of the methods developed to date are based on the direct
extraction of the pesticides from fresh samples. However, lyophilisation of fruits and
vegetables leads to a higher stability of the samples without losses of analytes. In this
regard, few contributions have been recently published [8,18] although only the latter
implements the automatic extraction of pyrethroids from lyophilised agricultural
samples. In this paper, the solid-phase extraction system proposed elsewhere [18] for
pyrethroids determination was initially adopted, but we studied other solvents and
sorbents in order to extent the use of the system to organochlorine pesticides. Fruit
samples were lyophilised after collection in a raw state, then conserved at −20°C to
retain the concentrations of OCPs and pyretroids residues at constant levels for at least
three months. The method is rapid and does not require either laborious sample
Almudena Columé Díaz Tesis Doctoral
method allows the screening of at least 19 pesticides at concentrations lower than their
established MRLs.
2. MATERIALS AND METHODS
2.1. Apparatus
Analyses were performed on a Hewlett-Packard 5890 A gas chromatograph
equipped with a 63 Ni electron-capture detector (ECD) and a fused-silica capillary

7/18/2019 Automatizacion y Miniaturizacion de Sistemas de Screening y Determinacion de Residuos de Plaguicidas en Muestra Agroalimentaria
http://slidepdf.com/reader/full/automatizacion-y-miniaturizacion-de-sistemas-de-screening-y-determinacion-de 188/393
q pp p ( ) p y
column (30 m x 0.25 mm i.d.) coated with 5% phenylmethylpolysiloxane (film
thickness 0.25 µm) (Supelco, Madrid, Spain), connected to a Hewlett-Packard 3392 A
integrator. The injector and detector were operated at 225°C and 325°C, respectively.
The chromatographic temperature program was: 150°C for 2 min, raised to 170°C
(8ºC/min), and held for 4 min; then raised to 255°C (8ºC/min), and held for 15 min; and
finally raised to 285ºC (5ºC/min) and held for 6 min. Nitrogen (6.0, Air Liquide,
Seville, Spain) at a flow-rate of 1 mL/min was used as carrier gas. To confirm the
identity of eluted GC peaks, a Fisons 8000 GC instrument interfaced to a Fisons
MD800 mass spectrometer and controlled by a computer running MASSLAB software
(Thermo, Madrid, Spain) was also used; the chromatographic column and temperature
program were both similar to those used with ECD. Ultrapure helium (6.0, Air
Liquide), at a flow-rate of 1 mL/min, was employed as carrier gas. The injection port
and transfer line temperatures were maintained at 225°C and 300°C, respectively. The
Organoclorados y Piretroides en Hortalizas y Frutas Liofilizadas Capítulo III
were recorded from m/z 70 to 500. Samples (1 µL) were injected in the split mode (1:25
ratio).
The flow system was constructed with a Gilson Minipuls-2 peristaltic pump
(Villiers-le-Bel, France) furnished with Solvaflex pumping tubes, two Rheodyne 5041
injection valves, PTFE tubing (0.5 mm i.d.) and commercially available connectors.
The sorbent glass column (2 cm x 4 mm i.d.) was hand-packed with 50 mg of silica andsealed at both ends with small cotton beads to prevent material losses. The sorbent

7/18/2019 Automatizacion y Miniaturizacion de Sistemas de Screening y Determinacion de Residuos de Plaguicidas en Muestra Agroalimentaria
http://slidepdf.com/reader/full/automatizacion-y-miniaturizacion-de-sistemas-de-screening-y-determinacion-de 189/393
p
column was sequentially conditioned with 0.5 mL of acetonitrile and 1 mL of n-hexane
prior to retention. This column can be reused for at least three months, working daily,
including a washing step with 0.5 mL of isopropanol before conditioning. A glass
column (3 cm x 5 mm i.d., packed with cotton wool) was used to filtrate the n-hexane
phase.
A Hetossic laboratory freeze-dryer, type CD-53-1 (Birkerod, Denmark) was
also employed.
2.2. Chemicals and standard solutions
All chemicals and sorbents were of analytical grade or better. The following
pesticides, were studied: dicloran, lindane, vinclozolin, dichlofuanid, captan,
procymidone, α- and β-endosulfan (3:1), endosulfan sulphate, bifenthrin, lambda-
cyhalothrin, deltamethrin, fenpropathrin, fenvalerate (cis and trans isomers), permethrin
Almudena Columé Díaz Tesis Doctoral
α-cypermethrin and piperonyl butoxide (internal standard, IS) were obtained from
Riedel-de-Haën (Seelze, Germany). Cyfluthrin and cypermethrin have four isomers:
1(RS)cis,α(RS) = isomer I; 1(RS)trans,α(RS) = isomer III; 1(RS)cis,α(SR) = isomer II;
and 1(RS)trans,α(SR) = isomer IV; α-cypermethrin is the isomer III of cypermethrin
and β-cyfluthrin is the mixture of isomers II and IV of cyfluthrin at ratio 1:2. The RP-
C18 HPLC sorbent was supplied by Sigma (Madrid, Spain) and the silica sorbent was
obtained from Varian (Zug, Switzerland). Solvents (ethyl acetate, n-hexane,

7/18/2019 Automatizacion y Miniaturizacion de Sistemas de Screening y Determinacion de Residuos de Plaguicidas en Muestra Agroalimentaria
http://slidepdf.com/reader/full/automatizacion-y-miniaturizacion-de-sistemas-de-screening-y-determinacion-de 190/393
obtained from Varian (Zug, Switzerland). Solvents (ethyl acetate, n hexane,
isopropanol, acetonitrile) were purchased from Merck (Darmstadt, Germany).
Stock standard solutions of each pesticide were prepared in n-hexane at
concentrations of 5 mg/mL, and stored in glass stoppered bottles in the dark at 4 °C.
Working standard solutions were obtained by appropriate dilution with n-hexane.
2.3. Fruit materials and sample preparation
The trial was carried out with fruits purchased at local markets in Córdoba. Due
to the legally established limits of pesticides residues have been set for raw materials,
samples were analysed unwashed, in a raw state [19]. Sampling was done according to
the legally established protocol of the EU [20]. Thus, a raw global sample consisting of
∼5 Kg of each fruit was reduced by quartering it to ∼500 g (laboratory sample). For
melon, the raw sample (∼5 units) was cut into slices of ∼100 g and then reduced by
quartering to ∼500 g. Laboratory samples were pulped in a high-speed blender and
Organoclorados y Piretroides en Hortalizas y Frutas Liofilizadas Capítulo III
conserved in glass containers, at -20ºC in the dark, until analysis. Under these
conditions, the concentration of the pesticides assayed remained constant for at least
three months.
The lyophilised sample was prepared by the following method. An accurately
weighed amount of 0.1-1 g (n=5) containing between 2 ng and 2 µg of pesticides, was
placed into a 50 mL amber glass bottle with 10 mL of n-hexane and 0.1 mL of 200
µg/mL piperonyl butoxide (IS). After the bottle was stoppered, the mixture was

7/18/2019 Automatizacion y Miniaturizacion de Sistemas de Screening y Determinacion de Residuos de Plaguicidas en Muestra Agroalimentaria
http://slidepdf.com/reader/full/automatizacion-y-miniaturizacion-de-sistemas-de-screening-y-determinacion-de 191/393
mechanically shaken for 10 min and allowed to settle. Then, 5 mL of the n-hexane
phase, containing the analytes and the IS, was continuously aspirated and filtered into
the SPE system of Figure 1.
2.4. Analytical method
The SPE system used for the screening and determination of organochlorine
and pyrethroid pesticides in fruits is depicted in Figure 1. In the preconcentration step, 5
mL of a standard solution or the treated sample containing 0.2-200 ng/mL of pesticides(for lyophilised samples, between 2 ng/g and 2 µg/g) plus 2 µg/mL of IS in n-hexane,
was continuously aspirated at 2 mL/min through the cotton column, which filters fine
particles, occasionally present in the organic phase, to avoid clogging the system, and
then passed through the sorbent column (50 mg of silica), located in the loop of the
injection valve 1 (IV1), being the analytes retained and the sample matrix being wasted,
Almudena Columé Díaz Tesis Doctoral
Preconcentration step
Sample
F
P
mL/min
IV1
SilicaW
IV2
2
Preconcentration step
Sample
F
P
mL/min
IV1
SilicaW
IV2
2

7/18/2019 Automatizacion y Miniaturizacion de Sistemas de Screening y Determinacion de Residuos de Plaguicidas en Muestra Agroalimentaria
http://slidepdf.com/reader/full/automatizacion-y-miniaturizacion-de-sistemas-de-screening-y-determinacion-de 192/393
Elution step
Ethyl acetate
175 µµµµL
Air
GC
Air
P
mL/min
IV1
Silica
IV2
175 µµµµL
1
Elution step
Ethyl acetate
175 µµµµL
Air
GC
Air
P
mL/min
IV1
Silica
IV2
175 µµµµL
1
Organoclorados y Piretroides en Hortalizas y Frutas Liofilizadas Capítulo III
with the eluent (ethyl acetate) by means of a syringe. Prior to the elution, by switching
IV1, residual organic solution inside the column and the connectors were flushed by
passing an air stream through the carrier l ine of the IV2 at 1 mL/min for 4 min. In the
elution step, by switching IV2, 175 µL of the eluent was injected into an air stream and
passed through the sorbent column (in the direction opposite to that of the sample) to
elute the pesticides (position in bold lines). The eluate was collected in a glass vial,
containing anhydrous sodium sulphate and 1 µL aliquot was injected into the gas

7/18/2019 Automatizacion y Miniaturizacion de Sistemas de Screening y Determinacion de Residuos de Plaguicidas en Muestra Agroalimentaria
http://slidepdf.com/reader/full/automatizacion-y-miniaturizacion-de-sistemas-de-screening-y-determinacion-de 193/393
chromatograph. After each determination, the sorbent column was cleaned with 0.5 mL
of isopropanol to remove residual compounds from the matrix and then conditioned
with 0.5 mL of acetonitrile and 1 mL of n-hexane.
3. RESULTS AND DISCUSSION
3.1. Solid-phase extraction system
Recently, our working group has developed a flow system for the determination
of organochlorine pesticides (OCPs) in fresh fruits [21], and other one for the screening
of pyrethroids in lyophilised fruits [18]. Petroleum ether/n-hexane and RP-C18/silica
were found to be the most efficient extraction solvents and sorbents for
OCPs/pyrethroids, respectively. In both cases, the eluent was ethyl acetate. In this work,
the development of a multiresidue method for both types of pesticides using the same
SPE system was afforded. Therefore, taking into account that lyophilised samples gave
Almudena Columé Díaz Tesis Doctoral
stability of the OCPs during the lyophilisation process was initially studied using melon
as model fruit. For this purpose, 100 g of fresh melon, free from OCPs, was chopped
and spiked with 20 ng/g of each of the OCPs studied, and then divided in two fractions.
One of them was extracted following a standard method [7], which used sequential
extraction with acetone and n-hexane. The n-hexane extract was further evaporated,
redissolved and extracted again; finally, Florisil cartridges were used for clean up
purposes, and the extract was evaporated and redissolved in n-hexane prior to its

7/18/2019 Automatizacion y Miniaturizacion de Sistemas de Screening y Determinacion de Residuos de Plaguicidas en Muestra Agroalimentaria
http://slidepdf.com/reader/full/automatizacion-y-miniaturizacion-de-sistemas-de-screening-y-determinacion-de 194/393
injection into the GC-ECD instrument. The other fraction of 50 g of sample was
lyophilised at 6 Pa, for 8 h, and then directly extracted with n-hexane following the
procedure described above for the fresh fraction. This operation was repeated four
times. Based on the results obtained, it was concluded that no losses of OCPs occurred
during lyophilisation process. In addition, chromatograms for lyophilised melon were
cleaner than those for fresh melon. Therefore, all samples were lyophilised for further
experiments.
The study of the extractant and sorbent was carried out using a flow system
similar to that depicted in Figure 1. For this purpose, two working standard solutions
containing 10 ng/mL of each OCP and 20 ng/mL of each pyrethroid, plus 2 µg/mL of
the IS were prepared in n-hexane and petroleum ether. Two columns packed with 60
mg of RP-C18 and silica were separately inserted in to the flow system, with an eluent
of 250 µL of ethyl acetate in all instances. A volume of 5 mL of each working standard
Organoclorados y Piretroides en Hortalizas y Frutas Liofilizadas Capítulo III
elution, the following conclusions can be addressed: silica was a much better sorbent
than RP-C18 because all pesticides in both organic solvents were only retained onto RP-
C18 sorbent up to 20% while pyrethroids were quantitatively retained (100%) onto the
silica column and for OCPs retention efficiency varied from 40% (e.g. lindane,
dicloran) to 90% (e.g. captan, endosulfan sulphate). On the other hand, n-hexane and
petroleum ether behave equally as solvents for standards preparation. To select the most
efficient extractant for real samples, two fractions of 0.5 g of lyophilised melon were

7/18/2019 Automatizacion y Miniaturizacion de Sistemas de Screening y Determinacion de Residuos de Plaguicidas en Muestra Agroalimentaria
http://slidepdf.com/reader/full/automatizacion-y-miniaturizacion-de-sistemas-de-screening-y-determinacion-de 195/393
spiked with 150 ng and 300 ng of each OCP and pyrethroid respectively, extracted with
15 mL of n-hexane or petroleum ether and then passed through the flow system with the
silica column; n-hexane showed slightly better extraction properties than petroleum
ether because it provided cleaner chromatograms. So, n-hexane as extractant and silica
as sorbent were finally selected.
The following experiments were carried out by aspirating into the SPE system a
volume of 5 mL of a working standard solution containing 10 ng/mL of each OCP, 20
ng/mL of each pyrethroid and 2 µg/mL of IS. The amount of silica material was
optimised into the range 25-100 mg, with the optimum being 50 mg. The influence of
the flow rate was studied for the sample and the eluent (using an air stream as carrier),
over the range 0.1-5.0 mL/min. Pyrethroids were more affected than OCPs for both
variables; sample and eluent flow rates of 2 and 1 mL/min, respectively were selected.
The volume of the eluent (ethyl acetate) was examined by changing the loop of IV 2
Almudena Columé Díaz Tesis Doctoral
As has been stated above, pyrethroids were quantitatively retained onto silica
whereas retention for OCPs was not complete. So, after the SPE system was optimised,
the sorbent capacity of the silica column for OCPs was evaluated. For this purpose, a
standard solution containing 10 ng/mL of each OCP and 2 µg/mL of IS in n-hexane was
prepared; an aliquot of 5 mL was passed through the SPE system and collected at the
end of the column (this eluate fraction corresponds to unretained OCPs). The standard
solution (5 mL) (100% adsorption) and the collected eluate fraction were evaporated

7/18/2019 Automatizacion y Miniaturizacion de Sistemas de Screening y Determinacion de Residuos de Plaguicidas en Muestra Agroalimentaria
http://slidepdf.com/reader/full/automatizacion-y-miniaturizacion-de-sistemas-de-screening-y-determinacion-de 196/393
near dryness and reconstructed with 200 µL of n-hexane (for preconcentration
purposes). A 1 µL aliquot of each extract was injected into the GC-ECD. The
chromatograms obtained (the process was repeated four times) were compared. The
highest retention (80-90%) was obtained for procymidone, β-endosulfan, dichlofuanid,
captan and endosulfan sulphate, and the lowest retention (40-50%) corresponded to
lindane, α-endosulfan and dicloran (vinclozolin excepted ∼65%). Finally, piperonyl
butoxide was selected as an internal standard among other compounds as it was
quantitatively retained on the silica column and eluted with ethyl acetate; it was added
directly to the standards or samples at a concentration of 2 µg/mL, thus acting as a
procedural internal standard.
The breakthrough volume, defined as the sample volume above which the
analyte starts to elute from the column bottom (it depends on the strength with which
the analytes are retained by each sorbent, on the amount of sorbent and on packing
Organoclorados y Piretroides en Hortalizas y Frutas Liofilizadas Capítulo III
know the maximum sample volume that can be used and hence the maximum
preconcentration factor that can be achieved. For this purpose, different volumes of n-
hexane containing always the same amount of analytes (50 ng of each OCP, 100 ng of
each pyrethroid and 10 µg of IS) were aspirated into the flow system. The results
showed that 20 mL was the breakthrough volume, being the pesticides with minor
affinity by the sorbent (viz. lindane, α-endosulfan and dicloran) the most affected at
higher volumes. Based on these results, and taking into account the high sensitivity of

7/18/2019 Automatizacion y Miniaturizacion de Sistemas de Screening y Determinacion de Residuos de Plaguicidas en Muestra Agroalimentaria
http://slidepdf.com/reader/full/automatizacion-y-miniaturizacion-de-sistemas-de-screening-y-determinacion-de 197/393
the method, the volume of extractant required to achieve the MRLs established was 5
mL, with it being possible to increase it up to 20 mL if required.
3.2. Features of the proposed automated method
All pesticides studied exhibited good gas chromatographic properties.
Analytical curves for standards of pesticides were obtained by using a sample volume
of 5 mL of n-hexane containing variable concentrations (0.2-200 ng/mL) and the SPE
system depicted in Figure 1. In the case of mixture of isomers, permethrin (2 isomers),
fenvalerate (2 isomers), β-cyfluthrin (2 isomers), cyfluthrin (4 isomers) and
cypermethrin (4 isomers), the global analytical signal was obtained by summing the
peak areas of all isomers. The curves were constructed by plotting the analyte-to-IS
peak area ratio against the analyte concentration. The detection limit, linear range,
correlation coefficient (r 2), precision (as RSD) and m/z values for GC-MS confirmation
Almudena Columé Díaz Tesis Doctoral
Table 1. Analytical figures of merit of the proposed method for determination of 19 pesticides.
Compound LOD (ng/mL) Linear range (ng/mL) r 2 RSD (%) m/za
Dicloran 0.1 0.2-20 0.998 4.5 124, 176, 206
Lindane 2.0 5-200 0.999 5.3 111, 181, 219
Vinclozolin 0.1 0.2-20 0.998 3.0 187, 212, 285
Dichlofuanid 0.05 0.2-20 0.992 4.0 123, 224, 332
Captan 2.0 8-200 0.998 6.5 79, 264, 299
Procymidone 0.1 0.2-20 0.998 5.2 67, 96, 283
α-Endosulfan 0.1 0.2-20 0.996 5.4 195, 241, 339
β-Endosulfan 0.05 0.2-20 0.998 3.8 195, 241, 339
Endosulfan sulphate 0.5 1-200 0.996 4.7 272, 387, 420

7/18/2019 Automatizacion y Miniaturizacion de Sistemas de Screening y Determinacion de Residuos de Plaguicidas en Muestra Agroalimentaria
http://slidepdf.com/reader/full/automatizacion-y-miniaturizacion-de-sistemas-de-screening-y-determinacion-de 198/393
Bifenthrin 0.1 1-200 0.998 6.0 152, 165, 181
Fenpropathrin 0.1 1-200 0.998 5.0 97, 181, 349
λ-Cyhalothrin 0.1 1-200 0.996 3.5 141, 181, 209
Permethrin 0.8 2-200 0.996 5.8 163, 183, 390
Cyfluthrin 0.4 1-200 0.994 5.0 77, 163, 227
β-Cyfluthrin 0.2 1-200 0.998 4.7 77, 163, 227
Cypermethrin 0.4 1-200 0.996 3.6 77, 181, 209
α-Cypermethrin 0.1 1-200 0.998 3.3 77, 181, 209
Fenvalerate 0.2 1-200 0.996 6.1 169, 181, 419
Deltamethrin 0.2 1-200 0.994 5.8 181, 209, 253
am/z values used for confirmation: in italics, M+ ions and in bold face, base peak.
providing a chromatographic signal 3 times higher than background noise. The lowest
detection limits were for dichlofuanid and β-endosulfan (0.05 ng/mL), and for the other
pesticides, it ranged from 0.1 to 0.8 ng/mL (lindane and captan excepted, which has
limits of 2.0 ng/mL). For 1 g of lyophilised sample, the detection limits ranged from 0.5
to 8 ng. The sensitivity of the method (as slope of the calibration graph) was adequate
Organoclorados y Piretroides en Hortalizas y Frutas Liofilizadas Capítulo III
European Union. Finally, the precision of the method, expressed as relative standard
deviation, was checked on 10 samples containing 9 ng/mL of each pyrethroid, and
lindane, captan and α-endosulfan, 3.0 ng/mL of each OCP and 2 µg/mL of IS, and was
acceptable for all analytes, ranging from 3.0 to 6.5%.
3.3. Recovery test
To validate the proposed method and taking into account that there is no
i t f t i l t i i b th t f ti id i f it t i
7/18/2019 Automatizacion y Miniaturizacion de Sistemas de Screening y Determinacion de Residuos de Plaguicidas en Muestra Agroalimentaria
http://slidepdf.com/reader/full/automatizacion-y-miniaturizacion-de-sistemas-de-screening-y-determinacion-de 199/393
appropriate reference material containing both types of pesticides in fruit matrixes, a
recovery test was carried out. Prior to this study, it was necessary to optimise the
volume of n-hexane (extractant) and the extraction time. For this purpose, various
samples of 1 g of lyophilised melon were fortified with variable amount of pesticides,
and then extracted, by mechanical shaking, with 10, 15, 20, 25 and 30 mL of n-hexane
(at least 3 mL of solvent was required to soak the dry material) for different times (from
5 to 20 min). The short time elapsed between spiking of the lyophilised fruit with the
pesticides and its analysis, minimised analyte-matrix interactions, so the recoveries of
pesticides were quantitative. The experiments were carried out by aspirating 5 mL of
each extract into the SPE system, always containing the same amount of analytes (12 ng
of dicloran, vinclozolin, dichlofuanid, procymidone, β-endosulfan and endosulfan
sulphate; 36 ng of α-endosulfan; 60 ng of lindane, captan and each pyrethroid and 10
µg of IS). Aliquots of 1 µL were injected into the GC-ECD instrument. From this
Almudena Columé Díaz Tesis Doctoral
time than by the volume of extractant. Complete extraction was accomplished above 10
min and a volume of 10 mL of extractant selected, taking into account the additional
preconcentration provided by the lower volume.
Recoveries of analytes were studied in eight uncontaminated fruits (viz. apple,
peach, pear, strawberry, kiwi, melon, cherry and orange). For each sample, the spiked
pesticides were selected according to their use and occurrence/appearance [19,22,23].
About 10 g of each fresh fruit were pulped and then fortified at three levels of
concentration namely: 6 12 and 24 ng/g of dicloran vinclozolin dichlofuanid
7/18/2019 Automatizacion y Miniaturizacion de Sistemas de Screening y Determinacion de Residuos de Plaguicidas en Muestra Agroalimentaria
http://slidepdf.com/reader/full/automatizacion-y-miniaturizacion-de-sistemas-de-screening-y-determinacion-de 200/393
concentration, namely: 6, 12 and 24 ng/g of dicloran, vinclozolin, dichlofuanid,
procymidone, β-endosulfan and endosulfan sulphate; 18, 36 and 72 of α-endosulfan;
and 30, 60 and 100 ng/g of lindane, captan and pyrethroids from standard solutions in
acetone (1 mL of acetone containing from 60 ng to 1 µg of pesticides). After the
addition, the mixture was slightly shaken and left stand for air-drying (~2 h), and then
lyophilised. Each sample was spiked three times at each of the levels indicated above
(n=3). The pesticides were assumed to be uniformly distributed in the 10 g of fresh
fruit, so, any analyte-matrix interactions were assumed to have occurred over the
weathering period (~2 h). The levels of residues of pesticides were quantified by
comparison with standard solutions in n-hexane, which were passed through the SPE
unit, under identical conditions. Figure 2 shows the variation of the recoveries of
pesticides with increased spiked amount in fruits (exemplified for peach). In all fruits
assayed, the initial contaminant concentration was found to influence the desorption
Organoclorados y Piretroides en Hortalizas y Frutas Liofilizadas Capítulo III
0
20
40
60
80
100
120
ra n
ol i n
do n e lf a
nlfa n
ha t e
hr i n
hr i n
hr i n
hr i n
hr i n
hr i n
R e c o v e r y ( % )
Low level Medium level High level
0
20
40
60
80
100
120
ra n
ol i n
do n e lf a
nlfa n
ha t e
hr i n
hr i n
hr i n
hr i n
hr i n
hr i n
R e c o v e r y ( % )
Low level Medium level High level

7/18/2019 Automatizacion y Miniaturizacion de Sistemas de Screening y Determinacion de Residuos de Plaguicidas en Muestra Agroalimentaria
http://slidepdf.com/reader/full/automatizacion-y-miniaturizacion-de-sistemas-de-screening-y-determinacion-de 201/393
for OCPs but lower for pyrethroids, above all for bifenthrin, probably due to their
higher interaction with the sample matrix.
Table 2 gives the average recovery values obtained for each pesticide at the
three concentrations spiked from three replicates (n=9), for the fruits assayed. In all
instances, the lowest recoveries were obtained for bifenthrin (average 70 ± 3%)
followed by deltamethrin, α-endosulfan and captan (average ~85%) as the likely result
D i c l o r a
V i n c l o
z o l
P r o c y m
i d o
a l f a
- E n d
o s u l f
b e t a
- E n d
o s u l f a
E n d o
s u l f a
n s u l p h a
B i f e n t h r
P e r m
e t h r
C y f l u
t h r
b e t a
- C y f l u
t h r
C y p e r m
e t h r
a l f a - C y
p e r m
e t h r
D i c l o r a
V i n c l o
z o l
P r o c y m
i d o
a l f a
- E n d
o s u l f
b e t a
- E n d
o s u l f a
E n d o
s u l f a
n s u l p h a
B i f e n t h r
P e r m
e t h r
C y f l u
t h r
b e t a
- C y f l u
t h r
C y p e r m
e t h r
a l f a - C y
p e r m
e t h r
Figure 2. Recovery of pesticides added to a peach sample at three concentrations. Low,medium and high levels correspond to pesticide concentration spiked at levels of 6-30, 12-60and 24-100 ng per g of fresh fruit. For more details, see text.
Almudena Columé Díaz Tesis Doctoral
cifluthrin, permethrin and fenvalerate) and 95% (viz. cypermethrin, dichlofuanid,
lindane, endosulfan sulphate, procymidone, λ-cyhalothrin and dichloran). Melon and
pear are the fruits for which the recoveries are closest to the average values for each
pesticide, and thus can be used as model fruits. On the other hand, the are no significant
differences between the average recoveries for all pesticides in each fruit, ranging from
92% (viz. peach, kiwi, cherry and orange) to 94% for strawberry (bifenthrin excepted in
these average results).
The efficiency of pesticides extraction from lyophilised fruits and the sorbent
7/18/2019 Automatizacion y Miniaturizacion de Sistemas de Screening y Determinacion de Residuos de Plaguicidas en Muestra Agroalimentaria
http://slidepdf.com/reader/full/automatizacion-y-miniaturizacion-de-sistemas-de-screening-y-determinacion-de 202/393
The efficiency of pesticides extraction from lyophilised fruits and the sorbent
clean-up system, together with the high selectivity of the proposed method, are revealed
in the chromatograms of the different fruits assayed, where only a few peaks from the
matrixes are present. By way of example, Figure 3 shows the chromatograms for
unfortified fresh and lyophilised melon samples (blanks) and a lyophilised melon
sample fortified with all pesticides assayed at the following concentration: 12 ng/g of
dicloran, vinclozolin, dichlofuanid, procymidone, β-endosulfan and endosulfan
sulphate; 36 ng/g of α-endosulfan; and 40 ng/g of lindane, captan and pyrethroids. As
was mentioned before, the chromatogram for the lyophilised melon sample was cleaner
than that for the fresh one. Indeed, the fresh melon fortified with all pesticides provided
complex chromatograms, hindering the identification of some of the analytes.
Table 2. Average recoveries of pesticides added at three variable concentrations to fruit samples. For experimental details, see text.
Compound Apple Peach Pear Strawberry Kiwi Melon Cherry Orange
Dicloran 97 ± 4 98 ± 3 92 ± 4 97 ± 1 98 ± 1 99 ± 4 95 ± 2
Lindane 96 ± 7 89 ± 5 100 ± 3 94 ± 6 95 ± 7
Vinclozolin 95 ± 9 92 ± 8 94 ± 9 93 ± 7 92 ± 6 93 ± 9 94 ± 7 91 ± 6
Dichlofluanid 97 ± 2 95 ± 5 91 ± 6 95 ± 7 95 ± 5 94 ± 6
Captan 85 ± 6 84 ± 6 86 ± 7 88 ± 5Procymidone 95 ± 2 95 ± 5 96 ± 2 97 ± 1 97 ± 3 94 ± 4

7/18/2019 Automatizacion y Miniaturizacion de Sistemas de Screening y Determinacion de Residuos de Plaguicidas en Muestra Agroalimentaria
http://slidepdf.com/reader/full/automatizacion-y-miniaturizacion-de-sistemas-de-screening-y-determinacion-de 203/393
Procymidone 95 ± 2 95 ± 5 96 ± 2 97 ± 1 97 ± 3 94 ± 4
α-Endosulfan 84 ± 7 87 ± 6 83 ± 8 84 ± 8 88 ± 7 85 ± 7
β-Endosulfan 92 ± 8 95 ± 5 93 ± 5 93 ± 7 94 ± 7 91 ± 5
Endosulfan sulphate 95 ± 1 97 ± 4 96 ± 2 96 ± 3 93 ± 1 95 ± 3Bifenthrin 66 ± 2 70 ± 3 76 ± 4 68 ± 1 70 ± 2 69 ± 1
Fenpropathrin 91 ± 4 92 ± 1 93 ± 9 92 ± 8
λ-Cyhalothrin 93 ± 8 98 ± 7 95 ± 7 97 ± 6 98 ± 8
Permethrin 88 ± 8 90 ± 7 91 ± 5
Cyfluthrin 88 ± 2 90 ± 2
β-Cyfluthrin 93 ± 7 92 ± 6
Cypermethrin 97 ± 2 85 ± 4 97 ± 1 98 ± 2 93 ± 5 97 ± 2
α-Cypermethrin 91 ± 6 92 ± 3 95 ± 8 95 ± 3Fenvalerate 92 ± 4 90 ± 5Deltamethrin 84 ± 6 80 ± 4 82 ± 5
Almudena Columé Díaz Tesis Doctoral
B )
2 m i nA )
IS
B )B )
2 m i nA )
IS
2 m i nA )
IS
2 min

7/18/2019 Automatizacion y Miniaturizacion de Sistemas de Screening y Determinacion de Residuos de Plaguicidas en Muestra Agroalimentaria
http://slidepdf.com/reader/full/automatizacion-y-miniaturizacion-de-sistemas-de-screening-y-determinacion-de 204/393
IS
IS1 2
3
4 56
7
89 1 0
1112
1 3 1 4 1 516
1 718
1920
2 12 2
23
24
25
T im e (m in )
C )
ISIS
IS1 2
3
4 56
7
89 1 0
1112
1 3 1 4 1 516
1 718
1920
2 12 2
23
24
25
T im e (m in )
C )
IS1 2
3
4 56
7
89 1 0
1112
1 3 1 4 1 516
1 718
1920
2 12 2
23
24
25
T im e (m in )
C )
Figure 3. Gas chromatograms for 10 g of unfortified fresh (A) and lyophilised (B) melonsample and the lyophilised sample fortified (C) with all pesticides assayed. Peaks: 1=dicloran;
2=lindane; 3=vinclozolin;, 4=dichlofuanid; 5=captan; 6=procymidone; 7=α-endosulfan; 8=β-endosulfan; 9=endosulfan sulphate; 10=bifenthrin; 11=fenpropathrin; 12=λ-cyhalothrin;13=permethrin cis; 14=permethrin trans; 15=cyfluthrin I; 16=cyfluthrin III; 17=cyfluthrin II;
Time (min)
Organoclorados y Piretroides en Hortalizas y Frutas Liofilizadas Capítulo III
3.4. Analysis of fruits
Different kinds of fruits, including those listed above, were purchased at
various local markets and about 100 samples were analysed in quintuplicate (n=5).
Sampling was done as described in Fruit materials and Sample preparation Sections,
and laboratory samples were lyophilised as soon as received. Initially, 0.1 g of each
lyophilised fruit was accurately weighed and analysed by the proposed method; when
negative results were obtained, the sample amount was increased to 1 g. In all instances,
quantitation was done by ECD and positive findings were confirmed by MS, using 2 g

7/18/2019 Automatizacion y Miniaturizacion de Sistemas de Screening y Determinacion de Residuos de Plaguicidas en Muestra Agroalimentaria
http://slidepdf.com/reader/full/automatizacion-y-miniaturizacion-de-sistemas-de-screening-y-determinacion-de 205/393
of lyophilised sample with 20 mL of n-hexane and passing 15 mL of extract through the
SPE system, as the sensitivity was ~10 times lower than with ECD. Only 10 samples
were found to contain chlorinated or pyrethroid residues at detectable levels. The results
thus obtained, for 0.1 g of lyophilised sample, are listed in Table 3.
Table 3. Pesticides found in the 100 checked fruit samples (SD, n=5).
Sample Water (%) Pesticide found Concentration a (ng/g) MRLa,b (ng/g)
Apple 85 Procymidone 400 ± 35
c
Peach 80 Vinclozolin 23 ± 4 2000
Pear 80 Procymidone 136 ± 9 1000
Strawberry 90 Procymidone 109 ± 8 5000
Kiwi 85 Vinclozolin 2600 ± 365 10000
Melon 85 Deltamethrin 28 ± 7 50
Cherry 70 λ-Cyhalothrin 38 ± 4 100
Strawberry 90 λ-Cyhalothrin 14 ± 4 20
Kiwi 85 Fenvalerate 34 ± 7 500Orange 80 Captan 530 ± 25 3000
Almudena Columé Díaz Tesis Doctoral
10 0
19 7
18 1B )
A )
1
10 0
19 7
18 1B )
A )
1
CHERRY
2 min
IS
1

7/18/2019 Automatizacion y Miniaturizacion de Sistemas de Screening y Determinacion de Residuos de Plaguicidas en Muestra Agroalimentaria
http://slidepdf.com/reader/full/automatizacion-y-miniaturizacion-de-sistemas-de-screening-y-determinacion-de 206/393
50 70 9 0 11 0 1 30 1 50 17 0 1 90 2 10 23 0 2500
10 0
%
51
65
77
7889 11 5
13 9
14 1
14 2
16 9
18 2
18 3
22 5
19 7
20 9
18 1
0
%
51
65
77
89 11 513 9
14 1
14 2
16 9 18 2
22 5
19 720 9
57
91 16 1
50 70 9 0 11 0 1 30 1 50 17 0 1 90 2 10 23 0 2500
10 0
%
51
65
77
7889 11 5
13 9
14 1
14 2
16 9
18 2
18 3
22 5
19 7
20 9
18 1
0
%
51
65
77
89 11 513 9
14 1
14 2
16 9 18 2
22 5
19 720 9
57
91 16 1
λ
m/z
NIST: LAMBDA-CYHALOTHRIN
Organoclorados y Piretroides en Hortalizas y Frutas Liofilizadas Capítulo III
As can be seen, the concentrations found were lower than the EU maximum
residue limits (see Table 3) for all compounds examined. Figure 4A shows the
chromatogram for the cherry sample containing only λ-cyhalothrin, obtained with
electron capture detection. Figure 4B illustrates the identification of this pyrethroid by
comparing the mass spectrum for the corresponding peak with that in the library.
Spectral comparison resulted in coincidence of ∼85%.
ACKNOWLEDGMENTS

7/18/2019 Automatizacion y Miniaturizacion de Sistemas de Screening y Determinacion de Residuos de Plaguicidas en Muestra Agroalimentaria
http://slidepdf.com/reader/full/automatizacion-y-miniaturizacion-de-sistemas-de-screening-y-determinacion-de 207/393
This work was supported by a grant PB-95-0977 from Spain’s DGICyT.
Almudena Columé Díaz Tesis Doctoral
REFERENCES
[1] Community Directive 93/58/EEC . Off. J. Eur. Commun., L 211/6, European
Community, Brussels, 1993.
[2] Z. M. Chen,Y. H. Wang, J. Chromatogr. A 754 (1996) 367.
[3] C. Nerin, A. R. Tornés, C. Domeño, J. Cacho, J. Fresenius J. Anal. Chem. 352
(1995) 364.
[4] R. Doong, C. Lee, Analyst 124 (1999) 1287.
[5] A. Gelsomino, B. Petrovicova, S. Tiburtini, E. Magnani, M. Felici, J.
7/18/2019 Automatizacion y Miniaturizacion de Sistemas de Screening y Determinacion de Residuos de Plaguicidas en Muestra Agroalimentaria
http://slidepdf.com/reader/full/automatizacion-y-miniaturizacion-de-sistemas-de-screening-y-determinacion-de 208/393
Chromatogr. A 782 (1997) 105.
[6] H. S. Dorea, F .M. Lancas, J. Microcolumn. Sep. 11 (1999) 367.
[7] G. F. Pang, Y. Z. Cao, C. L. Fan, J. J. Zhang, X. M. Li, J. AOAC Int . 82 (1999)
186.
[8] C. Trova, Ind. Aliment . 38 (1999) 8.
[9] S. M. Lee, M. L. Papathakis, H. C. Feng, G. F. Hunter, J. E. Carr, Fresenius J.
Anal. Chem. 339 (1991) 376.
[10] J. Fillion, R. Hindle, M. Lacroix, J. Selwing, J. AOAC Int. 78 (1995) 1252.
[11] A. R. Fernández-Alba, A. Valverde, A. Agüera, M. Contreras, J. Chromatogr.
A 686 (1994) 263.
[12] T. Pihlström, B. G. Österdahl, J. Agric. Food Chem. 47 (1999) 2549.
[13] P. Cabras, A. Angioni, V. L. Garau, F.M. Pirisi, V. Brandolini, F. Cabitza, M.
C b dd d h 46 (1998) 3 2
Organoclorados y Piretroides en Hortalizas y Frutas Liofilizadas Capítulo III
[15] E. Lacassie, M. F. Dreyfuss, J. L. Daguet, M. Vignaud, P. Marquet, G.
Lachatre, J. Chromatogr. A 805 (1998) 319.
[16] S. Navickiene, L. Polese, E. V. Minelli, M. L. Ribeiro, Chromatographia 49
(1999) 212.
[17] A. Stensvand, A. Christiansen, J. Agric. Food Chem. 48 (2000) 917.
[18] A. Columé, S. Cárdenas, M. Gallego, M. Valcárcel, J. Chromatogr. A 912
(2001) 83.
[19] R. Coscolla, Residuos de Plaguicidas en Alimentos Vegetales, Mundi-Prensa;
7/18/2019 Automatizacion y Miniaturizacion de Sistemas de Screening y Determinacion de Residuos de Plaguicidas en Muestra Agroalimentaria
http://slidepdf.com/reader/full/automatizacion-y-miniaturizacion-de-sistemas-de-screening-y-determinacion-de 209/393
Madrid, Spain, 1993.
[20] Community Directive 79/700/EEC . Off. J. Eur. Commun., European
Community, Brussels, 1979.
[21] A. Columé, S. Cárdenas, M. Gallego, M. Valcárcel, J. Chromatogr. A 882
(2000) 193.
[22] C. Tomlin (Editor), The Pesticide Manual, 10th edn.; Crop Protection
Publication, Cambridge, U. K., 1994.
[23] C. de Liñán Vicente (Editor), Vademécum de Productos Fitosanitarios y
Nutricionales, 14th edn.; Ediciones Agrotécnicas S. L., Madrid (Spain), 1999.

7/18/2019 Automatizacion y Miniaturizacion de Sistemas de Screening y Determinacion de Residuos de Plaguicidas en Muestra Agroalimentaria
http://slidepdf.com/reader/full/automatizacion-y-miniaturizacion-de-sistemas-de-screening-y-determinacion-de 210/393
Organoclorados y Piretroides en Hortalizas y Frutas Liofilizadas Capítulo III
Semiautomatic multiresidue gas chromatographic method forthe screening of vegetables for 25 organochlorine and
pyrethroid pesticides
A. Columé, S. Cárdenas, M. Gallego, M. Valcárcel Analytical Chemistry Division, Campus de Rabanales, University of Córdoba, E-14071 Córdoba, Spain
Received 20 October 2000; received in revised form 15 January 2001; accepted 19 February 2001
Analytica Chimica Acta 436 (2001) 153-162ELSEVIER
ANALYTICA
CHIMICAACTA

7/18/2019 Automatizacion y Miniaturizacion de Sistemas de Screening y Determinacion de Residuos de Plaguicidas en Muestra Agroalimentaria
http://slidepdf.com/reader/full/automatizacion-y-miniaturizacion-de-sistemas-de-screening-y-determinacion-de 211/393
Abstract
A method for multiresidue screening of lyophilised vegetables for up to 25 pesticides
(16 pyrethroids and 9 OCPs) permitted in the European Union was systematically developed on
the basis of solid-phase extraction and gas chromatography with electron capture detection. The
residues of pesticides were extracted from the lyophilised sample with n-hexane by mechanical
shaking; the organic phase containing the pesticides was aspirated into a continuous module
which comprises a laboratory-made silica column for analyte preconcentration and sample
matrix clean-up. The method provides excellent clean-up despite the complexity of the matrices
involved thanks to the lyophilisation process which also helps to sample preservation without
losses of the selected relatively non volatile analytes. Detection limits were about 1-10 ng/g,
except for lindane and captan (30 ng/g) thus allowing their determination at concentrations
lower than their maximum residue limits with good precision (∼5%). The accuracy of the
quantitative determination measured in terms of average percentage recovery of the 25compounds in 8 different vegetables was 93±3, bifenthrin and deltamethrin excepted. The
Almudena Columé Díaz Tesis Doctoral
1. INTRODUCTION
Vegetables are essential constituents of the human diet. In order to satisfy their
demand, an increase in the world production of vegetables is required, where the use of
pesticides plays a necessary and essential role [1]. This practice constitutes an important
aspect of modern agriculture as they help to control pests and plant diseases. In this
concern, monitoring residues of pesticides in vegetables is nowadays a priority
objective in pesticide research in order to get an extensive evaluation of vegetable
quality to avoid possible risks to human health. Analytical methodologies developed for

7/18/2019 Automatizacion y Miniaturizacion de Sistemas de Screening y Determinacion de Residuos de Plaguicidas en Muestra Agroalimentaria
http://slidepdf.com/reader/full/automatizacion-y-miniaturizacion-de-sistemas-de-screening-y-determinacion-de 212/393
detecting these residues in horticultural samples, offered options to government
regulators on how to improve their analytical capabilities according to the toxicity of a
specific pesticide in the dietary intake. The frequent decrease in the maximum residue
limits (MRLs) imposed by international organisations (European Union, Environmental
Protection Agency) implies a dramatic improvement of the limits of detection provided
by currently available multiresidue methods [2].
Pyrethroids and organochlorine pesticides (OCPs) are nonsystemic as they
cannot penetrate into the plant. After treatment, they form a deposit on the surface of
the leaf; their potential absorption depends on the formulation, lipophilicity and
concentration of the active ingredients and therefore, the extraction of these pesticides
is rather simple compared to the systemic organophosphorous and carbamate pesticides
[3]. Many laboratories implement multiresidue screening methods using solvent
i f h i id f f h bl f ll d b h h i h
Organoclorados y Piretroides en Hortalizas y Frutas Liofilizadas Capítulo III
are commonly used for pesticide residues extraction, followed by filtration, evaporation
to near-dryness and redissolution in few microliters of organic solvent [4-9]. Usually,
additional clean-up steps such as solvent partitioning [10,11] and/or solid-phase
extraction [12-18], are necessary prior to injection into the gas chromatograph to
remove co-extractives that could interfered with the analytes during chromatographic
separation. The most popular sorbent is Florisil [12-15], although silica gel [16], celite-
charcoal [17] and polystyrene-divinylbenzene [18], have also been proposed. Pesticides
are further eluted with few microliters of organic solvents. Undoubtedly,
i h l d li i f d i b i i l

7/18/2019 Automatizacion y Miniaturizacion de Sistemas de Screening y Determinacion de Residuos de Plaguicidas en Muestra Agroalimentaria
http://slidepdf.com/reader/full/automatizacion-y-miniaturizacion-de-sistemas-de-screening-y-determinacion-de 213/393
preconcentration helps to reduce limits of detection, but time-consuming clean-up
procedures have to be introduced to avoid contamination of the gas chromatographic
system, thus losing resolution, with matrix components, thereby increasing the cost of
the analysis.
This paper describes an elegant alternative to other existing procedures, which
is an improved version of a previous method to determine OCPs [19], suitable for the
simultaneous determination of up to 25 residues of pesticides in vegetable samples
without modifications of the procedure based on the sample matrix. The proposed
method implements a sample lyophilisation step prior to automatic extraction with a
single solvent and preconcentration/clean-up on a miniaturised silica column. The
results obtained in positive samples were compared with those of a standard method
[13] and good correlation was achieved in all instances. The limits of detection were
l h h i h b id d h f ll h
Almudena Columé Díaz Tesis Doctoral
2. EXPERIMENTAL
2.1. Chemicals and standards
All pesticides were purchased from Riedel-de-Haën (Seelze, Germany):
dicloran, lindane, vinclozolin, dichlofuanid, captan, procymidone, α- and β-endosulfan
(3:1), endosulfan sulphate, bifenthrin, λ-cyhalothrin, deltamethrin, fenpropathrin,
fenvalerate (cis and trans isomers), permethrin (cis and trans isomers), cyfluthrin (4
isomers), β-cyfluthrin (2 isomers), cypermethrin (4 isomers), α-cypermethrin and
piperonyl butoxide (internal standard, IS). The silica sorbent was obtained from Varian

7/18/2019 Automatizacion y Miniaturizacion de Sistemas de Screening y Determinacion de Residuos de Plaguicidas en Muestra Agroalimentaria
http://slidepdf.com/reader/full/automatizacion-y-miniaturizacion-de-sistemas-de-screening-y-determinacion-de 214/393
(Zug, Switzerland). All other reagents and solvents were purchased from Merck
(Darmstadt, Germany).
Individual stock standard solutions were prepared in n-hexane at concentrations of
5 mg/mL, and stored in glass stoppered bottles in the dark at 4°C. Individual and
cumulative working standard solutions were obtained by appropriate dilution of the
stocks in n-hexane or acetone.
2.2. Instrumentation
A Hewlett-Packard 5890 A equipped with a 63 Ni electron-capture detector and a
fused silica capillary column (30 m x 0.25 mm i.d.) coated with 5% phenyl-
methylpolysiloxane (0.25 µm film thickness), (Supelco, Madrid, Spain), connected to a
Hewlett-Packard 3392 A integrator was used for pesticides separation. General
Organoclorados y Piretroides en Hortalizas y Frutas Liofilizadas Capítulo III
temperature, 325°C; carrier gas (N2) flow, 1 mL/min; column temperature program,
initially 150°C for 2 min, increase at 8ºC/min to 170°C, hold for 4 min, then increase at
8ºC/min to 255°C, hold for 15 min, and increase at 5ºC/min to 285ºC, hold for 6 min;
split injection, 1:25 ratio; injection volume, 1 µL. Confirmatory analysed were carried
out on a Fisons 8000 GC instrument interfaced to a Fisons MD800 mass spectrometer
and controlled by a computer running MASSLAB software (Thermo, Madrid, Spain). The
chromatographic column was an HP-5MS 30 m × 0.25 mm i.d., 0.25 µm film thickness,
and temperature program was the same as in GC-ECD, using helium as carrier gas (1

7/18/2019 Automatizacion y Miniaturizacion de Sistemas de Screening y Determinacion de Residuos de Plaguicidas en Muestra Agroalimentaria
http://slidepdf.com/reader/full/automatizacion-y-miniaturizacion-de-sistemas-de-screening-y-determinacion-de 215/393
mL/min); split injection, 1:25 ratio; injection volume, 1 µL. MS conditions: ion source
temperature, 200°C; transfer line temperature, 300°C; ionisation mode, electron impact
at 70 eV; scan range, from m/z 70 to 500; data acquisition mode: full scan.
The continuous flow configuration consisted of a Gilson Minipuls-2 peristaltic
pump (Villiers-le-Bel, France) furnished with Solvaflex pumping tubes, two Rheodyne
5041 injection valves, PTFE tubing (0.5 mm i.d.) and commercially available
connectors. The sorbent glass column (2 cm x 4 mm i.d.) was hand-packed with 50 mg
of silica and sealed at both ends with small cotton beads to prevent material losses. A
glass column (3 cm x 5 mm i.d.), packed with cotton wool was used as filter. A
Hetosicc laboratory freeze-dryer, type CD-53-1 (Birkerod, Denmark) was also
employed.
Almudena Columé Díaz Tesis Doctoral
2.3. Preparation of vegetable samples
Vegetables were purchased at local markets in Córdoba and analysed unwashed, in
a raw state [1], according to the legislation established [20]. A raw global sample
consisting of ∼5 Kg of each vegetable was reduced by quartering to ∼500 g (laboratory
sample). In some cases (spinach, aubergine, cauliflower), the raw sample (5 Kg) was
cut into slices of ∼100 g and then reduced by quartering to ∼500 g. Laboratory samples
were pulped in a high-speed blender and fractions of ∼50 g lyophilised by freeze-
drying at 6 Pa for 8 h, after which they were conserved in glass containers, at -20ºC in
h d k il l i U d h di i h i f h i id
7/18/2019 Automatizacion y Miniaturizacion de Sistemas de Screening y Determinacion de Residuos de Plaguicidas en Muestra Agroalimentaria
http://slidepdf.com/reader/full/automatizacion-y-miniaturizacion-de-sistemas-de-screening-y-determinacion-de 216/393
the dark, until analysis. Under these conditions, the concentration of these pesticides
remained constant for at least six months. An accurately weighed amount of 0.1-1 g of
lyophilised vegetable was placed into a 50 mL amber glass bottle with 10 mL of n-
hexane and 0.1 mL of 200 µg/mL piperonyl butoxide (IS). Once stoppered, the mixture
was mechanically shaken for 10 min and allowed to settle. Then, 5 mL of the n-hexane
phase, containing the analytes and the IS, was continuously aspirated and filtered into
the solid-phase extraction (SPE) system of Figure 1. Blanks and standard calibration
graphs were run by using uncontaminated lyophilised sample (0.1-1 g).
2.4. Solid-phase extraction method
The continuous SPE system used to extract the pyrethroids and OCPs from
lyophilised vegetable samples is depicted in Figure 1. A volume of 5 mL of the n-
Organoclorados y Piretroides en Hortalizas y Frutas Liofilizadas Capítulo III
Sample
Filter
mL/min
Ethyl acetate
IV2
175 µµµµL
2
Air
Silica
IV1
1 W
GC
Sample
Filter
mL/min
Ethyl acetate
IV2
175 µµµµL
2
Air
Silica
IV1
1 W
GC
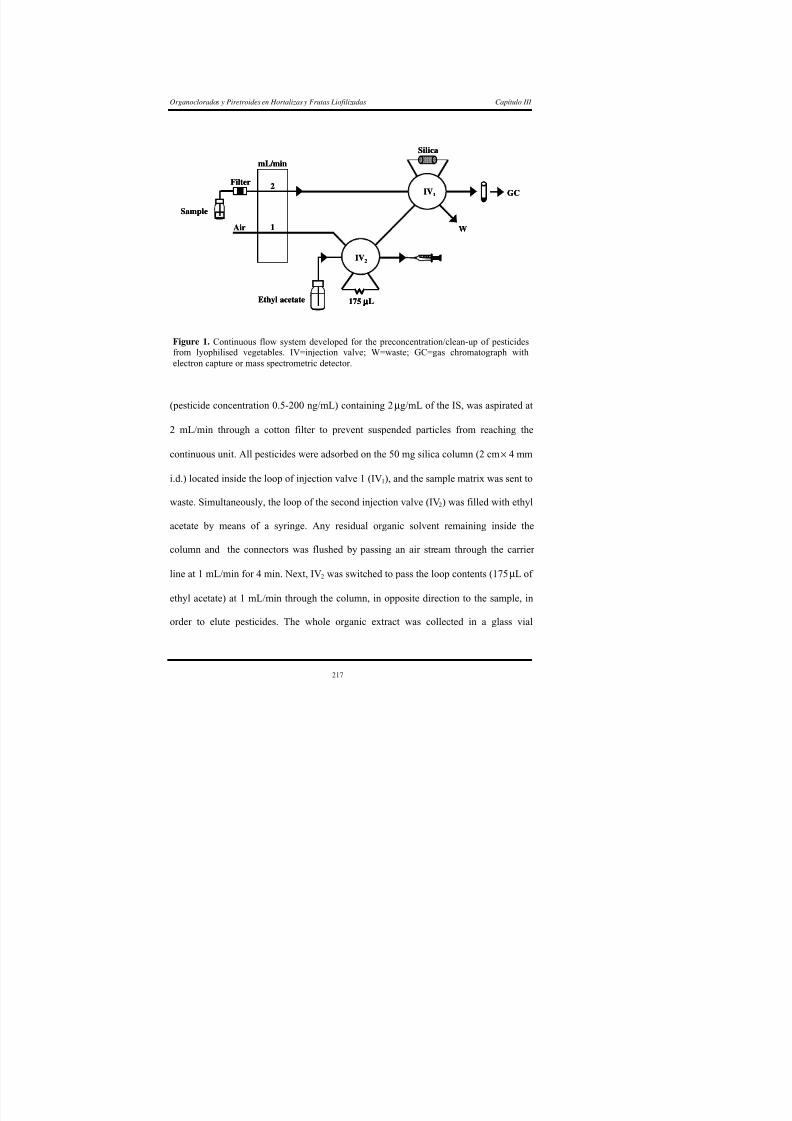
7/18/2019 Automatizacion y Miniaturizacion de Sistemas de Screening y Determinacion de Residuos de Plaguicidas en Muestra Agroalimentaria
http://slidepdf.com/reader/full/automatizacion-y-miniaturizacion-de-sistemas-de-screening-y-determinacion-de 217/393
(pesticide concentration 0.5-200 ng/mL) containing 2 µg/mL of the IS, was aspirated at
2 mL/min through a cotton filter to prevent suspended particles from reaching the
continuous unit. All pesticides were adsorbed on the 50 mg silica column (2 cm × 4 mm
i.d.) located inside the loop of injection valve 1 (IV1), and the sample matrix was sent to
waste. Simultaneously, the loop of the second injection valve (IV2) was filled with ethyl
acetate by means of a syringe. Any residual organic solvent remaining inside the
column and the connectors was flushed by passing an air stream through the carrier
line at 1 mL/min for 4 min. Next, IV2 was switched to pass the loop contents (175 µL of
ethyl acetate) at 1 mL/min through the column, in opposite direction to the sample, in
Figure 1. Continuous flow system developed for the preconcentration/clean-up of pesticidesfrom lyophilised vegetables. IV=injection valve; W=waste; GC=gas chromatograph withelectron capture or mass spectrometric detector.
Almudena Columé Díaz Tesis Doctoral
containing anhydrous sodium sulphate and 1 µL aliquot injected into the gas
chromatograph for analysis. Between samples, the sorbent column was cleaned, without
removal from the continuous SPE system, with 0.5 mL of isopropanol to remove
potentially retained interferents and then conditioned with 0.5 mL of acetonitrile and 1
mL of n-hexane. Under these conditions, the sorbent column was serviceable for about
three months.
3. RESULTS AND DISCUSSION
3.1. Optimisation of the SPE method

7/18/2019 Automatizacion y Miniaturizacion de Sistemas de Screening y Determinacion de Residuos de Plaguicidas en Muestra Agroalimentaria
http://slidepdf.com/reader/full/automatizacion-y-miniaturizacion-de-sistemas-de-screening-y-determinacion-de 218/393
3.1. Optimisation of the SPE method
The majority of the multiresidue methods described in the literature are based
on the extraction of the residues of pesticides from fresh samples. It is well-known that
lyophilisation is especially suitable for sample preservation. In the case of agricultural
commodities, the use of a freeze-drying process led to the solution of a variety of
problems related to the storage of these types of sample [21]. Recently, it has also been
demonstrated that lyophilised samples give better results than fresh ones for the
determination of pyrethroids in terms of simplicity of the analytical process, absence of
interfering peaks from the matrix in the chromatograms and recovery of the analytes
from the matrices assayed [22]. In the present work, different pyrethroids and OCPs
permitted by the European legislation were studied for the development of an
automated configuration that allowed the determination of such compounds in
Organoclorados y Piretroides en Hortalizas y Frutas Liofilizadas Capítulo III
Figure 1 was used, and lyophilised tomato was selected as model vegetable for the
optimisation of chemical and flow variables.
The first variable studied was the stability of OCPs during the lyophilisation
process. For this purpose, about 100 g of fresh tomato, free from residues of pesticides
was pulped and spiked with 20 ng/g of each of the OCPs studied, and then divided in
two fractions. One of them was processed following a standard method previously
described [13], which used sequential extraction with acetonitrile and n-hexane; after
filtration and evaporation, further clean-up on Florisil was carried out. The other
fraction was lyophilised at 6 Pa for 8 h, directly extracted with n-hexane and cleaned –
7/18/2019 Automatizacion y Miniaturizacion de Sistemas de Screening y Determinacion de Residuos de Plaguicidas en Muestra Agroalimentaria
http://slidepdf.com/reader/full/automatizacion-y-miniaturizacion-de-sistemas-de-screening-y-determinacion-de 219/393
up on Florisil as in the standard method. In this case, more polar analytes were not
extracted as well with n-hexane. This operation was repeated four times. The results
obtained by both procedures were quite consistent, and therefore, no losses of OCPs
occurred during lyophilisation process. Finally, similar experiments were carried out
with a lyophilised sample that was then fortified with all pesticides assayed, being the
results quite consistent with those previously obtained. In addition, chromatograms of
lyophilised tomato were cleaner than those of fresh one, so lyophilised vegetables were
used for further optimisation experiments.
Sample lyophilisation avoids the first extraction of the pesticides with a polar
solvent such as acetone or acetonitrile and therefore, a low polarity solvent such as n-
hexane can be used as sole extractant. Thus, lyophilised model vegetable was spikedi h h i id d h i l d d d l d h i h h i
Almudena Columé Díaz Tesis Doctoral
containing 10 ng/mL of OCPs, 20 ng/mL of pyrethroids and 2 µg/mL of IS were
continuously aspirated into the SPE system. The short time elapsed between spiking
and analysis, minimised analyte-matrix interactions, so extraction of pesticides from the
vegetable was quantitative. Taking into account the simplicity of the proposed method,
the only variables potentially affecting performance would be the sorbent, eluent,
sample and eluent flow-rates. In previous studies, it was established that RP-C18 was the
most suitable sorbent for the preconcentration of OCPs in aqueous medium [19]
whereas silica was preferred for the retention of pyrethroids extracted in n-hexane [22],
using the eluent ethyl acetate in both instances. The main objective of this work was the

7/18/2019 Automatizacion y Miniaturizacion de Sistemas de Screening y Determinacion de Residuos de Plaguicidas en Muestra Agroalimentaria
http://slidepdf.com/reader/full/automatizacion-y-miniaturizacion-de-sistemas-de-screening-y-determinacion-de 220/393
direct extraction of pesticides from vegetables with a non-polar solvent, and therefore
the applicability of silica for the preconcentration of OCPs and pyrethoids from
vegetables was assayed, using n-hexane as extractant and ethyl acetate as eluent. Each
experiment was carried out using 5 mL of the n-hexane extract and the whole eluate
was collected in glass vials, evaporated to dryness under a nitrogen stream and the
residue redissolved in 200 µL of ethyl acetate. Pyrethroids were quantitatively retained
on the sorbent column while for OCPs, retention varied between 40% (lindane and
dicloran) and 90% (captan and endosulfan sulphate). The lower retention of OCPs is
not an inconvenience to reach the MRLs established because of their higher sensitivity
in the ECD detector. Different organic solvents were assayed as eluents, namely: ethyl
acetate, acetonitrile, isopropanol and acetone. Ethyl acetate provided quantitative
Organoclorados y Piretroides en Hortalizas y Frutas Liofilizadas Capítulo III
The amount of sorbent material was optimised in the interval 15-100 mg. Peak areas
increased as increasing the amount of solid up to 40 mg, above which remained
virtually constant. A column packed with 50 mg of silica was selected as optimum. The
influence of the eluent volume was studied by changing the loop of IV2. Obviously, as
the eluent volume was increased, desorption was more efficient but also analytes were
more dilute. Because of these opposing effects, the only way to correctly determine the
most appropriate eluent volume was to dilute the extracts to a constant volume using
the same solvent (viz. 500 µL of ethyl acetate). Desorption efficiency increased with
increasing injected volume up to 175 µL, and remained constant over this value, so it

7/18/2019 Automatizacion y Miniaturizacion de Sistemas de Screening y Determinacion de Residuos de Plaguicidas en Muestra Agroalimentaria
http://slidepdf.com/reader/full/automatizacion-y-miniaturizacion-de-sistemas-de-screening-y-determinacion-de 221/393
was selected as optimum. A second injection with the same eluent volume revealed the
absence of carry-over; complete elution of analytes was thus obtained with a single
injection of ethyl acetate. Changes in the flow-rates of the sample and eluent (air stream
as carrier) between 0.5-3.0 mL/min resulted in small variation of the signals, which
were found to decrease at higher flow-rates, slightly for OCPs and more markedly for
pyrethroids. Therefore, a sample and eluent flow-rate of 2 and 1 mL/min, respectively
were selected.
Once the SPE system was optimised, the breakthrough volume was studied in
order to establish the maximum sample volume that can be introduced into the SPE
system and hence the maximum preconcentration factor that can be achieved. For this
purpose, different volumes of n-hexane containing always the same amount of analytes
Almudena Columé Díaz Tesis Doctoral
aspirated into the flow system and the retained analytes eluted with 175 µL of ethyl
acetate. From the results obtained it can be concluded that the pesticides having lower
affinity for the sorbent were more markedly affected at higher volumes, so a maximum
volume of 20 mL can be passed through the silica column. However, taking into
account the high sensitivity of the method, a volume of 5 mL of n-hexane was enough
to reach the MRLs established by international organisations for the selected pesticides.
Finally, two variables affecting extraction of residues of pesticides from
lyophilised vegetables, namely: the volume of n-hexane (extractant) and the extraction
time were studied. Thus, several samples of 1 g of lyophilised tomato were fortified

7/18/2019 Automatizacion y Miniaturizacion de Sistemas de Screening y Determinacion de Residuos de Plaguicidas en Muestra Agroalimentaria
http://slidepdf.com/reader/full/automatizacion-y-miniaturizacion-de-sistemas-de-screening-y-determinacion-de 222/393
with variable amount of pesticides and extracted, by mechanical shaking during
different times (from 5 to 20 min), with volumes of n-hexane from 10 to 30 mL, taking
into account that soaking the dry material required at least 3 mL of organic solvent.
Aliquots of 5 mL of n-hexane containing the same amount of pesticides were
continuously aspirated into the flow system. Satisfactory results were obtained for an
extraction time of 10 min, using 10 mL of n-hexane, being the extraction time the most
influential variable.
3.2. Calibration and statistical study
The performance and reliability of the proposed on-line method (Figure 1) were
assessed by determining the regression equation, linear range, analyte detectability and
Organoclorados y Piretroides en Hortalizas y Frutas Liofilizadas Capítulo III
Table 1. Limits of detection, linearity, precision and m/z identification values of the 25 pesticides.
Compound LOD (ng/g)a Linear range (ng/g)a RSD b (%) m/zc Dicloran 2 5-200 4.8 124, 176, 206
Lindane 30 100-2000 5.7 111, 181, 219
Vinclozolin 2 5-200 4.0 187, 212, 285
Dichlofuanid 1 5-200 5.1 123, 224, 332
Captan 30 100-2000 6.8 79, 264, 299
Procymidone 2 5-200 6.0 67, 96, 283
α-Endosulfan 2 5-200 5.8 195, 241, 339β-Endosulfan 1 5-200 4.9 195, 241, 339
Endosulfan sulphate 8 15-2000 5.1 272, 387, 420
Bifenthrin 1 5-2000 6.4 152, 165, 181
Fenpropathrin 1 5-2000 5.3 97, 181, 349

7/18/2019 Automatizacion y Miniaturizacion de Sistemas de Screening y Determinacion de Residuos de Plaguicidas en Muestra Agroalimentaria
http://slidepdf.com/reader/full/automatizacion-y-miniaturizacion-de-sistemas-de-screening-y-determinacion-de 223/393
p p , ,
λ-Cyhalothrin 1 5-2000 4.6 141, 181, 209
Permethrin 10 20-2000 6.5 163, 183, 390
Cyfluthrind 5 10-2000 4.9 77, 163, 227
β-Cyfluthrin 2 10-2000 5.3 77, 163, 227
Cypermethrind 5 10-2000 4.2 77, 181, 209
α-Cypermethrin 1 5-2000 4.0 77, 181, 209
Fenvalerate 2 10-2000 6.1 169, 181, 419
Deltamethrin 2 10-2000 5.0 181, 209, 253
a ng/g values for lyophilised samples. b n=11.c m/z values in italics are M+ ions; those in bold face correspond to the base peak.d Mixture of isomers.
areas of all isomers. For this purpose, microliters of standard solutions in acetone
containing all pesticides at variable concentrations were spiked to individual amounts of
1 g of lyophilised tomato, in the interval 5-2000 ng per g, and extracted as in Section
Almudena Columé Díaz Tesis Doctoral
detection (LOD) were calculated as the minimum concentration providing
chromatographic signals three times higher than the background noise. In all cases, theywere satisfactory, from 10 to 5000 times lower than the MRLs admitted in the European
Union for these commodities. Correlation coefficients ranged from 0.996 to 0.999. The
precision (reliability) was calculated as the relative standard deviation obtained by
measuring 11 samples containing the pesticides at concentrations within the lower
range of the calibration graphs and ranged from 4.0 to 6.8%.
3.3. Applications

7/18/2019 Automatizacion y Miniaturizacion de Sistemas de Screening y Determinacion de Residuos de Plaguicidas en Muestra Agroalimentaria
http://slidepdf.com/reader/full/automatizacion-y-miniaturizacion-de-sistemas-de-screening-y-determinacion-de 224/393
The proposed multiresidue method was applied to the screening of about one-
hundred vegetables purchased at various local markets. Initially, 0.1 g of eachlyophilised vegetable was analysed following the method described; when negative
results were obtained, the sample amount was increased up to 1 g to confirm the
absence of pesticide residues at detectable levels. Only ten samples were found to
contain residues of pesticides although the concentrations were lower than the MRLs
(cypermethrin in potato excepted). The results obtained are listed in Table 2. The
samples were also analysed following the standard method [13] and the results obtained
were concordant in all instances (Table 2). In addition, positive findings were
confirmed by GC-MS, using 2 g of lyophilised vegetable and 20 mL of n-hexane,
aspirating 15 mL of organic phase into the SPE system. Figure 2 shows the
h b i d f l h di hl f id d d (A) d
Table 2. Analytical results of pesticides found in the one-hundred fresh vegetable samples analysed (SD, n=5).
Sample Water (%) Pesticide foundConcentration (ng/g) a
Proposed methodConcentration (ng/g) a
Standard methodMRLa,b, (ng/g) MRLa,c (ng/g)
Potato 92 α-Endosulfan 31 ± 2 33 ± 5 50 200
Potato 92 Cypermethrin 280 ± 15 270 ± 20 50 50
Tomato 93 Dichlofluanid 14±
1 18±
3 5000 2000Tomato 93 Procymidone 529 ± 33 550 ± 80 2000 5000
Spinach 90 Cypermethrin 385 ± 20 390 ± 30 500 2000
Cucumber 92 Deltamethrin 48 ± 3 51 ± 6 100 200
Cucumber 92 Captan 85 ± 6 80 ± 8 100 n.a.d
Green pepper 91 Dicloran 6 ± 1 7 ± 1 n.a. d n.a.d

7/18/2019 Automatizacion y Miniaturizacion de Sistemas de Screening y Determinacion de Residuos de Plaguicidas en Muestra Agroalimentaria
http://slidepdf.com/reader/full/automatizacion-y-miniaturizacion-de-sistemas-de-screening-y-determinacion-de 225/393
Green pepper 91 Dicloran 9 ± 1 11 ± 2 n.a. d n.a.d
Green pepper 91 Permethrin 215 ± 15 210 ± 20 500 1000
Aubergine 93 Bifenthrin 8±
1 6±
1 n.a.
d
n.a.
d
Cauliflower 91 Dichlofluanid 39 ± 3 40 ± 6 5000 n.a.d
Cauliflower 91 Permethrin 55 ± 4 50 ± 6 100 500
Onion 91 Bifenthrin 8 ± 1 7 ± 2 n.a.d n.a.d
aAmount per g of fresh sample. bEstablished by the European Union.c Established by FAO.d Value not applicable by the European Union.
Almudena Columé Díaz Tesis Doctoral
A)
IS
4
2 minA)
IS
4
2 min

7/18/2019 Automatizacion y Miniaturizacion de Sistemas de Screening y Determinacion de Residuos de Plaguicidas en Muestra Agroalimentaria
http://slidepdf.com/reader/full/automatizacion-y-miniaturizacion-de-sistemas-de-screening-y-determinacion-de 226/393
B)
12
34
56
7
8
9
IS
1011
12
13
14
1516
1718
192021
22
23
24
25
Time (min)
B)
12
34
56
7
8
9
IS
1011
12
13
14
1516
1718
192021
22
23
24
25
Time (min)
Figure 2. GC-ECD chromatograms for (A) lyophilised tomato sample where dichlofuanidwas detected and (B) this sample fortified with all the pesticides studied at a mediumconcentration level. Peaks: 1=dicloran; 2=lindane; 3=vinclozolin; 4=dichlofuanid; 5=captan;6=procymidone; 7=α-endosulfan; 8=β-endosulfan; 9=endosulfan sulphate; 10=bifenthrin;11=fenpropathrin; 12=λ-cyhalothrin; 13=permethrin cis; 14=permethrin trans; 15=cyfluthrinI; 16=cyfluthrin III; 17=cyfluthrin II; 18=cyfluthrin IV; 19=cypermethrin I;
20=cypermethrin III; 21=cypermethrin II; 22=cypermethrin IV; 23=fenvalerate cis;24=fenvalerate trans; 25=deltamethrin, and IS=internal standard.
Organoclorados y Piretroides en Hortalizas y Frutas Liofilizadas Capítulo III
12-60 ng per g of fresh sample (B). Figure 3A shows the chromatogram for the
aubergine sample containing only bifenthrin, obtained with electron capture detection.Figure 3B illustrated the identification of this pyrethroid by comparing the mass
spectrum for the corresponding peak with that in the library. Spectral comparison
resulted in coincidence of ∼85%.
The feasibility of the proposed multiresidue method for the
screening/determination of pesticides in vegetable samples was evaluated by spiking
eight uncontaminated samples with the pesticides according to their use and
occurrence/appearance [1,3,23]. In order to ensure reliable simulation of the actual leaf
7/18/2019 Automatizacion y Miniaturizacion de Sistemas de Screening y Determinacion de Residuos de Plaguicidas en Muestra Agroalimentaria
http://slidepdf.com/reader/full/automatizacion-y-miniaturizacion-de-sistemas-de-screening-y-determinacion-de 227/393
application [23], about 10 g of pulped fresh vegetable was spiked with 1 mL of acetone
containing variable concentrations of pyrethroids and OCPs (between 60 ng and 1 µg)
and after slight shaking, left stand for air-dry (∼2 h) and then lyophilised. On the
assumption that pesticides were uniformly distributed over the 10 g of vegetable, any
analyte-matrix interaction would have occurred during the weathering process (∼2 h).
Table 3 gives the average recovery values obtained for each pesticide spiked to each
vegetable sample at three concentrations, namely: 6, 12 and 24 ng/g of dichloran,
vinclozolin, dichlofuanid, procymidone, β-endosulfan and endosulfan sulphate; 18, 36
and 72 ng/g of α-endosulfan; and 30, 60 and 100 ng/g of lindane, captan and
pyrethroids, from three replicates in each case (n = 3). As expected, recoveries of
pesticides increased as increasing the amount spiked, corresponding the lower values to
Almudena Columé Díaz Tesis Doctoral
IS
1
A)2 min
Time (min)
B)
120
100Scan EI+
1.98 e3
165
181
IS
1
IS
1
A)2 min2 min
Time (min)
B)
120
100Scan EI+
1.98 e3
165
181100
Scan EI+1.98 e3
165
181

7/18/2019 Automatizacion y Miniaturizacion de Sistemas de Screening y Determinacion de Residuos de Plaguicidas en Muestra Agroalimentaria
http://slidepdf.com/reader/full/automatizacion-y-miniaturizacion-de-sistemas-de-screening-y-determinacion-de 228/393
100
%
0
141
165
179
PESTICIDE: BIFENTHRIN Hit 1
%
0
50 75 100 275225150 175125 250200
152
182
181
141
165
179152 182
m/z
100
%
0
141
165
179
PESTICIDE: BIFENTHRIN Hit 1
%
0
50 75 100 275225150 175125 250200
152
182
181
141
165
179152 182
m/z
100
%
0
141
165
179
PESTICIDE: BIFENTHRIN Hit 1
%
0
50 75 100 275225150 175125 25020050 75 100 275225150 175125 250200
152
182
181
141
165
179152 182
m/z
Table 3. Average recoveries (n=3) of pesticides spiked to vegetables at low (6-30 ng), medium (12-60 ng) and high (24-100 ng) levels per gram of fresh sample.
Average recovery
Aubergine Potato Green pepper TomatoCompound
Lowlevel
Medium level
Highlevel
Lowlevel
Medium level
Highlevel
Lowlevel
Medium level
Highlevel
Lowlevel
Medium level
Highlevel
Dicloran 89 ± 4 91 ± 3 99 ± 4Lindane 95 ± 4 98 ± 3 99 ± 4 91 ± 5 94 ± 5 96 ± 4 90 ± 4 95 ± 3 97 ± 4 94 ± 4 96 ± 4 101 ±
Vinclozolin 93 ± 4 93 ± 3 99 ± 3 94 ± 5 95 ± 3 97 ± 3 90 ± 3 97 ± 3 97 ± 3
Dichlofluanid 93 ± 6 97 ± 5 100 ±
Captan 79 ± 4 83 ± 3 85 ± 4 81 ± 4 84 ± 4 88 ± 4 86 ± 4 88 ± 5 90 ± 4
Procymidone 93 ± 5 96 ± 5 97 ± 4 91 ± 5 96 ± 4 102 ±
α-Endosulfan 83 ± 4 86 ± 4 86 ± 4 82 ± 3 86 ± 3 87 ± 5 82 ± 4 83 ± 4 85 ± 3 83 ± 5 88 ± 5 89 ± 3

7/18/2019 Automatizacion y Miniaturizacion de Sistemas de Screening y Determinacion de Residuos de Plaguicidas en Muestra Agroalimentaria
http://slidepdf.com/reader/full/automatizacion-y-miniaturizacion-de-sistemas-de-screening-y-determinacion-de 229/393
β-Endosulfan 92 ± 5 93 ± 4 95 ± 3 92 ± 4 93 ± 4 98 ± 4 91 ± 3 96 ± 3 99 ± 4 95 ± 4 97 ± 4 101 ±
Endosulfansulphate 93 ± 3 94 ± 2 98 ± 2 93 ± 3 96 ± 2 99 ± 3 89 ± 3 95 ± 3 96 ± 3 96 ± 3 99 ± 3
100 ± 2
Bifenthrin 69 ± 3 75 ± 3 80 ± 2 69 ± 3 70 ± 3 73 ± 2Fenpropathrin 82 ± 4 91 ± 4 97 ± 3 84 ± 3 93 ± 3 102 ± 89 ± 4 96 ± 4 101 ±
λ-Cyhalothrin 93 ± 5 98 ± 5 99 ± 4 86 ± 4 88 ± 3 95 ± 4
Permethrin 89 ± 5 98 ± 5 99 ± 4 84 ± 3 91 ± 3 101 ± 85 ± 4 91 ± 4 99 ± 3
Cyfluthrin 95 ± 6 97 ± 3 102 ± 91 ± 4 98 ± 3 100 ±
β-Cyfluthrin 98 ± 5 100 ± 102 ± 81 ± 5 89 ± 5 93 ± 4
Cypermethrin 86 ± 6 97 ± 3 99 ± 3 85 ± 3 90 ± 3 95 ± 3 84 ± 4 87 ± 3 95 ± 3
α-Cypermethrin 83 ± 4 92 ± 5 95 ± 3 83 ± 4 87 ± 2 96 ± 3 90 ± 5 92 ± 4 96 ± 3Fenvalerate 77 ± 3 86 ± 3 98 ± 3 75 ± 3 86 ± 3 96 ± 2
Deltamethrin 73 ± 4 77 ± 4 83 ± 4 74 ± 2 78 ± 3 85 ± 2
Table 3 (continue).
Average recovery
Onion Spinach Cucumber CauliflowerCompound
Lowlevel Mediumlevel Highlevel Lowlevel Mediumlevel Highlevel Lowlevel Mediumlevel Highlevel Lowlevel Mediumlevel Highlevel
Dicloran 89 ± 4 94 ± 4 96 ± 4 89 ± 3 93 ± 2 98 ± 2 92 ± 4 94 ± 3 95 ± 4
Lindane 88 ± 5 89 ± 5 95 ± 3 91 ± 5 93 ± 4 102 ± 4 94 ± 5 96 ± 4 99 ± 3
Vinclozolin 93 ± 3 98 ± 4 100 ± 5 93 ± 4 97 ± 4 98 ± 3 94 ± 3 96 ± 2 98 ± 3
Dichlofluanid 91 ± 4 93 ± 5 95 ± 3 93 ± 4 94 ± 4 97 ± 4
Captan 80 ± 4 81 ± 4 81 ± 3 81 ± 3 82 ± 3 86 ± 4 83 ± 6 84 ± 5 87 ± 4
Procymidone 91 ± 3 93 ± 3 94 ± 2 91 ± 3 96 ± 2 97 ± 3
α-Endosulfan 85 ± 5 88 ± 3 90 ± 3 81± 5 85 ± 3 86 ± 3
β-Endosulfan 93 ± 4 96 ± 4 98 ± 3 94 ± 5 96 ± 5 97 ± 3
Endosulfansulphate 95 ± 3 97 ± 4 99 ± 2 96 ± 4 99 ± 3 100 ± 3Bifenthrin 63 ± 2 64 ± 2 66 ± 2 70 ± 2 76 ± 3 81 ± 3 66 ± 3 72 ± 3 76 ± 2 63 ± 2 67 ± 3 70 ± 2Fenpropathrin 85 ± 4 99 ± 4 102 ± 4 82 ± 3 90 ± 2 98 ± 3 86 ± 4 87 ± 3 91 ± 3
λ-Cyhalothrin 91 ± 5 99 ± 6 102 ± 5 88 ± 3 92 ± 4 95 ± 2 90 ± 4 91 ± 4 98 ± 5
Permethrin 84 ± 4 93 ± 4 101 ± 4 79 ± 3 82 ± 3 90 ± 3Cyfluthrin 85 ± 5 89 ± 3 93 ± 5 89 ± 4 90 ± 3 95 ± 4
β-Cyfluthrin 91 ± 4 95 ± 3 96 ± 4 93 ± 5 94 ± 4 101 ± 3
C th i 85 ± 3 93 ± 3 97 ± 5 95 ± 3 96 ± 4 102 ± 3

7/18/2019 Automatizacion y Miniaturizacion de Sistemas de Screening y Determinacion de Residuos de Plaguicidas en Muestra Agroalimentaria
http://slidepdf.com/reader/full/automatizacion-y-miniaturizacion-de-sistemas-de-screening-y-determinacion-de 230/393
Cypermethrin 85 ± 3 93 ± 3 97 ± 5 95 ± 3 96 ± 4 102 ± 3
α-Cypermethrin 83 ± 4 92 ± 4 99 ± 5 89 ± 5 93 ± 3 94 ± 3
Fenvalerate 86 ± 4 93 ± 4 97 ± 2 87 ± 4 99 ± 5 101 ± 4
Deltamethrin 75 ± 3 83 ± 2 84 ± 3 74 ± 3 75 ± 5 80 ± 3 70 ± 4 75 ± 4 85 ± 3
Organoclorados y Piretroides en Hortalizas y Frutas Liofilizadas Capítulo III
permethrin, fenpropathrin and α-cypermethrin. Average recovery values of the three
amounts spiked, point out the correlation existing among the results obtained for each pesticide in the different matrices assayed; therefore, pesticide characteristics (viz.
degradation, interaction) are less relevant than the type of matrix assayed. In this
regard, average values of OCPs in the different vegetable samples tested ranged from
85-96%, being the values obtained for pyrethroids slightly lower (71-95%). Among
them, those providing the lowest average recovery values were bifenthrin (71±4%),
deltamethrin (78±2%), captan and α-endosulfan (85±2%). The results obtained testify
to the applicability of the proposed method to any vegetable sample because favourable
l b i d i l i ( i i ) i i h

7/18/2019 Automatizacion y Miniaturizacion de Sistemas de Screening y Determinacion de Residuos de Plaguicidas en Muestra Agroalimentaria
http://slidepdf.com/reader/full/automatizacion-y-miniaturizacion-de-sistemas-de-screening-y-determinacion-de 231/393
results were obtained even in very complex matrices (viz. onion). Summarising, the
main advantage of the method developed is the absence of matrix effect, which can be
ascribed to (i) the lyophilisation process, which minimised the extraction of
concomitants from the sample; and (ii) to the efficiency of the clean-up step on the
sorbent selected.
ACKNOWLEDGMENTS
This work was supported by a grant PB-95-0977 from Spain’s CICyT.
Almudena Columé Díaz Tesis Doctoral
REFERENCES
[1] R. Coscolla, Residuos de Plaguicidas en Alimentos Vegetales, Mundi-prensa,
Madrid, 1993.
[2] Community Directive 93/58 EEC , Off. Eur. Commun. L 211/6, European
Community, Brussels, 1993.
[3] C. Tomlin (Ed), The Pesticide Manual, 10 th edn., British Crop Protection, The
Royal Society of Chemistry, London, 1994.
[4] M.A. Luke, J.E. Froberg, H.T. Masumoto , J. AOAC Int . 58 (1975) 1020.
[5] J.P. Hsu, H.J. Schattenberg III, M.M. Garza , J. AOAC Int . 74 (1991) 886.
[6] Y Nakamura Y Tonogai Y Sekiguchi Y Tsumura N Nishida K Takakura

7/18/2019 Automatizacion y Miniaturizacion de Sistemas de Screening y Determinacion de Residuos de Plaguicidas en Muestra Agroalimentaria
http://slidepdf.com/reader/full/automatizacion-y-miniaturizacion-de-sistemas-de-screening-y-determinacion-de 232/393
[6] Y. Nakamura, Y. Tonogai, Y. Sekiguchi, Y. Tsumura, N. Nishida, K. Takakura,
M. Isechi, K. Yuasa, M. Nakamura, N. Kifune, K. Yamamoto, S. Teresawa, T.
Oshima, M. Miyata, K. Kamakura, Y. Ito , J. Agric. Food Chem. 42 (1994)
2508.
[7] S. Schachterle, C. Feigel , J. Chromatogr. A 754 (1996) 411.
[8] G.E. Miliadis, P.T. Malatou , Int. J. Environ. Anal. Chem. 70 (1998) 29.
[9] A. Agüera, L. Piedra, M.D. Hernando, A. Fernández-Alba, M. Contreras ,
Analyst 125 (2000) 1397.
[10] H.M. Pylypiw , J. AOAC Int. 76 (1993) 1369.
[11] K. Fytianos, J. Konstantinou, J. Kaidatzis, T. Albanis, Bull. Environ. Contam.
Toxicol. 61 (1998) 684.
[12] G Ch C h i h 8 (199 )
Organoclorados y Piretroides en Hortalizas y Frutas Liofilizadas Capítulo III
[13] G. Pang, Y. Chao, C. Fan, J. Zhang, X. Li, T. Zhao , J. AOAC Int . 78 (1995)
1489.
[14] R.A. Doong, C.Y. Lee, Y.C. Sun, J. AOAC Int . 82 (1999) 677.
[15] A. Ramesh, M. Balasubramanian, J. AOAC Int . 82 (1999) 725.
[16] A. Fernández-Alba, A. Valverde, A. Agüera, M. Contreras, J. Chromatogr. A
686 (1994) 266.
[17] J. Fillion, R. Hindle, M. Lacroix, J. Selwyn, J. AOAC Int. 78 (1995) 1252.
[18] T. Pihlstrom, B.G. Osterdahl, J. Agric. Food Chem. 47 (1999) 2549.
[19] A. Columé, S. Cárdenas, M. Gallego, M. Valcárcel, J. Chromatogr. A 849
(1999) 235.

7/18/2019 Automatizacion y Miniaturizacion de Sistemas de Screening y Determinacion de Residuos de Plaguicidas en Muestra Agroalimentaria
http://slidepdf.com/reader/full/automatizacion-y-miniaturizacion-de-sistemas-de-screening-y-determinacion-de 233/393
( )
[20] Community Directive 79/700 EEC , Off. J. Eur. Commun., European
Community, Brussels, 1979.
[21] M.D. Luque de Castro, A. Izquierdo, J. Autom. Chem. 12 (1990) 267.
[22] A. Columé, S. Cárdenas, M. Gallego, M. Valcárcel, J. Chromatogr. A 912
(2001) 83.
[23] C. Liñán Vicente (Ed.), Vademécum de Productos Fitosanitarios y
Nutricionales, 14th edn., Agrotécnicas S.L., Madrid, 1999.

7/18/2019 Automatizacion y Miniaturizacion de Sistemas de Screening y Determinacion de Residuos de Plaguicidas en Muestra Agroalimentaria
http://slidepdf.com/reader/full/automatizacion-y-miniaturizacion-de-sistemas-de-screening-y-determinacion-de 234/393
CAPITU LO IV:
PLAGUICIDAS ORGANOCLORADOS
Y PIRETR OIDES EN MUESTRA S
ACUOSAS
CHAPTER IV:
ORGANOCHLORINE AN D PYRETHROID
PESTICIDES IN WA TER SAMPLES

7/18/2019 Automatizacion y Miniaturizacion de Sistemas de Screening y Determinacion de Residuos de Plaguicidas en Muestra Agroalimentaria
http://slidepdf.com/reader/full/automatizacion-y-miniaturizacion-de-sistemas-de-screening-y-determinacion-de 235/393
CAPITULO IV
HORTALIZAS
FLUIDOSBIOLOGICOS
FRUTAS
ORGANOCLORADOS
PIRETROIDES
EVAPORACION
SPE
MUESTRAS
AGUAS

7/18/2019 Automatizacion y Miniaturizacion de Sistemas de Screening y Determinacion de Residuos de Plaguicidas en Muestra Agroalimentaria
http://slidepdf.com/reader/full/automatizacion-y-miniaturizacion-de-sistemas-de-screening-y-determinacion-de 236/393
Organoclorados y Piretroides en Muestras Acuosas Capítulo IV

7/18/2019 Automatizacion y Miniaturizacion de Sistemas de Screening y Determinacion de Residuos de Plaguicidas en Muestra Agroalimentaria
http://slidepdf.com/reader/full/automatizacion-y-miniaturizacion-de-sistemas-de-screening-y-determinacion-de 237/393
La agricultura utiliza el 70% de los recursos hídricos del planeta. Exceptuando
las pérdidas por evaporación, el agua empleada en agricultura se recicla y llega de
nuevo a las aguas superficiales y subterráneas, arrastrando contaminantes. De hecho,
con el agua de lluvia los plaguicidas, dependiendo del tipo de suelo, se transportan por
escorrentía o se infiltran en el suelo alcanzando las aguas subterráneas. La degradación
de la calidad del agua por la contaminación por plaguicidas tiene dos impactos
principales en la salud humana. El primero es el consumo de pescado o de otros
organismos acuáticos que estén contaminados con los plaguicidas; el segundo es el
di d i d i l ió
Almudena Columé Díaz Tesis Doctoral
0.5 ng/mL establecido para la suma de plaguicidas, y que aproximadamente en el 25%
de esa área, este LMR se superaba en más de 10 veces [1].
En este capítulo se aborda la determinación de residuos de plaguicidas
organoclorados en diversas muestras acuosas (Cap. IV.1), empleando un sencillo
sistema de flujo totalmente automatizado y cromatografía de gases. Además, se evalúa
la influencia de la presencia de materia orgánica sobre la degradación/adsorción de
estos plaguicidas en las muestras. De hecho, parece ser que la adsorción de plaguicidas
organoclorados sobre la materia orgánica (fundamentalmente algas) presentes en un río,
es una especie de mecanismo de limpieza del propio río. Es por ello que diversas
organizaciones, como la Comisión conjunta FAO/OMS y US-EPA, recomienden

7/18/2019 Automatizacion y Miniaturizacion de Sistemas de Screening y Determinacion de Residuos de Plaguicidas en Muestra Agroalimentaria
http://slidepdf.com/reader/full/automatizacion-y-miniaturizacion-de-sistemas-de-screening-y-determinacion-de 238/393
determinar no sólo la presencia de plaguicidas en el agua, sino también en los
sedimentos, de manera que se constate más exhaustivamente la presencia de plaguicidas
en el medio acuático [1].
La segunda parte de este capítulo se centra en el desarrollo de un sistema de
screening para determinar la presencia de plaguicidas organoclorados y/o piretroides en
muestras acuosas (Cap. IV.1), utilizando FTIR sin separación previa de los analitos. El
uso de la espectrometría de infrarrojo en el análisis de residuos de plaguicidas se
encuentra limitado a su empleo como detector en LC [2], SFE [3] y GC [4]. La
determinación cuali y cuantitativa de plaguicidas mediante FTIR, sin el uso de una
técnica cromatográfica de separación, únicamente se ha llevado a cabo en
f l i i l d d l ió d l i l [ 6]
Organoclorados y Piretroides en Muestras Acuosas Capítulo IV
REFERENCIAS
[1] E. D. Ongley, Control of Water Pollution from Agriculture, FAO/OMS, Roma,
1996.
[2] J. C. Jones, D. Littlejohn, P. R. Griffiths, Appl. Spectrosc. 53 (1999) 792.
[3] D. F. Gurka, S. Pyle, R. Titus, E. Shafter, Anal. Chem. 66 (1994) 2521.
[4] N. K. Zhu, X. Y. Du, X. J. Xia, S. Q. Wang, F. C. An, Bull. Environ. Contam.
Toxicol. 65 (2000) 22.
[5] M. J. Almond, S. J. Knowles, Appl. Spectrosc. 53 (1999) 1128.
[6] K. K. Sharma, S. Gupta, S. K. Handa, Talanta 44 (1997) 2075.
7/18/2019 Automatizacion y Miniaturizacion de Sistemas de Screening y Determinacion de Residuos de Plaguicidas en Muestra Agroalimentaria
http://slidepdf.com/reader/full/automatizacion-y-miniaturizacion-de-sistemas-de-screening-y-determinacion-de 239/393

7/18/2019 Automatizacion y Miniaturizacion de Sistemas de Screening y Determinacion de Residuos de Plaguicidas en Muestra Agroalimentaria
http://slidepdf.com/reader/full/automatizacion-y-miniaturizacion-de-sistemas-de-screening-y-determinacion-de 240/393
Organoclorados y Piretroides en Muestras Acuosas Capítulo IV
Evaluation of an automated solid-phase extraction system for theenrichment of organochlorine pesticides from waters
A. Columé, S. Cárdenas, M. Gallego, M. Valcárcel
Analytical Chemistry Division, Campus de Rabanales, University of Córdoba, E-140 71 Córdoba, Spain
Received 21 November 2000; received in revised form 7 February 2001; accepted 16 February 2001
Talanta 54 (2001) 943-951ELSEVIERTalanta

7/18/2019 Automatizacion y Miniaturizacion de Sistemas de Screening y Determinacion de Residuos de Plaguicidas en Muestra Agroalimentaria
http://slidepdf.com/reader/full/automatizacion-y-miniaturizacion-de-sistemas-de-screening-y-determinacion-de 241/393
Abstract
An automatic method for the determination of organochlorine pesticides (OCPs) in
water samples was developed. The analytes are preconcentrated onto a customized RP-C18
column and subsequently eluted with 80 µL of ethyl acetate. Gas chromatography with electron
capture detection is used for their separation and selective detection. Detection limits for 10 mL
sample volumes range from 0.01 to 0.1 ng/mL, with standard deviations between 4 and 6%. The
average recovery at a fortification level of 2 ng/mL is 92%. The method was used to screen
OCPs in natural waters collected near agricultural areas and also to tap waters. Positive findings
were confirmed by gas chromatography with mass spectrometric detection. Finally, the
adsorption/degradation of OCPs in natural pond water containing a high level of suspended
Almudena Columé Díaz Tesis Doctoral
1. INTRODUCTION
Pesticides are ubiquitous water and soil pollutants by virtue of their extensive
use. In recent years, many studies have shown fresh surface, drinking and ground
waters to frequently contain pesticides at high concentrations [1]. Pesticides are
primarily moved from agricultural fields to surface waters in surface run-off. The
amount lost from fields and transported to surface waters depends on several factors,
including soil characteristics, topography, weather, agricultural practices, and chemical
and environmental properties of individual pesticides [2]. One of the primary goals in
water analyses for pesticides is to reach determination limits of about 0.1 ng/mL for
individual pesticides and 0.5 ng/mL for total concentrations in order to meet the

7/18/2019 Automatizacion y Miniaturizacion de Sistemas de Screening y Determinacion de Residuos de Plaguicidas en Muestra Agroalimentaria
http://slidepdf.com/reader/full/automatizacion-y-miniaturizacion-de-sistemas-de-screening-y-determinacion-de 242/393
requirements of the European Union (EU) Drinking Water Directives [3] and those of
the US National Pesticide Survey. These levels call for methods with very low
detection limits. Thus, a recent EU report stated that such analytical methods should
have detection limits of 0.02 ng/mL or less and an accuracy about 20% [4].
Organochlorine pesticides (OCPs) are usually determined by gas
chromatographic (GC) techniques, using mass spectrometric (MS) [1,2,5-9] or electron
capture detection (ECD) [2,5,10-15]; liquid chromatography with MS detection has also
been used for his purpose, however [5]. The need to extract large volumes of water (up
to 2 L) to analyse small amounts of analyte (nanogram-per-millilitre levels) in relatively
unpolluted water requires using a suitable preconcentration technique. The most
h i h lid h i ( ) d li id li id
Organoclorados y Piretroides en Muestras Acuosas Capítulo IV
residue in a low volume of organic solvent [5,7,8], which may result in serious losses of
analytes. Techniques such as large-volume injection [1,7,13], microwave-assisted
solvent elution [15] and solid-phase microextraction [9,14] have also been used but to a
lesser extent for this purpose. At present, SPE methods are routinely used to monitor
pesticides in the aquatic environment because of the wide availability of selective
sorbent materials, their simplicity and reduced solvent consumption, and the high
preconcentration factors they provide. This technique involves the sorption of OCPs
from a large amount of water onto a suitable sorbent and their desorption by solvent
elution.
The aim of this study was to develop a simple, robust method for the identification

7/18/2019 Automatizacion y Miniaturizacion de Sistemas de Screening y Determinacion de Residuos de Plaguicidas en Muestra Agroalimentaria
http://slidepdf.com/reader/full/automatizacion-y-miniaturizacion-de-sistemas-de-screening-y-determinacion-de 243/393
and quatitation of OCPs at the low ng/mL level in waters close to agricultural areas or
used for human consumption without the need for time-consuming sample treatment
(i.e. to process large sample volumes). The target compounds tested were chosen on the
grounds of their intensive use in the Mediterranean agricultural region. SPE was chosen
for sample clean-up/preconcentration and GC with ECD detection for quantitation, in
order to take advantage of the high efficiency of the chromatographic separation and the
selectivity of the detection step. The proposed extraction system was tested with various
sorbents; the advantages and constraints of the ensuing method are discussed below.
Almudena Columé Díaz Tesis Doctoral
2. EXPERIMENTAL
2.1. Materials and reagents
All chemicals and sorbents were of analytical grade or better. Aldrin, captan,
dichlofuanid, dicofol, α- and β-endosulfan (3:1, w/w), endosulfan sulphate, α-, β-, δ-
and γ -hexachlorocyclohexane (α-, β-, δ- and γ -HCH 1:1:1:1, w/w), lindane (γ -HCH),
procymidone and vinclozolin were obtained from Riedel-deHaën (Seelze, Germany).
2,4-Dichlorophenol (internal standard) and RP-C18 HPLC sorbent were supplied by
Sigma (Madrid, Spain). All other reagents (acetone, ethyl acetate, ethanol, n-hexane
and sodium sulphate) were obtained from Merck (Darmstadt, Germany).

7/18/2019 Automatizacion y Miniaturizacion de Sistemas de Screening y Determinacion de Residuos de Plaguicidas en Muestra Agroalimentaria
http://slidepdf.com/reader/full/automatizacion-y-miniaturizacion-de-sistemas-de-screening-y-determinacion-de 244/393
2.2. Gas chromatographic system
Experiments were carried out by using a Hewlett-Packard 5890A gas
chromatograph equipped with a 63 Ni electron-capture detection (ECD).
Chromatographic separation was achieved by using a fused silica capillary column (30
m x 0.25 mm i.d.) coated with 5% phenyl-methylpolysiloxane, film thickness 0.25 µm
(Supelco, Madrid, Spain). Peak areas were measured with a Hewlett-Packard 3392 A
integrator. The injector and detector temperatures were kept at 225°C and 325°C,
respectively throughout. Nitrogen (5.5. Air Liquide, Seville, Spain) was employed as
carrier gas (1 mL/min). The column temperature was raised from 120°C (2 min) to
180°C (4 min) at 8ºC/min, then to 255°C (10 min) at 8ºC/min and, finally, to 270°C (2
Organoclorados y Piretroides en Muestras Acuosas Capítulo IV
interfaced to a Fisons MD800 mass spectrometer and controlled by a computer running
MASSLAB software (Thermo, Madrid, Spain), using the same chromatographic column
and temperature programme. Ultrapure helium (6.0 Air Liquide) at a flow-rate of 1
mL/min was employed as carrier gas, which involves a variation in the retention times
obtained for the analytes assayed. The injection port and transfer line temperatures were
maintained at 225°C and 300°C, respectively. The ion source temperature was 200°C
for the 70 eV electron impact mode, with scanning over the m/z range of 50-500. In all
analyses, 1 µL of the organic extract was injected in the split mode (1:25 ratio).
The SPE system was constructed by using a Gilson Minipuls-2 peristaltic pump
fitted with Solvaflex pumping tubes, two Rheodyne 5041 six-port injection valves,

7/18/2019 Automatizacion y Miniaturizacion de Sistemas de Screening y Determinacion de Residuos de Plaguicidas en Muestra Agroalimentaria
http://slidepdf.com/reader/full/automatizacion-y-miniaturizacion-de-sistemas-de-screening-y-determinacion-de 245/393
PTFE tubing and commercially available connectors. The sorbent column was prepared
by packing a commercial Omnifit glass column (2 cm x 2.5 mm i.d.) with ∼70 mg of
RP-C18.
2.3. Standard solutions and sample conditioning
Stock solutions (5 mg/mL) of each OCP were prepared in acetone and stored in
glass stoppered bottles at 4°C in the dark. Standard and GC calibration solutions
spanning the concentration range 0.05-50 ng/mL were made by appropriate dilution of
the stock solutions. The internal standard, 2,4-dichlorophenol, was added to the eluent
(ethyl acetate) at a concentration of 1 µg/mL.
Almudena Columé Díaz Tesis Doctoral
Water samples were collected in amber glass bottles. A volume of 1 mL of 0.1 M
Na2S2O3 per litre of water sample (final concentration of 10 -4 M) was added on site to
suppress the interferences of chlorine and humic and fulvic acids. All samples were
filtered through a Micro Separations Inc. 0.45 µm nylon filter (Westboro, MA) to
remove particulate matter. In order to avoid degradation of some of the OCPs under
alkaline conditions [17], the pH of all water samples was adjusted to 5-6. Analyses
were performed with the least possible delay, the water samples being kept dark at 4°C
from collection to analysis. Any samples that could not be analysed within two days
were treated as described below and their organic extracts frozen at -4 °C until their GC
analysis.
7/18/2019 Automatizacion y Miniaturizacion de Sistemas de Screening y Determinacion de Residuos de Plaguicidas en Muestra Agroalimentaria
http://slidepdf.com/reader/full/automatizacion-y-miniaturizacion-de-sistemas-de-screening-y-determinacion-de 246/393
2.4. Analytical SPE method
Figure 1 depicts the flow system designed for the determination of OCPs. Initially,
10-100 mL of standard solutions or water samples, at pH 5-6, containing variable
concentrations of the analytes (0.05-50 ng/mL), were continuously aspirated at a flow-
rate of 1.5 mL/min and passed through the RP-C18 column, located in the loop of one of
the injection valves (IV1). Simultaneously, the loop of the second injection valve (IV2)
was filled with eluent (ethyl acetate) containing the internal standard (1 µg/mL of 2,4-
dichlorophenol) by means of a syringe. On switching both injection valves, the loop
contents were carried by an air stream at a flow-rate of 0.2 mL/min. The eluent was
Organoclorados y Piretroides en Muestras Acuosas Capítulo IV
ere collected in a glass ial containing anh dro s sodi m s lphate A ol me of 1 µL
Figure 1. Scheme of the continuous preconcentration and elution steps for thedetermination of OCPs in waters. IV=injection valve; W=waste; GC=gaschromatograph.
0.2
1.5
mL/min
Water sample
Air
IV1
IV2
80 µµµµL
RP-C18
W
GC
0.2
1.5
mL/min
Water sample
Air
IV1
IV2
80 µµµµL
RP-C18
W
GC

7/18/2019 Automatizacion y Miniaturizacion de Sistemas de Screening y Determinacion de Residuos de Plaguicidas en Muestra Agroalimentaria
http://slidepdf.com/reader/full/automatizacion-y-miniaturizacion-de-sistemas-de-screening-y-determinacion-de 247/393
were collected in a glass vial containing anhydrous sodium sulphate. A volume of 1 µL
of dried solution was injected into the GC-ECD for analysis. After samples were
passed, the sorbent column was washed with 1 mL of ethanol to remove potential
interferents adsorbed on the column and then conditioned with 3 mL of ultrapure water.
If confirmation by GC-MS was required, a volume of 100 mL of the water sample was
used taking into account the lower sensitivity of the detector compared to ECD.
3. RESULTS AND DISCUSSION
3.1. Clean-up/retention step
Automated SPE enables the preconcentration of large volumes of water
Almudena Columé Díaz Tesis Doctoral
compounds (viz. silica gel, Amberlite XAD-2, LiChrolut-EN, activated carbon, Florisil
and RP-C18) were initially tested for preconcentration of the OCPs. Sorption tests were
carried out by using a column packed with 50 mg of the sorbent tested in each case. An
aqueous solution containing ∼50 ng/mL OCPs was passed through each column at 0.5
mL/min. Fractions of 1 mL of sample were collected in glass vials before (100%
recovery) and after (unsorbed) the sorbent column, and extracted by hand with 1 mL of
ethyl acetate. This solvent was selected on the grounds of its extraction efficiency for
the compounds studied [6]. After evaporation to near dryness, the residue was
redissolved in 200 µL of ethyl acetate and a 1 µL aliquot of the extract was analysed by
GC. After each sample was processed, the column was sequentially rinsed with 1 mL of
ethanol to remove potentially adsorbed analytes and then conditioned with 3 mL of

7/18/2019 Automatizacion y Miniaturizacion de Sistemas de Screening y Determinacion de Residuos de Plaguicidas en Muestra Agroalimentaria
http://slidepdf.com/reader/full/automatizacion-y-miniaturizacion-de-sistemas-de-screening-y-determinacion-de 248/393
ethanol to remove potentially adsorbed analytes and then conditioned with 3 mL of
ultrapure water. The adsorption efficiency was dependent upon the individual sorbent
assayed, being 40% for Amberlite XAD-2; 60% for Florisil and silica gel; 75% for
LiChrolut-EN and 90-100% for RP-C18 and activated carbon. RP-C18 was finally
selected, as retention of OCPs on activated carbon was irreversible. Thus, various
columns packed with different amounts of RP-C18 between 20 and 90 mg were prepared
in order to establish the optimum amount of sorbent for adsorbing the OCPs. The
amount of sorbent used was found to have considerable influence; thus, the peak areas
obtained with 40 mg were about 2 times higher than those provided by 20 mg, beyond
which they remained virtually constant. A working column packed with 40 mg RP-C 18
Organoclorados y Piretroides en Muestras Acuosas Capítulo IV
water containing each OCP in concentrations of 2-6 ng/mL into a SPE unit as depicted
in Figure 1 and eluting the OCPs with 200 µL of ethyl acetate.
The influence of pH on the retention of OCPs was studied over the range 1-10,
adjusted with dilute HNO3 or NaOH. Aldrin was the OCP chromatographic signals of
which remained almost constant throughout the widest pH range (1.0 to 9.0); for the
rest of the analytes, chromatographic areas increased with increasing pH, remaining
almost constant over the range 2.8-7.5 (HCH isomers, vinclozolin, procymidone); 2.8-
7.0 (captan, β-endosulfan, dicofol, endosulfan sulphate); 3.0-7.2 (dichlofuanid) and 3.4-
6.5 (α-endosulfan), but decreasing at higher pH values. This can be ascribed to the
OCPs being degraded or not adsorbed in the alkaline medium. Based on this general
tendency a pH value between 5 and 6 was used as obtained by preparing the standards

7/18/2019 Automatizacion y Miniaturizacion de Sistemas de Screening y Determinacion de Residuos de Plaguicidas en Muestra Agroalimentaria
http://slidepdf.com/reader/full/automatizacion-y-miniaturizacion-de-sistemas-de-screening-y-determinacion-de 249/393
tendency, a pH value between 5 and 6 was used as obtained by preparing the standards
in ultrapure water. The flow-rate of the aqueous solution (10 mL) was found to strongly
influence the recovery throughout the volume flow range studied (0.3-3 mL/min). A
steady state was achieved between 0.3 and 1.7 mL/min, the signal decreasing sharply
above the latter value; a sample flow-rate of 1.5 mL/min was thus selected.
One important parameter to be controlled in developing an SPE method is the
breakthrough volume, i.e. the sample volume where the analyte starts to be eluted from
the column bottom. It depends on packing efficiency of the sorbent bed and on the
strength with which the analytes are retained by each sorbent [16]. This parameter
restricts the maximum sample volume that can be used and hence the maximum
Almudena Columé Díaz Tesis Doctoral
distilled water (from 5 to 100 mL) that were introduced into the SPE system. The
breakthrough volume determined with this on-line SPE system was found to be at least
100 mL (at 1.5 mL/min) for all the compounds selected. Higher volumes can also be
assayed depending on sample availability and operator's patience.
3.2. Elution step
The best eluent under the previously established optimum flow conditions was
selected. Ethyl acetate [2,6,11,13], acetonitrile [5], n-hexane [10] or sequences of the
three [12] are frequently used to elute OCPs preconcentrated from water onto RP-C18
cartridges or disks. All three were tested, using a volume of 200 µL delivered at a flow-
rate of 0.5 mL/min by means of an air stream. Ethyl acetate was found to be the best

7/18/2019 Automatizacion y Miniaturizacion de Sistemas de Screening y Determinacion de Residuos de Plaguicidas en Muestra Agroalimentaria
http://slidepdf.com/reader/full/automatizacion-y-miniaturizacion-de-sistemas-de-screening-y-determinacion-de 250/393
y y
choice (elution efficiency ∼100%) as lower efficiency was obtained for the others (60%
for n-hexane and 85% for acetonitrile), being hence adopted as desorbing solvent. Next,
the influence of the eluent flow-rate was studied by varying the air flow-rate between
0.3 and 0.8 mL/min. The elution efficiency was found to decrease above 0.6 mL/min
owing to the residence time of the eluent in the column being too short for quantitative
desorption; 0.5 mL/min was thus selected. Finally, the effect of the eluent volume was
studied between 50 and 200 µL. Recoveries increased with increasing injected volume
up to 80 µL (complete elution). Therefore, a volume of 80 µL of ethyl acetate was
chosen as optimal.
Organoclorados y Piretroides en Muestras Acuosas Capítulo IV
3.3. Analytical performance
All pesticides studied exhibited good gas chromatographic properties and could
be identified in a direct manner without overlap. The performance and reliability of the
SPE-gas chromatographic method was assessed by determining the sensitivity (slope of
the calibration graph), linear range, detection limit and relative standard deviation.
Analytical curves for aqueous samples containing different amounts of OCPs, prepared
following the above described-procedure, were obtained by plotting the analyte-to-
internal standard peak-area ratio against the analyte concentration. The analytical
figures of merit for a sample volume of 10 mL are summarised in Table 1. Detection
limits of the method were established for the same sample volume, spiked with the
pesticides at very low concentration, introduced into the flow system. They were

7/18/2019 Automatizacion y Miniaturizacion de Sistemas de Screening y Determinacion de Residuos de Plaguicidas en Muestra Agroalimentaria
http://slidepdf.com/reader/full/automatizacion-y-miniaturizacion-de-sistemas-de-screening-y-determinacion-de 251/393
calculated as the minimum concentration providing a chromatographic signal three
times higher than the background noise and ranged from 0.01-0.1 ng/mL. They were all
below the limit set by the European Union and, in most of the cases, several times
lower. Even lower detection limits can be achieved by increasing the sample volume to
100 mL. The precision of the method was checked on 11 samples of 10 mL spiked with
each OCP at a 2 ng/mL concentration. The precision of the method is quite acceptable:
relative standard deviations (RSD) ranged from 4 to 6%.
Almudena Columé Díaz Tesis Doctoral
Table 1. Analytical figures of merit for the determination of OCPs (sample volume 10 mL) usingthe proposed SPE method.
Analyte Slope Linear range (ng/mL) LOD (ng/mL) RSD (%)α-HCH 0.40 0.1-20 0.03 4.6
β-HCH 0.22 0.2-35 0.08 5.8
Lindane 0.41 0.1-20 0.03 4.7
δ-HCH 0.44 0.1-20 0.03 4.5
Vinclozolin 0.39 0.1-20 0.03 5.0
Dichlofuanid 0.19 0.3-40 0.08 5.1
Aldrin 0.37 0.1-20 0.03 4.1
Dicofol 0.26 0.2-30 0.05 5.9
Captan 0.16 0.5-50 0.10 4.8
Procymidone 0.19 0.2-40 0.08 4.6
α-Endosulfan 0.86 0.05-10 0.01 5.0
β-Endosulfan 0.61 0.07-15 0.02 4.2
Endosulfan sulphate 0.42 0.1-20 0.03 3.5

7/18/2019 Automatizacion y Miniaturizacion de Sistemas de Screening y Determinacion de Residuos de Plaguicidas en Muestra Agroalimentaria
http://slidepdf.com/reader/full/automatizacion-y-miniaturizacion-de-sistemas-de-screening-y-determinacion-de 252/393
3.4. Screening of water samples
The proposed enrichment-separation system was applied to the screening of
OCPs in different types of water from agricultural areas and also in 11 tap waters. In all
cases, the pH of the water samples ranged from 7.5 to 8.2; thus, in order to avoid
degradation of some of the OCPs, the pH of the samples was adjusted to 5-6 with dilute
HNO3 as soon as possible after collection. Degradation at room temperature was
especially marked for captan, dichlofuanid, vinclozolin and procymidone; in some
cases (e.g. with captan) it exceeded 50% after only 30 min. This behaviour is illustrated
in Figure 2 for all the OCPs in alkaline ultrapure water (pH 8)
Organoclorados y Piretroides en Muestras Acuosas Capítulo IV
80
60
40
20
0
0 5 10 15 20 25 30 35 40 45 50
Time (h)
D e g r a d a t i o n ( % )
23
5
4
76
8
1
80
60
40
20
0
0 5 10 15 20 25 30 35 40 45 50
Time (h)
D e g r a d a t i o n ( % )
23
5
4
76
8
1
Figure 2. Degradation curves obtained for the 8 OCPs in ultrapure water at pH 8.1.1=Lindane; 2=dicofol; 3=α-endosulfan; 4=aldrin; 5=procymidone; 6=vinclozolin;7=dichlofuanid; 8=captan.

7/18/2019 Automatizacion y Miniaturizacion de Sistemas de Screening y Determinacion de Residuos de Plaguicidas en Muestra Agroalimentaria
http://slidepdf.com/reader/full/automatizacion-y-miniaturizacion-de-sistemas-de-screening-y-determinacion-de 253/393
This sequence is in consonance with the tabulated half lives of the compounds
[17] except for procymidone, for which it was shorter (∼30 h) under the experimental
conditions assayed. Initially, aliquots of 10 mL were passed through the sorbent column
as described under Section 2; in this case, only five samples (all of waters near
agricultural areas) were found to contain residual OCPs at detectable levels (positive
waters). Therefore, the sample volume of positive waters was increased to 50 mL for
quantitative determinations. Matrix effects were examined by using the standard-
addition method with water volumes of 10 mL The slopes of the calibration graphs
Almudena Columé Díaz Tesis Doctoral
standards. The results obtained by using 50 mL of water and the standard-addition
method were coincident (Table 2). As can be seen, the concentrations found were lower
than or similar to the EU maximum acceptable concentration (0.1 ng/mL) for all
compounds examined. Positive results were confirmed by GC-MS by comparing the
mass spectra obtained with those in the Pesticide library; spectral comparison resulted
in coincidence higher than 85%. As the sensitivity was ten times lower than with ECD,
the sample volume must be increased to 100 mL. As example, Figure 3 shows the
chromatograms obtained with electron capture detection, for a river and a natural pond
water samples.
Table 2. OCP concentrations (± SD, n = 5) in the water samples as determined by using the
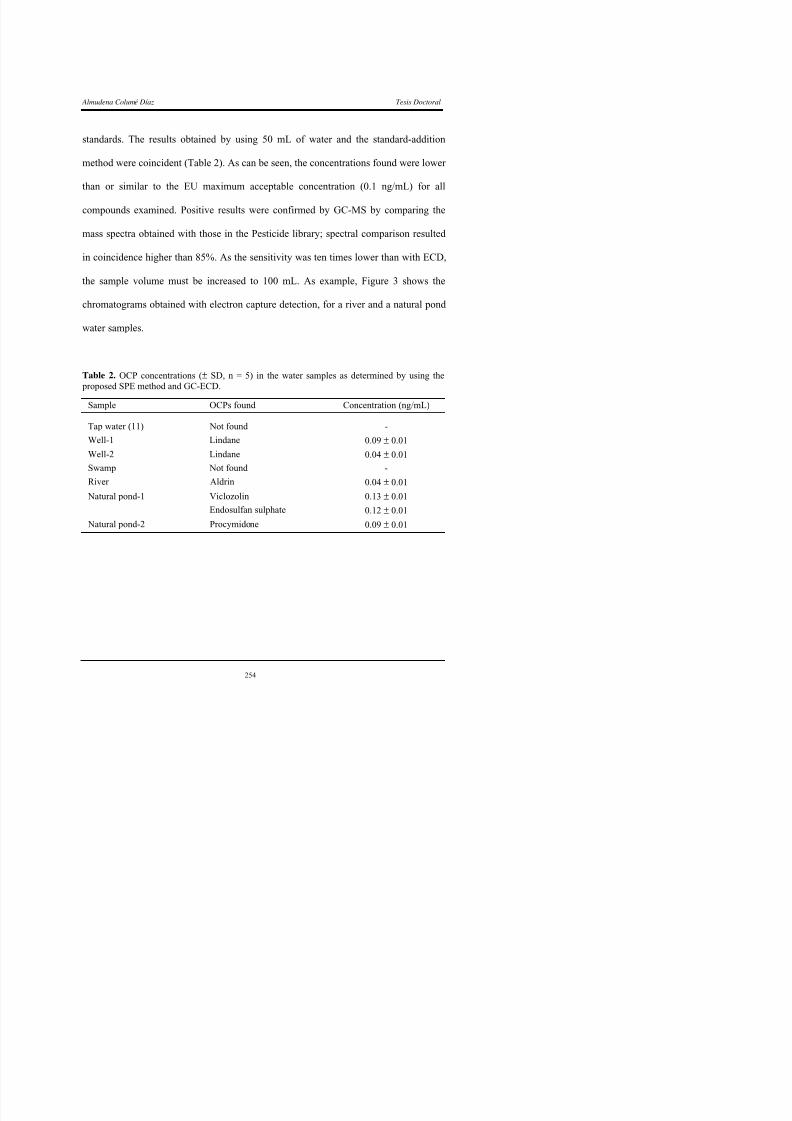
7/18/2019 Automatizacion y Miniaturizacion de Sistemas de Screening y Determinacion de Residuos de Plaguicidas en Muestra Agroalimentaria
http://slidepdf.com/reader/full/automatizacion-y-miniaturizacion-de-sistemas-de-screening-y-determinacion-de 254/393
proposed SPE method and GC-ECD.Sample OCPs found Concentration (ng/mL)
Tap water (11) Not found -
Well-1 Lindane 0.09 ± 0.01
Well-2 Lindane 0.04 ± 0.01
Swamp Not found -
River Aldrin 0.04 ± 0.01
Natural pond-1 ViclozolinEndosulfan sulphate
0.13 ± 0.010.12 ± 0.01
Natural pond-2 Procymidone 0.09 ± 0.01
Organoclorados y Piretroides en Muestras Acuosas Capítulo IV
A)
B)
1
34
1
2
A)
B)
1
34
1
2

7/18/2019 Automatizacion y Miniaturizacion de Sistemas de Screening y Determinacion de Residuos de Plaguicidas en Muestra Agroalimentaria
http://slidepdf.com/reader/full/automatizacion-y-miniaturizacion-de-sistemas-de-screening-y-determinacion-de 255/393
0.0 5.0 10.0 15.0 20.0 25.0 30.0
Retention time (min)
0.0 5.0 10.0 15.0 20.0 25.0 30.0
Retention time (min)
Figure 3. Chromatograms for (A) river and (B) natural pond waters, obtained with ECDdetection. Sample volume, 50 mL. Peaks: 1=2,4-Dichlorophenol (internal standard); 2=aldrin;3=vinclozolin; 4=endosulfan sulphate.
Almudena Columé Díaz Tesis Doctoral
3.5. Adsorption/degradation of OCPs spiked to natural pond water
Samples may occasionally contain particulates, colloids or dissolved
macromolecular organic matter which results in filtration losses; therefore, the
percentages of adsorption/degradation of OCPs are dependent on both, the amount of
suspended matter and the concentration of the individual pesticide [18,19]. In order to
estimate the influence of suspended matter (SM) present in a water sample on the
recovery of OCPs using the proposed SPE technique, a natural pond water sample, free
from OCPs, containing high levels of algae (SM ∼0.1 g/L) was selected as sample test.
It contained filamentous algae consisting largely of Spirogyra (green algae) and, to a
lesser extent, Oscillatoria (blue-green algae); in addition to unicellular diatomaceous
algae. The sample (10 L) was spiked (2 ng/mL) with the selected OCPs and maintained

7/18/2019 Automatizacion y Miniaturizacion de Sistemas de Screening y Determinacion de Residuos de Plaguicidas en Muestra Agroalimentaria
http://slidepdf.com/reader/full/automatizacion-y-miniaturizacion-de-sistemas-de-screening-y-determinacion-de 256/393
at its natural pH (8.1), in a closed 25 L PTFE bottle in the dark; the ambient
temperature varied between 20 and 30ºC. Volumes of 50 mL were periodically taken
after homogenization of the sample, filtered, adjusted to pH 5-6 and aliquots of 10 mL
being analysed using the proposed method. The container volume was not adjusted to
its initial value by adding the same amount of natural pond water in order to overcome
the dilution effect on the concentration of OCPs. In addition, because the initial volume
was reduced to about 8 L after the experiments, the volume of air (25 L bottle)
remained virtually constant. The bottle was capped to avoid volatilization or
contamination. The experiment allowed the influence of the following factors to be
Organoclorados y Piretroides en Muestras Acuosas Capítulo IV
OCPs adsorbed onto SM by the proposed SPE method. In order to evaluate the
influence of SM on the degradation/adsorption of OCPs in alkaline water, an ultrapure
water sample at the same pH (8.1), spiked with OCPs at the same concentration, was
studied in parallel as model sample. By comparing the differences of the signals
obtained for the model and the natural pond water samples, degradation and adsorption
of the OCPs onto the SM can be discriminated. In addition, one must monitor the
concentration of each OCP in the filtrate and its residue in order to determine the
pesticide distribution in the liquid or solid water phase. For this purpose, an overall
water volume of 50 mL was sampled at variable intervals and filtered. For analysis of
the liquid phase, water aliquots of 10 mL were processed in duplicate; for that of SM in
the water, the residue obtained by filtration of 50 mL of sample was extracted and
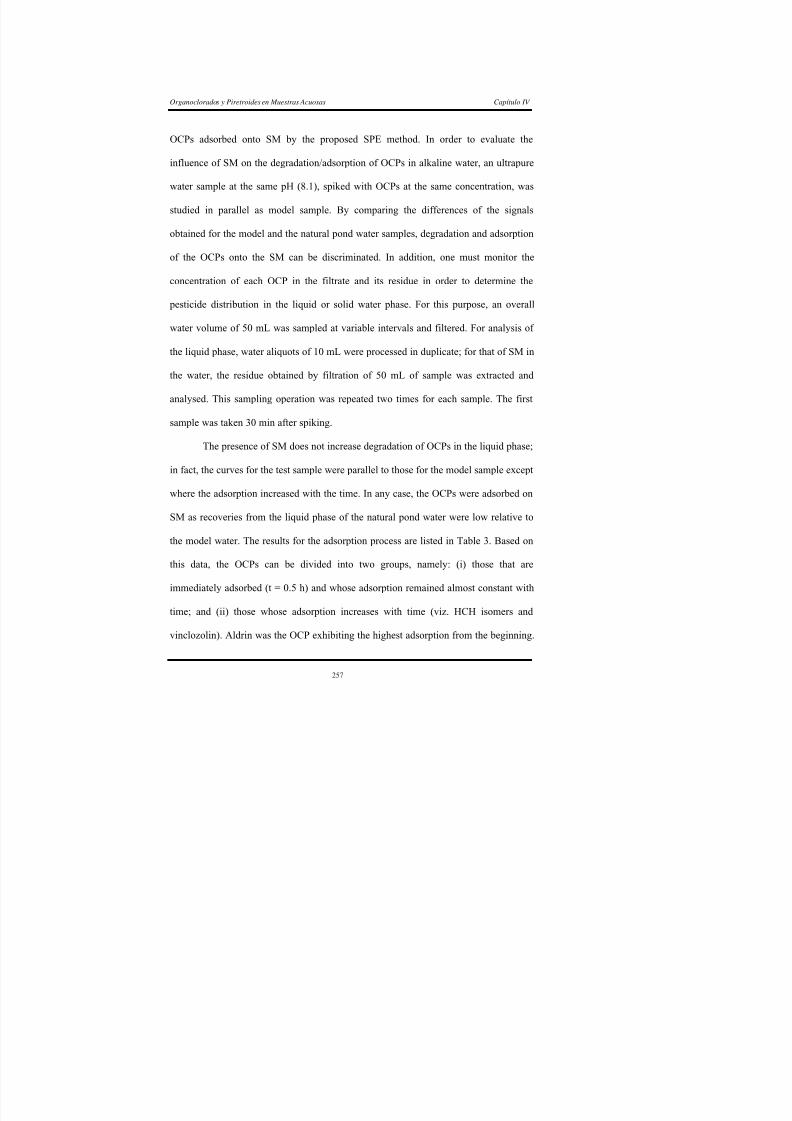
7/18/2019 Automatizacion y Miniaturizacion de Sistemas de Screening y Determinacion de Residuos de Plaguicidas en Muestra Agroalimentaria
http://slidepdf.com/reader/full/automatizacion-y-miniaturizacion-de-sistemas-de-screening-y-determinacion-de 257/393
analysed. This sampling operation was repeated two times for each sample. The first
sample was taken 30 min after spiking.
The presence of SM does not increase degradation of OCPs in the liquid phase;
in fact, the curves for the test sample were parallel to those for the model sample except
where the adsorption increased with the time. In any case, the OCPs were adsorbed on
SM as recoveries from the liquid phase of the natural pond water were low relative to
the model water. The results for the adsorption process are listed in Table 3. Based on
this data, the OCPs can be divided into two groups, namely: (i) those that are
immediately adsorbed (t = 0.5 h) and whose adsorption remained almost constant with
i d (ii) h h d i i i h i ( i i d
Almudena Columé Díaz Tesis Doctoral
As a general tendency, adsorption was higher for compounds having higher log K ow
value (lower solubility in water) [12,17,20]. The exception is captan as it behaviour can
be altered by its instability under the working alkaline conditions.
Table 3. Adsorption (%) with the time of OCPs spiked (2 ng/mL) to a natural pond watercontaining 0.1 g/L of suspended matter. Environmental conditions: sample pH=8.1; ambienttemperature=20-30ºC.
Time (h)Analyte
0.5 1.5 7 48
α-HCH 20 40 40 40
β-HCH 15 35 35 35
Lindane 13 32 32 32
δ-HCH 13 44 44 44
Vinclozolin 10 30 70 77
Dichlofuanid 10 10 - -
Procymidone 10 11 11 15
Dicofol 30 30 30 30
7/18/2019 Automatizacion y Miniaturizacion de Sistemas de Screening y Determinacion de Residuos de Plaguicidas en Muestra Agroalimentaria
http://slidepdf.com/reader/full/automatizacion-y-miniaturizacion-de-sistemas-de-screening-y-determinacion-de 258/393
Dicofol 30 30 30 30Captan 45 45 - -
Endosulfan sulphate 50 50 53 55
α-Endosulfan 58 60 60 60
β-Endosulfan 60 60 60 63
Aldrin 80 82 85 90
Regarding reversible/irreversible adsorption of OCPs on SM (residue retained
on the nylon filter), the concentration of SM in the natural pond water was calculated
by filtering the water and weighing the dry residue; this provided a concentration of
0.10 ± 0.01 g/L (n = 10). Then, OCPs were extracted from SM retained on the filter by
using a previously reported procedure [20] The filter was mechanically shaken with 10
Organoclorados y Piretroides en Muestras Acuosas Capítulo IV
removed from the tube and washed with 10 mL of water. Finally, the n-hexane layer
(containing the OCPs) was evaporated to near dryness, redissolved in ultrapure water
and inserted into the SPE system for clean-up. The SM residue was analysed 0.5 and 24
h after the OCPs were spiked to the water sample. The OCPs also exhibited a
differential behaviour in this case. As expected, recoveries were lower at 24 h than at
0.5 h for all OCPs except aldrin, α- and β-endosulfan, and endosulfan sulphate, for
which they remained virtually constant at 30% (aldrin), 25% (α- and β-endosulfan) and
10% (endosulfan sulphate). Dichlofuanid and captan (100% degradation in the model
sample after 7 h) were recovered at ∼2.5% after 0.5 h and no signal for either OCP was
obtained after 24 h, so, although both were adsorbed on SM, they continued to be
degraded or the adsorption occurred in an irreversible manner. On the other hand,

7/18/2019 Automatizacion y Miniaturizacion de Sistemas de Screening y Determinacion de Residuos de Plaguicidas en Muestra Agroalimentaria
http://slidepdf.com/reader/full/automatizacion-y-miniaturizacion-de-sistemas-de-screening-y-determinacion-de 259/393
dicofol was readily extracted from suspended matter (with recoveries of 85 and 75%
after 0.5 and 24 h, respectively), probably because it was reversibly adsorbed. Finally,
recoveries at 0.5 h for the other OCPs, recoveries at 0.5 h were 20% for procymidone,
10% for HCH isomers and 6% for vinclozolin. This differential behaviour can be
ascribed to the majority of the OCPs being irreversibly adsorbed/degraded on SM as the
likely result of their trapping on the matter, which was reversible in dicofol as this OCP
is probably bound via weak chemical interactions [19].
Almudena Columé Díaz Tesis Doctoral
ACKNOWLEDGMENTS
This work was supported by a grant (PB95-0977) from the Spain's CICyT. The
authors also wish to acknowledge Mr. J. M. Seoane and Mrs. M.P. Llavero for their
kind supply of some of the water samples.

7/18/2019 Automatizacion y Miniaturizacion de Sistemas de Screening y Determinacion de Residuos de Plaguicidas en Muestra Agroalimentaria
http://slidepdf.com/reader/full/automatizacion-y-miniaturizacion-de-sistemas-de-screening-y-determinacion-de 260/393
Organoclorados y Piretroides en Muestras Acuosas Capítulo IV
REFERENCES
[1] R.J.C.A. Steen, I.L. Freriks, W.P. Cofino, U.A.Th. Brinkman , Anal. Chim. Acta
353 (1997) 153.
[2] T.A. Albanis, D.G. Hela, T.M. Sakellarides, I.K. Konstantinou , J. Chromatogr.
A 823 (1998) 59.
[3] Community Directive 80/778/CEE , Off. J. Eur.Commun. L229/11. European
Community. Brussels, 1980.
[4] M. Fielding, D. Barceló, A. Helwweg, S. Galassi, L. Torstensson, P. van
Zoonen, R. Wolter, G. Angeletti, Pesticides in Ground and Drinking Water
(Water Pollution Research Report, 27), Commission of the European
Communities, Brussels, 1992, 1.
[5] A R Fernández Alba A Agüera M Contreras G Peñuela I Ferrer D

7/18/2019 Automatizacion y Miniaturizacion de Sistemas de Screening y Determinacion de Residuos de Plaguicidas en Muestra Agroalimentaria
http://slidepdf.com/reader/full/automatizacion-y-miniaturizacion-de-sistemas-de-screening-y-determinacion-de 261/393
[5] A.R. Fernández-Alba, A. Agüera, M. Contreras, G. Peñuela, I. Ferrer, D.
Barceló , J. Chromatogr. A 823 (1998) 35.
[6] E. Pocurull, C. Aguilar, F. Borrull, R.M. Marcé , J. Chromatogr. A 818 (1998)
85.
[7] A. Termonia, M. Termonia , J. High Resolut. Chromatogr. 20 (1997) 447.
[8] E. Baltussen, H.G. Janssen, P. Sandra, C.A. Cramers, J. High Resolut.
Chromatogr . 20 (1997) 395.
[9] A.A. Boyd-Boland, S. Magdic, J.B. Pawliszyn , Analyst 121 (1996) 929.
[10] I. Vassilakis, D. Tsipi, M. Scoullos, J. Chromatogr. A 823 (1998) 49.
ili di ll l ( )
Almudena Columé Díaz Tesis Doctoral
[12] J.J. Ridal, M.E. Fox, C.A. Sullivan, R.J. Maguire, A. Mazumder, D.R.S. Lean,
Anal. Chem. 69 (1997) 711.
[13] W.C. Quayle, I. Jepson, I.A. Fowlis , J. Chromatogr. A 773 (1997) 271.
[14] M.T. Almeida, P.M.A.R. Conceiçao, M.F. Alpendurada , Analusis 25 (1997) 51.
[15] K.K. Chee, M.K. Wong, H.K. Lee, Anal. Chim. Acta 330 (1996) 217.
[16] L.A. Berrueta, B. Gallo, F. Vicente , Chromatographia 40 (1995) 474.
[17] C. Tomlin (Ed.), The Pesticide Manual, 10th
edn., British Crop Protection
Council, The Royal Society of Chemistry, London, 1994.
[18] J.H. Hermans, F. Smedes, J.W. Hofstraat, W.P. Cofino , Environ. Sci. Technol.
26 (1992) 2028.
[19] D.E. Wells, Trends Anal. Chem. 13 (1994) 339.
[20] S Fingler B Tkalcevic Z Fröbe V Drevenkar Analyst 119 (1994) 1135

7/18/2019 Automatizacion y Miniaturizacion de Sistemas de Screening y Determinacion de Residuos de Plaguicidas en Muestra Agroalimentaria
http://slidepdf.com/reader/full/automatizacion-y-miniaturizacion-de-sistemas-de-screening-y-determinacion-de 262/393
[20] S. Fingler, B. Tkalcevic, Z. Fröbe, V. Drevenkar , Analyst 119 (1994) 1135.
Organoclorados y Piretroides en Muestras Acuosas Capítulo IV
Abstract
This paper assesses the potential of Fourier transform infrared spectrometry (FTIR) to
Assessment FTIR Spectrometry for pesticide screening ofaqueous samples
A. Columé 1, J. Diewok 2, B. Lendl 2 1 Analytical Chemistry Division, Campus de Rabanales, University of Córdoba, E-140 71 Córdoba, Spain
2 Institute of Analytical Chemistry, Vienna University of Technology, Getreidemarkt 9-151, A-1060 Wien, Austria
Vibrational Spectroscopy (2001) submitted for its publication
VibrationalSpectroscopy
7/18/2019 Automatizacion y Miniaturizacion de Sistemas de Screening y Determinacion de Residuos de Plaguicidas en Muestra Agroalimentaria
http://slidepdf.com/reader/full/automatizacion-y-miniaturizacion-de-sistemas-de-screening-y-determinacion-de 263/393
be used in pesticide screening and rapid determination of selected pyrethroid and organochlorine
pesticides in fresh water. FTIR spectra of 28 single pesticides in dry state were recorded on a
horizontal diamond attenuated total reflection element. Hierarchical cluster analysis of the
recorded FTIR spectra (spectral range: 4000-500 cm-1) showed that different pesticide groups
could be distinguished. A representative (dichlofuanid, captan and fenpropathrin) of each main
group was selected and their direct simultaneous determination in fresh water without using achromatographic separation step investigated. The developed analysis procedure comprised a
liquid-liquid extraction step with n-hexane, further automated clean-up and preconcentration by
solid-phase extraction using a silica minicolumn and final elution of the analyte with ethyl
acetate. The extract containing the analytes was further concentrated and dried on the ATR
element for spectrum acquisition. Using a partial least square calibration it could be shown that
all three analytes could be quantified in fresh water in a concentration range from 1.2 to 4.8
µ /L R i f di hl f id t d f th i f f tifi d t d i t
Almudena Columé Díaz Tesis Doctoral
1. INTRODUCTION
The use of pesticides, in order to prevent pests and plant diseases, is a risk to
human health. Pesticide residues remain on agricultural goods and, also, are moved
from agricultural fields to fresh surfaces, drinking and ground waters. Pyrethroid and
organochlorine pesticides (OCPs) are a wide group of fungicides and insecticides
extensively used in many agricultural applications. International organizations have
established rigid limits for pesticides in drinking water, being 0.1 µg/L for single
pesticides and 0.5 µg/L for total pesticide concentration, in the case of European Union
[1], and between 1 µg/L and 1 µg/mL for individual pesticides, in the case of US-EPA
[2].
Pyrethroid and OCPs are usually determined by gas chromatographic (GC)

7/18/2019 Automatizacion y Miniaturizacion de Sistemas de Screening y Determinacion de Residuos de Plaguicidas en Muestra Agroalimentaria
http://slidepdf.com/reader/full/automatizacion-y-miniaturizacion-de-sistemas-de-screening-y-determinacion-de 264/393
techniques, using different detectors, such as electron capture detectors (ECD) [3,4] or
mass spectrometry [3,5-7]. However, Fourier Transform Infrared (FTIR) spectrometry
has gained wide acceptance on this field by virtue of its remarkable usefulness for both
qualitative and quantitative analysis, but is limited by the high concentration of analyte
required for detection. In this context, a literature survey of available methods for the
determination of pesticides using FTIR, shows that many of them are applied to
agrochemical formulations [8-11], where these analytes are present at high
concentration. Recently, automatic methods using flow analysis (FA) have been
developed for pesticide formulation analysis [12,13]. Direct determination of
Organoclorados y Piretroides en Muestras Acuosas Capítulo IV
chloroform and measurement in solution was investigated too [14]. On the other hand,
FTIR is also employed as detector in high performance liquid chromatography [15],
supercritical fluid chromatography [16] and gas chromatography [17-19]. The main
advantage of chromatographic techniques is that they provide a chemical separation of
a complex mixture of analytes prior to FTIR spectrometry, but this separation step is
very time-consuming.
The aim of this work was to assess the potential of FTIR spectrometry for
screening of water samples for pyrethroid and organochlorine pesticides by combining
FTIR with a solid-phase extraction (SPE) preconcentration step and avoiding a
chromatographic separation. Two main aspects were taken into account in this work:
i) The evaluation of the information content of ATR-FTIR spectra of pesticides,
using hierarchical cluster analysis, in order to determine which classes of pesticides can

7/18/2019 Automatizacion y Miniaturizacion de Sistemas de Screening y Determinacion de Residuos de Plaguicidas en Muestra Agroalimentaria
http://slidepdf.com/reader/full/automatizacion-y-miniaturizacion-de-sistemas-de-screening-y-determinacion-de 265/393
be, in principle, recognized. Based on this evaluation, 3 analytes from different clusters
were selected for the subsequent screening in water samples.
ii) The development of a technique based on a continuous solid-phase
extraction system, which allows recording of high quality ATR-FTIR spectra of traceamounts of pesticides in aqueous solutions, and establishing a PLS calibration for
simultaneous determination of 3 pesticides. This technique comprises a liquid-liquid
extraction step of water samples with n-hexane, clean-up and preconcentration of the n-
hexane extracts with a flow system based on a SPE step using a silica column, elution
f h l i h h l d di f f h d i d h l
Almudena Columé Díaz Tesis Doctoral
2. EXPERIMENTAL
2.1. Instruments and apparatus
A Bruker IFS 66 FTIR spectrometer, equipped with a horizontal ATR cell
(Dura SamplIR, SensIR Technologies, CT, USA) and a deuterated triglycine sulfate
(DTGS) detector, was used. The spectrometer was controlled using the software
package OPUS 3.0/IR (Bruker, Germany). All spectra were recorded in the region from
4000 to 500 cm-1. Each spectrum was based on 128 co-added scans at a spectral
resolution of 4 cm-1. Hierarchical clustering was performed in OPUS 3.0 and the PLS
calibrations were established with OPUS NT 3.1.
The flow system was constructed with a Gilson Minipuls-3 peristaltic pump
(Villiers-le-Bel, France) furnished with Solvaflex pump tubing, two Rheodyne 5041
injection valves, PTFE tubing (0.5 mm i.d.) and commercially available connectors.

7/18/2019 Automatizacion y Miniaturizacion de Sistemas de Screening y Determinacion de Residuos de Plaguicidas en Muestra Agroalimentaria
http://slidepdf.com/reader/full/automatizacion-y-miniaturizacion-de-sistemas-de-screening-y-determinacion-de 266/393
injection valves, PTFE tubing (0.5 mm i.d.) and commercially available connectors.
The sorbent glass column (2 cm x 4 mm i.d.) was hand-packed with 50 mg of silica and
sealed at both ends with small cotton beads to prevent material losses. The sorbent
column was sequentially conditioned with 0.5 mL of acetonitrile and 1 mL of n-hexane
prior to each sample. This column can be reused for at least three months, working
daily, including a washing step with 0.5 mL of isopropanol before conditioning.
2.2. Chemicals and standard solutions
All chemicals and sorbents were of analytical grade or better. The following
Organoclorados y Piretroides en Muestras Acuosas Capítulo IV
dicloran, dicofol, dieldrin, α, β-endosulfan (3:1, w/w), endosulfan sulphate, endrin,
hexachlorobenzene (HCB), heptachlor, iprodione, α-, β-, δ-, γ -hexachlorohexane (α-,
β-, δ- and γ -HCH 1:1:1:1, w/w), methoxychlor, procymidone, vinclozolin, bifenthrin, λ-
cyhalothrin, deltamethrin, fenpropathrin, fenvalerate (cis and trans isomers), permethrin
(cis and trans isomers), cyfluthrin isomers, cypermethrin isomers, and piperonyl
butoxide. All were obtained from Riedel-de-Haën (Seelze, Germany). The silica sorbent
was obtained from Varian (Zug, Switzerland). HPLC grade solvents (ethyl acetate, n -
hexane, isopropanol, acetonitrile) were purchased from Sigma-Aldrich (Vienna,
Austria).
Stock standard solutions of each pesticide were prepared in acetone (except
HCB that was dissolved in dichloromethane) at concentrations of 5 mg/mL, and stored
in glass stoppered bottles in the dark at 4 °C. Working standard solutions were obtained
7/18/2019 Automatizacion y Miniaturizacion de Sistemas de Screening y Determinacion de Residuos de Plaguicidas en Muestra Agroalimentaria
http://slidepdf.com/reader/full/automatizacion-y-miniaturizacion-de-sistemas-de-screening-y-determinacion-de 267/393
g pp g
by appropriate dilution with n-hexane or acetone.
2.3. Protocol for preconcentration, clean-up and measurement by ATR-FTIR
spectrometry
The continuous clean-up system designed is shown in Figure 1. A volume of 10
mL of the n-hexane phase obtained from pesticide standards or aqueous samples after
liquid-liquid extraction (see next section) was aspirated at 2 mL/min. Dichlofuanid,
captan and/or fenpropathrin concentration in n-hexane phase was 0.0-0.2 µg/mL. All
Almudena Columé Díaz Tesis Doctoral
Figure 1. Experimental set-up for screening of pesticides in water samples. P=peristaltic pump;IV=injection valve; W=waste; FTIR=Fourier transform infrared spectrometer. (1)=Liquid-liquidextraction of water sample; (2)=Clean-up and preconcentration by continuous SPE system;(3)=Recording of ATR-FTIR.
n-hexane extract
mL/min
Ethyl acetate
IV2
275 µL
2
Air
Silica
IV1
1 W
FTIR
N2
Step 1 Step 2 Step 3
n-hexane extract
mL/min
Ethyl acetate
IV2
275 µL
2
Air
Silica
IV1
1 W
FTIR
N2
Step 1 Step 2 Step 3

7/18/2019 Automatizacion y Miniaturizacion de Sistemas de Screening y Determinacion de Residuos de Plaguicidas en Muestra Agroalimentaria
http://slidepdf.com/reader/full/automatizacion-y-miniaturizacion-de-sistemas-de-screening-y-determinacion-de 268/393
valve 1 (IV1), and the sample matrix was sent to waste. Simultaneously, the loop of the
second injection valve (IV2) was filled with ethyl acetate by means of a syringe. Any
residual organic solvent remaining inside the column and the connectors was flushed by
passing an air stream through the carrier line at 1 mL/min for 4 min. Next, IV2 was
switched to pass the loop contents (275 µL of ethyl acetate) at 1 mL/min through the
column, in opposite direction to the sample, in order to elute the pesticides. The whole
organic extract was collected in a glass vial, evaporated to dryness under a N 2 stream
and redissolved in 10 µL of ethyl acetate. A 5 µL aliquot was transferred onto the ATR
l d ll d d S d d f l d i f h l
Organoclorados y Piretroides en Muestras Acuosas Capítulo IV
Between samples, the sorbent column was cleaned, without removal from the
continuous SPE system, with 0.5 mL of isopropanol and then conditioned with 0.5 mL
of acetonitrile and 1 mL of n-hexane. Under these conditions, the sorbent column was
useable for about three months.
2.4. Water sample pretreatment and liquid-liquid extraction
Apart from the synthetic pesticide standards in n-hexane, aqueous samples wereanalysed with a previous liquid-liquid extraction step. Fresh water samples from Vienna
rivers and tap water were collected in amber glass bottles. A volume of 1 mL of 0.1 M
Na2S2O3 per liter of water sample (final concentration of 10 -4 M) was added on site to
suppress the interferences of chlorine and humic and fulvic acids. All samples were
filtered through a Micro Separations Inc. 0.45 µm nylon filter (Westboro, MA, USA) to

7/18/2019 Automatizacion y Miniaturizacion de Sistemas de Screening y Determinacion de Residuos de Plaguicidas en Muestra Agroalimentaria
http://slidepdf.com/reader/full/automatizacion-y-miniaturizacion-de-sistemas-de-screening-y-determinacion-de 269/393
remove particulate matter. In order to avoid degradation of some of the pesticides under
alkaline conditions [20], the pH of all water samples was adjusted to 5-6. Water
samples were kept in the dark at 4°C from collection to analysis, being analysed within
two days. A volume of 0.5 L of water sample was placed into an extraction funnel with12 mL of n-hexane. The mixture was shaken for 10 min and allowed to settle. Then, 10
mL of the n-hexane phase were continuously aspirated into the flow system.
3. RESULTS AND DISCUSSION
Almudena Columé Díaz Tesis Doctoral
below) and to evaluate the information content and similarity of the FTIR spectra of 28
different organochlorine and pyrethroid pesticides.
3.1. Optimization of ATR measurements
To remove the interfering absorbance of the solvent (ethyl acetate) [21], the
samples were allowed to dry on the ATR crystal. In order to achieve the maximum
sample volume which provides a homogeneous dry film on the ATR crystal, different
volumes of ethyl acetate between 1 and 10 µL, containing 1 µg of dichlofuanid were
tested. Spectra were recorded and results showed that the maximum applicable volume
was 5 µL. For higher volumes, spectra were less reproducible, as solvent evaporation
forced the analyte to form a ring on the ATR crystal limits.
7/18/2019 Automatizacion y Miniaturizacion de Sistemas de Screening y Determinacion de Residuos de Plaguicidas en Muestra Agroalimentaria
http://slidepdf.com/reader/full/automatizacion-y-miniaturizacion-de-sistemas-de-screening-y-determinacion-de 270/393
3.2. Hierarchical cluster analysis of FTIR spectra of pesticides
In order to perform hierarchical cluster analysis FTIR spectra of 19
organochlorine pesticides (OCPs) and 9 pyrethroid pesticides were recorded after
transferring 1 µL aliquots of 1 mg/mL solutions in acetone onto the ATR crystal and
allowing to dry. The FTIR spectra were vector normalized and Ward’s algorithm was
used for clustering and creating dendrograms. Different wavenumber regions from 4000
to 500 cm-1 of the normalized spectra were tested, obtaining optimal results with the
spectral region between 575 and 1850 cm-1. The clustering results are shown in Figure
Organoclorados y Piretroides en Muestras Acuosas Capítulo IV
Figure 2. Dendogram calculated from the normalized MIR spectra of 19 organochlorine pesticides and 9 pyrethroid pesticides. Pesticides selected for PLS are marked with a circle.CA=aldrin; CB=dieldrin; CC=endrin; CD=captafol; CE=captan; CF=dichlofuanid;CG=chlordane; CH=endosulfan sulphate; CI=α-,β-endosulfan; CJ=heptachlor;
0
0.5
2
1
3
1.5
2.5
3.5
C A
D i s t a n c e ( a r b i t r a r y u n i t s )
C B
C G
C J
C C
C Q
C S
C F
C H
C I
C M
C O
C N
C P
C D
C K
C E
C R
P H
C L
P A
P D
P B
P C
P G
P F
P E
P I
0
0.5
2
1
3
1.5
2.5
3.5
C A
D i s t a n c e ( a r b i t r a r y u n i t s )
C B
C G
C J
C C
C Q
C S
C F
C H
C I
C M
C O
C N
C P
C D
C K
C E
C R
P H
C L
P A
P D
P B
P C
P G
P F
P E
P I

7/18/2019 Automatizacion y Miniaturizacion de Sistemas de Screening y Determinacion de Residuos de Plaguicidas en Muestra Agroalimentaria
http://slidepdf.com/reader/full/automatizacion-y-miniaturizacion-de-sistemas-de-screening-y-determinacion-de 271/393
CK=procymidone; CL=vinclozolin; CM=chlorbensid; CN=dicloran; CO=dicofol; CP=HCB;CQ=α-,β-,γ -,δ-HCH; CR=iprodione; CS=methoxychlor; PA=bifenthrin; PB=cyfluthrin;PC=deltamethrin; PD=λ-cyhalothrin; PE=permethrin; PF=fenvalerate; PG=fenpropathrin;PH=cypermethrin; PI=piperonyl butoxide.
3.3. Determination of selected pesticides in water
According to the clustering results, one pesticide from each cluster was selected
for consequent multianalyte determination by PLS calibration: dichlofuanid, captan and
fenpropathrin. The corresponding spectra are shown in Figure 3.
The proposed FTIR screening method of pesticides in waters can be divided
Almudena Columé Díaz Tesis Doctoral
2. Clean-up and preconcentration of the n-hexane phase using a continuous
SPE system.
3. Transfer of the preconcentrated extract onto the ATR and recording of FTIR
spectrum of the dried extract.
4. Quantitation based on PLS calibration (established using standards in n-
hexane).
In the next sections the optimisation of the continuous SPE system, the
establishing of the PLS calibration and the analysis of water samples including
optimisation of the extraction step will be described in detail.
0,25
0,30
0,25
0,30

7/18/2019 Automatizacion y Miniaturizacion de Sistemas de Screening y Determinacion de Residuos de Plaguicidas en Muestra Agroalimentaria
http://slidepdf.com/reader/full/automatizacion-y-miniaturizacion-de-sistemas-de-screening-y-determinacion-de 272/393
Wavenumber (cm-1)
60080010001200140016001800
A b s o r b a n c e u n i t s
0,00
0,05
0,10
0,15
0,20
Dichlofluanid
Fenpropathrin
Captan
Wavenumber (cm-1)
60080010001200140016001800
A b s o r b a n c e u n i t s
0,00
0,05
0,10
0,15
0,20
Dichlofluanid
Fenpropathrin
Captan
Organoclorados y Piretroides en Muestras Acuosas Capítulo IV
3.4. Continuous SPE system
Recently, our working group has developed a method for the determination of
organochlorine (OCPs) and pyrethroid pesticides in fruits and vegetables based on
automated sample preparation and clean-up using a flow system and final separation
and quantitation by GC-ECD [22,23]. In these investigations it was found that for
sample clean-up a liquid-liquid extraction step with n-hexane followed by further SPE
using a silica column and elution of the analytes with ethyl acetate was highly efficient.
For the present study the experimental conditions optimised for GC-ECD detection had
to be adopted to the needs of ATR-FTIR spectrometry. However, as the minimum
amount of pesticide on the ATR needed to obtain satisfying FTIR spectra was between
0.1 and 0.2 µg the flow system was modified in order to handle bigger analyte amounts.
The sorbent capacity of the 50 mg silica column was evaluated in previous
7/18/2019 Automatizacion y Miniaturizacion de Sistemas de Screening y Determinacion de Residuos de Plaguicidas en Muestra Agroalimentaria
http://slidepdf.com/reader/full/automatizacion-y-miniaturizacion-de-sistemas-de-screening-y-determinacion-de 273/393
works [22,23], being ∼14 µg of pesticide, which was sufficient for the present FTIR
study. Therefore only the effect of the eluent volume had to be studied. The elution
volume was varied in the range of 175 to 500 µL and the completeness of elution
checked by a second elution step. Complete elution of analytes was obtained with asingle injection of 275 µL of ethyl acetate.
In order to achieve maximum preconcentration, n-hexane solutions of 5 to 20
mL (20 mL being the previously determined [22,23] breakthrough volume) containing
2 µg of dichlofuanid, captan and fenpropathrin were passed through the flow system.
Almudena Columé Díaz Tesis Doctoral
bigger the n-hexane volume, the stronger was the influence of these impurities in the
final spectra. Because of this solvent purity problem, a loaded n-hexane volume of 10
mL was selected as a compromise between maximum preconcentration factor and
optimal spectral quality.
Figure 4 shows the ATR-FTIR spectra of a 10 mL n-hexane blank and a 10 mL
pesticide standard (0.2 µ g/mL dichlofuanid, captan and fenpropathrin) after continuous
SPE treatment and drying as described in Experimental Section.
0 10
0,15
0,20
n c e u n i t s
0 10
0,15
0,20
n c e u n i t s

7/18/2019 Automatizacion y Miniaturizacion de Sistemas de Screening y Determinacion de Residuos de Plaguicidas en Muestra Agroalimentaria
http://slidepdf.com/reader/full/automatizacion-y-miniaturizacion-de-sistemas-de-screening-y-determinacion-de 274/393
Figure 4. ATR-FTIR spectra of a 10 mL n-hexane blank (1) and a 10 mL pesticide standard (0.2µg/mL dichlofuanid, captan and fenpropathrin) (2, offset: 0.03) after continuous SPE treatmentand drying as described in Experimental Section.
60080010001200140016001800
0,00
0,05
0,10
1
2
Wavenumber (cm-1)
A b s o r b a n
60080010001200140016001800
0,00
0,05
0,10
1
2
Wavenumber (cm-1)
A b s o r b a n
Organoclorados y Piretroides en Muestras Acuosas Capítulo IV
3.5. Partial least square calibration
The PLS calibration set comprised the following samples (Table 1): samples
(no. 1-8) of 10 mL n-hexane solutions containing all possible ternary combinations of
the three selected pesticides at two concentration levels; samples (no. 9-11) containing
only one of the pesticides, samples (no. 12-17) containing binary and ternary
combinations at varying concentrations and solutions (no. 18-20) without analytes (flow
system blanks). All these solutions were in the range of 0.00 to 0.2 µg/mL for the
analytes (corresponding to 0.0 to 4.8 µg/L in 0.5 L water samples). 10 mL of all
calibration standards were prepared and passed through the flow system in duplicate.
Calibration models were validated by cross-validation, using a leave-one-out procedure.
Because of the influence of the solvent impurities in the spectra, it was
important to select the optimal wavenumber range in the calibration method. Several
t t d t ti ith th f ll t Th l t d t ki i t

7/18/2019 Automatizacion y Miniaturizacion de Sistemas de Screening y Determinacion de Residuos de Plaguicidas en Muestra Agroalimentaria
http://slidepdf.com/reader/full/automatizacion-y-miniaturizacion-de-sistemas-de-screening-y-determinacion-de 275/393
ranges were tested starting with the full spectra. Then, ranges were selected taking into
account spectral regions where the flow system blank spectrum exhibited lower
absorptions and each analyte spectrum exhibited higher absorptions. Regions where the
flow system blank spectrum dominated the total spectrum were excluded from
calibration. For each pesticide separately, calibration models were constructed using
different wavenumber ranges and their combinations, and original, first- and second-
derivative data were used.
Almudena Columé Díaz Tesis Doctoral
Table 1. Analyte concentrations in n-hexane phase for the differentmixtures of the calibration set.
Concentration (µg/mL)Sample numberDichlofuanid Captan Fenpropathrin
1 0.2 0.2 0.2
2 0.2 0.2 0.05
3 0.2 0.05 0.2
4 0.05 0.2 0.2
5 0.2 0.05 0.05
6 0.05 0.05 0.2
7 0.05 0.2 0.05
8 0.05 0.05 0.05
9 0.1 0.0 0.0
10 0.0 0.1 0.0
11 0.0 0.0 0.1
12 0.1 0.1 0.05
13 0.1 0.05 0.2
14 0.07 0.1 0.0715 0.0 0.1 0.07
16 0 2 0 0 0 1

7/18/2019 Automatizacion y Miniaturizacion de Sistemas de Screening y Determinacion de Residuos de Plaguicidas en Muestra Agroalimentaria
http://slidepdf.com/reader/full/automatizacion-y-miniaturizacion-de-sistemas-de-screening-y-determinacion-de 276/393
16 0.2 0.0 0.1
17 0.05 0.07 0.0
18 0.0 0.0 0.0
19 0.0 0.0 0.0
20 0.0 0.0 0.0
The results were always better using first-derivative data (Savitzky-Golay with
13 smoothing points) than original spectra, and the best model for each pesticide was
constructed using a combination of different wavenumber ranges. Parameters for these
optimal models are listed in Table 2. The optimal number of PLS components was four
Organoclorados y Piretroides en Muestras Acuosas Capítulo IV
solvent impurities. The root mean square error of cross validation (RMSECV) was
acceptable, ranging between 0.015 and 0.019 µg/mL.
Table 2. PLS calibration parameters for the three selected pesticides, using first-derivative preprocessing.
PesticideWavelength
intervals (cm-1)PLS components R 2 RMSECV
Dichlofuanid 1504-1476990-920
890-785
4 93.72 0.171
Captan 1825-1789700-540
4 95.16 0.149
Fenpropathrin 1423-14031355-13301000-990890-785
4 92.68 0.193
3.6. Application to water samples
Prior to the screening of water samples the n hexane liquid liquid extraction

7/18/2019 Automatizacion y Miniaturizacion de Sistemas de Screening y Determinacion de Residuos de Plaguicidas en Muestra Agroalimentaria
http://slidepdf.com/reader/full/automatizacion-y-miniaturizacion-de-sistemas-de-screening-y-determinacion-de 277/393
Prior to the screening of water samples, the n-hexane liquid-liquid extraction
step was optimised. For this purpose 0.5 L of water samples containing 10 µg/L of each
pesticide were used. n-Hexane volumes from 10 to 50 mL and extraction times of 2 to
15 min were investigated. The minimum volume of n-hexane and minimum time
required for complete extraction of the analytes were found to be 10 mL and 10 min,
respectively.
The proposed system was applied to the screening of dichlofuanid, captan and
fenpropathrin in tap and river waters. In all cases, the pH of the water samples ranged
Almudena Columé Díaz Tesis Doctoral
possible after collection. No natural samples containing pesticide residues at detectable
concentrations could be obtained, therefore a recovery test was carried out.
Recoveries of analytes were studied in tap and river water. For this purpose,
volumes of 0.5 L of each water were preconditioned as described in Experimental
Section, and fortified with 1.2 µg of each selected pesticide from standard solutions in
acetone. After the addition, the spiked water was slightly shaken and then analysed in
triplicate, using the proposed method. Results are shown in Table 3. In both cases, the
lowest recoveries were obtained for captan, which can be ascribed to its being either
partially irreversibly bound to the matrices or degraded during contamination time, as
shown in previous studies with water samples [3].
Table 3. Mean recoveries (± RSD) in the analysis of tap and river water spiked at 2.4 µg/L(n=3).

7/18/2019 Automatizacion y Miniaturizacion de Sistemas de Screening y Determinacion de Residuos de Plaguicidas en Muestra Agroalimentaria
http://slidepdf.com/reader/full/automatizacion-y-miniaturizacion-de-sistemas-de-screening-y-determinacion-de 278/393
Water sample Dichlofuanid Captan Fenpropathrin
Tap water 88 ± 4 66 ± 6 102 ± 7
River water 92 ± 3 70 ± 7 89 ± 3
4. CONCLUSIONS
This study clearly showed the capability of FTIR spectrometry to group
pesticides according to their chemical structure as well as their simultaneous
quantitative determination in fresh water samples. For the latter purpose FTIR spectra
Organoclorados y Piretroides en Muestras Acuosas Capítulo IV
difficulty encountered, however, was the strong spectral influence of remaining matrix
molecules and solvent impurities. Nevertheless, due to the high information content of
FTIR spectrometry this technique holds promise to be used in fast screening methods
which would allow fast qualitative information on the pesticide contamination of a
sample and simultaneously providing information on the group of pesticides present.
Development of such fast screening techniques is one of the current goals in modern
analytical chemistry. These techniques are needed for fast decision making and to allow
the efficient use of expensive and time consuming standard methods for pesticide
analysis which mostly require a chromatographic separation step and subsequent
sensitive detection of the separated analytes. Future work will therefore concentrate on
improving the sample clean-up step which was identified as the key for successful
screening analysis by FTIR spectrometry.

7/18/2019 Automatizacion y Miniaturizacion de Sistemas de Screening y Determinacion de Residuos de Plaguicidas en Muestra Agroalimentaria
http://slidepdf.com/reader/full/automatizacion-y-miniaturizacion-de-sistemas-de-screening-y-determinacion-de 279/393
ACKNOWLEDGMENTS
A. Columé is grateful for a training fellowship at the Marie Curie Training Site
on Advanced and Applied Vibrational Spectroscopy (ADVIS) in Vienna. Further S.D.
and B.L. thank the Austrian Science Fund for further financial support within the
project 13686.
Almudena Columé Díaz Tesis Doctoral
REFERENCES
[1] Official Journal of the European Communities L229/11, Community Directive
80/778/CCE (European Community, Brussels, 1980).
[2] F. Regan, M. Meaney, J. G. Vos, B. D. MacCraith, and J. E. Walsh, Anal.
Chim. Acta 334 (1996) 85.
[3] A. Columé, S. Cárdenas, M. Gallego, and M. Valcárcel, Talanta 54 (2001) 943.
[4] T. A. Albanis, D. G. Hela, T. M. Sakellarides, and I. K. Konstantinou, J.
Chromatogr. A 823 (1998) 59.
[5] A. R. Fernández-Alba, A. Agüera, M. Contreras, G. Peñuela, I. Ferrer, and D.
Barceló, J. Chromatogr. A 823 (1998) 35.
[6] E. Pocurrull, C. Aguilar, F. Borrull, and R.M. Marcé, J. Chromatogr. A 818
(1998) 85.
[7] A Termonia and M Termonia J High Resolut Chromatogr 20 (1997) 447
7/18/2019 Automatizacion y Miniaturizacion de Sistemas de Screening y Determinacion de Residuos de Plaguicidas en Muestra Agroalimentaria
http://slidepdf.com/reader/full/automatizacion-y-miniaturizacion-de-sistemas-de-screening-y-determinacion-de 280/393
[7] A. Termonia and M. Termonia, J. High Resolut. Chromatogr . 20 (1997) 447.
[8] M. J. Almond and S. J. Knowles, Appl. Spectrosc. 53 (1999) 1128.
[9] K. K. Sharma, S. Gupta, and S. K. Handa, Talanta 44 (1997) 2075.
[10] M. Gallignani, S. Garrigues, A. Martinez-Vado, and M. de la Guardia, Analyst
118 (1993) 1043.
[11] A. R. Cassella, R. Jorgensen-Cassella, S. Garrigues, R. E. Santelli, R. C. de
Campos, and M. de la Guardia, Analyst 125 (2000) 1829.
[12] A. R. Cassella, S. Garrigues, R. C. de Campos and M. de la Guardia, Talanta
Organoclorados y Piretroides en Muestras Acuosas Capítulo IV
[13] R. Zanella, R. M. Dallago, E. M. M. Flores, A. F. Martins, Analytical Letters
32 (1999) 593 .
[14] S. Gaguirres, M. de la Guardia, A. R. Cassella, R. C. de Campos, R. E. Santelli,
R. Jorgensen, Analyst 125 (2000) 1829.
[15] J. C. Jones, D. Littlejohn, and P. R. Griffiths, Appl. Spectrosc. 53 (1999) 792.
[16] K. L. Norton and P. R. Griffiths, J. Chromatogr. A 703 (1995) 503.
[17] D. F. Gurka, S. Pyle, R. Titus, and E. Shafter, Anal. Chem. 66 (1994) 2521.
[18] J. Knecht, Spectrosc. Eur . 4 (1992) 21.
[19] T. Visser and M. J. Vredenbregt, Anal. Chim. Acta 240 (1990) 205.
[20] C. Tomlin (Ed.), The Pesticide Manual, 10th Ed.,British Crop Protection
Council (The Royal Society of Chemistry, London, 1994).
[21] A. Edelmann, J. Diewok, K. C. Schuster, and B. Lendl, J. Agric. Food Chem.
49 (2001) 1139.

7/18/2019 Automatizacion y Miniaturizacion de Sistemas de Screening y Determinacion de Residuos de Plaguicidas en Muestra Agroalimentaria
http://slidepdf.com/reader/full/automatizacion-y-miniaturizacion-de-sistemas-de-screening-y-determinacion-de 281/393
[22] A. Columé, S. Cárdenas, M. Gallego, and M. Valcárcel, J. Agric. Food Chem.
49 (2001) 1109.
[23] A. Columé, S. Cárdenas, M. Gallego, and M. Valcárcel, Anal. Chim. Acta 436
(2001) 153.

7/18/2019 Automatizacion y Miniaturizacion de Sistemas de Screening y Determinacion de Residuos de Plaguicidas en Muestra Agroalimentaria
http://slidepdf.com/reader/full/automatizacion-y-miniaturizacion-de-sistemas-de-screening-y-determinacion-de 282/393
CAP ITU LO V:
PLAGUICIDAS ORGANOCLORADOS
Y METABOLITOS DE PIRET ROIDES
EN FLUIDOS BIOLOGICOS
CHAPTER V:
ORGANOCHLORINE P ESTICIDES AND
PYR ETHROID METABOLITES
IN BIOLOGICAL FLUIDS

7/18/2019 Automatizacion y Miniaturizacion de Sistemas de Screening y Determinacion de Residuos de Plaguicidas en Muestra Agroalimentaria
http://slidepdf.com/reader/full/automatizacion-y-miniaturizacion-de-sistemas-de-screening-y-determinacion-de 283/393
CAPITULO V
AGUAS
HORTALIZASFRUTAS
ORGANOCLORADOS
PIRETROIDES
EVAPORACION
SPE
MUESTRAS
FLUIDOSBIOLOGICOS

7/18/2019 Automatizacion y Miniaturizacion de Sistemas de Screening y Determinacion de Residuos de Plaguicidas en Muestra Agroalimentaria
http://slidepdf.com/reader/full/automatizacion-y-miniaturizacion-de-sistemas-de-screening-y-determinacion-de 284/393
Organoclorados y Metabolitos de Piretroides en Fluidos Biológicos Capítulo V

7/18/2019 Automatizacion y Miniaturizacion de Sistemas de Screening y Determinacion de Residuos de Plaguicidas en Muestra Agroalimentaria
http://slidepdf.com/reader/full/automatizacion-y-miniaturizacion-de-sistemas-de-screening-y-determinacion-de 285/393
Los aplicadores y trabajadores de las plantas de fabricación y formulación de
plaguicidas presentan un gran riesgo de contaminación por estas sustancias tóxicas. Los
plaguicidas pueden ser absorbidos por el organismo a través de tres vías: dérmica,
respiratoria y oral. La absorción a través de la piel puede deberse a contactos directos
con el plaguicida, o bien como consecuencia de su vehiculación a través del aire. La vía
dérmica se considera la principal en la aplicación en el campo, y también juega un
papel importante en la exposición de los trabajadores en las plantas de formulación y,
Almudena Columé Díaz Tesis Doctoral
aunque en general todos los fumigantes pueden ser absorbidos por esta vía.
Probablemente la exposición oral más importante ocurre como consecuencia de
salpicaduras accidentales de plaguicida líquido dentro de la boca, y también por
frotamientos de la zona bucal, o el hecho de comer o fumar, con las manos
contaminadas. Además, las sustancias inhaladas pueden ser absorbidas secundariamente
por vía digestiva [1].
El control biológico contempla la absorción por estas tres vías, proporcionando
el mejor reflejo de la exposición laboral a plaguicidas. Este método está basado en los
conocimientos sobre metabolismo (toxocinética) y mecanismos de acción
(toxodinamia) de estas sustancias en el organismo humano. Los indicadores biológicos
de exposición son principalmente la orina y la sangre. En el caso de los plaguicidas
organoclorados, éstos pueden acumularse en el tejido adiposo. Cuando se produce una
pérdida de este tejido, los plaguicidas en él acumulados pasan al torrente sanguíneo,

7/18/2019 Automatizacion y Miniaturizacion de Sistemas de Screening y Determinacion de Residuos de Plaguicidas en Muestra Agroalimentaria
http://slidepdf.com/reader/full/automatizacion-y-miniaturizacion-de-sistemas-de-screening-y-determinacion-de 286/393
donde pueden ser determinados sin metabolizar. A partir de aquí pueden excretarse
como tales [2,3] o como metabolitos, aunque se han identificados muy pocos (ej. el
DDT se excreta en orina como DDA). Sin embargo, los piretroides son metabolizados
completamente, dando lugar fundamentalmente a tres metabolitos en orina: DCCA,
DBCA y PBA [4-6].
En este capítulo se desarrolla una metodología automática para la evaluación
por exposición a plaguicidas organoclorados y piretroides, la cual se aplicó al análisis
Organoclorados y Metabolitos de Piretroides en Fluidos Biológicos Capítulo V
REFERENCIAS
[1] E. Alday et al., Toxicología Laboral Básica, Instituto Nacional de Seguridad e
Higiene en el Trabajo, Sevilla, 1989.
[2] K. Wittke, H. Hajimiragha, L. Dunemann, J. Begerow, LaborPraxis, 24
(2000)62.
[3] E. E. Petty, J. J. Johnston, S. A. Volz, J. Chromatogr. Sci. 35 (1997) 430.
[4] Directiva Comunitaria 76/895/CEE , DO L 340, Comunidad Europea, Bruselas,
1976.
[5] F. J. Arrebola, J. L. Martínez-Vidal, A. Fernández-Gutierrez, M. H. Akhtar,
Anal. Chim. Acta 401 (1999) 45.
[6] G. Leng, K. H. Kuehn, A. Leng, W. Gries, J. Lewalter, H. Idel,
Chromatographia 46 (1997) 265.

7/18/2019 Automatizacion y Miniaturizacion de Sistemas de Screening y Determinacion de Residuos de Plaguicidas en Muestra Agroalimentaria
http://slidepdf.com/reader/full/automatizacion-y-miniaturizacion-de-sistemas-de-screening-y-determinacion-de 287/393

7/18/2019 Automatizacion y Miniaturizacion de Sistemas de Screening y Determinacion de Residuos de Plaguicidas en Muestra Agroalimentaria
http://slidepdf.com/reader/full/automatizacion-y-miniaturizacion-de-sistemas-de-screening-y-determinacion-de 288/393
Organoclorados y Metabolitos de Piretroides en Fluidos Biológicos Capítulo V
Abstract
A screening method has been developed for the determination of 23 organochlorine
Solid-phase extraction method for the screening anddetermination of pyrethroid metabolites and organochlorine
pesticides in human urineA. Columé, S. Cárdenas, M. Gallego, M. Valcárcel
Analytical Chemistry Division, Campus de Rabanales, University of Córdoba, E-14071 Córdoba, Spain
Received 9 July 2001; received in revised form 22 August 2001; accepted 23 August 2001
Rapid Commun. Mass Spectrom. 15 (2001) 2007-2013
RapidCommunications
in Mass Spectrometry

7/18/2019 Automatizacion y Miniaturizacion de Sistemas de Screening y Determinacion de Residuos de Plaguicidas en Muestra Agroalimentaria
http://slidepdf.com/reader/full/automatizacion-y-miniaturizacion-de-sistemas-de-screening-y-determinacion-de 289/393
pesticides (OCPs) and 3 pyrethroid metabolites [cis- and trans-3-(2,2-dichlorovinyl)-2,2-
dimethyl-(1-cyclopropane) carboxylic acid, cis-3-(2,2-dibromovinyl)-2,2-dimethyl-(1-
cyclopropane) carboxylic acid and 3-phenoxybenzoic acid] from human urine. OCPs were
directly detected in urine samples while pyrethroid metabolites required acid-induced hydrolysis
to convert their conjugates into free acids; all compounds were then cleaned-up/preconcentrated
using solid-phase extraction. Determination and quantitation was achieved by gas
chromatography with a mass spectrometer detector operating in selected ion monitoring mode.
Limits of detection varied between 0.1 and 0.3 ng/mL with linear ranges from 0.3 to 700 ng/mL;
the precision of the method was high (4.3-7.2 %). Recoveries of all analytes from urine samples
fortified at levels of 30 ng/mL for each OCP and 15 ng/mL for each pyrethroid metabolite
Almudena Columé Díaz Tesis Doctoral
1. INTRODUCTION
Pesticides have the capacity to cause adverse effects due to their biocide
properties, therefore being dangerous for people exposed to them. Usually, subjects
who apply pesticides in agricultural fields or work in pesticide factories, are the most
likely to suffer acute and chronic intoxications. Many factors are involved in pesticide
toxicity, such the physical and chemical properties of the pesticide, exposure conditions
or individual human factors. The most important absorption routes for exposed people
are through the skin and by inhalation [1-8]. Organochlorine pesticides (OCPs) and
pyrethroids are widely used to control pests in yields and, in addition pyrethroids are
employed as home insecticides. In urine samples, OCPs are mainly found as their
parent forms, while pyrethroids are rapidly metabolized being then eliminated as
conjugates [9-11].
Rapid analytical systems are of increased interest for biological monitoring. In
hi i id i i i i i d i b i id i l

7/18/2019 Automatizacion y Miniaturizacion de Sistemas de Screening y Determinacion de Residuos de Plaguicidas en Muestra Agroalimentaria
http://slidepdf.com/reader/full/automatizacion-y-miniaturizacion-de-sistemas-de-screening-y-determinacion-de 290/393
this context, pesticide monitoring in urine is a good option, because it provides a simple
matrix and non-invasive collection. Pyrethroid metabolites are usually determined in
urine by using gas chromatographic techniques (GC) with mass spectrometric (MS)
[12-15] or electron capture detection (ECD) [16]. Liquid-liquid extraction (LLE) with
n-hexane is the most commonly used sample pretreatment [12-16], requiring in some
cases additional solid-phase extraction (SPE) on RP-C18 [12,13] or silica-gel cartridges
[16]. GC is unmatched in terms of resolution and sensitivity of detectors but requires
Organoclorados y Metabolitos de Piretroides en Fluidos Biológicos Capítulo V
carboxylic acid metabolites with methanol [15] or hexafluoroisopropyl (HFIP) with
diisopropylcarbodiimide (DIC) [12-14,16]. OCPs do not require derivatization for their
chromatographic separation on account of their higher volatility. Only one method has
been proposed for their determination in human urine, which used ECD detection [17].
Several approaches have been devised for separation of the analytes from
matrix elements and preconcentration purposes, implementing liquid-liquid extraction
and solid-phase extraction. LLE is used to a lesser extent however, due to its inherent
disadvantages (viz. laborious, time-consuming manipulations, the need to use large
volumes of sample and organic solvents). SPE has rapidly established itself as an
alternative to the sample pretreatment as it provides many advantages, including high
recoveries of analytes, effective concentration, highly purified extracts and easy
automation which drastically reduces the organic solvent consumption [18]. In this
context, the aim of the proposed method was to develop an automatic, fast and sensitive
SPE method for the screening and determination of OCPs and pyrethroid metabolites in
7/18/2019 Automatizacion y Miniaturizacion de Sistemas de Screening y Determinacion de Residuos de Plaguicidas en Muestra Agroalimentaria
http://slidepdf.com/reader/full/automatizacion-y-miniaturizacion-de-sistemas-de-screening-y-determinacion-de 291/393
SPE method for the screening and determination of OCPs and pyrethroid metabolites in
urine samples for human monitoring. Taking into account that pyrethroids are
extensively metabolized through conjugation, hydrolysis of urine samples is required in
order to obtain their respective free carboxylic acids, which are further derivatized. This
previous step is not needed for determination of OCPs as they are excreted unchanged,
which simplifies the analytical procedure. Hydrolyzed or non-hydrolyzed urine samples
were clean-up and preconcentrated onto a RP-C18 minicolumn, being the eluate injected
Almudena Columé Díaz Tesis Doctoral
2. EXPERIMENTAL SECTION
2.1. Chemicals and standards
Stock standard solutions of aldrin, captan, captafol, chlorbensid, chlordane,
dichlofuanid, dichloran, dicofol, dieldrin, α- and β-endosulfan (3:1, w/w), endosulfan
sulphate, endrin, hexachlorobenzene (HCB), heptachlor, iprodione, α-, β-, δ- and γ -
hexachlorohexane (α-, β-, δ- and γ -HCH 1:1:1:1, w/w), methoxychlor, procymidone,
vinclozolin and λ-cyhalothrin (internal standard, IS) [supplied by Riedel-de-Haën(Seelze, Germany)], were prepared in acetone (with the exception of HCB which was
dissolved in dichloromethane), at concentrations of 5 mg/mL. Pyrethroid metabolites:
cis- and trans-3-(2,2-dichlorovinyl)-2,2-dimethyl-(1-cyclopropane) carboxylic acid (cis-
and trans-DCCA), cis-3-(2,2-dibromovinyl)-2,2-dimethyl-(1-cyclopropane) carboxylic
acid (cis-DBCA) and 3-phenoxybenzoic acid (PBA) were commercially available from
Dr. Ehrenstorfer (Augsburg, Germany) and prepared in methanol, at concentrations of 2

7/18/2019 Automatizacion y Miniaturizacion de Sistemas de Screening y Determinacion de Residuos de Plaguicidas en Muestra Agroalimentaria
http://slidepdf.com/reader/full/automatizacion-y-miniaturizacion-de-sistemas-de-screening-y-determinacion-de 292/393
µg/mL (DCCA, DBCA) and 20 µg/mL (PBA). RP-C18 HPLC sorbent was supplied by
Sigma (Madrid, Spain). Derivatization reagents: 1,1,1,3,3,3-hexafluoroisopropanol
(HFIP) and diisopropylcarbodiimide (DIC) were supplied from Aldrich (Madrid,Spain). Solvents (ethyl acetate, n-hexane, methanol) were purchased from Merck
(Darmstadt, Germany).
All stock standard solutions were stored in glass stoppered bottles in the dark at
4°C. Individual and cumulative working standard solutions were obtained by
Organoclorados y Metabolitos de Piretroides en Fluidos Biológicos Capítulo V
reagents was prepared by mixing DIC, HFIP and ethyl acetate (eluent) at volume ratios
of 5 + 10 + 85.
2.2. Equipment
Pesticide separation were carried out on a Fisons 8000 GC instrument interfaced to
a Fisons MD800 mass spectrometer and controlled by a computer running MASSLAB
software (ThermoQuest, Madrid, Spain) and using a fused silica capillary column (30 m
x 0.25 mm i.d., 0.25 µm) coated with 5% phenyl-methylpolysiloxane (Supelco, Madrid,
Spain). Ultrapure helium (6.0 Air Liquide), at a flow-rate of 1 mL/min, was employed
as the carrier gas. For OCP determination, the column was maintained at 70ºC for 10
min and programmed from 70ºC to 285ºC at 10ºC/min, holding for 10 min at 270ºC. In
the case of pyrethroid metabolite determination, the temperature programme was as
above but without holding at 270ºC for 10 min. The injection port and transfer line
temperatures were maintained at 225°C and 300°C respectively The ion source
7/18/2019 Automatizacion y Miniaturizacion de Sistemas de Screening y Determinacion de Residuos de Plaguicidas en Muestra Agroalimentaria
http://slidepdf.com/reader/full/automatizacion-y-miniaturizacion-de-sistemas-de-screening-y-determinacion-de 293/393
temperatures were maintained at 225°C and 300°C, respectively. The ion source
temperature was 200°C for the 70 eV electron impact ionization mode. The mass
spectrometer was operated in the selected ion monitoring (SIM) mode, selecting three
m/z values for each analyte which are listed in Table 1. For quantitation, the particular
ion in each case was selected on the basis of sensitivity and selectivity. In all analyses,
1 µL of the organic extract was injected in the split mode (1:25 ratio).
The flow system comprised a peristaltic pump (Gilson Minipuls-2) and two
Almudena Columé Díaz Tesis Doctoral
aqueous solutions and n-hexane/methanol solvents, respectively, PTFE tubing (0.5 mm
i.d.) and commercially available connectors were also employed. A sorbent column was
prepared by packing a commercial Omnifit glass column (2 cm x 2.5 mm i.d.) with ∼40
mg of RP-C18 sorbent material; small cotton beads were used on the ends to prevent
material losses. A glass column (3 cm x 5 mm i.d., packed with cotton wool) was also
constructed for filtration purposes.
2.3. Sampling and hydrolysis of urine samples
Urine samples were collected in sterilized containers and frozen immediately (-
20ºC) until analysis. For pyrethroid metabolite determination, the conjugates were
hydrolyzed by heating 3 mL of urine sample plus 0.5 mL of concentrate H2SO4 in a
screw-capped glass centrifuge tube, which was immersed in an oil bath at 100ºC for 1
h. After cooling at room temperature, the hydrolyzed urine sample was adjusted to pH 2
with dilute NaOH up to 5 mL For OCP determination 3 mL of urine sample were
7/18/2019 Automatizacion y Miniaturizacion de Sistemas de Screening y Determinacion de Residuos de Plaguicidas en Muestra Agroalimentaria
http://slidepdf.com/reader/full/automatizacion-y-miniaturizacion-de-sistemas-de-screening-y-determinacion-de 294/393
with dilute NaOH up to 5 mL. For OCP determination, 3 mL of urine sample were
diluted in a glass tube to 5 mL with distilled water being adjusted to pH 3 with dilute
HNO3. Then, the whole sample volume (5 mL), containing the analytes, was
continuously aspirated and filtered into the solid-phase extraction system of Figure 1.
2.4. Solid-phase extraction method
The continuous SPE system used to extract the pyrethroid metabolites or OCPs
Organoclorados y Metabolitos de Piretroides en Fluidos Biológicos Capítulo V
containing 0.3-700 ng/mL of analytes, was aspirated at 0.5 mL/min through a cotton
filter to prevent suspended particles from reaching the continuous unit. All analytes
were adsorbed on the RP-C18 column located in the loop of injection valve 1 (IV1), and
the sample matrix was sent to waste. Simultaneously, the loop of the second injection
valve (IV2) was filled with the eluent containing the derivatizing reagent for pyrethroid
metabolites (10% HFIP, 5% DIC and 1 µg/mL of IS in ethyl acetate) by means of a
syringe. Traces of aqueous solution from the sample remaining inside the column and
the connectors were flushed by passing an air stream through the sample line at 0.5
mL/min for 4 min. Next, IV2 was switched and the loop contents (250 µL of
eluent/derivatizing reagent) driven by an air stream at 0.2 mL/min through the column,
in the opposite direction to the sample, in order to elute analytes. The whole organic
extract was collected in a glass vial containing anhydrous sodium sulphate and a 1 µL
aliquot was injected into the gas chromatograph for analysis. Between samples, the
sorbent column was cleaned with 250 µL of 3 mol/L HNO followed of 250 µL of

7/18/2019 Automatizacion y Miniaturizacion de Sistemas de Screening y Determinacion de Residuos de Plaguicidas en Muestra Agroalimentaria
http://slidepdf.com/reader/full/automatizacion-y-miniaturizacion-de-sistemas-de-screening-y-determinacion-de 295/393
sorbent column was cleaned with 250 µL of 3 mol/L HNO3 followed of 250 µL of
methanol by filling the loop of IV2, to remove potentially retained interferents. Finally,
the column was conditioned with 0.5 mL of ethyl acetate and 1 mL of aqueous solution
at pH 2. Under these conditions, the sorbent column was serviceable for about two
weeks.
Almudena Columé Díaz Tesis Doctoral
Urine sample
RP-C18
GC-MS
Air
P
Filter
W
0.5
mL/min
IV1
IV2
250 µµµµL
0.2
Eluent/derivatizing reagent
Urine sample
RP-C18
GC-MS
Air
P
Filter
W
0.5
mL/min
IV1
IV2
250 µµµµL
0.2
Eluent/derivatizing reagent
Figure 1. Continuous flow system developed for the preconcentration/clean-up of OCPs and pyrethroid metabolites in urine samples. P=pump; IV=injection valve; W=waste; GC-MS=gaschromatograph with mass spectrometric detector.

7/18/2019 Automatizacion y Miniaturizacion de Sistemas de Screening y Determinacion de Residuos de Plaguicidas en Muestra Agroalimentaria
http://slidepdf.com/reader/full/automatizacion-y-miniaturizacion-de-sistemas-de-screening-y-determinacion-de 296/393
3. RESULTS AND DISCUSSION
In the present work, organochlorine and pyrethroid pesticides (authorized and
forbidden) have been selected taking into account that they are extensively used in the
control of agricultural, forestry and stored products pests, and then potential
contaminants for pest control operators. In mammals, pyrethroids are rapidly
metabolized into their carboxylic acids [10-12], being eliminated in urine as conjugates
Organoclorados y Metabolitos de Piretroides en Fluidos Biológicos Capítulo V
O
O
CN O Cl
Fenvalerate
O
O
Y O X
Z W
Pyrethroids
Pyrethroid Parent Forms
OH O
Cl 2 - ClBA
OH O X
W
cis and trans - DCCA cis - DBCA
O
HO O
Z
PBA
Pyrethroid Metabolites
HYD
ROL
OFTHEESTE
EXC
O
O
CN O Cl
Fenvalerate
O
O
Y O X
Z W
Pyrethroids
Pyrethroid Parent Forms
O
O
CN O Cl
Fenvalerate
O
O
Y O X
Z W
Pyrethroids
Pyrethroid Parent Forms
OH O
Cl 2 - ClBA
OH O X
W
cis and trans - DCCA cis - DBCA
O
HO O
Z
PBA
Pyrethroid Metabolites
OH O
Cl 2 - ClBA
OH O X
W
cis and trans - DCCA cis - DBCA
O
HO O
Z
PBA
Pyrethroid Metabolites
HYD
ROL
OFTHEESTE
EXC
HYDROLYSISOF THE ESTER

7/18/2019 Automatizacion y Miniaturizacion de Sistemas de Screening y Determinacion de Residuos de Plaguicidas en Muestra Agroalimentaria
http://slidepdf.com/reader/full/automatizacion-y-miniaturizacion-de-sistemas-de-screening-y-determinacion-de 297/393
Figure 2. General structures of pyrethroids and their main metabolites in mammals. λ-Cyhalothrin (W=CF3; X=Cl; Y=CN; Z=H); permethrin (W=X=Cl; Y=H; Z=H); cyfluthrin(W=X=Cl; Y=CN; Z=F); cypermethrin (W=X=Cl; Y=CN; Z=H); deltamethrin (W=X=Br;Y=CN; Z=H); 2-ClBA=2-(4-chlorophenyl)-3-methylbutyric acid; cis and trans-DCCA=cis-and trans-3-(2,2-dichlorovinyl)-2,2-dimethyl-(1-cyclopropane) carboxylic acid; cis-
Elimination with theurine through partialconjugation mainlyas
glucuronide derivatives
CRETIO
Elimination with theurine through partialconjugation mainlyas
glucuronide derivatives
Elimination with theurine through partialconjugation mainly as
glucuronide derivatives
CRETIO
EXCRETION
Almudena Columé Díaz Tesis Doctoral
mainly their metabolites cis- and trans-DCCA, cis-DBCA and 3-phenoxybenzoic acid
(PBA), while fenvalerate is converted into PBA and 2-(4-chlorophenyl)-3-
methylbutyric acid (2-ClBA). On the other hand, only a small fraction (lower than 10
%) of OCPs are metabolized, so that the parent forms could be found after exposition in
urine and blood samples. A total of 23 OCPs was included in this study and, with
respect to pyrethroid metabolites, cis- and trans-DCCA, cis-DBCA and PBA were
selected. 2-ClBA was not included in this work because the standard product was not
available; notwithstanding this, its identification could be achieved by using its mass
spectrum, if required.
3.1. Optimization of the solid-phase extraction system
In order to apply the method directly to urine samples, all experiments were
carried out by preparing the analytes in aqueous medium. Preliminary experiments were
aimed at selecting the best sorbent and eluent for the SPE system. For this purpose, non

7/18/2019 Automatizacion y Miniaturizacion de Sistemas de Screening y Determinacion de Residuos de Plaguicidas en Muestra Agroalimentaria
http://slidepdf.com/reader/full/automatizacion-y-miniaturizacion-de-sistemas-de-screening-y-determinacion-de 298/393
polar (RP-C18) and polar (silica gel) sorbents were tested. First, the adsorption
efficiency was examined by using columns packed with 60 mg of each sorbent material
and aliquots of 5 mL of aqueous solution (pH 5), containing 50 ng/mL of each analyte
(OCPs and pyrethroid metabolites), was aspirated at 0.5 mL/min through each column.
These aliquots of 5 mL of sample were collected in glass vials before (100% recovery)
and after (variable adsorption recovery) the sorbent column, extracted with 5 mL of
Organoclorados y Metabolitos de Piretroides en Fluidos Biológicos Capítulo V
acetate) was spiked with 1% and 1.5% of HFIP and DIC, respectively [12,14] A 1 µL
aliquot of the extract was analyzed by GC. After each sample had been processed, the
column was rinsed with ethyl acetate for 1 min to remove potentially adsorbed analytes.
RP-C18 exhibited the best sorption properties (∼100% adsorption) whereas silica gel
only provided average recoveries of ∼60%. Different eluents (ethyl acetate, n-hexane
and methanol) were evaluated with the RP-C18 column at a fixed volume of 300 µL,
using a configuration similar to that depicted in Figure 1. Complete elution was only
achieved with ethyl acetate; the other solvents provided lower efficiency (60% for n-
hexane and 80% for methanol). The amount of sorbent material was optimized between
20 and 80 mg of RP-C18. Chromatographic signals increased with increasing amount of
sorbent up to 40 mg, beyond which they remained virtually constant. A working
column packed with 40 mg RP-C18, and 250 µL of ethyl acetate as eluent were adopted
for further experiments.
The influence of sample pH on the retention of OCPs and pyrethroid
7/18/2019 Automatizacion y Miniaturizacion de Sistemas de Screening y Determinacion de Residuos de Plaguicidas en Muestra Agroalimentaria
http://slidepdf.com/reader/full/automatizacion-y-miniaturizacion-de-sistemas-de-screening-y-determinacion-de 299/393
e ue ce o sa p e p o t e ete t o o OC s a d py et o d
metabolites was studied over the range 1-9, adjusted with dilute HNO3 or NaOH. Aldrin
was the only OCP whose chromatographic signals remained almost constant in the
interval assayed; for the rest of the OCPs, chromatographic areas increased with
increasing pH, remaining virtually constant over the range 3.0-6.5, but decreasing at
higher pH values. Pyrethroid metabolites have the maximum adsorption at pH 2,
decreasing drastically at pH 3. Based on these two tendencies and taking in account that
Almudena Columé Díaz Tesis Doctoral
selected as a compromise in order to prepare the standards in aqueous medium. By
using 5 mL of aqueous standard solutions at pH 2 containing 50 ng/mL of each analyte,
the influence of the sample and eluent flow-rate were examined over the range 0.1-1.0
mL/min. The best results were obtained at lower flow-rates as they ensured efficient
retention and elution, thus resulting in higher chromatographic peak areas; so, 0.5 and
0.2 mL/min were chosen as sample and eluent flow-rate, respectively.
For derivatization of pyrethroid metabolites, the most usual reagent
recommended in manual methods [12,14], a mixture of HFIP plus DIC, was selected.
For this purpose, 5 mL of aqueous standards at pH 2 containing cis and trans-DCCA,
cis-DBCA and PBA at a concentration of 50 ng/mL, was aspirated into the SPE system
depicted in Figure 1. The derivatizing reagent was spiked at different concentrations
and ratios to the eluent. The maximum peak areas and the best chromatographic
resolution were obtained for a mixture of 10% (v/v) of HFIP and 5% (v/v) of DIC in
ethyl acetate. The selected derivatizing reagent, spiked to the eluent, was tested on a

7/18/2019 Automatizacion y Miniaturizacion de Sistemas de Screening y Determinacion de Residuos de Plaguicidas en Muestra Agroalimentaria
http://slidepdf.com/reader/full/automatizacion-y-miniaturizacion-de-sistemas-de-screening-y-determinacion-de 300/393
standard solution containing only the 23 OCPs studied (50 ng/mL of each one in
aqueous medium); the absence of interactions with the OCPs confirmed that pyrethroid
metabolites and OCPs could be determined jointly by using the same SPE system.
Finally, the optimized SPE unit was tested for human urine. Aliquots of 3 mL
of urine blank (uncontaminated of OCPs and pyrethroids) was spiked with 250 ng of
each OCP and pyrethroid metabolites, adjusted to pH 2, diluted to 5 mL and then
Organoclorados y Metabolitos de Piretroides en Fluidos Biológicos Capítulo V
m/z values selected for identification and quantitation of the analytes (SIM mode), then
made possible the discrimination of all pesticides in urine samples.
3.2. Analytical figures of merit
The performance and reliability of the proposed on-line method (Figure 1) were
assessed by determining the line of regression, linear range, analyte detectability and
relative standard deviation for the analytes assayed. For this purpose, microliters of
standard solutions in methanol containing all pesticides at variable concentrations were
spiked to individual urine blank volumes of 3 mL, in the interval 0.1-700 ng/mL,
adjusted to pH 2 (final volume 5 mL) and passed through the sorbent column. λ-
Cyhalothrin was used as IS in preference to others because it was found to be
compatible with the chromatographic behavior of the analytes and because if it was
present in real samples, it would be completely metabolized, and hence it would not
interfere in the proposed method; it was added to the eluent at a concentration of 1

7/18/2019 Automatizacion y Miniaturizacion de Sistemas de Screening y Determinacion de Residuos de Plaguicidas en Muestra Agroalimentaria
http://slidepdf.com/reader/full/automatizacion-y-miniaturizacion-de-sistemas-de-screening-y-determinacion-de 301/393
µg/mL. The curves were constructed by plotting the analyte-to-IS peak area ratio
against the analyte concentration. Figures of merit of the proposed method are listed in
Table 1. The detection limits (LOD) are calculated as the minimum concentration
providing chromatographic signals three times higher than the background noise. The
linear range was between 0.5 and 350 ng/mL for the majority of the analytes. The
precision (repeatibility) was calculated as the relative standard deviation obtained by
Almudena Columé Díaz Tesis Doctoral
Table 1. Figures of merit and m/z SIM values.
Compound LOD (ng/mL) Linear range (ng/mL) Sensitivitya (10-4) m/z b Recovery (%)
cis and trans-DCCA
0.1 0.3-350 3.83 163, 191, 323 93
cis-DBCA 0.1 0.5-350 0.97 172, 253, 367 100
PBA 0.1 0.5-350 5.87 141, 197, 364 101
α-HCH 0.2 0.5-350 24.65 111, 181, 219 94
HCB 0.1 0.5-350 8.65 249, 282, 284 98
Dichloran 0.1 0.5-350 6.66 124, 176, 206 97
β-HCH 0.1 0.5-350 18.33 109, 181, 219 93
γ -HCH 0.1 0.5-350 19.65 111, 181, 219 101
δ-HCH 0.1 0.5-350 16.29 111, 181, 219 90
Vinclozolin 0.1 0.5-350 8.36 187, 212, 285 99
Heptachlor 0.2 0.7-350 8.71 100, 272, 370 92
Dichlofuanid 0.2 0.7-350 5.80 123, 224, 332 95
Aldrin 0.1 0.5-350 11.78 66, 263, 298 100
Dicofol 0.1 0.5-350 4.17 111, 139, 250 97
Captan 0.3 1.0-350 11.49 79, 264, 299 88Procymidone 0.1 0.5-350 28.02 96, 255, 283 96
Chlorbensid 0.1 0.5-350 36.64 125, 127, 268 97
Chlordane 0.1 0.5-350 3.28 202, 373, 408 101
α-Endosulfan 0.1 0.5-700 1.45 195, 241, 339 98
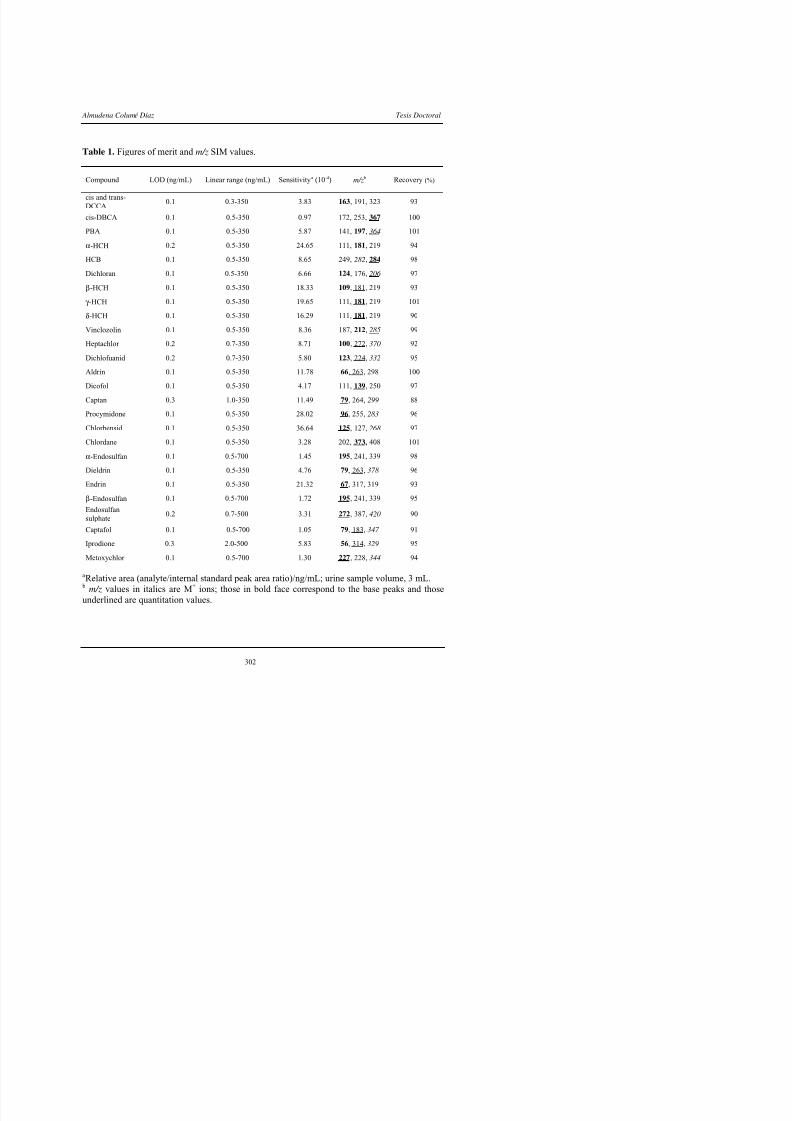
7/18/2019 Automatizacion y Miniaturizacion de Sistemas de Screening y Determinacion de Residuos de Plaguicidas en Muestra Agroalimentaria
http://slidepdf.com/reader/full/automatizacion-y-miniaturizacion-de-sistemas-de-screening-y-determinacion-de 302/393
Dieldrin 0.1 0.5-350 4.76 79, 263, 378 96
Endrin 0.1 0.5-350 21.32 67, 317, 319 93
β-Endosulfan 0.1 0.5-700 1.72 195, 241, 339 95
Endosulfansulphate
0.2 0.7-500 3.31 272, 387, 420 90
Captafol 0.1 0.5-700 1.05 79, 183, 347 91
Iprodione 0.3 2.0-500 5.83 56, 314, 329 95
Metoxychlor 0.1 0.5-700 1.30 227, 228, 344 94
aRelative area (analyte/internal standard peak area ratio)/ng/mL; urine sample volume, 3 mL. b m/z values in italics are M+ ions; those in bold face correspond to the base peaks and thoseunderlined are quantitation values.
Organoclorados y Metabolitos de Piretroides en Fluidos Biológicos Capítulo V
concentration range of the calibration graphs and ranged from 4.3 to 7.2%. Figure 3
shows the full scan mass spectra corresponding to the three derivatized pyrethroid
metabolites from an aqueous standard solution at pH 2. The three m/z values selected
for the SIM mode acquisition are indicated in the spectra and the corresponding
fragments are represented on the top of each spectrum. OCPs spectra are not included
as they are more common and available in commercial libraries.
3.3. Applications
Since pyrethroid metabolites are mainly eliminated in urine as conjugates, an acid
hydrolysis is needed to convert their conjugates into free acids. Taking into account that
the standards of pyrethroids metabolites are not commercially available, the acid
hydrolysis procedure recommended in manual methods [12, 13, 15] was adopted, which
uses concentrate H2SO4 and heating at 100ºC for 1 h.
In order to perform only one analysis per sample and thus obtain one
7/18/2019 Automatizacion y Miniaturizacion de Sistemas de Screening y Determinacion de Residuos de Plaguicidas en Muestra Agroalimentaria
http://slidepdf.com/reader/full/automatizacion-y-miniaturizacion-de-sistemas-de-screening-y-determinacion-de 303/393
chromatogram, the influence of the hydrolysis process on OCPs was evaluated (even
though they are excreted unchanged). For this purpose, urine blank samples containing
50 ng/mL of each OCP were hydrolyzed as described under “Sampling and hydrolysis
of urine samples” but the results showed that OCPs were decomposed (∼80%) during
the hydrolysis process. From the above experiments it can be concluded that it is
impossible to determine both families of compounds jointly and therefore two
Almudena Columé Díaz Tesis Doctoral
cis-DBCA
A)
100
%
0
323
B)
100
%
0
364
C)
cis and trans-DCCA
PBA
197
141
191
163O
OCl
Cl F3
F3163
191
O
O
O
F3
F3 197
169
169 m/z-CO
Br O F3172
M+-Cl
169
M+
cis-DBCA
A)
100
%
0
323
B)
100
%
0
364
C)
cis and trans-DCCA
PBA
197
141
191
163O
OCl
Cl F3
F3163
191
O
O
O
F3
F3 197
169
169 m/z-CO
Br O F3172
M+-Cl
169
M+

7/18/2019 Automatizacion y Miniaturizacion de Sistemas de Screening y Determinacion de Residuos de Plaguicidas en Muestra Agroalimentaria
http://slidepdf.com/reader/full/automatizacion-y-miniaturizacion-de-sistemas-de-screening-y-determinacion-de 304/393
0150 450350250 300200 400
172
)
367
253
m/z
Br O
3
F3253
172
M+-Br
%
100
0150 450350250 300200 400
172
)
367
253
m/z
Br O
3
F3253
172
M+-Br
%
100
Organoclorados y Metabolitos de Piretroides en Fluidos Biológicos Capítulo V
optimal pH, so a sample pH of 2 and 3 was selected for pyrethroid metabolites and
OCPs determination, respectively.
In order to validate the proposed SPE method for the screening/determination of
OCPs and pyrethroid metabolites in urine samples a recovery study was conducted. A
volume of 25 mL of an uncontaminated sample, spiked with 30 ng/mL of each OCP
(sample A) and an equal volume of urine spiked with 15 ng/mL of each pyrethroid
metabolite (sample B) were prepared. Aliquots of 3 mL of sample A were adjusted to
pH 3 and introduced into the SPE system for OCP determination. Aliquots of sample B
were hydrolyzed and adjusted to pH 2 for pyrethroid metabolite determination using the
SPE method developed. Each sample was spiked three times and analyzed in duplicate
(n=6). Table 1 gives the average recovery values obtained for each spiked analyte.
Recoveries ranged from 88% (captan) to 101%, which testifies to the high accuracy of
the proposed method.
The present work is included in a research project concerning organochlorine (23
d ) d h id (12 d ) i id d i i i i l l

7/18/2019 Automatizacion y Miniaturizacion de Sistemas de Screening y Determinacion de Residuos de Plaguicidas en Muestra Agroalimentaria
http://slidepdf.com/reader/full/automatizacion-y-miniaturizacion-de-sistemas-de-screening-y-determinacion-de 305/393
compounds) and pyrethroid (12 compounds) pesticide determination in agricultural
samples. This is why the proposed multiresidue method was applied to the screening of
urine samples from a researcher who worked with all the analytes included in this study
and from a non-exposed researcher. Urine samples were collected every two months
during two years (12 samples from each one), being analyzed in triplicate. Five samples
from the exposed researcher were found to contain residues of OCPs or pyrethroid
Almudena Columé Díaz Tesis Doctoral
As can be seen, only one sample was found to contain pyrethroid metabolites at
detectable levels, being impossible to determine the parent compound, whereas OCPs
(mainly dicofol) were present in the five positive samples.
Table 2. Determination of OCPs and pyrethroid metabolites in urine samples from an exposedresearcher. All concentrations are expressed in ng/mL (n=3).
Sample Pesticide found Concentration ± SD
1 Undetected -
2 Endosulfan sulphate 1.6 ± 0.1
3 Undetected -
4 Captafol 17 ± 1
5-8 Undetected -
9 Dicofol 23 ± 2
10 Dicofol 0.6 ± 0.1
11 Undetected -
12 PBA 2.1 ± 0.2
cis and trans DCCA 0.8 ± 0.1Dicofol 19 ± 2

7/18/2019 Automatizacion y Miniaturizacion de Sistemas de Screening y Determinacion de Residuos de Plaguicidas en Muestra Agroalimentaria
http://slidepdf.com/reader/full/automatizacion-y-miniaturizacion-de-sistemas-de-screening-y-determinacion-de 306/393
ACKNOWLEDGMENTS
This work was supported by a grant PB-95-0977 from Spain’s DGICyT.
Organoclorados y Metabolitos de Piretroides en Fluidos Biológicos Capítulo V
REFERENCES
[1] Environmental Health Criteria 82 Cypermethrin, WHO, Geneva, 1989.
[2] Environmental Health Criteria 94 Permethrin, WHO, Geneva, 1990.
[3] Environmental Health Criteria 99 Cyhalothrin, WHO, Geneva, 1990.
[4] Environmental Health Criteria 97 Deltamethrin, WHO, Geneva, 1990.
[5] Environmental Health Criteria 95 Fenvalerate, WHO, Geneva, 1990.
[6] Environmental Health Criteria 142 alfa-Cypermethrin, WHO, Geneva, 1992.
[7] E. Alday, Toxicología Laboral Básica, Instituto Nacional de Seguridad e
Higiene en el Trabajo, Sevilla, Chapter 12, 1989.
[8] P. Curry, S. Iyengar, Rev. Environ. Contam. Toxicol. 129 (1992) 79.
[9] G. T. Brooks, Xenobiotica 16 (1986) 989.
[10] D. M. Sonderlund, Xenobiotica 22 (1992) 1185.
[11] K.R. Huckle, D. H. Huston, P. Millburn, Drug Metab. Disp. 9 (1981) 352.
[12] F. J. Arrebola, J. L. Martínez-Vidal, A. Fernández-Gutierrez, M. H. Akhtar,
Anal Chim Acta 401 (1999) 45

7/18/2019 Automatizacion y Miniaturizacion de Sistemas de Screening y Determinacion de Residuos de Plaguicidas en Muestra Agroalimentaria
http://slidepdf.com/reader/full/automatizacion-y-miniaturizacion-de-sistemas-de-screening-y-determinacion-de 307/393
Anal. Chim. Acta 401 (1999) 45.
[13] J. Angerer, A. Ritter, J. Chromatogr. B 695 (1997) 217.
[14] G. Leng, K. H. Küehn, A. Leng, W. Gries, J. Lewalter, H. Idel,
Chromatographia 46 (1997) 265.
[15] K. H. Küehn, G. Leng, K. A. Bucholski, L. Dunemann, H. Idel,
Chromatographia 43 (1996) 285.
Almudena Columé Díaz Tesis Doctoral
[18] M. Valcárcel, M. Gallego, S. Cárdenas, Current Practice of Gas
Chromatography-Mass Spectrometry, W. M. A. Niessen (Ed.) Marcel Dekker,
New York, 2001, Chapter 9.

7/18/2019 Automatizacion y Miniaturizacion de Sistemas de Screening y Determinacion de Residuos de Plaguicidas en Muestra Agroalimentaria
http://slidepdf.com/reader/full/automatizacion-y-miniaturizacion-de-sistemas-de-screening-y-determinacion-de 308/393
CAPITU LO VI:
RES ULTADOS Y CONCLUSIONE S
CHAPTER VI:RESULTS AN D CONCLUSIONS

7/18/2019 Automatizacion y Miniaturizacion de Sistemas de Screening y Determinacion de Residuos de Plaguicidas en Muestra Agroalimentaria
http://slidepdf.com/reader/full/automatizacion-y-miniaturizacion-de-sistemas-de-screening-y-determinacion-de 309/393
CAPITULO VI

7/18/2019 Automatizacion y Miniaturizacion de Sistemas de Screening y Determinacion de Residuos de Plaguicidas en Muestra Agroalimentaria
http://slidepdf.com/reader/full/automatizacion-y-miniaturizacion-de-sistemas-de-screening-y-determinacion-de 310/393
Resultados y Conclusiones Capítulo VI
VI.1. DISCUSION GENERAL DE LOS RESULTADOS
A lo largo de esta Memoria se ha abordado la determinación de dos grupos de
plaguicidas, organoclorados y piretroides, en diferentes matrices: frutas, hortalizas,
aguas y fluidos biológicos. En todas las metodologías desarrolladas ha estado presente
el uso de sistemas de flujo que permiten la automatización total o parcial de los
procesos analíticos utilizados. La cromatografía de gases ha sido la técnica analítica
más utilizada, aunque el uso de la espectrometría de infrarrojo con transformada de
Fourier como técnica de detección junto con el análisis de datos mediante PLS,
7/18/2019 Automatizacion y Miniaturizacion de Sistemas de Screening y Determinacion de Residuos de Plaguicidas en Muestra Agroalimentaria
http://slidepdf.com/reader/full/automatizacion-y-miniaturizacion-de-sistemas-de-screening-y-determinacion-de 311/393
obviando la cromatografía, supone un nuevo enfoque en la determinación de este tipo
de analitos, así como pone de manifiesto el poder de la quimiometría ante problemas
analíticos. En este capítulo se abordan con detenimiento los aspectos relacionados con
muestras, analitos, pretratamiento de muestras, sistemas de flujo, extracción en fase
sólida, separaciones cromatográficas, sistemas de detección, tratamiento de los datos
obtenidos y, por último, un análisis de dichos resultados dentro de los objetivos
Almudena Columé Díaz Tesis Doctoral
VI. 1.1. MUESTRAS
En principio, las muestras seleccionadas en esta Memoria pueden dividirse en
dos grupos atendiendo a su estado de agregación:
• Muestras sólidas: Hortalizas y Frutas (Cap. II y III)
• Muestras líquidas: Agua y Orina (Cap. IV y V)
Las diferencias entre ellas hacen necesario un comentario más detallado de cada
tipo.
Frutas y Hortalizas
En el ámbito occidental, y más concretamente en los países mediterráneos, las
frutas y hortalizas son constituyentes esenciales de una dieta sana y equilibrada. España
consagra al cultivo de frutas y hortalizas un total de 2 millones de hectáreas, con una
producción cercana a los 22 millones de toneladas, lo que la configura como el tercer
productor europeo, tras Francia e Italia. El hecho de que frutas y hortalizas sean
alimentos perecederos y fácilmente contaminables durante su producción y posterior

7/18/2019 Automatizacion y Miniaturizacion de Sistemas de Screening y Determinacion de Residuos de Plaguicidas en Muestra Agroalimentaria
http://slidepdf.com/reader/full/automatizacion-y-miniaturizacion-de-sistemas-de-screening-y-determinacion-de 312/393
manipulación y comercialización nacional e internacional sometida a una intensa
presión competidora, justifican la necesidad de una escrupulosa inspección sanitaria,
que garantice la seguridad y salubridad de los mismos [1,2].
El Código Alimentario Español [3] clasifica los productos de origen vegetal en
frutas, hortalizas y cereales, definiendo los que nos ocupan esta Memoria como:
Resultados y Conclusiones Capítulo VI
• Hortalizas: cualquier planta herbácea hortícola que pueda usarse como
alimento, ya sea cruda o cocinada. Dentro de las hortalizas se recogen:
• Verduras: hortalizas cuya parte comestible está constituida por
los órganos verdes de las hojas, tallos o inflorescencias.
• Legumbres Frescas: frutos o semillas no maduros de las
hortalizas leguminosas.
• Frutas: frutos, infrutescencias, semillas o parte carnosa de los órganos
florales que hayan alcanzado el grado apropiado de madurez y resulten
apropiadas para el consumo humano.
Las matrices de alimentos son muy complejas, concretamente las frutas y
hortalizas lo son por su composición, en la que abundan azúcares, pigmentos, clorofilas,
pectinas, hidratos de carbono complejos, etc., los cuales dificultan la detección de
microcomponentes (contaminantes) que se encuentran a niveles de concentración
mucho más bajos [4].

7/18/2019 Automatizacion y Miniaturizacion de Sistemas de Screening y Determinacion de Residuos de Plaguicidas en Muestra Agroalimentaria
http://slidepdf.com/reader/full/automatizacion-y-miniaturizacion-de-sistemas-de-screening-y-determinacion-de 313/393
Agua
El agua, tanto por su capacidad de disolución y transporte como por ser la base
de múltiples reacciones biológicas o interacciones físico-químicas constituye el soporte
indispensable para la supervivencia de todos los seres vivos. Por otro lado, el modelo
agrícola adoptado con una permanente expansión de las zonas irrigadas exige una alta
Almudena Columé Díaz Tesis Doctoral
fertilizantes y plaguicidas, pueden contaminar el agua, por su arrastre con las
precipitaciones o con los canales de riego. Los niveles de contaminación de cauces,
acuíferos y medio hídrico en general, requieren garantizar la calidad del agua, desde el
punto de vista de su seguridad, salubridad y potabilidad [5].
En principio, el agua es una de las matrices más simples, pero la presencia de
materia orgánica en la misma puede complicar la determinación de algunos
compuestos, como ya se ha comentado en la introducción del Cap. IV.
Fluidos Biológicos
Los plaguicidas son compuestos tóxicos para los seres vivos en general y para
el hombre en particular debido a sus propiedades biocidas. Es evidente que un grupo de
riesgo, susceptible de sufrir intoxicaciones crónicas, lo constituyen aquellas personas
(trabajadores agrícolas en su mayoría) que participan activamente en la formulación de
plaguicidas, distribución y aplicación en las zonas de cultivo [2,5]. El control biológico
constituye el mejor reflejo de la exposición total, empleando para ello los denominados

7/18/2019 Automatizacion y Miniaturizacion de Sistemas de Screening y Determinacion de Residuos de Plaguicidas en Muestra Agroalimentaria
http://slidepdf.com/reader/full/automatizacion-y-miniaturizacion-de-sistemas-de-screening-y-determinacion-de 314/393
indicadores biológicos de exposición, principalmente, sangre y orina [6]. De estas dos
matrices, la orina presenta ciertas ventajas sobre la sangre, relacionadas con una toma
de muestra no invasiva, de fácil realización y de menor limitación en cuanto a volumen.
Sin embargo, aunque la matriz es más sencilla, su mayor inconveniente radica en que
algunos compuestos (por ejemplo, los piretroides) se excretan mayoritariamente como
metabolitos, siendo muy difícil identificar el compuesto del que provienen. Mención
Resultados y Conclusiones Capítulo VI
biológicos se ve reducida por su tendencia a acumularse en el tejido adiposo del
organismo, como son los plaguicidas organoclorados, y que aparecen conjugados con
otras moléculas (ácido glucurónico principalmente) cuando son excretados por orina,
para, de esta manera, convertirse en sustancias hidrosolubles.
VI. 1.2. ANALITOS
La selección de los dos grupos de plaguicidas (organoclorados y piretroides) se
ha hecho por su relevancia medioambiental, su uso y sus características contaminantes.
Los plaguicidas organoclorados junto con los organofosforados, son los más
utilizados históricamente. Sin embargo, los organoclorados tienen un especial interés
medioambiental, ya que sus características físico-químicas los hacen muy persistentes
en el medio ambiente, a la vez que su gran liposolubilidad provoca que se acumulen en
el tejido adiposo de los organismos, propagándose a lo largo de la cadena alimenticia,
mientras que los organofosforados son menos persistentes y no se acumulan. Es por ello
que algunos organoclorados han sido prohibidos en diversos países como España y
í d l UE d hí l i i d l id l li L

7/18/2019 Automatizacion y Miniaturizacion de Sistemas de Screening y Determinacion de Residuos de Plaguicidas en Muestra Agroalimentaria
http://slidepdf.com/reader/full/automatizacion-y-miniaturizacion-de-sistemas-de-screening-y-determinacion-de 315/393
países de la UE y de ahí la importancia de controlar sus residuos en los alimentos. Los
organoclorados están siendo reemplazados, en parte, por otros plaguicidas menos
tóxicos y persistentes, como es el caso de los piretroides. Este nuevo grupo de
plaguicidas es cada vez más usado, gracias a su efectividad y a su baja toxicidad. A
pesar de ello, es necesario controlar la presencia de los mismos en los alimentos por el
uso intensivo de plaguicidas en los cultivos hortofrutícolas. Los plaguicidas
Almudena Columé Díaz Tesis Doctoral
piretroides y, dentro de cada grupo, se han estudiado los más usados y los que con
mayor frecuencia aparecen sus residuos en productos hortofrutícolas y aguas. También
ha sido incluido en uno de los capítulos (Cap. III.1) el butóxido de piperonilo, ya que
habitualmente se incluye en las formulaciones de las piretrinas por su acción sinergética
para con ellas.
VI 1.3. PRETRATAMIENTO DE LA MUESTRA
El pretratamiento de la muestra depende drásticamente del estado de agregación
de las mismas. Así, las muestras sólidas (hortalizas y frutas) requieren un tratamiento
más complejo para hacerlas compatibles con el sistema de flujo, mientras que en las
muestras líquidas (aguas y orina) la manipulación es mínima.
En relación con las frutas y verduras, se han desarrollado dos procedimientos
claramente diferenciados según se trate de muestras frescas o liofilizadas. En el caso de
muestras frescas (Cap. II) el proceso es más tedioso puesto que se requiere una primera
extracción en un medio polar seguida de una reextracción selectiva de los plaguicidas

7/18/2019 Automatizacion y Miniaturizacion de Sistemas de Screening y Determinacion de Residuos de Plaguicidas en Muestra Agroalimentaria
http://slidepdf.com/reader/full/automatizacion-y-miniaturizacion-de-sistemas-de-screening-y-determinacion-de 316/393
organoclorados en un medio de polaridad más baja. Debido a la incompatibilidad de
este medio con el sistema de flujo diseñado, fue preciso incluir una unidad de
evaporación-redisolución que permitía transferir los analitos del medio orgánico al
acuoso para su aspiración en el módulo de tratamiento automático. Para las hortalizas
(Cap. II.1) la extracción se llevó a cabo con una mezcla de éter de petróleo y agua, pero
para las frutas (Cap II 2 ) este procedimiento no resultó efectivo debido a la formación
Resultados y Conclusiones Capítulo VI
en las frutas que impedía una adecuada separación de las fases. Se recurrió entonces a
una extracción con acetona seguida de una reextracción con n-hexano. En este proceso
de reextracción es imprescindible la adición de una disolución reguladora de fosfato
saturada con NaCl para una correcta separación de las fases y la extracción de los
ácidos orgánicos endógenos (cítrico, oxálico, etc.) a la fase de agua-acetona.
La liofilización de las muestras hortofrutícolas (Cap. III), simplifica
notablemente el tratamiento, puesto que sólo es necesario una extracción sólido-líquido
con n-hexano, que se introduce directamente en el sistema de flujo. Previo al empleo de
las muestras liofilizadas, se realizó un estudio para garantizar la ausencia de pérdidas de
los plaguicidas estudiados durante el proceso de liofilización. Para ello se seleccionaron
diferentes frutas y hortalizas (tomate, espinaca, melón y manzana) que se fortificaron
con 20 ng/g de cada plaguicida organoclorado (Cap. III.2 y III.3) o 50 ng/g de cada
piretroide (Cap. III). Cada muestra se dividió en dos porciones, una de las cuales fue
extraída siguiendo un método manual descrito [7] en el cual se realiza una primera
extracción con acetona, seguida de otra con n-hexano, tras lo cual el extracto orgánico
es evaporado redisuelto limpiado sobre un cartucho de Florisil evaporado de nuevo y

7/18/2019 Automatizacion y Miniaturizacion de Sistemas de Screening y Determinacion de Residuos de Plaguicidas en Muestra Agroalimentaria
http://slidepdf.com/reader/full/automatizacion-y-miniaturizacion-de-sistemas-de-screening-y-determinacion-de 317/393
es evaporado, redisuelto, limpiado sobre un cartucho de Florisil, evaporado de nuevo y
redisuelto en n-hexano para analizar 1 µL del mismo mediante GC-ECD. La otra mitad
de cada muestra se liofilizó (condiciones optimizadas para 50 g de muestra: 8h, 6 Pa),
tras lo cual se extrajo directamente con n-hexano y se prosiguió con el mismo
tratamiento al que fueron sometidas las muestras frescas. Este proceso se realizó cuatro
veces para cada muestra. Los resultados reflejaron que no se producía ninguna pérdida
Almudena Columé Díaz Tesis Doctoral
recogidos los valores medios de contenido en agua para cada una de las matrices
hortofrutícolas estudiadas en el Cap. III.
Tabla VI.1.3.1. Contenido medio en agua de muestras hortofrutícolas.Fruta Contenido en agua (% p/p) Hortaliza Contenido en agua (% p/p)Fresa 91 Espinaca 90Pera 82 Acelga 92Manzana 83 Pimiento 91 Naranja 80 Tomate 93Melocotón 80 Patata 92Kiwi 85 Coliflor 91Melón 85 Pepino 92
Cereza 70 Berenjena 93Cebolla 91Champiñón 90
Para las muestras de agua (Cap. IV), de nuevo es necesario hacer una distinción
en función de la técnica de detección empleada. Para la determinación de plaguicidas
por GC-ECD/MS (Cap. IV.1), la introducción de la muestra fue directa, siendo
únicamente necesario el ajuste del pH (5-6) y la adición de un agente declorante
(tiosulfato sódico). Sin embargo, el uso de FTIR (Cap. IV.2) requiere una mayor
preconcentración de los analitos debido a su menor sensibilidad. La introducción

7/18/2019 Automatizacion y Miniaturizacion de Sistemas de Screening y Determinacion de Residuos de Plaguicidas en Muestra Agroalimentaria
http://slidepdf.com/reader/full/automatizacion-y-miniaturizacion-de-sistemas-de-screening-y-determinacion-de 318/393
directa de la muestra acuosa en el sistema utilizado en el Cap. IV.1, aún
preconcentrando 100 mL de muestra (volumen de ruptura o breakthrough volume) no
resultaba suficiente para la determinación de los analitos por FTIR. Por ello fue
necesario una extracción líquido-líquido adicional con n-hexano previa a la
introducción en un sistema de flujo, que incorpora una columna de sílica (similar al
d i l ) i l i d l li di d d l
Resultados y Conclusiones Capítulo VI
Por último, el pretratamiento requerido por la orina, depende de los analitos a
determinar. De esta forma, los plaguicidas organoclorados sólo requieren un ajuste de
pH, mientras que es necesaria una hidrólisis ácida de la orina para liberar los
metabolitos de piretroides que se excretan conjugados. Este hecho impide la
determinación conjunta de ambos tipos de compuestos ya que los resultados
demostraron que la hidrólisis ácida destruía a los plaguicidas organoclorados hasta en
un 80%.
En la siguiente Tabla (VI.1.3.2) se indica el medio de preparación de la muestra
antes de introducirla en el sistema de flujo, correspondiente a cada uno de los capítulos
que constituyen esta Memoria, así como la cantidad de muestra requerida para la
determinación analítica.
Tabla VI.1.3.2. Medio seleccionado para la retención de los analitos en el sistema continuo deextracción en fase sólida y cantidad de muestra que se puede procesar.
Muestras sólidas (frutas y hortalizas) Muestras líquidas (agua y orina)Capítulo dela Memoria II.1 II.2 III.1 III.2 III.3 IV.1 IV.2 V.1
MedioAcuoso
n hexanoAcuoso
n hexanoOrina acidificada

7/18/2019 Automatizacion y Miniaturizacion de Sistemas de Screening y Determinacion de Residuos de Plaguicidas en Muestra Agroalimentaria
http://slidepdf.com/reader/full/automatizacion-y-miniaturizacion-de-sistemas-de-screening-y-determinacion-de 319/393
Medio(pH 5.5)
n-hexano(pH 5-6)
n-hexano(pH 2-3)
Cantidad
muestra 5-20 g (fresca) 0.1-1 g (liofilizada) 10-100 mL 0.5 L 3 mL
Almudena Columé Díaz Tesis Doctoral
VI 1.4 SISTEMA DE FLUJO
Los componentes y variables hidrodinámicas de los sistemas de flujo
empleados en esta Memoria se enumeran en la siguiente Tabla para poder ser
comentados más fácilmente a continuación:
Tabla VI.1.4.1. Componentes y variables de los sistemas de flujo desarrollados en cadacapítulo.
Capítulode la
Memoria
Canales Bombas VálvulasUnidad de
evaporación/
redisolución
Volumen preconcentrado
(mL)
SPECaudalmuestra
(mL/min)
Caudaleluyente
(mL/min)II.1 3 2 2 Si 5 Si 0.2 0.5
II.2 3 2 2 Si 5 Si 0.2 0.5
III.1 2 1 2 No 5 Si 2.0 1.0
III.2 2 1 2 No 5 Si 2.0 1.0
III.3 2 1 2 No 5 Si 2.0 1.0
IV.1 2 1 2 No 10 Si 1.5 0.2
IV.2 2 1 2 No 10 Si 2.0 1.0
V.1 2 1 2 No
5 Si 0.5 0.2
Como se desprende de esta Tabla, los sistemas de flujo iniciales son más
complejos (Cap. II) debido a que se emplean para frutas y hortalizas frescas; el proceso
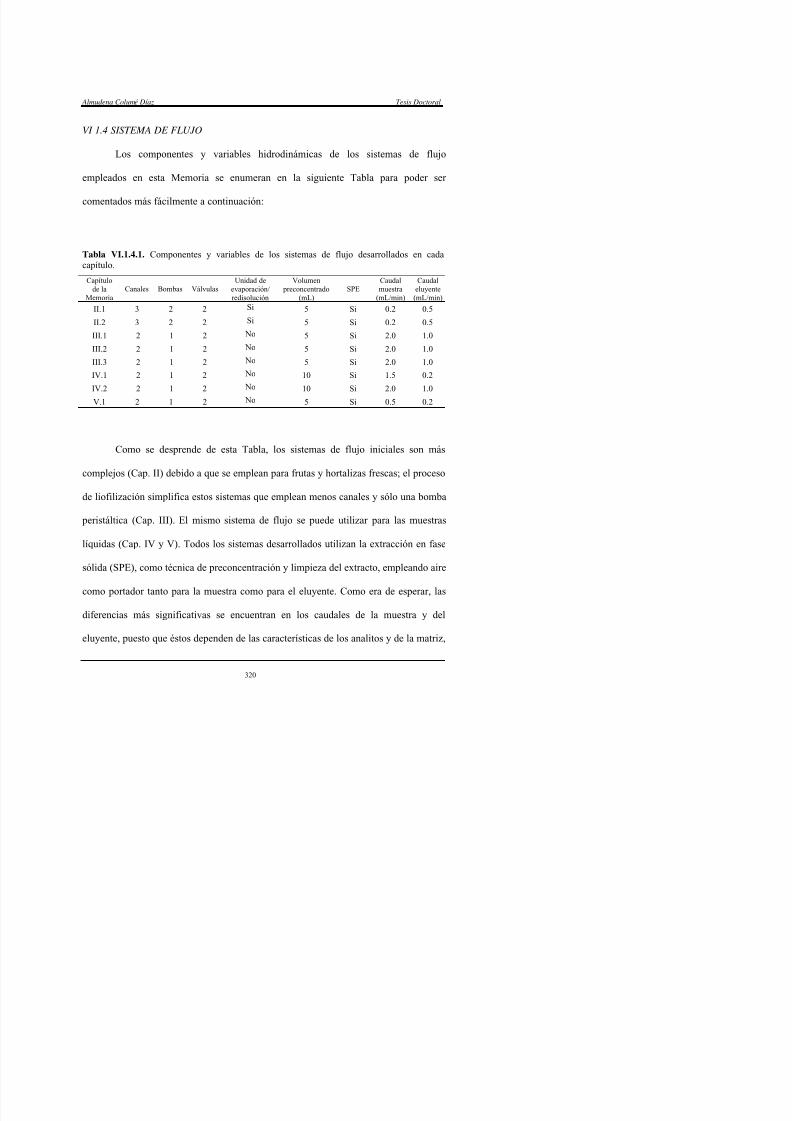
7/18/2019 Automatizacion y Miniaturizacion de Sistemas de Screening y Determinacion de Residuos de Plaguicidas en Muestra Agroalimentaria
http://slidepdf.com/reader/full/automatizacion-y-miniaturizacion-de-sistemas-de-screening-y-determinacion-de 320/393
de liofilización simplifica estos sistemas que emplean menos canales y sólo una bomba
peristáltica (Cap. III). El mismo sistema de flujo se puede utilizar para las muestras
líquidas (Cap. IV y V). Todos los sistemas desarrollados utilizan la extracción en fase
sólida (SPE), como técnica de preconcentración y limpieza del extracto, empleando aire
como portador tanto para la muestra como para el eluyente. Como era de esperar, las
Resultados y Conclusiones Capítulo VI
del medio en el que vayan disueltos y del adsorbente utilizado. Los caudales más altos
corresponden a los sistemas de flujo diseñados para la preconcentración de los analitos
y limpieza de los extractos en una columna de sílica (Cap. III). El volumen
preconcentrado es el mínimo requerido para alcanzar los LMR en cada caso, excepto en
el Cap. II, en el que se indica el volumen de agua destilada en que son redisueltos los
analitos; y en el Cap. IV.2, donde se utiliza FTIR en la determinación de los
plaguicidas, ha de ser siempre el mismo puesto que la calibración mediante PLS está
influenciada notablemente por el volumen de los disolventes orgánicos empleados,
fijándose éste en 10 mL de n-hexano.
VI.1.5. ADSORCION-ELUCION
Todas las metodologías desarrolladas en esta Memoria están basadas en el
empleo de columnas adsorbentes de distinta naturaleza para la retención cuantitativa de
los analitos, de forma que la matriz de la muestra se elimine mayoritariamente. De esta
forma, se consigue preconcentrar los analitos al eluirlos en un volumen más pequeño y
7/18/2019 Automatizacion y Miniaturizacion de Sistemas de Screening y Determinacion de Residuos de Plaguicidas en Muestra Agroalimentaria
http://slidepdf.com/reader/full/automatizacion-y-miniaturizacion-de-sistemas-de-screening-y-determinacion-de 321/393
evitar la interferencia de componentes procedentes de la matriz de la muestra, puesto
que éstos tienen menor afinidad por los adsorbentes empleados en cada caso que los
analitos. En la Tabla VI.1.5.1 se esquematizan las similitudes y diferencias entre los
sistemas desarrollados.
Almudena Columé Díaz Tesis Doctoral
Tabla VI.1.5.1. Características más relevantes concernientes a las etapas de adsorción/eluciónde los sistemas de flujo descritos en la Memoria.
% RetenciónCapítulode la
Memoria
ColumnaSPE
EluyenteVolumende ruptura
Lavado yacondicionamiento
Organoclorados Piretroides1
%Elución
II.1RP-C18 (40 mg)
Acetatoetilo
(150 µL)---
3 mL Etanol +3 mL Agua destilada 100 --- 100
II.2RP-C18 (40 mg)
Acetatoetilo
(150 µL)---
3 mL Etanol +3 mL NH4OH 0.2 M +3 mL Agua destilada
100 --- 100
III.1Sílica
(50 mg)
Acetatoetilo
(175 µL)25 mL
0.5 mL Isopropanol +0.5 mL Acetonitrilo +1 mL n-Hexano
--- 100 100
III.2Sílica
(50 mg)
Acetatoetilo
(175 µL)20 mL
0.5 mL Isopropanol +0.5 mL Acetonitrilo +1 mL n-Hexano
40-90 100 100
III.3Sílica
(50 mg)
Acetatoetilo
(175 µL)20 mL
0.5 mL Isopropanol +0.5 mL Acetonitrilo +1 mL n-Hexano
40-90 100 100
IV.1RP-C18 (40 mg)
Acetatoetilo
(80 µL)100 mL
3 mL Etanol +3 mL Agua destilada 100 --- 100
IV.2Sílica
(50 mg)
Acetatoetilo
(275 µL)---
0.5 mL Isopropanol +0.5 mL Acetonitrilo +1 mL n-Hexano
80-90 100 100
V.1RP-C18 (40 mg)
Acetato2
etilo(250 µL)
---
0.25 mL HNO3 3M +0.25 mL Metanol +0.5 mL Acetato etilo +1 mL Disoluciónacuosa a pH 2
95 100 100

7/18/2019 Automatizacion y Miniaturizacion de Sistemas de Screening y Determinacion de Residuos de Plaguicidas en Muestra Agroalimentaria
http://slidepdf.com/reader/full/automatizacion-y-miniaturizacion-de-sistemas-de-screening-y-determinacion-de 322/393
1 Para metabolitos de piretroides en el Cap. V.1.2
Contiene además el reactivo derivatizador.
A lo largo de esta Memoria se han empleado dos tipos de sólidos adsorbentes:
RP-C18 y sílica. La inclusión de uno u otro en el sistema automático depende
exclusivamente del medio en que va preparada la muestra. Así, la retención de los
Resultados y Conclusiones Capítulo VI
para plaguicidas organoclorados como para los metabolitos de piretroides, mientras que
la sílica resultó ser el adsorbente más adecuado cuando se trabajó en n-hexano, a pesar
de que algunos plaguicidas organoclorados (lindano y diclorán) sólo se retenían en un
40%. Este bajo porcentaje de retención (que no puede incrementarse aumentando la
cantidad de sólido adsorbente empaquetado) se compensa claramente con la mayor
sensibilidad que presentan estos analitos en el detector de captura de electrones y, que
permite alcanzar sin dificultad los LMR más bajos establecidos para estos compuestos
en las matrices estudiadas. En contraposición a esta limitación, los sistemas deextracción en fase sólida basados en el empleo de una columna de sílica son más
sencillos que los de RP-C18 para las matrices más complejas (frutas y hortalizas).
La cantidad de adsorbente empaquetado fue muy similar en todos los casos, y
considerablemente inferior al empleado en los cartuchos comerciales recomendados
para la determinación de plaguicidas en este tipo de muestras (40-50 mg vs. 500 mg), lo
que permite preparar de 10 a 12 minicolumnas a partir de un cartucho comercial.
Usando como detector FTIR (Cap. IV.2), con menor sensibilidad, fue necesario trabajar
con una columna adsorbente que fuese capaz de adsorber una cantidad global de

7/18/2019 Automatizacion y Miniaturizacion de Sistemas de Screening y Determinacion de Residuos de Plaguicidas en Muestra Agroalimentaria
http://slidepdf.com/reader/full/automatizacion-y-miniaturizacion-de-sistemas-de-screening-y-determinacion-de 323/393
analitos alta, y es por ello que a pesar de diseñar el sistema de flujo para ladeterminación de sólo tres plaguicidas, la cantidad de sílica fue también de 50 mg.
De entre todos los eluyentes ensayados (n-hexano, éter de petróleo, acetato de
etilo, isopropanol, acetonitrilo y acetona), el acetato de etilo resultó ser el mejor,
consiguiendo con ambos adsorbentes, una elución cuantitativa de los plaguicidas. Los
Almudena Columé Díaz Tesis Doctoral
técnica de espectrometría de infrarrojo (Cap. IV.2), debido a la alta cantidad retenida de
cada analito (0.5-2 µg) sobre la columna adsorbente, y en la determinación de los
plaguicidas en muestras de orina (Cap. V.1), puesto que el eluyente contenía también el
reactivo derivatizador.
Respecto al volumen de ruptura (volumen de muestra a partir del cual sólo se
retiene en la columna adsorbente el 99% de la cantidad inicial de analitos en la muestra,
es decir, al menos el 1% se eluye), éste se determinó en los casos en que la muestra se
introducía directamente (ej. aguas, Cap. IV.1), o bien, tras la extracción de los
plaguicidas con n-hexano de la muestra liofilizada (Cap. III). En el resto de los casos, el
volumen que se introduce en el sistema es constante ya que corresponde al de agua
destilada sobre el que se redisuelven los analitos, desde el medio orgánico empleado
para la extracción de frutas y verduras (Cap. II); cuando se emplea FTIR (Cap. IV.2), el
volumen de muestra ha de ser siempre el mismo, debido a la influencia de los
disolventes sobre el espectro, y que corresponde con el usado en la calibración
mediante PLS. Por último, la influencia de una matriz compleja como la orina
hidrolizada (Cap. V.1), limita que el volumen de muestra sea el mínimo posible para

7/18/2019 Automatizacion y Miniaturizacion de Sistemas de Screening y Determinacion de Residuos de Plaguicidas en Muestra Agroalimentaria
http://slidepdf.com/reader/full/automatizacion-y-miniaturizacion-de-sistemas-de-screening-y-determinacion-de 324/393
alcanzar unos límites de detección aceptables.Las columnas preparadas en el laboratorio pueden ser reusadas durante tres
meses aproximadamente (suponiendo una media de trabajo de 8h al día) sin más que
introducir etapas de limpieza y acondicionamiento de las mismas, que se lleva a cabo de
forma secuencial en el propio sistema automático. Estas etapas dependen claramente de
Resultados y Conclusiones Capítulo VI
cabo la retención (acondicionamiento). En el caso de la determinación de plaguicidas
organoclorados en fruta fresca, es necesario introducir una etapa adicional de lavado
con NH4OH 0.2 M para eliminar una pequeña cantidad de pigmentos que quedaban
retenidos en la columna; en el caso de muestras de orina hidrolizada, se requiere el
empleo de un medio ácido para eliminar algunos componentes de la matriz que
quedaron también retenidos sobre el adsorbente. En ningún caso afectaron a la
resolución cromatográfica porque no se eluyeron con el acetato de etilo.
VI.1.6. SEPARACION CROMATOGRAFICA
Las características de los plaguicidas estudiados en esta Memoria, en términos
de volatilidad y estabilidad térmica, hacen que se prefiera la cromatografía de gases
como técnica de separación frente a la cromatografía líquida y, puesto que se tratan de
compuestos altamente halogenados (principalmente clorados), el detector recomendado
en todos los métodos descritos en la bibliografía es el de captura de electrones. En el
caso de la determinación de metabolitos de piretroides fue necesario incluir una
derivatización previa para aumentar su volatilidad. La separación cromatográfica se
7/18/2019 Automatizacion y Miniaturizacion de Sistemas de Screening y Determinacion de Residuos de Plaguicidas en Muestra Agroalimentaria
http://slidepdf.com/reader/full/automatizacion-y-miniaturizacion-de-sistemas-de-screening-y-determinacion-de 325/393
evita gracias al poder discriminatorio del tratamiento quimiométrico basado en la
calibración mediante PLS, de la información contenida en los espectros obtenidos por
FTIR; no obstante, en esta metodología sólo se determinaron tres plaguicidas (Cap.
IV.2).
La mejor resolución cromatográfica se consiguió utilizando una columna
Almudena Columé Díaz Tesis Doctoral
espesor de película de 0.25 µm. El volumen de inyección fue siempre de 1 µL, en modo
split (1:25) y el gas portador fue nitrógeno (GC-ECD) o helio ultrapuro (GC-MS) a un
caudal de 1 mL/min. La temperatura del inyector se fijó en 225ºC, ya que valores más
altos pueden provocar la degradación térmica de algunos plaguicidas, como el captán.
Para la separación de los analitos se empleó en todos los casos la modalidad de
gradiente de temperatura, pero incluyendo etapas isotérmicas para poder separar
aquellos plaguicidas que aparecen como mezcla de isómeros. Los programas de
temperatura óptimos en cada caso se resumen en la Tabla VI.1.6.1.
Tabla VI.1.6.1. Programas de temperatura óptimos para la separación cromatográfica en cadacapítulo de la Memoria.
Capítulo dela Memoria
Detector Programa de temperatura
II.1 ECD120ºC2 min
8ºC /min 180ºC4 min
8ºC/min 255ºC10 min
10ºC/min 270ºC2 min
II.2 ECD/MS120ºC2 min
8ºC /min 180ºC4 min
8ºC/min 255ºC10 min
10ºC/min 270ºC2 min
III.1 ECD/MS170ºC2 min
10ºC /min 255ºC15 min
8ºC/min 285ºC6 min
III.2 y 3 ECD/MS150ºC2 min
8ºC /min 170ºC4 min
8ºC/min 255ºC15 min
5ºC/min 285ºC6 min

7/18/2019 Automatizacion y Miniaturizacion de Sistemas de Screening y Determinacion de Residuos de Plaguicidas en Muestra Agroalimentaria
http://slidepdf.com/reader/full/automatizacion-y-miniaturizacion-de-sistemas-de-screening-y-determinacion-de 326/393
IV.1 ECD/MS 120ºC2 min
8ºC /min180ºC4 min
8ºC/min255ºC10 min
10ºC/min270ºC2 min
V.1 MS70ºC
10 min
10ºC/min 270ºC10 min
10ºC/min 285ºC0 min
(paraorganoclorados)
70ºC10 min
10ºC/min 285ºC0 min
(para metabolitos de piretroides)
Resultados y Conclusiones Capítulo VI
Puede afirmarse que hay un programa de temperatura adecuado para los
organoclorados (Cap. II.1, II.2 y IV.1), otro para los piretroides (Cap. III.1) y otro para
la mezcla de organoclorados y piretroides (Cap. III.2 y III.3). En todos los casos se
incluye una etapa final para eliminar de la columna cromatográfica posibles compuestos
procedentes de la matriz de la muestra y evitar la aparición de picos fantasma en los
cromatogramas.
VI.1.7. DETECCIONEl detector de captura de electrones tiene una gran sensibilidad y selectividad
para moléculas con átomos de halógenos, por lo que se ha utilizado en la cuantificación
de los analitos estudiados en esta Memoria (Cap. II, III y IV.1) , mientras que se optó
por la espectrometría de masas para la confirmación de los resultados positivos de las
muestras analizadas mediante ECD en los Cap. II.2, III y IV.1. Únicamente para las
muestras de orina (Cap. V.1) se empleó el detector MS tanto para la identificación
como para la cuantificación de los analitos, puesto que las muestras de orina
hidrolizadas generaban un gran número de picos que impedían la identificación de los

7/18/2019 Automatizacion y Miniaturizacion de Sistemas de Screening y Determinacion de Residuos de Plaguicidas en Muestra Agroalimentaria
http://slidepdf.com/reader/full/automatizacion-y-miniaturizacion-de-sistemas-de-screening-y-determinacion-de 327/393
plaguicidas. Debido a la menor sensibilidad de este detector, fue preciso trabajar con
monitorización selectiva de iones (SIM), lo que también contribuyó a minimizar las
señales procedentes de la matriz de la muestra. En la Tabla VI.1.7.1 se encuentran
enumerados los analitos con los valores de m/z seleccionados, para identificación o,
para identificación y cuantificación en modo SIM en el caso de los metabolitos de
Almudena Columé Díaz Tesis Doctoral
El uso de la espectrometría de infrarrojo con transformada de Fourier
como detector (Cap. IV.2) permite registrar los espectros de los extractos procedentes
del sistema de flujo. Para ello, se depositaron 5 µL del extracto sobre el cristal de
reflectancia total atenuada (ATR: Attenuated Total Reflectance), y los espectros se
registraron mediante el uso de un detector de sulfato de triglicina deuterada (DTGS:
Deuterated Triglycine Sulphate). Para minimizar las absorbancias interferentes debidas
al disolvente orgánico en el que van disueltos los analitos en el extracto final (acetato de
etilo), se dejó evaporar éste sobre el ATR antes de registrar los espectros. Además,también se estudió el volumen máximo de este extracto que, tras la evaporación del
disolvente, diese lugar a una película homogénea de los analitos sobre el cristal del
ATR. Así, para volúmenes superiores a 5 µL, los espectros no fueron reproducibles. Por
ello, fue necesario recurrir a la evaporación de todo el extracto procedente del sistema
de flujo (puesto que se requería la máxima preconcentración posible de los analitos)
para minimizar las interferencias de las impurezas de los disolventes orgánicos en los
espectros finales.

7/18/2019 Automatizacion y Miniaturizacion de Sistemas de Screening y Determinacion de Residuos de Plaguicidas en Muestra Agroalimentaria
http://slidepdf.com/reader/full/automatizacion-y-miniaturizacion-de-sistemas-de-screening-y-determinacion-de 328/393
Resultados y Conclusiones Capítulo VI
Tabla VI.1.7.1. Relación de m/z característicos de los plaguicidas estudiados en esta Memoria.
Analito m/za Analito m/za Analito m/za
α-HCH 111,181,219 Procimidona 67,96,283 Bifentrín 152, 165, 181
HCB 249,282,284 Clorbenside 125,127,268 Fenpropatrín 97, 181, 349
Diclorán 124,176,206 Clordano 202,373,408 λ-Cihalotrín 141, 181, 209
β-HCH 109,181,219 α-Endosulfan 195,241,339 Permetrín 163, 183, 390
Lindano 111,181,219 Dieldrín 79,263,378 Ciflutrín 77, 163, 227
δ-HCH 111,181,219 Endrin 67,317,319 β-Ciflutrín 77, 163, 227
Vinclozolina 187,212,285 β-Endosulfan 195,241,339 Cipermetrín 77, 181, 209
Heptacloro 100,272,370 Endosulfan
sulfato272,387,420 α-Cipermetrín 77, 181, 209
Diclofuanida 123,224,332 Iprodiona 56,314,329 Fenvalerato 169, 181, 419
Aldrín 66,263,298 Captafol 79,183,347 Deltametrín 181, 209, 253
Dicofol 111,139,250 Metoxicloro 227,228,344 cis y trans-DCCA
163, 191, 323
Captán 79,264,299 Butóxido de piperonilo
149, 176, 338 cis-DBCA 172, 253, 367
PBA 141, 197, 364
a Los valores de m/z en cursiva corresponden a los iones moleculares, en negrita a los picos basey los subrayados a los fragmentos seleccionados para la cuantificación.

7/18/2019 Automatizacion y Miniaturizacion de Sistemas de Screening y Determinacion de Residuos de Plaguicidas en Muestra Agroalimentaria
http://slidepdf.com/reader/full/automatizacion-y-miniaturizacion-de-sistemas-de-screening-y-determinacion-de 329/393
Almudena Columé Díaz Tesis Doctoral
VI.1.8. TRATAMIENTO DE DATOS
En las metodologías desarrolladas para la separación/determinación de los
plaguicidas por cromatografía de gases se construyeron las rectas de calibrado mediante
regresión lineal del área de pico cromatográfico del analito dividida por la del estándar
interno frente a la concentración del analito. Los límites de detección (LOD) fueron
calculados como la concentración mínima que proporcionaba señales cromatográficas
tres veces mayores que el ruido de fondo; y la precisión del método, expresada como
desviación estándar relativa (% RSD), se obtuvo de un mínimo de 11 muestras
preparadas a partir de las disoluciones estándar, conteniendo los analitos a
concentraciones situadas en la parte inferior de la recta de calibrado.
Sin embargo, en el empleo de FTIR (Cap. IV.2), dado que la etapa de
separación de los plaguicidas no está incluida, la obtención de los parámetros analíticos
característicos requirió el empleo de tratamientos quimiométricos más complejos. Para
la selección de los tres analitos (diclofuanida, captán y fenpropatrín), se llevó a cabo un
análisis de agrupaciones (Cluster analysis) con todos los plaguicidas organoclorados y
piretroides empleados a lo largo de la Memoria. Este análisis es un método de
i i d i d bj i f i d

7/18/2019 Automatizacion y Miniaturizacion de Sistemas de Screening y Determinacion de Residuos de Plaguicidas en Muestra Agroalimentaria
http://slidepdf.com/reader/full/automatizacion-y-miniaturizacion-de-sistemas-de-screening-y-determinacion-de 330/393
reconocimiento de pautas no supervisado, cuyo objetivo es formar una serie de grupos
de objetos, en este caso de plaguicidas, que sean similares entre sí. De este “clustering”
se desprende que los plaguicidas organoclorados y piretroides constituyen dos grupos
diferenciados y, que además, los organoclorados se subdividen en dos grupos.
Basándose en ello, se seleccionaron un piretroide y dos organoclorados, uno de cada
Resultados y Conclusiones Capítulo VI
mediante mínimos cuadrados parciales (PLS: Partial Least Square) para obtener la
calibración de los mismos. Se realizaron diferentes modelos de calibración validados
mediante calibración cruzada. Sin embargo, debido a la influencia en los espectros de
las impurezas arrastradas, procedentes de los disolventes orgánicos utilizados en el
pretratamiento de la muestra y en el sistema de flujo (a pesar de utilizarlos de grado
HPLC), fue necesario seleccionar rangos óptimos de número de ondas. De esta manera,
para cada analito se construyó una calibración independiente, utilizando diferentes
rangos de la región espectral y, en todos los casos, la primera derivada del espectro.
Queda de esta forma patente la utilidad de la quimiometría como herramienta analítica,
sustituyendo la separación física implícita en la cromatografía por la capacidad
discriminante del FTIR junto con el PLS.
VI.1.9. GRADOS DE AUTOMATIZACION Y SIMPLIFICACION
La automatización de cada uno de los pasos que constituyen los métodos
desarrollados en los diferentes capítulos de esta Memoria, así como el grado de
simplificación alcanzado en los mismos en relación a los procesos manuales, se intentan

7/18/2019 Automatizacion y Miniaturizacion de Sistemas de Screening y Determinacion de Residuos de Plaguicidas en Muestra Agroalimentaria
http://slidepdf.com/reader/full/automatizacion-y-miniaturizacion-de-sistemas-de-screening-y-determinacion-de 331/393
plasmar en la Gráfica VI.1.9.1. De esta forma, se puede tener una primera impresión,
clara y directa, de dicho grado, evaluado en función de lo expuesto a continuación.
Almudena Columé Díaz Tesis Doctoral
Gráfica VI.1.9.1. Grado de automatización y simplificación de los diferentes pasos de cadamétodo presentado en esta Memoria.
GRADO DE AUTOMATIZACION Y SIMPLIFICACIONCapítulo
de laMemoria Pretratamiento Sistema de flujo Detección Tratamiento de datosII.1II.2III.1III.2III.3IV.1IV.2V.1
El pretratamiento de la muestra es mínimo en el Cap. IV.1 dedicado al análisis
de aguas, puesto que sólo se requiere el ajuste de pH y la adición del agente declorante
a las muestras y, es por ello, que su grado de simplificación y automatización es
máximo. Por otro lado, en el Cap. III, referente a frutas y hortalizas liofilizadas, el
pretratamiento consiste únicamente en una extracción sólido-líquido automatizada,
puesto que se realiza mediante agitación magnética. Sin embargo, en el Cap. II, el
pretratamiento es algo más complejo ya que al tratarse de frutas y hortalizas frescas se
necesita además de una extracción manual un cambio de disolvente que conlleva una
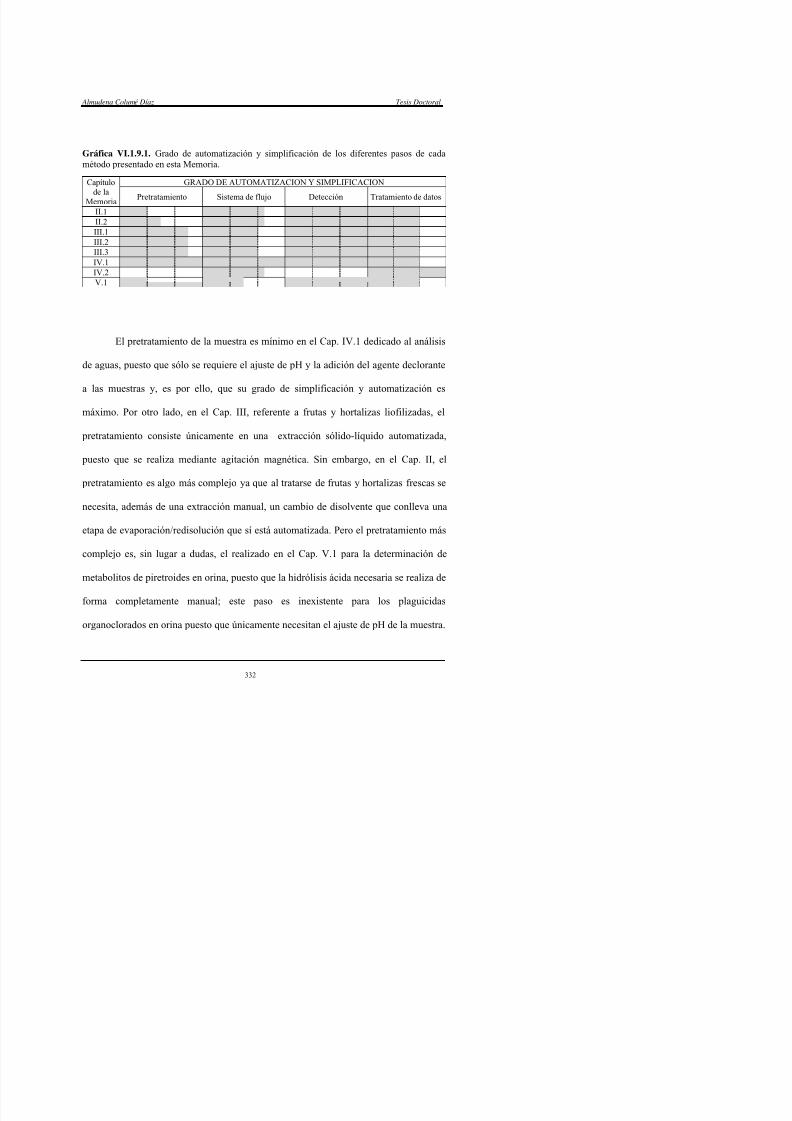
7/18/2019 Automatizacion y Miniaturizacion de Sistemas de Screening y Determinacion de Residuos de Plaguicidas en Muestra Agroalimentaria
http://slidepdf.com/reader/full/automatizacion-y-miniaturizacion-de-sistemas-de-screening-y-determinacion-de 332/393
necesita, además de una extracción manual, un cambio de disolvente que conlleva una
etapa de evaporación/redisolución que sí está automatizada. Pero el pretratamiento más
complejo es, sin lugar a dudas, el realizado en el Cap. V.1 para la determinación de
metabolitos de piretroides en orina, puesto que la hidrólisis ácida necesaria se realiza de
forma completamente manual; este paso es inexistente para los plaguicidas
Resultados y Conclusiones Capítulo VI
Por otro lado, el pretratamiento de las muestras de aguas cuando se emplea FTIR (Cap.
IV.2), aunque es muy simple no está automatizado, por lo que el sistema de flujo sólo
se emplea para preconcentrar los plaguicidas.
En cuanto al sistema de flujo, como ya se ha comentado, hay una gran
semejanza entre ellos, siendo quizás la característica diferenciadora la secuencia de
limpieza y acondicionamiento de las columnas de adsorción, que en el caso de los Cap.
II.1, II.2 y IV.1 es la más sencilla. La detección, cuando está en línea con el proceso
cromatográfico está completamente automatizada, mientras que en el Cap. IV.2, donde
se lleva a cabo de forma discontinua, el grado de automatización y simplificación es
prácticamente nulo, máxime teniendo en cuenta el paso de evaporación de disolvente
orgánico necesario antes de colocar la muestra sobre el ATR.
Por último, el tratamiento de datos, en todos los casos es simple, pero hay que
tener en cuenta que en el Cap. IV.2 donde el tratamiento es más complejo, los cálculos
se llevan a cabo mediante paquetes informáticos que contienen programas
quimiométricos, con la precisión y rapidez que ello conlleva.
Por tanto, el método más simple y automatizado es el desarrollado en el Cap.
IV 1 correspondiente a muestras de aguas aunque hay que tener en cuenta que también

7/18/2019 Automatizacion y Miniaturizacion de Sistemas de Screening y Determinacion de Residuos de Plaguicidas en Muestra Agroalimentaria
http://slidepdf.com/reader/full/automatizacion-y-miniaturizacion-de-sistemas-de-screening-y-determinacion-de 333/393
IV.1, correspondiente a muestras de aguas, aunque hay que tener en cuenta que también
es la matriz más simple, seguido por los métodos desarrollados en el Cap. III, donde la
liofilización, aunque suponga un mayor tiempo en el pretratamiento de la muestra,
facilita enormemente la extracción sólido-líquido, así como el posterior tratamiento
analítico, puesto que los extractos son mucho más limpios. Además, hay que tener en
Almudena Columé Díaz Tesis Doctoral
considerable de muestras (en función, claro está, del liofilizador utilizado) y que,
además, supone un método de conservación de las muestras en el que los analitos
permanecen inalterables, lo cual es una gran ventaja teniendo en cuenta el gran carácter
perecedero de las muestras hortofrutícolas.
Por el contrario, el método menos simple y automatizado es claramente el
desarrollado en el Cap. IV.2, determinado por el pretratamiento de la muestra y la
detección discontinua. Sin embargo, hay que resaltar que ha sido posible obviar la
separación cromatográfica gracias al poder discriminatorio prestado por el tratamiento
quimiométrico de los espectros obtenidos mediante FTIR.
VI.1.10. RESULTADOS ANALITICOS
Frutas y Hortalizas
A. CALIBRACIONES
En la Tabla VI.1.10.1 se exponen las características analíticas correspondientes
a límites de detección, rangos de linealidad establecidos para la cuantificación y
precisión obtenidos para cada plaguicida en cada uno de los métodos desarrollados en

7/18/2019 Automatizacion y Miniaturizacion de Sistemas de Screening y Determinacion de Residuos de Plaguicidas en Muestra Agroalimentaria
http://slidepdf.com/reader/full/automatizacion-y-miniaturizacion-de-sistemas-de-screening-y-determinacion-de 334/393
los diferentes capítulos de esta Memoria en los que se aborda la determinación de estosanalitos en muestras hortofrutícolas.
Resultados y Conclusiones Capítulo VI
Tabla VI.1.10.1. Relación de los límites de detección, rangos de linealidad y precisión paracada analito en cada uno de los métodos desarrollados.
Resultados analíticosAnalitos CapítuloLOD (ng/g)1 Rango lineal (ng/g)1 RSD (%)
α-HCH II.1II.2
1.50.7
5-10002.5-500
5.25.4
HCB II.1II.2
2.01.0
10-10005-500
4.74.9
β-HCH II.1II.2
2.01.0
10-10005-500
4.34.6
δ-HCH II.1II.2
1.00.5
5-10002.5-500
4.04.0
Heptacloro II.1II.2
2.01.0
10-10005-500
5.45.5
Aldrín II.1II.2
1.00.5
5-10002.5-500
5.65.4
Dicofol II.1II.2
5.01.2
25-20006.2-500
4.34.8
Clorbenside II.1II.2
5.02.5
25-20012.5-1000
5.16.0
Clordane II.1
II.2
10.0
5.0
50-2500
25-1250
5.2
5.1Dieldrín II.1
II.22.51.2
10-10005-500
5.76.0
Endrín II.1II.2
2.01.0
10-10005-500
5.95.9
Iprodiona II.1II.2
50.025.0
125-250063-1250
5.75.3
Captafol II.1II.2
2.51.2
10-10005-500
5.35.7
Metoxicloro II.1 5.0 25-2000 5.1
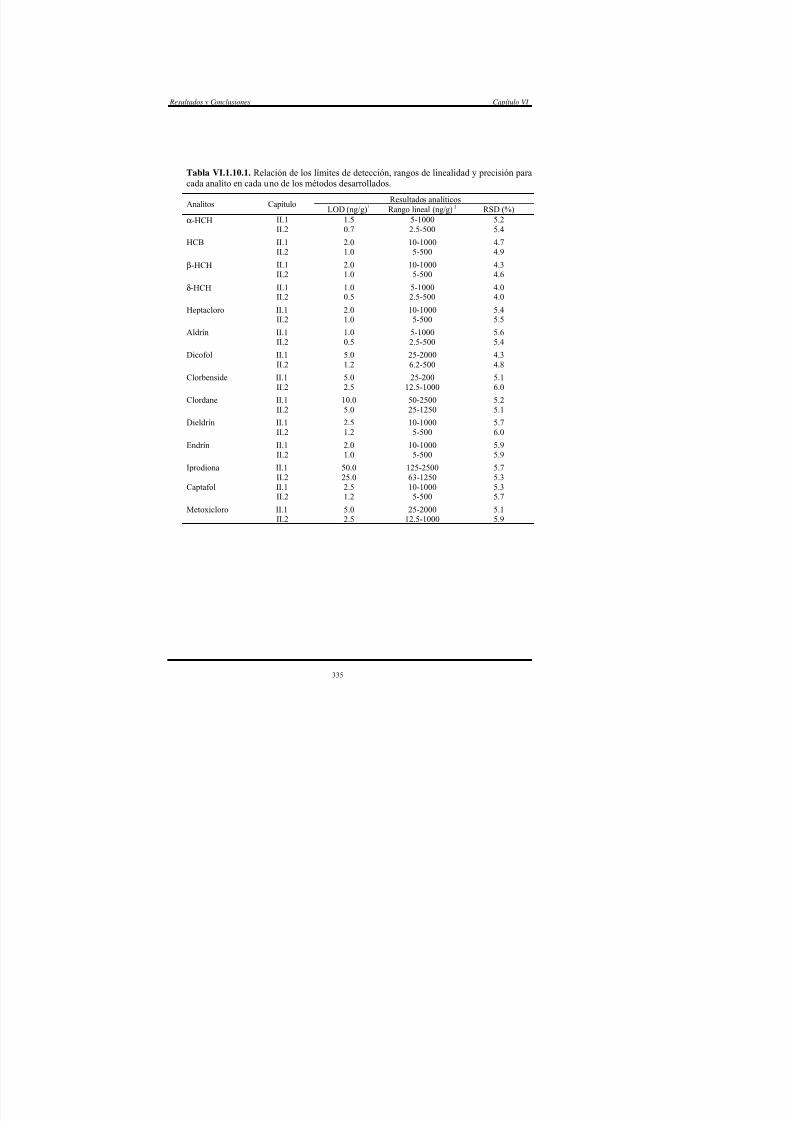
7/18/2019 Automatizacion y Miniaturizacion de Sistemas de Screening y Determinacion de Residuos de Plaguicidas en Muestra Agroalimentaria
http://slidepdf.com/reader/full/automatizacion-y-miniaturizacion-de-sistemas-de-screening-y-determinacion-de 335/393
eto c o o .
II.2
5.0
2.5
5 000
12.5-1000
5.
5.9
Almudena Columé Díaz Tesis Doctoral
Tabla VI.1.10.1. (Continuación). Resultados analíticos
Analitos CapítuloLOD (ng/g)1 Rango lineal (ng/g)1 RSD (%)
Diclorán II.1II.2III.2III.3
0.20.11.01.0
1-5000.4-2502-2005-200
4.74.64.54.8
Lindano II.1II.2III.2III.3
1.00.5
20.030.0
5-10002.5-50050-2000100-2000
5.25.65.35.7
Vinclozolina II.1II.2III.2
III.3
1.00.51.0
2.0
5-10002.5-5002-200
5-200
5.85.73.0
4.0Diclofuanida II.1
II.2III.2III.3
2.51.20.51.0
10-10005-5002-2005-200
5.95.84.05.1
Captán II.1II.2III.2III.3
1.50.7
20.030.0
5-10002.5-50080-2000100-2000
5.55.06.56.8
Procimidona II.1
II.2III.2III.3
2.0
1.01.02.0
10-1000
5-5002-2005-200
6.0
5.95.26.0
α-Endosulfán II.1II.2III.2III.3
2.01.01.02.0
10-10005-5002-2005-200
5.45.85.45.8
β-Endosulfán II.1II.2III.2
2.01.00.5
10-10005-5002-200
6.05.73.8
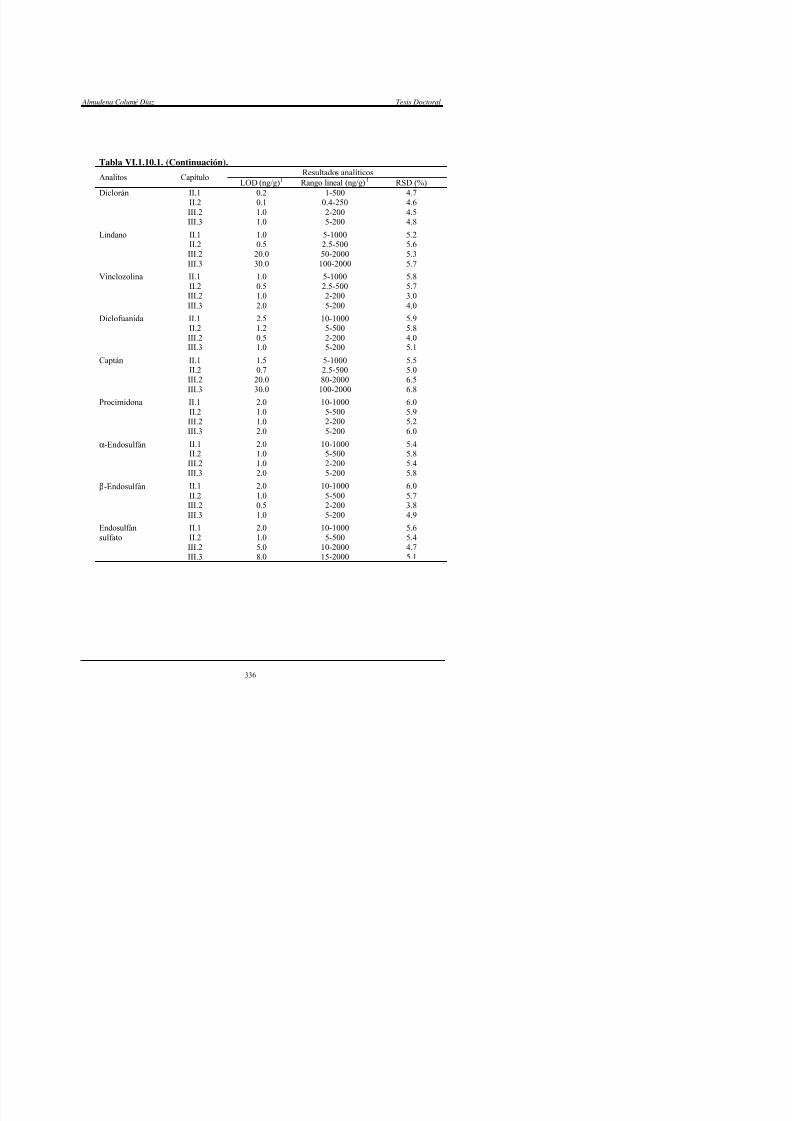
7/18/2019 Automatizacion y Miniaturizacion de Sistemas de Screening y Determinacion de Residuos de Plaguicidas en Muestra Agroalimentaria
http://slidepdf.com/reader/full/automatizacion-y-miniaturizacion-de-sistemas-de-screening-y-determinacion-de 336/393
III.3 1.0 5-200 4.9Endosulfánsulfato
II.1II.2III.2III.3
2.01.05.08.0
10-10005-500
10-200015-2000
5.65.44.75.1
Resultados y Conclusiones Capítulo VI
Tabla VI.1.10.1. (Continuación). Resultados analíticos
Analitos CapítuloLOD (ng/g)1 Rango lineal (ng/g)1 RSD (%)
Butóxido de piperonilo III.1 3.75 150-22500 4.4
Bifentrín III.1III.2III.3
1.51.01.0
15-300010-20005-2000
5.36.06.4
Fenpropatrín III.1III.2III.3
1.51.01.0
15-300010-20005-2000
5.05.05.3
λ-Cihalotrín III.1III.2III.3
1.51.01.0
15-300010-20005-2000
3.33.54.6
Permetrín III.1III.2III.3
12.08.0
10.0
30-300020-200020-2000
6.25.86.5
Ciflutrín III.1III.2III.3
6.04.05.0
15-300010-200010-2000
4.75.04.9
β-Ciflutrín III.1III.2III.3
3.02.02.0
15-300010-200010-2000
4.94.75.3
Cipermetrín III.1III.2III.3
6.04.05.0
15-300010-200010-2000
3.83.64.2
α-Cipermetrín III.1III.2III.3
1.51.01.0
15-300010-20005-2000
3.13.34.0
Fenvalerato III.1III.2III.3
3.02.02.0
15-300010-200010-2000
5.76.16.1
Deltametrín III.1 3.0 15-3000 6.3

7/18/2019 Automatizacion y Miniaturizacion de Sistemas de Screening y Determinacion de Residuos de Plaguicidas en Muestra Agroalimentaria
http://slidepdf.com/reader/full/automatizacion-y-miniaturizacion-de-sistemas-de-screening-y-determinacion-de 337/393
III.2III.3 2.02.0 10-200010-2000 5.85.0
1Los límites de detección y los rangos lineales de cuantificación están expresados por gramode muestra fresca para el Cap. II, y por gramo de muestra liofilizada en el Cap. III.
Almudena Columé Díaz Tesis Doctoral
Los límites de detección obtenidos no sólo permiten alcanzar los LMR
establecidos por la legislación europea y española en cada una de las matrices
estudiadas, sino que, de forma general, se sitúan por debajo de los límites de detección
analíticos señalados por dicha legislación hasta en los casos más restrictivos (10-20
ng/g muestra fresca) [8,9]. En cuanto a los rangos de linealidad, estos son lo
suficientemente amplios (2-3 órdenes de magnitud) y permiten la cuantificación a
niveles de partes por billón. La precisión es aceptable en todos los casos.
Los límites de detección y los rangos lineales correspondientes al Cap. II.1 son
el doble de los del Cap. II.2, debido a que, si bien el sistema de flujo empleado es el
mismo, al igual que lo es la cantidad de muestra procesada, el volumen de disolvente
extractante se encuentra en relación 5:1 entre ambos capítulos (II.1 y II.2) y el volumen
del mismo que es evaporado/redisuelto en la unidad de evaporación/redisolución en
relación 5:2. Así, resulta que la cantidad absoluta de cada analito redisuelta en los 5 ml
de agua destilada es doble en el Cap. II.2 que en el II.1, con su repercusión directa en
los resultados analíticos. La eficacia de los procesos de extracción y limpieza se ponen
claramente de manifiesto en este capítulo de la Memoria, ya que los límites de
detección que se alcanzan partiendo de una fruta fresca (Cap. II.2) son comparables con

7/18/2019 Automatizacion y Miniaturizacion de Sistemas de Screening y Determinacion de Residuos de Plaguicidas en Muestra Agroalimentaria
http://slidepdf.com/reader/full/automatizacion-y-miniaturizacion-de-sistemas-de-screening-y-determinacion-de 338/393
los obtenidos con disolución estándar (Cap. II.1), lo que indica que la línea de base de
los cromatogramas es similar en ambos casos.
También hay que señalar que en el caso de los métodos cuya muestra son
productos hortofrutícolas liofilizados (Cap. III), los límites de detección y rangos de
Resultados y Conclusiones Capítulo VI
muestra corresponde al caso más desfavorable, es decir, con menor proporción de agua
(naranja, 80% agua), mientras que para muestras con más humedad los límites de
detección serían menores, así como los valores extremos de los rangos lineales. De esta
forma, y para la mayoría de los plaguicidas organoclorados estudiados en muestras
frescas y liofilizadas (vinclozolina, diclofuanida, procimidona, α,β-endosulfán y
endosulfán sulfato) los límites de detección son menores cuando se utilizan muestras
liofilizadas. Las excepciones, diclorán, captán y lindano, muestran límites de detección
similares o algo superiores para ambos tipos de muestras.
Si se comparan los límites de detección y rangos lineales del Cap. III de esta
Memoria, en el que se trabaja con frutas y hortalizas liofilizadas, se puede apreciar una
ligera influencia de la matriz de la muestra en los límites de detección de plaguicidas
organoclorados (tomate vs. disoluciones estándar), mientras que para piretroides no se
aprecia este efecto. Una posible explicación a este hecho puede encontrarse en que la
mayor parte de las señales cromatográficas correspondientes a las matrices de las
muestras aparecen al principio del cromatograma y, al ser los plaguicidas
organoclorados los que presentan tiempos de retención más bajos, la posible
perturbación de la línea de base les afectaría más que a los compuestos que presentan

7/18/2019 Automatizacion y Miniaturizacion de Sistemas de Screening y Determinacion de Residuos de Plaguicidas en Muestra Agroalimentaria
http://slidepdf.com/reader/full/automatizacion-y-miniaturizacion-de-sistemas-de-screening-y-determinacion-de 339/393
tiempos de retención mayores (piretroides).
Por último, iprodiona es un plaguicida cuyos límites de detección y rangos de
linealidad son algo mayores que para el resto, como lo son también sus LMR
establecidos en matrices hortofrutícolas. Esto se debe a que su pico cromatográfico es
Almudena Columé Díaz Tesis Doctoral
sinérgico, butóxido de piperonilo, aunque su límite de detección es del mismo orden
que los demás plaguicidas, el límite de cuantificación es excepcionalmente alto (50
veces su LOD). Sin embargo, esta imposibilidad de cuantificación a niveles inferiores
no es un problema a la hora de satisfacer los requerimientos legales, puesto que su
LMR es de 500 ng/g en todas las matrices hortofrutícolas, según la legislación española
[8] (no está establecido en la europea).
B. RECUPERACIONES
Para evaluar la aplicabilidad de los métodos desarrollados y dada la
imposibilidad de encontrar materiales de referencia certificados de estas matrices con
los plaguicidas ensayados, se realizaron estudios de recuperación de los analitos en
muestras fortificadas a niveles próximos a sus LMR establecidos, entre 6-200 ng/g
(excepto para butóxido de piperonilo, 200-1000 ng/g), que según el método expuesto en
cada capítulo, podrán ser muestras frescas o liofilizadas. La siguiente Tabla VI.1.10.2
recoge los valores medios de dichas recuperaciones junto con la desviación estándar
calculada para tres muestras a cada nivel de fortificación.

7/18/2019 Automatizacion y Miniaturizacion de Sistemas de Screening y Determinacion de Residuos de Plaguicidas en Muestra Agroalimentaria
http://slidepdf.com/reader/full/automatizacion-y-miniaturizacion-de-sistemas-de-screening-y-determinacion-de 340/393
Resultados y Conclusiones Capítulo VI
Tabla VI.1.10.2. Recuperaciones de cada analito en cada tipo de muestra fresca (F) oliofilizada (L) fortificada.
Analitos Muestra CapítuloRecuperación
(%)
Media derecuperación
(%)LechugaTomate
EspinacaPatata
(F)(F)
(F)(F)
II.1II.1
II.1II.1
94 ± 696 ± 5
95 ± 5103 ± 5
97 ± 4
α-HCH
NectarinaMelónCerezaPlátano
(F)(F)(F)(F)
II.2II.2II.2II.2
87 ± 591 ± 695 ± 792 ± 5
91 ± 3
ZanahoriaBerenjenaTomatePatata
(F)(F)(F)(F)
II.1II.1II.1II.1
102 ± 5103 ± 6100 ± 599 ± 5
101 ± 2
HCB
NectarinaMelónMelocotón
NaranjaCiruela rojaCerezaManzanaFresaPlátano
(F)(F)(F)(F)(F)(F)(F)(F)(F)
II.2II.2II.2II.2II.2II.2II.2II.2II.2
97 ± 792 ± 591 ± 496 ± 599 ± 684 ± 688 ± 487 ± 598 ± 4
92 ± 5
β-HCH LechugaTomate
EspinacaPatata
(F)(F)
(F)(F)
II.1II.1
II.1II.1
93 ± 485 ± 4
94 ± 4102 ± 4
93 ± 7
NectarinaMelónCerezaPlátano
(F)(F)(F)(F)
II.2II.2II.2II.2
89 ± 596 ± 596 ± 798 ± 5
95 ± 4
LechugaTomateEspinacaPatata
(F)(F)(F)(F)
II.1II.1II.1II.1
93 ± 5103 ± 593 ± 4
102 ± 4
98 ± 5
δ-HCH
NectarinaM ló
(F)(F)
II.2II 2
101 ± 6103 ± 4

7/18/2019 Automatizacion y Miniaturizacion de Sistemas de Screening y Determinacion de Residuos de Plaguicidas en Muestra Agroalimentaria
http://slidepdf.com/reader/full/automatizacion-y-miniaturizacion-de-sistemas-de-screening-y-determinacion-de 341/393
MelónCerezaPlátano
(F)(F)(F)
II.2II.2II.2
103 ± 497 ± 5
102 ± 5
101 ± 3
CebollaLechugaZanahoriaEspinaca
(F)(F)(F)(F)
II.1II.1II.1II.1
102 ± 694 ± 5
105 ± 796 ± 6
99 ± 5
Heptacloro
Melón Naranja
(F)(F)
II.2II.2
88 ± 588 ± 6
Almudena Columé Díaz Tesis Doctoral
Tabla VI.1.10.2. (Continuación).
Analitos Muestra CapítuloRecuperación
(%)
Media derecuperación
(%)ZanahoriaPimientoPatata
Pepino
(F)(F)(F)
(F)
II.1II.1II.1
II.1
104 ± 697 ± 697 ± 6
102 ± 7
100 ± 4
Aldrín
NectarinaMelónMelocotón
NaranjaCiruela rojaCerezaPeraManzanaFresaPlátano
(F)(F)(F)(F)(F)(F)(F)(F)(F)(F)
II.2II.2II.2II.2II.2II.2II.2II.2II.2II.2
101 ± 6100 ± 695 ± 599 ± 689 ± 590 ± 6
105 ± 690 ± 698 ± 690 ± 5
96 ± 6
ZanahoriaPimientoBerenjenaPatata
(F)(F)(F)(F)
II.1II.1II.1II.1
84 ± 490 ± 593 ± 599 ± 5
91 ± 6 (F)
Dicofol
Melón NaranjaCerezaPeraManzanaFresaPlátano
(F)(F)(F)(F)(F)(F)(F)
II.2II.2II.2II.2II.2II.2II.2
102 ± 4109 ± 490 ± 7
105 ± 590 ± 598 ± 590 ± 4
98 ± 8 (F)
ZanahoriaPimientoBerenjenaPatata
(F)(F)(F)(F)
II.1II.1II.1II.1
96 ± 579 ± 491 ± 589 ± 5
89 ± 7 (F)
Clorbenside
NectarinaMelón
NaranjaCiruela rojaCerezaPera
Manzana
(F)(F)(F)(F)(F)(F)
(F)
II.2II.2II.2II.2II.2II.2
II 2
97 ± 698 ± 699 ± 693 ± 699 ± 6
103 ± 6
91 ± 6
97 ± 4 (F)

7/18/2019 Automatizacion y Miniaturizacion de Sistemas de Screening y Determinacion de Residuos de Plaguicidas en Muestra Agroalimentaria
http://slidepdf.com/reader/full/automatizacion-y-miniaturizacion-de-sistemas-de-screening-y-determinacion-de 342/393
ManzanaFresaPlátano
(F)(F)(F)
II.2II.2II.2
91 ± 695 ± 6102 ± 7
LechugaTomatePatataPepino
(F)(F)(F)(F)
II.1II.1II.1II.1
92 ± 591 ± 586 ± 4
109 ± 6
94 ± 10 (F)
Clordano
NaranjaCiruela rojaCereza
(F)(F)(F)
II.2II.2II 2
92 ± 591 ± 685 ± 5 88 ± 5 (F)
Resultados y Conclusiones Capítulo VI
Tabla VI.1.10.2. (Continuación).
Analitos Muestra CapítuloRecuperación
(%)
Media derecuperación
(%)ZanahoriaPimientoPatata
Pepino
(F)(F)(F)
(F)
II.1II.1II.1
II.1
88 ± 697 ± 695 ± 6
92 ± 6
93 ± 4 (F)
Dieldrín
NectarinaMelónMelocotón
NaranjaCiruela rojaCerezaPeraManzanaFresaPlátano
(F)(F)(F)(F)(F)(F)(F)(F)(F)(F)
II.2II.2II.2II.2II.2II.2II.2II.2II.2II.2
96 ± 5105 ± 7101 ± 699 ± 7
100 ± 591 ± 692 ± 594 ± 593 ± 695 ± 6
97 ± 5 (F)
PimientoPatataPepinoEspinaca
(F)(F)(F)(F)
II.1II.1II.1II.1
91 ± 6100 ± 6103 ± 698 ± 6
98 ± 5 (F)
Endrín
NectarinaMelónMelocotón
NaranjaCiruela rojaCerezaPeraManzanaFresaPlátano
(F)(F)(F)(F)(F)(F)(F)(F)(F)(F)
II.2II.2II.2II.2II.2II.2II.2II.2II.2II.2
103 ± 5104 ± 6101 ± 696 ± 4
108 ± 796 ± 593 ± 590 ± 6
101 ± 5102 ± 7
99 ± 5 (F)
Berenjena (F) II.1 94 ± 6 94 ± 6 (F)IprodionaManzana (F) II.2 86 ± 5 86 ± 5 (F)
Berenjena (F) II.1 81 ± 6 81 ± 6 (F)Captafol NaranjaCiruela rojaPeraFresa
Plátano
(F)(F)(F)(F)
(F)
II.2II.2II.2II.2
II 2
100 ± 589 ± 694 ± 495 ± 5
90 ± 6
94 ± 4 (F)

7/18/2019 Automatizacion y Miniaturizacion de Sistemas de Screening y Determinacion de Residuos de Plaguicidas en Muestra Agroalimentaria
http://slidepdf.com/reader/full/automatizacion-y-miniaturizacion-de-sistemas-de-screening-y-determinacion-de 343/393
Plátano (F) II.2 90 ± 6ZanahoriaBerenjenaEspinacaPatata
(F)(F)(F)(F)
II.1II.1II.1II.1
96 ± 689 ± 599 ± 6
106 ± 6
97 ± 7 (F)
Metoxicloro
MelónMelocotón
NaranjaCiruela roja
(F)(F)(F)(F)
II.2II.2II.2II.2
102 ± 6100 ± 490 ± 592 ± 4 97 ± 5 (F)
Almudena Columé Díaz Tesis Doctoral
Tabla VI.1.10.2. (Continuación).
Analitos Muestra CapítuloRecuperación
(%)
Media derecuperación
(%)Cebolla
Pimiento
Pepino
LechugaColiflor
(F)(L)(F)
(L)(F)(L)(F)(L)
II.1III.3II.1
III.3II.1III.3II.1III.3
87 ± 593 ± 498 ± 5
93 ± 498 ± 593 ± 296 ± 594 ± 4
95 ± 5 (F)
93 ± 1 (L)
Diclorán
Melón
Melocotón
Naranja
Cereza
Pera
Manzana
Fresa
Ciruela roja
(F)(L)(F)(L)(F)(L)
(F)(L)(F)(L)(F)(L)(F)(L)(F)
II.2III.2II.2III.2II.2III.2
II.2III.2II.2III.2II.2III.2II.2III.2II.2
83 ± 598 ± 195 ± 698 ± 388 ± 495 ± 2
82 ± 699 ± 495 ± 492 ± 498 ± 797 ± 491 ± 597 ± 184 ± 5
89 ± 6 (F)
97 ± 2 (L)
Pimiento
Tomate
Espinaca
Patata
Pepino
LechugaCebollaBerenjena
(F)(L)(F)(L)(F)(L)(F)(L)(F)(L)(F)(L)(L)
II.1III.3II.1III.3II.1III.3II.1III.3II.1III.3II.1III.3III.3
100 ± 694 ± 4
101 ± 697 ± 499 ± 595 ± 5
103 ± 593 ± 597 ± 696 ± 497 ± 691 ± 497 ± 4
99 ± 2 (F)
95 ± 2 (L)
Lindano
Melón (F) II.2 91 ± 6

7/18/2019 Automatizacion y Miniaturizacion de Sistemas de Screening y Determinacion de Residuos de Plaguicidas en Muestra Agroalimentaria
http://slidepdf.com/reader/full/automatizacion-y-miniaturizacion-de-sistemas-de-screening-y-determinacion-de 344/393
Melón
Naranja
Cereza
Manzana
NectarinaPlát
(F)(L)(F)(L)(F)(L)(F)(L)(F)(F)
II.2III.2II.2III.2II.2III.2II.2III.2II.2II 2
91 6100 ± 3103 ± 595 ± 799 ± 594 ± 693 ± 796 ± 7
103 ± 5106 ± 7
99 ± 6 (F)
95 ± 4 (L)
Resultados y Conclusiones Capítulo VI
Tabla VI.1.10.2. (Continuación).
Analitos Muestra CapítuloRecuperación
(%)
Media derecuperación
(%)Cebolla
Pimiento
Tomate
Espinaca
Pepino
Berenjena
(F)(L)(F)
(L)(F)(L)(F)(L)(F)(L)(L)
II.1III.3II.1
III.3II.1III.3II.1III.3II.1III.3III.3
93 ± 697 ± 493 ± 7
95 ± 393 ± 695 ± 3
102 ± 696 ± 498 ± 696 ± 395 ± 3
96 ± 4 (F)
96 ± 1 (L)
Vinclozolina
Melón
Melocotón
Naranja
Cereza
Pera
Manzana
Fresa
Ciruela rojaPlátanoKiwi
(F)(L)(F)
(L)(F)(L)(F)(L)(F)(L)(F)(L)(F)(L)
(F)(F)(L)
II.2III.2II.2
III.2II.2III.2II.2III.2II.2III.2II.2III.2II.2III.2
II.2II.2III.2
81 ± 593 ± 980 ± 5
92 ± 881 ± 491 ± 671 ± 494 ± 770 ± 494 ± 982 ± 695 ± 981 ± 593 ± 7
71 ± 578 ± 592 ± 6
77 ± 5 (F)
93 ± 1 (L)
Cebolla
ColiflorTomate
(F)(L)(L)(L)
II.1III.3III.3III.3
95 ± 693 ± 495 ± 297 ± 3
95 ± 6 (F)
97 ± 2 (L)
Diclofuanida
Melón
Naranja
Cereza
(F)(L)(F)(L)(F)
II.2III.2II.2III.2II.2
99 ± 695 ± 7
102 ± 694 ± 690 ± 6

7/18/2019 Automatizacion y Miniaturizacion de Sistemas de Screening y Determinacion de Residuos de Plaguicidas en Muestra Agroalimentaria
http://slidepdf.com/reader/full/automatizacion-y-miniaturizacion-de-sistemas-de-screening-y-determinacion-de 345/393
Pera
Manzana
Fresa
Nectarina
( )(L)(F)(L)(F)(L)(F)(L)(F)
III.2II.2III.2II.2III.2II.2III.2II.2
95 ± 590 ± 595 ± 5
102 ± 697 ± 294 ± 691 ± 6
107 ± 7
98 ± 7 (F)
95 ± 2 (L)
Almudena Columé Díaz Tesis Doctoral
Tabla VI.1.10.2. (Continuación).
Analitos Muestra CapítuloRecuperación
(%)
Media derecuperación
(%)Berenjena
Tomate
LechugaZanahoriaCebollaPepinoColiflorPimiento
(F)(L)(F)
(L)(F)(F)(L)(L)(L)(L)
II.1III.3II.1
III.3II.1II.1III.3III.3III.3III.3
66 ± 485 ± 564 ± 3
88 ± 475 ± 470 ± 481 ± 483 ± 385 ± 584 ± 4
69 ± 5 (F)
84 ± 2 (L)
Captán
Naranja
Fresa
NectarinaManzanaMelón
(F)(L)(F)(L)
(F)(L)(L)
II.2III.2II.2III.2
II.2III.2III.2
79 ± 488 ± 587 ± 584 ± 6
75 ± 485 ± 686 ± 7
80 ± 6 (F)
86 ± 2 (L)
Pimiento
Pepino
Cebolla
LechugaTomate
(F)(L)(F)(L)(F)(L)(F)(L)
II.1III.3II.1III.3II.1III.3II.1III.3
99 ± 695 ± 596 ± 695 ± 383 ± 593 ± 386 ± 696 ± 4
91 ± 8 (F)
95 ± 1 (L)
Procimidona
Melón
Melocotón
Naranja
Pera
NectarinaCiruela rojaManzanaFresa
(F)(L)(F)(L)(F)(L)(F)(L)(F)(F)(L)(L)
II.2III.2II.2III.2II.2III.2II.2III.2II.2II.2III.2III.2
72 ± 497 ± 378 ± 595 ± 584 ± 594 ± 478 ± 696 ± 283 ± 770 ± 595 ± 297 ± 1
75 ± 6 (F)
96 ± 1 (L)

7/18/2019 Automatizacion y Miniaturizacion de Sistemas de Screening y Determinacion de Residuos de Plaguicidas en Muestra Agroalimentaria
http://slidepdf.com/reader/full/automatizacion-y-miniaturizacion-de-sistemas-de-screening-y-determinacion-de 346/393
Resultados y Conclusiones Capítulo VI
Tabla VI.1.10.2. (Continuación).
Analitos Muestra CapítuloRecuperación
(%)
Media derecuperación
(%)Pimiento
Espinaca
Patata
PepinoBerenjenaTomate
(F)(L)(F)
(L)(F)(L)(L)(L)(L)
II.1III.3II.1
III.3II.1III.3III.3III.3III.3
93 ± 683 ± 488 ± 6
88 ± 396 ± 685 ± 384 ± 485 ± 487 ± 5
92 ± 4 (F)
85 ± 2 (L)
α-Endosulfán
Melocotón
Cereza
Pera
Manzana
NectarinaPlátanoKiwiMelón
(F)(L)(F)(L)(F)
(L)(F)(L)(F)(F)(L)(L)
II.2III.2II.2III.2II.2
III.2II.2III.2II.2II.2III.2III.2
92 ± 687 ± 6
103 ± 685 ± 793 ± 6
83 ± 895 ± 684 ± 791 ± 5
106 ± 584 ± 888 ± 7
97 ± 6 (F)
85 ± 2 (L)
Pimiento
Espinaca
Patata
PepinoBerenjenaTomate
(F)(L)(F)(L)
(F)(L)(L)(L)(L)
II.1III.3II.1III.3
II.1III.3III.3III.3III.3
104 ± 795 ± 392 ± 696 ± 4
102 ± 694 ± 496 ± 493 ± 498 ± 4
99 ± 6 (F)
95 ± 2 (L)
β-Endosulfán
Melocotón
Cereza
Pera
Manzana
(F)(L)(F)(L)(F)(L)
(F)(L)
II.2III.2II.2III.2II.2III.2
II.2III 2
106 ± 795 ± 5
101 ± 791 ± 597 ± 693 ± 5
98 ± 692 ± 8
101 ± 5 (F)
93 ± 1 (L)
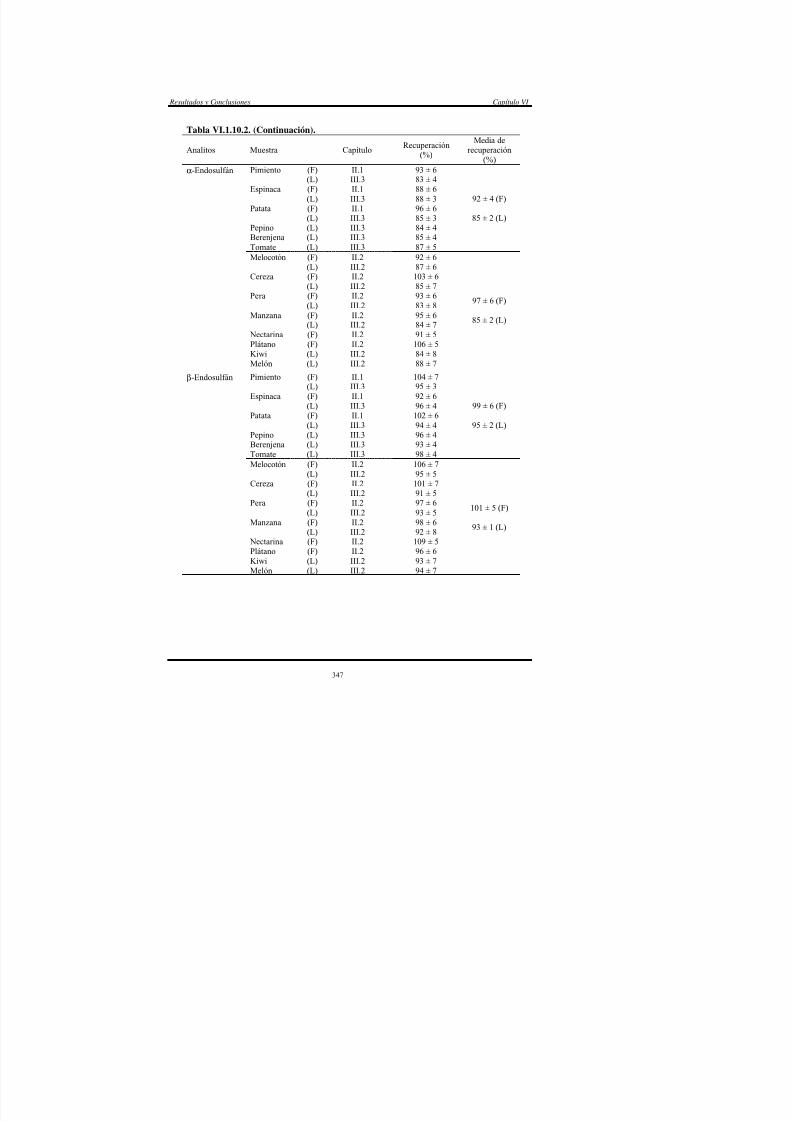
7/18/2019 Automatizacion y Miniaturizacion de Sistemas de Screening y Determinacion de Residuos de Plaguicidas en Muestra Agroalimentaria
http://slidepdf.com/reader/full/automatizacion-y-miniaturizacion-de-sistemas-de-screening-y-determinacion-de 347/393
NectarinaPlátanoKiwiMelón
(L)(F)(F)(L)(L)
III.2II.2II.2III.2III.2
92 ± 8109 ± 596 ± 693 ± 794 ± 7
( )
Almudena Columé Díaz Tesis Doctoral
Tabla VI.1.10.2. (Continuación).
Analitos Muestra CapítuloRecuperación
(%)
Media derecuperación
(%)Pimiento
Espinaca
Patata
PepinoBerenjenaTomate
(F)(L)(F)
(L)(F)(L)(L)(L)(L)
II.1III.3II.1
III.3II.1III.3III.3III.3III.3
96 ± 693 ± 697 ± 7
97 ± 3103 ± 796 ± 298 ± 395 ± 298 ± 3
99 ± 4 (F)
96 ± 2 (L)
Endosulfánsulfato
Melocotón
Pera
Manzana
NectarinaKiwiMelónCereza
(F)(L)(F)(L)(F)
(L)(F)(L)(L)(L)
II.2III.2II.2III.2II.2
III.2II.2III.2III.2III.2
91 ± 697 ± 492 ± 596 ± 290 ± 5
95 ± 183 ± 696 ± 393 ± 195 ± 3
89 ± 4 (F)
95 ± 1 (L)
CebollaEspinacaPepinoColiflorBerenjenaTomate
(L)(L)(L)(L)(L)(L)
III.3III.3III.3III.3III.3III.3
65 ± 276 ± 371 ± 367 ± 275 ± 371 ± 3
71 ± 4 (L)
Bifentrín
ManzanaMelocotónPeraFresaMelón
Naranja
(L)(L)(L)(L)(L)(L)
III.2III.2III.2III.2III.2III.2
66 ± 270 ± 376 ± 468 ± 170 ± 269 ± 1
70 ± 3 (L)
EspinacaPepinoColiflorBerenjena
TomatePimiento
(L)(L)(L)(L)
(L)(L)
III.3III.3III.3III.3
III.3III.3
95 ± 490 ± 388 ± 390 ± 4
95 ± 493 ± 3
92 ± 3 (L)
Fenpropatrín

7/18/2019 Automatizacion y Miniaturizacion de Sistemas de Screening y Determinacion de Residuos de Plaguicidas en Muestra Agroalimentaria
http://slidepdf.com/reader/full/automatizacion-y-miniaturizacion-de-sistemas-de-screening-y-determinacion-de 348/393
ManzanaPeraFresaKiwi
(L)(L)(L)(L)
III.2III.2III.2III.2
91 ± 492 ± 193 ± 992 ± 8
92 ± 1 (L)
Resultados y Conclusiones Capítulo VI
Tabla VI.1.10.2. (Continuación).
Analitos Muestra CapítuloRecuperación
(%)
Media derecuperación
(%)EspinacaPepinoColiflor
BerenjenaPimiento
(L)(L)(L)
(L)(L)
III.3III.3III.3
III.3III.3
97 ± 592 ± 393 ± 4
97 ± 590 ± 4
94 ± 3 (L)
λ-Cihalotrín
PeraFresaMelónCereza
Naranja
(L)(L)(L)(L)(L)
III.2III.2III.2III.2III.2
93 ± 898 ± 795 ± 797 ± 698 ± 8
96 ± 2 (L)
EspinacaColiflorBerenjenaTomate
Pimiento
(L)(L)(L)(L)
(L)
III.3III.3III.3III.3
III.3
93 ± 484 ± 395 ± 592 ± 4
92 ± 4
91 ± 4 (L)
Permetrín
ManzanaMelocotón
Naranja
(L)(L)(L)
III.2III.2III.2
88 ± 890 ± 791 ± 5
90 ± 2 (L)
CebollaColiflorPatataTomate
(L)(L)(L)(L)
III.3III.3III.3III.3
89 ± 591 ± 498 ± 596 ± 3
93 ± 4 (L)
Ciflutrín
MelocotónCereza
(L)(L)
III.2III.2
88 ± 290 ± 2
89 ± 1 (L)
CebollaColiflorPatataTomate
(L)(L)(L)(L)
III.3III.3III.3III.3
94 ± 496 ± 4
100 ± 488 ± 5
94 ± 4 (L)β-Ciflutrín
MelocotónCereza
(L)(L)
III.2III.2
93 ± 792 ± 6
93 ± 1 (L)
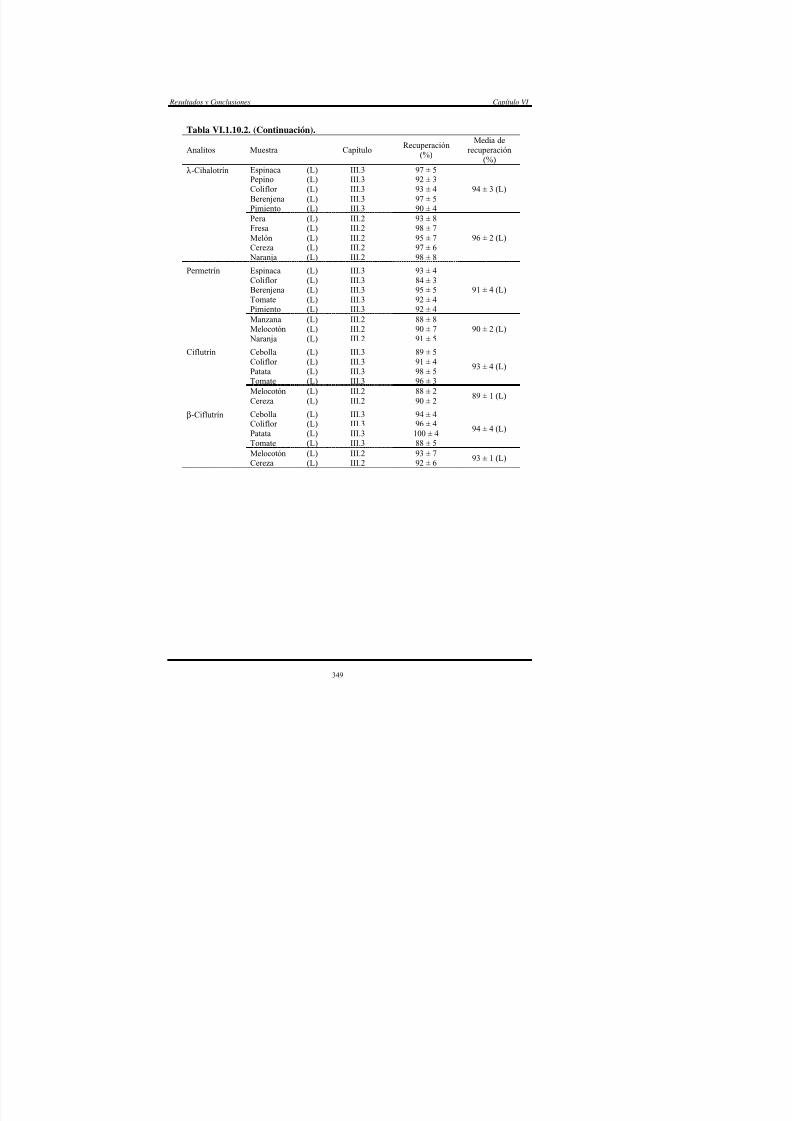
7/18/2019 Automatizacion y Miniaturizacion de Sistemas de Screening y Determinacion de Residuos de Plaguicidas en Muestra Agroalimentaria
http://slidepdf.com/reader/full/automatizacion-y-miniaturizacion-de-sistemas-de-screening-y-determinacion-de 349/393
Almudena Columé Díaz Tesis Doctoral
Tabla VI.1.10.2. (Continuación).
Analitos Muestra CapítuloRecuperación
(%)
Media derecuperación
(%)CebollaEspinacaPatata
TomatePimiento
(L)(L)(L)
(L)(L)
III.3III.3III.3
III.3III.3
92 ± 398 ± 394 ± 4
89 ± 390 ± 3
93 ± 4 (L)
Cipermetrín
ManzanaMelocotónPeraFresaKiwiMelón
(L)(L)(L)(L)(L)(L)
III.2III.2III.2III.2III.2III.2
97 ± 285 ± 497 ± 198 ± 293 ± 597 ± 2
94 ± 4 (L)
CebollaEspinacaPatata
TomatePimiento
(L)(L)(L)
(L)(L)
III.3III.3III.3
III.3III.3
91 ± 492 ± 390 ± 4
93 ± 489 ± 3
91 ± 1 (L)
α-Cipermetrín
MelocotónPeraFresaKiwi
(L)(L)(L)(L)
III.2III.2III.2III.2
91 ± 692 ± 395 ± 895 ± 3
93 ± 2 (L)
EspinacaColiflorBerenjenaPimiento
(L)(L)(L)(L)
III.3III.3III.3III.3
92 ± 396 ± 487 ± 386 ± 3
90 ± 4 (L)
Fenvalerato
KiwiCereza (L)(L) III.2III.2 92 ± 490 ± 5 91 ± 1 (L)
EspinacaPepinoColiflorBerenjenaPimiento
(L)(L)(L)(L)(L)
III.3III.3III.3III.3III.3
81 ± 376 ± 477 ± 478 ± 479 ± 2
78 ± 2 (L)
Deltametrín
MelónCereza
Naranja
(L)(L)(L)
III.2III.2III.2
84 ± 680 ± 482 ± 5
82 ± 2 (L)
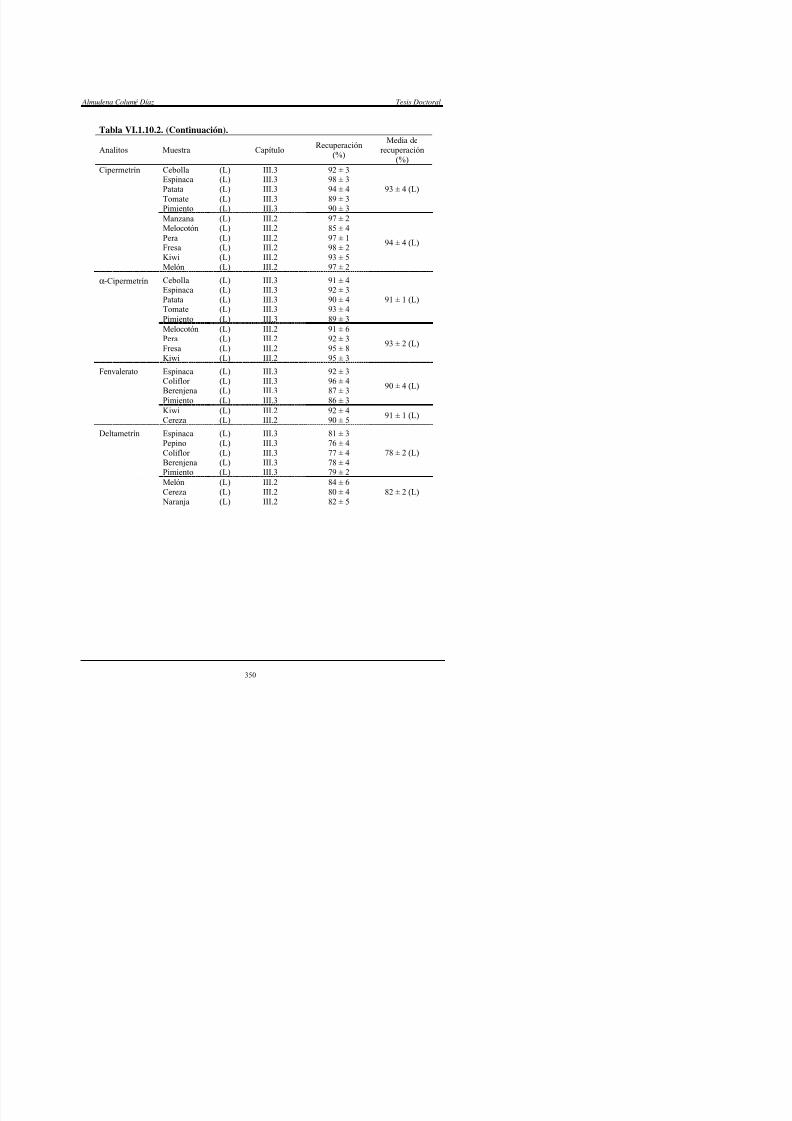
7/18/2019 Automatizacion y Miniaturizacion de Sistemas de Screening y Determinacion de Residuos de Plaguicidas en Muestra Agroalimentaria
http://slidepdf.com/reader/full/automatizacion-y-miniaturizacion-de-sistemas-de-screening-y-determinacion-de 350/393
Resultados y Conclusiones Capítulo VI
Los resultados de las recuperaciones pueden ser comentados desde diferentes
perspectivas, pero desde el punto de vista general, todos los plaguicidas, en los
diferentes métodos utilizados, obtienen recuperaciones de más del 90%, excepto captán
(64-88%) del grupo de plaguicidas organoclorados, y bifentrín (65-76%) y deltametrín
(76-84%) del grupo de los piretroides. En cuanto a las matrices, no hay diferencias
significativas en la aplicación de los diferentes métodos a frutas u hortalizas (quizás
ligeramente mejor para hortalizas). La nectarina es la fruta que presenta recuperaciones
sensiblemente menores cuando se determinan los analitos en frutas frescas (Cap. II.2),
mientras que de las frutas liofilizadas no hay ninguna destacable (la nectarina no fue
utilizada en el Cap. III.2). En cuanto a las hortalizas, la berenjena es la matriz fresca
que proporciona recuperaciones ligeramente menores, aunque liofilizada no presenta
diferencias significativas con respecto a las demás matrices hortícolas liofilizadas. El
pimiento es la única matriz cuyas recuperaciones son sensiblemente menores tanto
fresca como liofilizada, debido a que es precisamente la que proporciona el extracto
más sucio, independientemente de que la matriz esté o no liofilizada. Sin embargo,
matrices como la cebolla reconocidas como muy sucias en la bibliografía, no
presentaron problemas con las metodologías desarrolladas en esta Memoria.
Para realizar los estudios de recuperación de muestras liofilizadas, la
7/18/2019 Automatizacion y Miniaturizacion de Sistemas de Screening y Determinacion de Residuos de Plaguicidas en Muestra Agroalimentaria
http://slidepdf.com/reader/full/automatizacion-y-miniaturizacion-de-sistemas-de-screening-y-determinacion-de 351/393
p
fortificación se realizó en la matriz fresca antes de someterse al proceso de liofilización,
previo estudio del comportamiento de los analitos estudiados frente a dicho proceso de
liofilización, como ya ha sido comentado en el Cap. VI.1.3 sobre pretratamiento de la
Almudena Columé Díaz Tesis Doctoral
Si se comparan las recuperaciones de los plaguicidas organoclorados estudiados
en muestras frescas (Cap. II) y liofilizadas (Cap. III.2 y III.3), puede observarse que son
muy similares, alrededor del 95%, excepto para tres analitos (vinclozolina, captán y
procimidona), para los cuales las recuperaciones desde algunas matrices frescas son
menores del 80%, mientras que desde las liofilizadas son mucho mayores. Estos
plaguicidas son vinclozolina (fruta fresca, 77%; fruta liofilizada, 93%), captán
(hortaliza fresca, 69; hortaliza liofilizada, 84%) y procimidona (fruta fresca, 75; fruta
liofilizada, 96%). Por el contrario, α-endosulfán y β-endosulfán presentan unas
recuperaciones sensiblemente mejores para las matrices frescas que para las liofilizadas
(hortaliza fresca 92 y 99% frente a las liofilizadas 85 y 95%, respectivamente; fruta
fresca 97 y 101% frente a las liofilizadas 85 y 93%, respectivamente). Este hecho puede
ser debido a una extracción menos efectiva de estos plaguicidas con n-hexano (Cap.
III.2 y III.3) que cuando la fase es menos apolar (Cap. II)
Por tanto, y puesto que los plaguicidas organoclorados con menores
recuperaciones desde muestras frescas (principalmente captán) mejoran las mismas
usando muestras liofilizadas, que para el resto de organoclorados son similares en
ambos tipos de muestras y que únicamente α-endosulfán y β-endosulfán disminuyen
sus recuperaciones con muestras liofilizadas, pero sólo al 85% en el caso más

7/18/2019 Automatizacion y Miniaturizacion de Sistemas de Screening y Determinacion de Residuos de Plaguicidas en Muestra Agroalimentaria
http://slidepdf.com/reader/full/automatizacion-y-miniaturizacion-de-sistemas-de-screening-y-determinacion-de 352/393
p , p
desfavorable, podemos afirmar que el uso de muestras liofilizadas proporciona mejores
resultados, además de la ventaja que supone el proceso de la liofilización en la
conservación de las muestras hortofrutícolas
Resultados y Conclusiones Capítulo VI
A pesar de que los métodos desarrollados proporcionan extractos bastante
limpios, es inevitable la presencia de algunos coextractos procedentes de las matrices.
Sin embargo, los picos cromatográficos de los mismos no interfirieron el la resolución
cromatográfica de los analitos. Así, en el caso de muestras liofilizadas, dichos picos
cromatográficos se sitúan al principio de los cromatogramas, de manera que de ninguna
forma afectan a la zona donde se sitúan los picos correspondientes a los plaguicidas. En
cuanto a los cromatogramas de muestras frescas, las pocas interferencias existentes se
sitúan a lo largo del cromatograma, pero en ningún caso solapan con los picos
cromatográficos de los analitos. De cualquier manera, los cromatogramas de muestras
liofilizadas fueron siempre más limpios que los de las muestras frescas, como se puede
observar en la Figura VI.1.10.1, lo cual supone otra ventaja de la liofilización de las
muestras hortofrutícolas en la determinación de estos plaguicidas.
Por último, aunque la retención de los piretroides sobre la columna de sílica es
del 100% en todos los casos, tanto en su determinación individual en el Cap. III.1,
como en la conjunta con los organoclorados en los Cap. III.2 y III.3, la ausencia de
diferencias significativas en las recuperaciones de los mismos en dichos capítulos pone
de manifiesto que su separación/determinación no se ve afectada por la presencia de los
plaguicidas organoclorados.

7/18/2019 Automatizacion y Miniaturizacion de Sistemas de Screening y Determinacion de Residuos de Plaguicidas en Muestra Agroalimentaria
http://slidepdf.com/reader/full/automatizacion-y-miniaturizacion-de-sistemas-de-screening-y-determinacion-de 353/393
Almudena Columé Díaz Tesis Doctoral
A )
B )
C )
D )
A )
B )
C )
D )
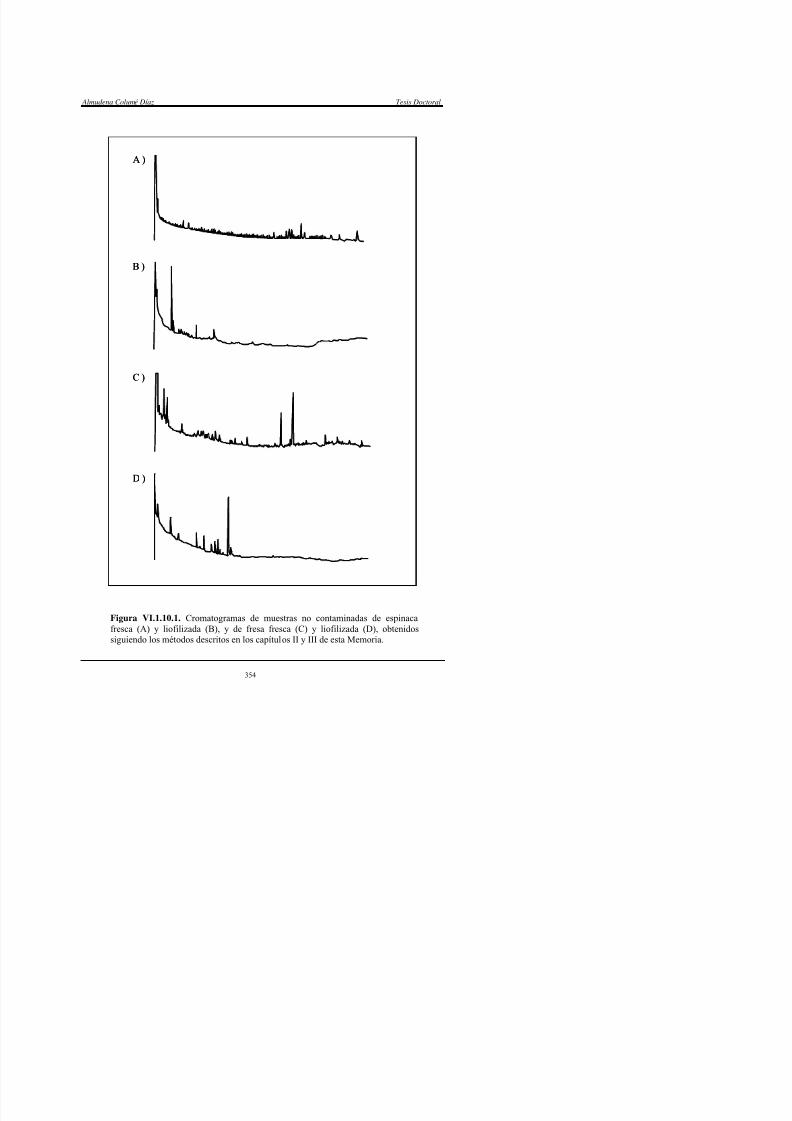
7/18/2019 Automatizacion y Miniaturizacion de Sistemas de Screening y Determinacion de Residuos de Plaguicidas en Muestra Agroalimentaria
http://slidepdf.com/reader/full/automatizacion-y-miniaturizacion-de-sistemas-de-screening-y-determinacion-de 354/393
Resultados y Conclusiones Capítulo VI
C. MUESTRAS POSITIVAS
De un total de 349 muestras hortofrutícolas estudiadas (159 hortalizas y
190 frutas), los resultados positivos por presencia de plaguicidas (Tabla VI.1.10.3)
han supuesto el 12% de las mismas, sin que exista una tendencia hacia uno de los
dos grupos de muestras. En cambio, sí podemos comentar que la fresa y la
manzana, y el pimiento y el tomate, son las frutas y hortalizas, respectivamente, que
mayor número de resultados positivos han arrojado. Por otro lado, los plaguicidas
cuyos residuos han sido más veces detectados fueron vinclozolina, procimidona,
cipermetrín, bifentrín y λ-cihalotrín. Sin embargo, tan sólo seis muestras se sitúan
por encima del LMR establecido en cada caso [para tres de ellas (fenvalerato en
tomate y kiwi, captán en naranja) según la legislación vigente en septiembre 2001,
aunque no en el momento en que se realizó el estudio, y para otra (λ-cihalotrín en
fresa) no sería positiva si se contempla la legislación actual, pero sí cuando se
realizó su determinación]. Esto significa que sólo el 1.5% de las muestras evaluadas
no cumplían con los requisitos exigidos por la Unión Europea en materia de
residuos de plaguicidas, aunque el resultado positivo de la procimidona en manzana
es alarmante, 20 veces mayor que la concentración permitida.
Las muestras en las que no se han encontrado residuos de plaguicidas son:

7/18/2019 Automatizacion y Miniaturizacion de Sistemas de Screening y Determinacion de Residuos de Plaguicidas en Muestra Agroalimentaria
http://slidepdf.com/reader/full/automatizacion-y-miniaturizacion-de-sistemas-de-screening-y-determinacion-de 355/393
ciruela roja, zanahoria, lechuga y champiñón, y los plaguicidas que no han
aparecido a niveles detectables son: α,β,δ-HCH, HCB, heptacloro, aldrín, dieldrín,
clorbenside, clordano, β-endosulfán, endosulfán sulfato, iprodiona, captafol,
Almudena Columé Díaz Tesis Doctoral
Tabla VI.1.10.3. Relación de muestras hortofrutícolas encontradas con residuos de los plaguicidas estudiados a lo largo de esta Memoria.
Muestra Capítulo PlaguicidaConcentración
(ng/g)1 LMR (UE)2
(ng/g)Espinaca III.1
III.3CipermetrínCipermetrín
420 ± 20385 ± 20
500500
Acelga III.1 Cipermetrín 90 ± 5 500Pimiento III.1III.3III.3III.3
BifentrínDicloránDicloránPermetrín
96 ± 76 ± 19 ± 1
215 ± 15
NE3 NE3
NE3
500Tomate III.1
III.3III.3
FenvaleratoDiclofuanidaProcimidona
650 ± 4014 ± 1
529 ± 33
1000 (20)50002000
Patata III.3III.3
α-EndosulfánCipermetrín
31 ± 2280 ± 15
5050
Pepino III.3
III.3
Deltametrín
Captán
48 ± 3
85 ± 6
100
100Berenjena III.3 Bifentrín 8 ± 1 NE3 Coliflor III.3
III.3DiclofuanidaPermetrín
39 ± 355 ± 4
5000100
Cebolla III.3 Bifentrín 8 ± 1 NE3 Melocotón II.2
III.2VinclozolinaVinclozolina
6.0 ± 0.323 ± 4
2000 (50)2000 (50)
Nectarina II.2 Captán 5.0 ± 0.2 2000Plátano II.2 Dicofol 7.3 ± 0.4 2000 (20)Fresa II.2
II.2
III.1III.2III.2
DiclofuanidaVinclozolina
λ-CihalotrínProcimidonaλ-Cihalotrín
6.4 ± 0.44.8 ± 0.3
24 ± 2109 ± 814 ± 4
100005000
20 (500)500020 (500)
Manzana II.2III.1III.2
LindanoPermetrínProcimidona
4.5 ± 0.3170 ± 12400 ± 35
10001000
20Pera III.1
III.2λ-CihalotrínProcimidona
55 ± 3136 ± 9
1001000
Naranja III.1III.2
BifentrínCaptán
85 ± 5530 ± 25
NE3 3000 (100)
Kiwi III.2
III.2
Vinclozolina
Fenvalerato
2600 ± 365
34 ± 7
10000
50 (20)Melón III.2 Deltametrín 28 ± 7 50Cereza III.2 λ-Cihalotrín 38 ± 4 100

7/18/2019 Automatizacion y Miniaturizacion de Sistemas de Screening y Determinacion de Residuos de Plaguicidas en Muestra Agroalimentaria
http://slidepdf.com/reader/full/automatizacion-y-miniaturizacion-de-sistemas-de-screening-y-determinacion-de 356/393
1Concentración expresada por gramo de muestra fresca.2LMR establecido en el momento de la realización de cada trabajo. Entre paréntesis losLMR actualizados a septiembre de 2001.3 No establecido por la UE.
Resultados y Conclusiones Capítulo VI
Muestras Acuosas
A. CALIBRACIONES
Las calibraciones efectuadas en el Cap. IV.1 se realizaron siguiendo los
métodos quimiométricos más simples, mientras que en el Cap. IV.2 se utilizaron
métodos quimiométricos más complejos, como ya ha sido comentado en la Sección 1.8
de este capítulo. Los resultados de ambas calibraciones están recogidos en la Tabla
VI.1.10.4.
Tabla VI.1.10.4. Relación de los límites de detección, rangos de linealidad y precisión paracada analito en cada uno de los dos métodos desarrollados.
Analito Capítulo LOD (ng/mL) Rango lineal (ng/mL) RSD (%) / RMSECV1
α-HCH IV.1 0.03 0.1-20 4.6
β-HCH IV.1 0.08 0.2-35 5.8
Lindano IV.1 0.03 0.1-20 4.7
δ-HCH IV.1 0.03 0.1-20 4.5
Vinclozolina IV.1 0.03 0.1-20 5.0
Diclofuanida IV.1IV.2
0.081.2
0.3-401.2-4.8
5.10.171
Aldrín IV.1 0.03 0.1-20 4.1
Dicofol IV.1 0.05 0.2-30 5.9Captán IV.1
IV.20.101.2
0.5-501.2-4.8
4.80.149
Procimidona IV.1 0.08 0.2-40 4.6
α-Endosulfán IV.1 0.01 0.05-10 5.0
β-Endosulfán IV.1 0.02 0.07-15 4.2
Endosulfán-sulfato IV.1 0.03 0.1-20 3.5
Fenpropatrín IV.2 1.2 1.2-4.8 0.193

7/18/2019 Automatizacion y Miniaturizacion de Sistemas de Screening y Determinacion de Residuos de Plaguicidas en Muestra Agroalimentaria
http://slidepdf.com/reader/full/automatizacion-y-miniaturizacion-de-sistemas-de-screening-y-determinacion-de 357/393
1La precisión está expresada como RSD en el Cap. IV.1 y como RMSECV en el Cap. IV.2.
A pesar de los esfuerzos realizados en la calibración mediante PLS de los
Almudena Columé Díaz Tesis Doctoral
en los espectros finales de las impurezas provenientes de los disolventes utilizados a lo
largo del proceso analítico, no fue posible alcanzar los LMRs establecidos (0.1 ng/mL
para plaguicidas individualmente y 0.5 ng/mL para la suma de plaguicidas) por la UE y
España. Sin embargo, el límite de detección alcanzado, ligeramente diez veces superior
al menor LMR, da una idea del potencial que el FTIR junto con el tratamiento de los
espectros mediante PLS tiene en la determinación de plaguicidas sin el uso de la
cromatografía.
B. ESTUDIO DE ADSORCION / DEGRADACION DE PLAGUICIDAS
ORGANOCLORADOS EN MUESTRAS ACUOSAS CON MATERIA
ORGANICA
Con este estudio, realizado en el Cap. IV.1, se pretendió determinar:
• La degradación de los plaguicidas organoclorados en medio acuoso
alcalino con presencia de materia orgánica.
• La adsorción de los mismos sobre la materia orgánica presente en la
muestra acuosa.
• La reversibilidad o no de dicha adsorción.

7/18/2019 Automatizacion y Miniaturizacion de Sistemas de Screening y Determinacion de Residuos de Plaguicidas en Muestra Agroalimentaria
http://slidepdf.com/reader/full/automatizacion-y-miniaturizacion-de-sistemas-de-screening-y-determinacion-de 358/393
La muestra acuosa con la que se trabajó tenía un pH ligeramente alcalino (8.1),
con lo cual, la degradación parcial de algunos de los plaguicidas organoclorados
estudiados en este medio fue inevitable. Los resultados demostraron que el porcentaje
Resultados y Conclusiones Capítulo VI
en suspensión en la muestra acuosa. Además, hay que señalar que captán y diclofuanida
presentan una degradación del 100% tras 7 h, debido a ese medio alcalino. Por otro
lado, la adsorción sobre dicha materia orgánica ( algas verdes del género Spirogyra en
su mayor parte y en menor cantidad algas azul-verdes del género Oscillatoria y algas
unicelulares diatomeas) en el tiempo presentaba dos tipos de comportamiento por parte
de los analitos: un grupo de ellos (diclofuanida, procimidona, dicofol, captán,
endosulfán sulfato, α,β-endosulfán y aldrín) eran adsorbidos rápidamente y el
porcentaje de adsorción permanecía ya estable con el t iempo, que se correspondían con
aquellos que presentaban un mayor valor de K ow (menor solubilidad en agua); y otro
grupo (α,β,δ-HCH, lindano y vinclozolina) en los que la adsorción aumentaba con el
tiempo. Con respecto a la irreversibilidad de dicha adsorción, queda patente que
aumenta también con el tiempo, puesto que, en general, es mucho mayor tras 24 horas
después de la fortificación, que a la media hora y, que para la mayoría de los
organoclorados, es irreversible esta adsorción. La excepción es dicofol, el cual presentó
porcentajes de recuperación entre 85 y 75%. El hecho de que fue uno de los plaguicidas
estudiados con menor degradación en medio alcalino, unido a que quizás su unión a la
materia orgánica se realice mediante débiles interacciones químicas explique que su
adsorción fuese prácticamente reversible.

7/18/2019 Automatizacion y Miniaturizacion de Sistemas de Screening y Determinacion de Residuos de Plaguicidas en Muestra Agroalimentaria
http://slidepdf.com/reader/full/automatizacion-y-miniaturizacion-de-sistemas-de-screening-y-determinacion-de 359/393
C. RECUPERACIONES
El método propuesto en el Cap IV 2 es más complejo que el del Cap IV 1 y al
Almudena Columé Díaz Tesis Doctoral
fiabilidad mediante el estudio de recuperación de los tres plaguicidas seleccionados en
dos muestras de agua. La Tabla VI.1.10.5 recoge los resultados de dicho estudio.
Tabla VI.1.10.5. Recuperaciones obtenidas de dos tipos de muestras acuosas analizadas
mediante el método descrito en Cap. IV.2.
Muestra Diclofuanida Captán Fenpropatrín
Agua de grifo 88 ± 4 66 ± 6 102 ± 7
Agua de río 92 ± 3 70 ± 7 89 ± 3
En un principio, puede parecer extraño que las recuperaciones obtenidas para
los plaguicidas organoclorados sea mayor en la muestra de agua de río que en la de
grifo. Sin embargo, y aunque las diferencias entre dichos valores no son demasiado
significativas, podría justificarse por el hecho de que dicha agua de río, cuya toma de
muestra se realizó en su nacimiento, carece de las sustancias que se añaden al agua de la
red de abastecimiento público para su potabilización, y que podrían interferir en lasregiones del espectro seleccionadas para la calibración de dichos organoclorados,
aunque no en la del piretroide.
En cualquier caso, los valores de recuperación son aceptables en ambas
muestras y para los tres plaguicidas y, como en el caso de las muestras hortofrutícolas,
captán es el plaguicida que ostenta los menores valores de recuperación.

7/18/2019 Automatizacion y Miniaturizacion de Sistemas de Screening y Determinacion de Residuos de Plaguicidas en Muestra Agroalimentaria
http://slidepdf.com/reader/full/automatizacion-y-miniaturizacion-de-sistemas-de-screening-y-determinacion-de 360/393
D. MUESTRAS POSITIVAS
De las 17 muestras acuosas (aguas de río, laguna, pozo, pantano y grifo)
Resultados y Conclusiones Capítulo VI
contener plaguicidas a los niveles detectables por dicho método. De dichas muestras,
únicamente una (Laguna 1) contiene residuos de plaguicidas a niveles similares al LMR
establecido para plaguicidas individualmente, aunque no para la cantidad global; en el
resto de los casos positivos, siempre fueron inferiores a 0.1 ng/mL. Ningunas de las
muestras de agua de la red de abastecimiento público de diferentes pueblos de la
Provincia de Córdoba y de su capital, así como de la ciudad de Viena, resultaron
contener residuos de alguno de los plaguicidas estudiados. Los valores de los resultados
positivos se encuentran recogidos en la Tabla VI.1.10.6.
Tabla VI.1.10.6. Relación de muestras acuosas en las que se detectaron residuos de los plaguicidas estudiados en el Cap. IV.1.
Muestra Plaguicida Concentración (ng/mL)
Pozo 1 Lindano 0.09 ± 0.01
Pozo 2 Lindano 0.04 ± 0.01
Río Aldrín 0.04 ± 0.01
Laguna 1VinclozolinaEndosulfán sulfato
0.13 ± 0.010.12 ± 0.01
Laguna 2 Procimidona 0.09 ± 0.01
En cuanto a las dos muestras analizadas en el Cap. IV.2, no se encontraron
ninguno de los tres plaguicidas estudiados a concentraciones iguales o superiores a 1.2
ng/mL, aunque esta información carece de valor para establecer si se encuentran los
compuestos a concentraciones mayores o menores que el LMR establecido.
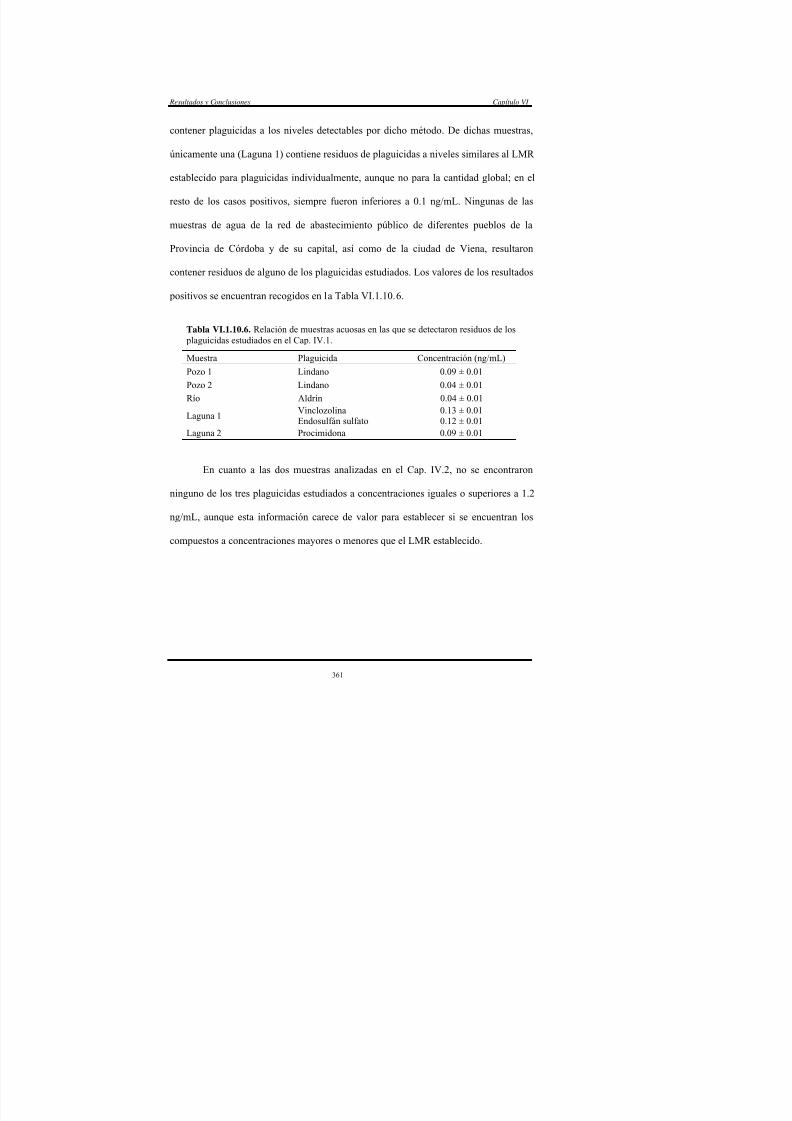
7/18/2019 Automatizacion y Miniaturizacion de Sistemas de Screening y Determinacion de Residuos de Plaguicidas en Muestra Agroalimentaria
http://slidepdf.com/reader/full/automatizacion-y-miniaturizacion-de-sistemas-de-screening-y-determinacion-de 361/393
Almudena Columé Díaz Tesis Doctoral
Fluidos Biológicos
A. CALIBRACIONES
La calibración en este Cap. V.1 se realizó mediante la monitorización selectiva
de iones (SIM), con los valores de m/z especificados en la Tabla VI.1.10.7.1. Tanto los
límites de detección como los rangos de linealidad (Tabla VI.1.10.7.1) son equiparables
o mejores que los recogidos en la bibliografía recopilada (0.03-500 ng/mL) [9,10,11],
así como adecuados para la monitorización de personas en contacto con los plaguicidas
organoclorados incluidos en este estudio y los piretroides que, en su transformación en
el organismo humano, den lugar a los metabolitos cis y trans-DCCA, cis-DBCA y PBA.
El estudio de recuperación (Tabla VI.1.10.7) pone de manifiesto que, de nuevo,
captán es el plaguicida con un menor porcentaje de recuperación.

7/18/2019 Automatizacion y Miniaturizacion de Sistemas de Screening y Determinacion de Residuos de Plaguicidas en Muestra Agroalimentaria
http://slidepdf.com/reader/full/automatizacion-y-miniaturizacion-de-sistemas-de-screening-y-determinacion-de 362/393
Resultados y Conclusiones Capítulo VI
Tabla VI.1.10.7. Relación de los límites de detección, rangos lineales y recuperaciones paracada analito en muestras de orina.
Analito LOD (ng/mL) Rango lineal (ng/mL) Recuperación (%)
cis y trans-DCCA 0.1 0.3-350 93
cis-DBCA 0.1 0.5-350 100
PBA 0.1 0.5-350 101
α-HCH 0.2 0.5-350 94
HCB 0.1 0.5-350 98
Diclorán 0.1 0.5-350 97
β-HCH 0.1 0.5-350 93
γ -HCH 0.1 0.5-350 101δ-HCH 0.1 0.5-350 90
Vinclozolina 0.1 0.5-350 99
Heptacloro 0.2 0.7-350 92
Diclofuanida 0.2 0.7-350 95
Aldrín 0.1 0.5-350 100
Dicofol 0.1 0.5-350 97
Captán 0.3 1.0-350 88
Procimidona 0.1 0.5-350 96Clorbenside 0.1 0.5-350 97
Clordano 0.1 0.5-350 101
α-Endosulfán 0.1 0.5-700 98
Dieldrín 0.1 0.5-350 96
Endrín 0.1 0.5-350 93
β-Endosulfán 0.1 0.5-700 95
Endosulfán sulfato 0.2 0.7-500 90
Captafol 0.1 0.5-700 91
Iprodiona 0.3 2.0-500 95

7/18/2019 Automatizacion y Miniaturizacion de Sistemas de Screening y Determinacion de Residuos de Plaguicidas en Muestra Agroalimentaria
http://slidepdf.com/reader/full/automatizacion-y-miniaturizacion-de-sistemas-de-screening-y-determinacion-de 363/393
Metoxicloro 0.1 0.5-700 94
Almudena Columé Díaz Tesis Doctoral
B. MUESTRAS POSITIVAS
Las muestras de orina analizadas en este Cap. V.1, fueron recogidas de la
doctoranda durante los dos últimos años (1 muestra cada 2 meses; total 12 muestras) del
periodo experimental de la presente Memoria. De esta forma, se pretendió conocer el
posible grado de contaminación de la misma durante el tiempo (4 años) que estuvo en
contacto con los plaguicidas contemplados a lo largo de este trabajo.
Tabla VI.1.10.8. Determinación de plaguicidas organoclorados ymetabolitos de piretroides en muestras de orina de un investigador expuesto.Todas las concentraciones están expresadas en ng/mL (n=3).
Muestra Plaguicida encontrado Concentración
1 No detectados -
2 Endosulfán sulfato 1.6 ± 0.1
3 No detectados -
4 Captafol 17 ± 1
5-8 No detectados -
9 Dicofol 23 ± 210 Dicofol 0.6 ± 0.1
11 No detectados -
12 PBA 2.1 ± 0.2cis y trans DCCA 0.8 ± 0.1
Dicofol 19 ± 2
Podemos observar en la Tabla VI.1.10.8, que los niveles de contaminación son,
en todos los casos, muy bajos y, seguramente se produjeron debido a la manipulación
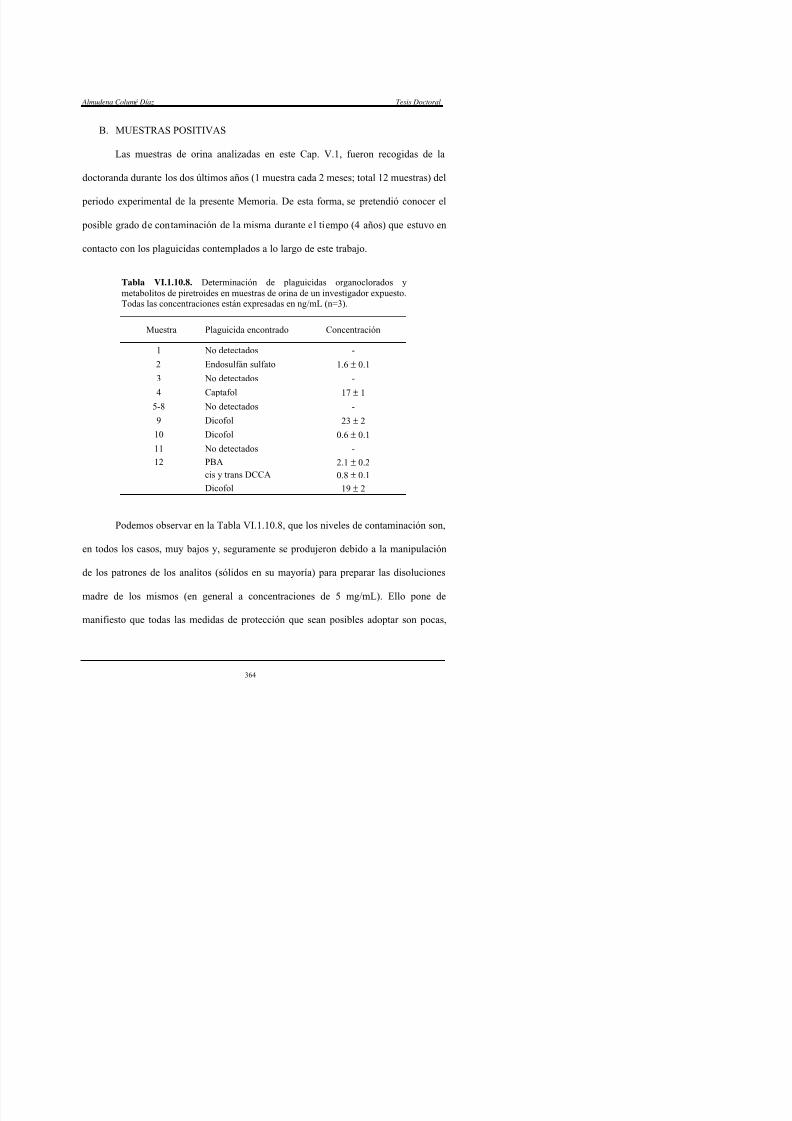
7/18/2019 Automatizacion y Miniaturizacion de Sistemas de Screening y Determinacion de Residuos de Plaguicidas en Muestra Agroalimentaria
http://slidepdf.com/reader/full/automatizacion-y-miniaturizacion-de-sistemas-de-screening-y-determinacion-de 364/393
de los patrones de los analitos (sólidos en su mayoría) para preparar las disoluciones
madre de los mismos (en general a concentraciones de 5 mg/mL). Ello pone de
Resultados y Conclusiones Capítulo VI
puesto que en esta Memoria se trabajó siguiendo escrupulosas medidas para evitar la
contaminación (ej. pesada y manipulación de los estándares en campanas extractoras,
uso de guantes y mascarilla).
De todas formas, no se puede establecer un patrón de comportamiento en la
contaminación detectada, puesto que a lo largo del primer año (en que se tomaron las
muestras de orina) todos los organoclorados fueron manejados con la misma asiduidad
y, tan sólo dos de ellos aparecen en dos muestras (nº 2 y 4). Sin embargo, durante el
segundo año de muestreo, sólo un grupo de organoclorados, más los piretroides, fueron
utilizados, donde dicofol, que aparece en tres muestras, no estaba incluido. Esto podría
ser debido a que quizás este plaguicida entrase en el organismo y quedase acumulado
en él, por una contaminación producida en los últimos meses del primer año
(correspondientes al periodo de las muestras 5 y 6), para más tarde, debido a alguna
razón (pérdida de tejido adiposo, por ejemplo), quedar de nuevo libre en el organismo para ser excretado.
Con respecto a los piretroides, sus metabolitos sólo aparecen en la última
muestra tomada, la cual se realizó a las 18 horas de haber preparado unas disoluciones
madre de estándares de los mismos. Esto ratifica lo recogido en la bibliografía [11],
donde se expone que poseen un rápido metabolismo en el organismo humano y que, por
ello, son totalmente metabolizados y excretados en las 24 horas posteriores a su

7/18/2019 Automatizacion y Miniaturizacion de Sistemas de Screening y Determinacion de Residuos de Plaguicidas en Muestra Agroalimentaria
http://slidepdf.com/reader/full/automatizacion-y-miniaturizacion-de-sistemas-de-screening-y-determinacion-de 365/393
ello, son totalmente metabolizados y excretados en las 24 horas posteriores a su
contaminación.
Almudena Columé Díaz Tesis Doctoral
REFERENCIAS
[1] Comisión de las Comunidades Europeas, Libro Blanco sobre Seguridad
Alimentaria, Bruselas, 2000.
[2] R. Coscolla, Residuos de Plaguicidas en Alimentos Vegetales, Mundi-Prensa,
Madrid, 1993.
[3] Decreto 2484/1967 , BOE del 17 de Octubre de 1967, Madrid, 1967.
[4] H. D. Belitz, W. Grosch, Química de los Alimentos, Acribia S.A., Zaragoza,
1997.
[5] E. D. Ongley, Control of Water Pollution from Agriculture, FAO/OMS, Roma,
1996.
[6] E. Alday et al., Toxicología Laboral Básica, Instituto Nacional de Seguridad e
Higiene en el Trabajo, Sevilla, 1989.
[7] G.F. Pang, Y.Z. Chao, C.L. Fan, J.J. Zhang, X.M. Li, Y.M. Liu, T.S. Zhao, J.
AOAC Int . 78 (1995) 1489.
[8] Real Decreto 280/1994, BOE nº 58, Ministerio de la Presidencia, Madrid, 1994.
[9] Directiva Comunitaria 76/895/CEE , DO L 340, Comunidad Europea, Bruselas,
1976.
[10] F. J. Arrebola, J. L. Martínez-Vidal, A. Fernández-Gutierrez, M. H. Akhtar,
Anal. Chim. Acta 401 (1999) 45.

7/18/2019 Automatizacion y Miniaturizacion de Sistemas de Screening y Determinacion de Residuos de Plaguicidas en Muestra Agroalimentaria
http://slidepdf.com/reader/full/automatizacion-y-miniaturizacion-de-sistemas-de-screening-y-determinacion-de 366/393
( )
[11] G. Leng, K. H. Kuehn, A. Leng, W. Gries, J. Lewalter, H. Idel,
Chromatographia 46 (1997) 265.
Resultados y conclusiones Capítulo VI
VI.2. CONCLUSIONES MAS RELEVANTES
A la vista de la investigación desarrollada a lo largo de la Memoria y los
resultados alcanzados en la misma, se pueden establecer las siguientes conclusiones:
a) Se ha contribuido a la automatización del tratamiento de matrices complejas
como son las frutas y hortalizas, simplificando notablemente los
procedimientos convencionales establecidos hasta la fecha. Así, se ha
reemplazado de forma progresiva la etapa previa de extracción manual de los
residuos de plaguicidas en estas muestras por el tratamiento completamente
automático de las mismas.
b) Se ha demostrado la aplicabilidad de la liofilización en este ámbito que
permite un análisis directo de las muestras de frutas y vegetales, sin pérdida
de los analitos de interés. De esta forma se obtienen cromatogramas libres de
interferencias en virtud de una extracción más selectiva de los analitos desdelas muestras liofilizadas y a la inclusión de etapas de limpieza simples y
eficaces, que se llevan a cabo de forma continua.
c) Se ha abordado el empleo de la espectrometría de infrarrojo con
transformada de Fourier y tratamientos quimiométricos para el screening de
muestras de agua con el objeto de obtener información rápida sobre la
presencia/ausencia de estos analitos en muestras de interés medioambiental.

7/18/2019 Automatizacion y Miniaturizacion de Sistemas de Screening y Determinacion de Residuos de Plaguicidas en Muestra Agroalimentaria
http://slidepdf.com/reader/full/automatizacion-y-miniaturizacion-de-sistemas-de-screening-y-determinacion-de 367/393
d) De las 350 muestras (hortalizas y frutas) analizadas a lo largo de la
realización de esta Memoria, se han encontrado los plaguicidas ensayados a
Almudena Columé Díaz Tesis Doctoral
e) En el último capítulo de esta Memoria se abordan los aspectos concernientes
a la seguridad de la doctoranda mediante una toma de muestra programada
durante los dos últimos años de la investigación, contemplando en cada caso
los compuestos que se estaban manipulando en ese momento. Comoresultado de este seguimiento se detectaron en las muestras de orina
plaguicidas a niveles de concentración muy bajos, pero que ponen de
manifiesto que, a pesar de las precauciones tomadas a la hora de manipular
tanto los patrones como las disoluciones de los analitos, no se ha podido
evitar una mínima contaminación.
Cuando se evalúan críticamente los resultados obtenidos a lo largo de una Tesis
Doctoral parece evidente que, además de subrayar los inconvenientes que se han ido
superando de forma satisfactoria, deben ponerse de manifiesto aquellos aspectos
complementarios de la investigación que, al disponer ahora de una visión global y una
comparación sistemática de los resultados, podrían haber completado esta Memoria.Así, respecto a los analitos, algunos LMRs están establecidos como suma de

7/18/2019 Automatizacion y Miniaturizacion de Sistemas de Screening y Determinacion de Residuos de Plaguicidas en Muestra Agroalimentaria
http://slidepdf.com/reader/full/automatizacion-y-miniaturizacion-de-sistemas-de-screening-y-determinacion-de 368/393
varios plaguicidas. En este sentido, el LMR para captán y folpet está fijado como la
suma de ambos expresada como captán; de la misma forma, para heptacloro, su LMR
Resultados y conclusiones Capítulo VI
cromatográfica para el mismo, probablemente debido a que tenía lugar una degradación
térmica del mismo en el inyector a la temperatura seleccionada para una correcta
separación y resolución de los plaguicidas organoclorados (para captán este parámetro
es crítico). En relación al epóxido de heptacloro, no fue posible conseguir un patrón deeste plaguicida.
Por otro lado, los piretroides no se han estudiado en frutas y verduras frescas
por lo que no se ha podido evaluar su comportamiento en estas matrices aunque los
buenos resultados alcanzados en las matrices liofilizadas permiten suponer que este
tratamiento es también más adecuado para ellos.
En relación con las muestras, se pueden comentar dos aspectos:
a) Ocasionalmente no ha sido similar el tipo de frutas y hortalizas estudiadas
como muestras frescas y liofilizadas por problemas ajenos a nuestra
voluntad (ej. temporada de producción). b) La monitorización de residuos de plaguicidas en fluidos biológicos se ha
centrado en el estudio de muestras de orina, puesto que la toma de muestra
periódica pudo llevarse a cabo fácilmente por la propia doctoranda. Sin
embargo, esta matriz no es la más adecuada para el seguimiento de
plaguicidas organoclorados dado su bajo porcentaje de excreción en orina.
Sangre total o plasma hubiesen resultado más apropiadas aunque esta

7/18/2019 Automatizacion y Miniaturizacion de Sistemas de Screening y Determinacion de Residuos de Plaguicidas en Muestra Agroalimentaria
http://slidepdf.com/reader/full/automatizacion-y-miniaturizacion-de-sistemas-de-screening-y-determinacion-de 369/393
opción se desestimó debido a la mayor complejidad que se planteó en la
toma de muestra.
Almudena Columé Díaz Tesis Doctoral
VI.3. FUTURAS LINEAS DE INVESTIGACION
Al profundizar en la investigación han surgido nuevas líneas de trabajo,
tales como:
a) Dada la tendencia actual a la sustitución de los plaguicidas “convencionales”más tóxicos por piretroides, abordar la determinación de éstos en aguas
potables.
b) Estudio de la estabilidad de los plaguicidas seleccionados en esta Memoria
sobre columnas adsorbentes con vistas a llevar a cabo el tratamiento “in situ”
de las muestras y simplificar el traslado al laboratorio así como su
almacenamiento y conservación.
c) Demostrada la utilidad de la liofilización en la conservación de las muestras
y la ausencia de pérdidas de los analitos, extender su estudio a otras matrices
(carne, pescado, leche y productos lácteos, etc.) con los mismos plaguicidas
así como la determinación de otros contaminantes (PCBs, PAHs, dioxinas, y
otros compuestos orgánicos volátiles) en muestras hortofrutícolas.

7/18/2019 Automatizacion y Miniaturizacion de Sistemas de Screening y Determinacion de Residuos de Plaguicidas en Muestra Agroalimentaria
http://slidepdf.com/reader/full/automatizacion-y-miniaturizacion-de-sistemas-de-screening-y-determinacion-de 370/393
Results and Conclusions Capítulo VI
VI.2. SUMMARY OF THE MOST SALIENT CONCLUSIONS
Based on the work performed and its results, the following major conclusions
can be drawn:
a) The treatment of complex matrices such as those of fruits and vegetables was
substantially simplified in relation to existing conventional procedures. Thus,
the preliminary manual extraction of pesticide residues from these samples
was gradually replaced with their fully automatic treatment.
b) The applicability of freeze-drying in this field, where it enables direct
analysis of fruits and vegetables with no loss of the target analytes, was
demonstrated. Use of this technique provides interference-free
chromatograms by virtue of more selective extraction of the analytes from
freeze-dried samples and the introduction of simple, efficient clean-up steps
that are conducted in a continuous manner.
c) Fourier transform infrared (FTIR) spectrometry was used in combination
with chemometric procedures to screen water samples with a view to the
rapid acquisition of information about the presence or absence of the
analytes in environmentally significant samples.
d) Of the 350 fruit and vegetables samples studied, pesticides were encountered
at significant concentrations in roughly 10% of them.
7/18/2019 Automatizacion y Miniaturizacion de Sistemas de Screening y Determinacion de Residuos de Plaguicidas en Muestra Agroalimentaria
http://slidepdf.com/reader/full/automatizacion-y-miniaturizacion-de-sistemas-de-screening-y-determinacion-de 371/393
e) The last chapter of this Thesis analyses the doctorand's safety during the
conduct of this work. To this end, samples were collected on a regular basis
Almudena Columé Díaz Tesis Doctoral
handled at the time. These monitoring analyses revealed the presence of
some pesticides at very low concentrations in urine, so, despite the cautions
exercised in handling both standards and analyte solutions, some (minimal)
contamination could not be avoided.
In assessing the results of doctoral work, one must state not only the drawbacks
that were successfully overcome but also certain complementary aspects of the
research that become apparent from the global view provided by the results.
Thus, regarding the analytes, some MRLs are given as the combined amounts of
several pesticides. In fact, the MRL for captan and folpet is reported as the combination
of both, expressed in terms of captan; similarly, the MRL for heptachlor corresponds to
the combination of this pesticide and its epoxide, expressed as heptachlor. Preliminary
chromatographic tests included folpet, even though it yielded no chromatographic
signal ! probably because it was thermally degraded at the injector temperature used to
ensure correct separation and resolution of organochlorine pesticides ! ; such a
temperature was critical for captan. Also, no heptachlor epoxide standard was available.
7/18/2019 Automatizacion y Miniaturizacion de Sistemas de Screening y Determinacion de Residuos de Plaguicidas en Muestra Agroalimentaria
http://slidepdf.com/reader/full/automatizacion-y-miniaturizacion-de-sistemas-de-screening-y-determinacion-de 372/393
On the other hand, pyrethroids had not been assayed in fresh fruits or vegetables,
so their behaviour in these types of matrix could not be established. In any case, the
Results and Conclusions Capítulo VI
good results obtained with freeze-dried matrices suggest that this treatment should also
be the most suitable for them.
The samples warrant two major comments, namely:
a) For reasons beyond control (off-seasonality), fresh and freeze-dried samples
of the fruits and vegetables studied were occasionally dissimilar.
b) Residual pesticide levels in biological fluids were monitored in urine
samples, which were readily obtained on a regular basis by the doctorand
herself. However, this type of matrix is not the most appropriate for
monitoring organochlorine pesticides owing to the low proportions in which
they are released through urine. Whole blood or plasma would have been
more appropriate but extractions were ruled out owing to their complexity.

7/18/2019 Automatizacion y Miniaturizacion de Sistemas de Screening y Determinacion de Residuos de Plaguicidas en Muestra Agroalimentaria
http://slidepdf.com/reader/full/automatizacion-y-miniaturizacion-de-sistemas-de-screening-y-determinacion-de 373/393
Almudena Columé Díaz Tesis Doctoral
VI.3. FUTURE RESEARCH LINES
As research progressed, the following three lines for potential expansion arose:
a) The current trend to replacing conventional pesticides (more toxic) with
pyrethroid pesticides makes it advisable to address their determination in
drinking water.
b) The stability of the studied pesticides could be assessed by using sorbent
columns with a view to the in situ treatment of samples and simplifying
transfer to the laboratory, storage and preservation.
c) Once freeze-drying has been shown to effectively allow the preservation of
samples with no analyte losses, its use could be extended to other matrices
(e.g. meat, fish, milk, dairy products) containing the same pesticides, as well
as to other pollutants (e.g. PCBs, PAHs, dioxins and other volatile organic
compounds) in fruits and vegetables.

7/18/2019 Automatizacion y Miniaturizacion de Sistemas de Screening y Determinacion de Residuos de Plaguicidas en Muestra Agroalimentaria
http://slidepdf.com/reader/full/automatizacion-y-miniaturizacion-de-sistemas-de-screening-y-determinacion-de 374/393
ANEXOS
ANNEXES

7/18/2019 Automatizacion y Miniaturizacion de Sistemas de Screening y Determinacion de Residuos de Plaguicidas en Muestra Agroalimentaria
http://slidepdf.com/reader/full/automatizacion-y-miniaturizacion-de-sistemas-de-screening-y-determinacion-de 375/393

7/18/2019 Automatizacion y Miniaturizacion de Sistemas de Screening y Determinacion de Residuos de Plaguicidas en Muestra Agroalimentaria
http://slidepdf.com/reader/full/automatizacion-y-miniaturizacion-de-sistemas-de-screening-y-determinacion-de 376/393
Listado de Acrónimos
ANEXO A. ACRONIMOS
AED Detector de emisión atómica ( Atomic emission detector )
ATR Reflectancia total atenuada ( Attenuated total reflectance)
CAS Chemical Abstracts Service
DBCA Ácido carboxílico cis-3-(2,2-dibromovinil)-2,2-dimetil-(1-
ciclopropano)
DCCA Ácido carboxílico cis y trans-3-(2,2-diclorovinil)-2,2-dimetil-(1-
ciclopropano)
DDA Diclorodifenilacético
DDT Diclorodifeniltricloroetano
DEC Detector de conductividad electrónica
( Detector of electronical conductivity)
DIC Diisopropilcarbodiimida
DL50 Dosis letal de un tóxico que produce la muerte en el 50% de los
animales ensayados
DTGS Sulfato de triglicina deuterada ( Deuterated triglycine sulphate)
ECD Detector de captura de electrones (Electron capture detector )
EI Impacto electrónico (Electron impact )
FA (FI) Análisis / Inyección en flujo (Flow analysis / injection)
FAO Organización para la agricultura y alimentos
(Food Agricultural Organization)
FID Detector de ionización de llama
(Flame ionization detector )

7/18/2019 Automatizacion y Miniaturizacion de Sistemas de Screening y Determinacion de Residuos de Plaguicidas en Muestra Agroalimentaria
http://slidepdf.com/reader/full/automatizacion-y-miniaturizacion-de-sistemas-de-screening-y-determinacion-de 377/393
Almudena Columé Díaz Tesis Doctoral
FTIR Espectrometría de infrarrojo con transformada de Fourier
(Fourier transform infrared )
GC Cromatografía de gases (Gas chromatography)
GPC Cromatografía en gel (Gel permeation chromatography)
HCB Hexaclorobenceno
HCH Hexaclorociclohexano
HFIP 1,1,1,3,3,3-Hexafluoroisopropanol
LC Cromatografía líquida ( Liquid chromatography)
IDA Ingesta diaria admisible
ISO International Standardization Organization
IUPA International Union of Pure and Applied Chemistry
Kow Coeficiente de partición en agua-octanol
LLE Extracción líquido-líquido ( Liquid-liquid extraction)
LMR (MRL) Límite Máximo de Residuo ( Maximum Residue Limit )
LOD Límite de detección ( Limit of detection)
MAE Extracción asistida por microondas ( Microwave assisted extraction)
MRM Método multirresiduo ( Multiresidue method )
MS Espectrometría de masas ( Mass spectrometry)
MTA Módulo de tratamiento automático
NEL Nivel sin efecto ( Non effect level)

7/18/2019 Automatizacion y Miniaturizacion de Sistemas de Screening y Determinacion de Residuos de Plaguicidas en Muestra Agroalimentaria
http://slidepdf.com/reader/full/automatizacion-y-miniaturizacion-de-sistemas-de-screening-y-determinacion-de 378/393
Listado de Acrónimos
NIST National Institute of Standards and Technology
NMC Nivel mínimo cuantificable
NOAEL Nivel sin efecto adverso observable ( Non observed adverse effect level)
NOEL Nivel sin efecto observable ( Non observed effect level)
NPMB Nivel práctico más bajo
OCP Plaguicida organoclorado (Organochlorine pesticide)
OMS Organización Mundial de la Salud
PBA Ácido 3-fenoxibenzoicoPLS Mínimos cuadrados parciales (Partial least square)
RMSECV Raíz cuadrática media del error de la validación cruzada
( Root mean square error of cross validation)
RSD Desviación estándar relativa ( Relative standard deviation)
SFE Extracción con fluidos supercríticos (Supercritical fluid extraction)
Si-2OH Sílica con grupos diolesSi-CN Sílica con grupos cianopropil
SIM Monitorización selectiva de iones (Selected ion monitoring)
SM Materia en suspensión (Suspended matter )
SME Microextracción con disolventes (Solvent microextraction)
SPME Microextracción en fase sólida (Solid-phase microextraction)
SPE Extracción en fase sólida (Solid-phase extraction)US-EPA Environmental Protection Agency of United States of America
US-FDA Food and Drug Administration of United State of America

7/18/2019 Automatizacion y Miniaturizacion de Sistemas de Screening y Determinacion de Residuos de Plaguicidas en Muestra Agroalimentaria
http://slidepdf.com/reader/full/automatizacion-y-miniaturizacion-de-sistemas-de-screening-y-determinacion-de 379/393

7/18/2019 Automatizacion y Miniaturizacion de Sistemas de Screening y Determinacion de Residuos de Plaguicidas en Muestra Agroalimentaria
http://slidepdf.com/reader/full/automatizacion-y-miniaturizacion-de-sistemas-de-screening-y-determinacion-de 380/393
Producción Científica Fruto de esta Memoria
ANEXO B. PRODUCCION CIENTIFICA FRUTO DE ESTA MEMORIA
PUBLICACIONES CIENTIFICAS
• “Semiautomatic method for the screening and determination of 23
organochlorine pesticides in horticultural samples by gas chromatography with
electron-capture detection”.
A. Columé, S. Cárdenas, M. Gallego, M. Valcárcel.
Journal of Chromatography A, 849 (1999) 235-243.
• “Simplified method for chlorinated fungicides and insecticides determination in
fruits by gas chromatography”.
A. Columé, S. Cárdenas, M. Gallego, M. Valcárcel.
Journal of Chromatography A, 882 (2000) 193-203.
• “Selective enrichment of 17 pyrethroids from lyophilized agricultural samples”.
A. Columé, S. Cárdenas, M. Gallego, M. Valcárcel.
Journal of Chromatography A, 912 (2001) 83-90.
• “Multiresidue screening of pesticides in fruits using an automatic solid-phase
extraction system”.
A. Columé, S. Cárdenas, M. Gallego, M. Valcárcel.
Journal of Agricultural and Food Chemistry, 49 (2001) 1109-1116.
• “Semiautomatic multiresidue gas chromatographic method for the screening of
vegetables for 25 organochlorine and pyrethroid pesticides”.

7/18/2019 Automatizacion y Miniaturizacion de Sistemas de Screening y Determinacion de Residuos de Plaguicidas en Muestra Agroalimentaria
http://slidepdf.com/reader/full/automatizacion-y-miniaturizacion-de-sistemas-de-screening-y-determinacion-de 381/393
A. Columé, S. Cárdenas, M. Gallego, M. Valcárcel.
Almudena Columé Díaz Tesis Doctoral
• “Evaluation of an automated solid-phase extraction system for the enrichment of
organochlorine pesticides from waters”.
A. Columé, S. Cárdenas, M. Gallego, M. Valcárcel.
Talanta, 54 (2001) 943-951.
• “Solid-phase extraction method for the screening and determination of
pyrethroid metabolites and organochlorine pesticides in human urine”.
A. Columé, S. Cárdenas, M. Gallego, M. Valcárcel.
Rapid Communications in Mass Spectrometry, 15 (2001) 2007-2013.
•“Assessment of FTIR spectrometry for pesticide screening of aqueous samples”.A. Columé, J. Diewok, B. Lendl.
Enviado para su publicación en Vibrational Spectroscopy, Octubre 2001
COMUNICACIONES A CONGRESOS
IX SYMPOSIUM ON HANDLING OF ENVIRONMENTAL AND BIOLOGICAL
SAMPLES IN CHROMATOGRAPHY. Oporto, Octubre de 1999.
• Comunicación oral titulada: “Semiautomatic method for the screening and
determination of 23 organochlorine pesticides in horticultural samples by gas
chromatography with electron-capture detection”.
A. Columé, S. Cárdenas, M. Gallego, M. Valcárcel.
7/18/2019 Automatizacion y Miniaturizacion de Sistemas de Screening y Determinacion de Residuos de Plaguicidas en Muestra Agroalimentaria
http://slidepdf.com/reader/full/automatizacion-y-miniaturizacion-de-sistemas-de-screening-y-determinacion-de 382/393
• Comunicación oral titulada: “Evaluation of an automated solid-phase
Producción Científica Fruto de esta Memoria
S. Cárdenas, A. Columé, M. Gallego, M. Valcárcel.
• Poster titulado: “Simplified method for chlorinated fungicides and
insecticides determination in fruits by gas chromatography”.
A. Columé, S. Cárdenas, M. Gallego, M. Valcárcel.
VII JORNADAS ANDALUZAS SOBRE AVANCES EN ANALISIS QUIMICO. Almería,
Mayo de 2000.
• Poster titulado: "Selective enrichment of seventeen pyrethroids from
agricultural samples” . A. Columé, S. Cárdenas, M. Gallego, M. Valcárcel.
XII REUNION DE LA SOCIEDAD ESPAÑOLA DE QUIMICA ANALITICA. Huelva,
Septiembre de 2001
•
Poster titulado: "Multiresidue screening of pesticides in fruits and vegetablesusing an automatic solid phase extraction system” .
A. Columé, S. Cárdenas, M. Gallego, M. Valcárcel.

7/18/2019 Automatizacion y Miniaturizacion de Sistemas de Screening y Determinacion de Residuos de Plaguicidas en Muestra Agroalimentaria
http://slidepdf.com/reader/full/automatizacion-y-miniaturizacion-de-sistemas-de-screening-y-determinacion-de 383/393

7/18/2019 Automatizacion y Miniaturizacion de Sistemas de Screening y Determinacion de Residuos de Plaguicidas en Muestra Agroalimentaria
http://slidepdf.com/reader/full/automatizacion-y-miniaturizacion-de-sistemas-de-screening-y-determinacion-de 384/393
Almudena Columé Díaz Curriculum Vitae
CURRICULUM
VITAE

7/18/2019 Automatizacion y Miniaturizacion de Sistemas de Screening y Determinacion de Residuos de Plaguicidas en Muestra Agroalimentaria
http://slidepdf.com/reader/full/automatizacion-y-miniaturizacion-de-sistemas-de-screening-y-determinacion-de 385/393
Almudena Columé Díaz Curriculum Vitae
DATOS PERSONALES
APELLIDOS: COLUME DI AZ NOMBRE: ALMUDENA D.N.I.: 29.054.013-E FECHA NACIMIENTO: 10-03-71 LUGAR DE NACIMIENTO: HUELVATITULACION:
LI CENCIADA EN FARMACI A (Univ. Sevilla)LI CENCIADA EN CIENCIA Y TECNOLOGIA DE LOS ALI MENTOS(Univ.Córdoba)DOCTORA EN CI ENCI AS QUÍMICAS, CON MENCION DE DOCTORADO
EUROPEO (Un iv. Córdoba) “Automatización y miniatur ización de sistemas descreening y determinación de residuos de plaguicidas en muestrasagroalimentarias”
EXPERIENCIA PROFESIONAL
Cuatro años de investigación en laboratorio de Química Analítica (Universidad deCórdoba) en temas agroalimentarios, principalmente en determinación de plaguicidas en productos hortofrutícolas, muestras acuosas y fluidos biológicos(1997-2001).
Amplia experiencia en técnicas cromatográficas con detector de espectrometría demasas, captura de electrones y de llama, espectrometría de infrarrojos contransformada de Fourier, técnicas de extracción en fase sólida, técnicas de
miniaturización y automatización, así como metodología de liofilización.
Amplia experiencia en tratamiento quimiométricos de datos, mediante análisis degrupos (cluster analysis) y análisis por mínimos cuadrados parciales (PLS).
Colaboradora honoraria del Departamento de Química Analítica y Ecología desde

7/18/2019 Automatizacion y Miniaturizacion de Sistemas de Screening y Determinacion de Residuos de Plaguicidas en Muestra Agroalimentaria
http://slidepdf.com/reader/full/automatizacion-y-miniaturizacion-de-sistemas-de-screening-y-determinacion-de 386/393
Colaboradora honoraria del Departamento de Química Analítica y Ecología desde1998, realizando labores docencia e investigación como miembro del grupo de
Almudena Columé Díaz Curriculum Vitae
Practicas en Tioxide España S.A, en el Laboratorio de Investigación y Desarrollo.Huelva.
Prácticas en Industrias Alimentarias en el Laboratorio de Salud Pública, perteneciente a la Consejería de Salud, Delegación Provincial de Córdoba.
Prácticas en Farmacia en la Oficina de Farmacia perteneciente a la LicenciadaMagdalena Pascual Martínez, sita en C/ Elena Montagut, 1, Huelva.
Miembro del comité organizador de las “Jornadas de Técnicas Generales deAnálisis de Alimentos” y otros cursos en al Facultad de Farmacia de Sevilla,siendo vocal de la Asociación Hispalense de Estudiantes de Farmacia durantecuatro años.
Miembro del comité organizador del “First Joint Meeting of Education inAnalytical Chemistry”, celebrado en Córdoba, Septiembre 2001.
CURSOS DE PERFECCIONAMIENTO PROFESIONAL RECIBIDOS
GARANTI A DE CAL IDAD EN LABORATORIOS ANALÍTICOS. Córdoba, Marzo – Abril de 1997.
JORNADA SOBRE ASPECTOS LEGALES Y NORMATIVOS DE LACALIDAD , impartido por la Fundación para el Fomento de la Innovación Industrial. Iniciativa ATYCA. Ministerio de Industria y Energía y Fondo Social Europeo. Huelva, Noviembre de 1997.
ASEGURAMI ENTO DE LA CALI DAD. LOS REQUI SITOS DE LA NORMAUNE – EN – ISO 9001 , impartido por la Fundación para el Fomento de la Innovación Industrial. Iniciativa ATYCA. Ministerio de Industria y Energía yFondo Social Europeo. Huelva, Noviembre de 1997.

7/18/2019 Automatizacion y Miniaturizacion de Sistemas de Screening y Determinacion de Residuos de Plaguicidas en Muestra Agroalimentaria
http://slidepdf.com/reader/full/automatizacion-y-miniaturizacion-de-sistemas-de-screening-y-determinacion-de 387/393
Fondo Social Europeo. Huelva, Noviembre de 1997.
Almudena Columé Díaz Curriculum Vitae
SEGURIDAD E HI GIENE I NDUSTRIAL , impartido por la Fundación para el Fomento de la Innovación Industrial. Ministerio de Industria y Energía y FondoSocial Europeo. Córdoba, Marzo de 2000.
EVALUACIÓN DEL RIESGO POR EXPOSICIÓN A PRODUCTOSFITOSANITARIOS , impartido por el Instituto Nacional de Seguridad e Higieneen el Trabajo. Sevilla, Mayo de 2000.
IV SEMINARIO INTERNACIONAL DE PRODUCTORES YDI STRIBU IDORES DE FRESA “FRAGARIAE” . Sevilla. Febrero 1998.
PRACTICAL TRAINING COURSE: ADVANCES ANALYTICALTECHNIQUES IN PESTICIDE RESIDUE ANALISIS . Organizado por
European Enviromental Research Institute. Ioannina. Grecia. Mayo 1999.
PRACTICAL TRAINING COURSE: ADVANCED ANALYTICALTECHNIQUES IN ENVIRONMENTAL ANALYTICAL CHEMISTRY. Organizado por European Enviromental Research Institute. Ioannina. Grecia. Julio 2000.
I NTRODUCCION A LA ESPECTROSCOPIA DE INFRARROJO CERCANO
(NIRS): EQUIPOS, PROGRAMAS Y APLICACIONES A PRODUCTOSAGROINDUSTRIALES. Córdoba, Noviembre 2000.
CONTROL ANALÍTI CO-SANI TARIO DE LAS AGUAS POTABLES DECONSUMO PUBLI CO . Sevilla, Abril de 1993
JORNADAS DE TÉCNICAS GENERALES DE ANÁLISIS DE AL IMENTOS. Sevilla, Abril de 1994.
TÉCNICAS LUM INI SCENTES AVANZADAS. Córdoba, 1997.
AUTOMATI ZACIÓN DE PROCESOS DE LABORATORIO. Córdoba, 1998.
MODOS DE ACCION DE LOS HERBICI DAS. Córdoba, 1998.
7/18/2019 Automatizacion y Miniaturizacion de Sistemas de Screening y Determinacion de Residuos de Plaguicidas en Muestra Agroalimentaria
http://slidepdf.com/reader/full/automatizacion-y-miniaturizacion-de-sistemas-de-screening-y-determinacion-de 388/393
,
Almudena Columé Díaz Curriculum Vitae
CONTROL ANAL I TICO DE LA CONTAM INACIÓN AMBIENTAL. Córdoba,1999.
I JORNADA ANDALUZA SOBRE EL PROFESIONAL EN CIENCIAS YTECNOLOGIA DE LOS ALI MENTOS. Córdoba. Junio 1996.
NUEVAS PERSPECTIVAS EN QUÍMICA DE LA COORDINACIÓN. Sevilla. Abril y Mayo de 1991.
COSMÉTICA PRACTICA. Sevilla, Septiembre de 1994.
HOMEOPATÍA EN FARMACIA. Sevilla, 25 a 28 de Octubre de 1994.
AVANCES Y ACTUALI DADES EN FARMACIA CLÍNICA. Sevilla, Marzo1995.
ENVEJECIM IENTO CUTÁNEO . Sevilla, Noviembre 1995.
CERTIF ICADO DE APTITUD PEDAGÓGICA (CAP), Córdoba 1995-96.
PUBLICACIONES CIENTIFICAS
“Semiautomatic method for the screening and determination of 23organochlor ine pesticides in horti cultural samples by gas chromatographywith electron-captur e detection”.A. Columé, S. Cárdenas, M. Gallego, M. Valcárcel.Journal of Cromatography A, 849 (1999) 235-243.
“Simpl if ied method for chl orinated fungicides and insecticides determi nationin fr ui ts by gas chromatography”.A. Columé, S. Cárdenas, M. Gallego, M. Valcárcel.Journal of Cromatography A, 882 (2000) 193-203.
7/18/2019 Automatizacion y Miniaturizacion de Sistemas de Screening y Determinacion de Residuos de Plaguicidas en Muestra Agroalimentaria
http://slidepdf.com/reader/full/automatizacion-y-miniaturizacion-de-sistemas-de-screening-y-determinacion-de 389/393
g p y ( )
Almudena Columé Díaz Curriculum Vitae
“Mul ti residue screeni ng of pesticides in frui ts using an automati c soli d-phaseextr action system”.A. Columé, S. Cárdenas, M. Gallego, M. Valcárcel.Journal Agricultural and Food Chemistry, 49 (2001) 1109-1116.
“Semiautomatic mul tir esidue gas chromatographic method for the screeningof vegetables for 25 organochlori ne and pyrethroid pesticides”.A. Columé, S. Cárdenas, M. Gallego, M. Valcárcel.Analytica Chimica Acta, 436 (2001) 153-162.
“Evaluation of an automated solid-phase extraction system for theenr ichment of organochlor ine pesticides from waters”.A. Columé, S. Cárdenas, M. Gallego, M. Valcárcel.
Talanta, 54 (2001) 943-951.
“Solid-phase extraction method for the screening and determination ofpyrethroid metabolites and organochlorine pesticides in human urine”.A. Columé, S. Cárdenas, M. Gallego, M. Valcárcel.Rapid Communications in Mass Spectrometry, 15 (2001) 2007-2013.
“FTIR spectrometry for pesticide screening of aqueous samples”.
A. Columé, J. Diewok, B. Lendl.Enviado para su publicación en Applied Spectroscopy, Septiembre 2001.
PARTICIPACIONES EN CONGRESOS
IX SYMPOSIUM ON HANDLING OF ENVIROMENTAL AND BIOLOGICALSAMPLES IN CHROMATOGRAPHY. Oporto, Octubre de 1999.
Comunicación oral titulada: “Semiautomatic method for the screening anddetermination of 23 organochlorine pesticides in hort icul tural samples by gaschromatography with electron-capture detection” .
7/18/2019 Automatizacion y Miniaturizacion de Sistemas de Screening y Determinacion de Residuos de Plaguicidas en Muestra Agroalimentaria
http://slidepdf.com/reader/full/automatizacion-y-miniaturizacion-de-sistemas-de-screening-y-determinacion-de 390/393
Comunicación oral titulada: “Evaluation of an automated solid-phase
Almudena Columé Díaz Curriculum Vitae
VII JORNADAS ANDALUZAS SOBRE AVANCES EN ANÁLISIS QUÍMICO. Almería, Mayo de 2000.
Poster titulado: " Selective enr ichment of seventeen pyrethroids from
agricul tur al samples” .
SECA 2001. XII REUNION DE LA SOCIEDAD ESPAÑOLA DE QUIMICA ANALITICA. Huelva, Septiembre de 2001
Poster titulado: " Mul ti residue screening of pesticides in fru its and vegetables
using an automatic soli d phase extr action system” .
OTROS DATOS
Manejo asiduo de WINDOWS 95/98/XP y del paquete integrado MICROSOFTOFFICE 2000, así como de INTERNET y bases de datos internacionales.
Alto nivel de inglés, tanto escrito como hablado.
DIRECCIONES Y TELEFONOS DE CONTACTO
ALMUDENA COLUME DIAZ
C/ ACACIAS 11, 2º-D14.006 – CORDOBATfno.: 957 – 40 29 20Tfno.: 616 – 41 02 13
Avda. ALCALDE FEDERICO MOLINA, 32, 1º D21007 – HUELVATfno.: 959 – 225021

7/18/2019 Automatizacion y Miniaturizacion de Sistemas de Screening y Determinacion de Residuos de Plaguicidas en Muestra Agroalimentaria
http://slidepdf.com/reader/full/automatizacion-y-miniaturizacion-de-sistemas-de-screening-y-determinacion-de 391/393

7/18/2019 Automatizacion y Miniaturizacion de Sistemas de Screening y Determinacion de Residuos de Plaguicidas en Muestra Agroalimentaria
http://slidepdf.com/reader/full/automatizacion-y-miniaturizacion-de-sistemas-de-screening-y-determinacion-de 392/393

7/18/2019 Automatizacion y Miniaturizacion de Sistemas de Screening y Determinacion de Residuos de Plaguicidas en Muestra Agroalimentaria
http://slidepdf.com/reader/full/automatizacion-y-miniaturizacion-de-sistemas-de-screening-y-determinacion-de 393/393