ANÁLISIS DE DATOS DE TRANSPORTE Y LOGÍSTICA · TEMA 1: INTRODUCCIÓ ALS ... types of...
66
ANÁLISIS DE DATOS DE TRANSPORTE Y LOGÍSTICA MASTER DE LOGÍSTICA, TRANSPORT I MOBILITAT MASTER D’ESTADÍSTICA I INVESTIGACIÓ OPERATIVA APUNTS DE CLASSE PROF. LÍDIA MONTERO: TEMA 1: INTRODUCCIÓ ALS MÈTODES DE CAPTACIÓ, ANÀLISI I INTERPRETACIÓ DE DADES AUTORA: Lídia Montero Mercadé Departamentd’Estadística i Investigació Operativa Versió 1.5 Setembre del 2.013
Transcript of ANÁLISIS DE DATOS DE TRANSPORTE Y LOGÍSTICA · TEMA 1: INTRODUCCIÓ ALS ... types of...

ANÁLISIS DE DATOS DE TRANSPORTE Y LOGÍSTICA
MASTER DE LOGÍSTICA, TRANSPORT I MOBILITAT
MASTER D’ESTADÍSTICA I INVESTIGACIÓ OPERATIVA
APUNTS DE CLASSE PROF. LÍDIA MONTERO:
TEMA 1: INTRODUCCIÓ ALS MÈTODES DE CAPTACIÓ,
ANÀLISI I INTERPRETACIÓ DE DADES
AUTORA:
Lídia Montero Mercadé
Departamentd’Estadística i Investigació Operativa
Versió 1.5
Setembre del 2.013
Análisis de Datos de Transporte y Logística – MASTER LTM - UPC
Prof. Lídia Montero © Pàg. 1 - 2 Curs 201 3- 201 4
TABLE OF CONTENTS
1-1. INTRODUCTION TO DATA COLLECTION (*) _____________________________________________________________________________ 3 1-1.1 TECHNIQUES OBSERVATION OF REALITY ____________________________________________________________________________________ 3 1-1.2 COSTS OF A QUESTIONNAIRESURVEY ________________________________________________________________________________________ 5 1-1.3 DESIGN OF QUESTIONNAIRE: QUESTIONNAIREDESIGN __________________________________________________________________________ 6 1-1.3.1 ANATOMY OF THE QUESTIONNAIRE _________________________________________________________________________________________ 6 1-1.3.2 ORDER OF QUESTIONS OF THE QUESTIONNAIRE: _______________________________________________________________________________ 7 1-1.3.3 PRINCIPLES OF DRAFTING THE QUESTIONNAIRE. _______________________________________________________________________________ 8 1-1.4 PLANNING SURVEY: DESIGN OF THE SAMPLING PLAN __________________________________________________________________________ 10 1-1.5 SAMPLE SELECTION: PROBABILISTIC OR NOT PROBABILISTIC. __________________________________________________________________ 10 1-1.5.1 SELECTING PROBABILISTIC SAMPLES _______________________________________________________________________________________ 12 1-1.6 DATA PROCESSING ______________________________________________________________________________________________________ 14 1-1.6.1 DEBUGGING THE DATA FILE AND STATISTICAL TREATMENT _____________________________________________________________________ 16 1-1.6.2 STRATEGIESKNEARESTNEIGHBORS ________________________________________________________________________________________ 21
1-2. TYPOLOGY OF ERRORS IN MODELS AND IN PREDICTIONS _____________________________________________________________ 24
1-3. TYPES OF SURVEYS IN TRANSPORT ___________________________________________________________________________________ 27 1-3.1 HOUSEHOLD SURVEYS ___________________________________________________________________________________________________ 27 1-3.2 POLLS CORD, DISPLAY AND GAUGING ______________________________________________________________________________________ 29 1-3.3 OTHER INFORMATION GATHERED _________________________________________________________________________________________ 30 1-3.4 STATEDPREFERENCESURVEYS ____________________________________________________________________________________________ 31 1-3.5 SURVEYS REVEALED PREFERENCES IN MODAL SPLIT _________________________________________________________________________ 37
1-4. EXAMPLES OF TRANSPORTATION SURVEYS: SP, RP, QUALITY _________________________________________________________ 46 1-4.1 EXAMPLE PD: CHANGES IN THE SUPPLY OF BUSES, COMPETITION BETWEEN BUS, CAR AND FOOT. _____________________________________ 46 1-4.2 EXAMPLE SURVEY QUALITY OF SERVICE IN THE BUS NETWORK OF SMALL CITY ___________________________________________________ 50 1-4.3 EXAMPLE: HOUSEHOLD SURVEY OF MOBILITY IN REGIONALLY ________________________________________________________________ 58

Análisis de Datos de Transporte y Logística – MASTER LTM - UPC
Prof. Lídia Montero © Pàg. 1 - 3 Curs 201 3- 201 4
1-1. INTRODUCTION TO DATA COLLECTION (*)
1-1.1 Observation techniques of reality They can explain what they do, say or think different social agents involved in a real problem.
The questionnaire survey provides a systematic and objective beyond the vision of the different social actors’ observation. It allows comparison between individuals (segments) and quantitative data that can be generalized to different segments of the population using statistical inference techniques.
⇒ With questionnaire design:types of administration of the questionnaire surveys.
o Personal interview with manual printed and filled out the answers by the interviewer questionnaire.
o Self-completion questionnaire mailed (postal).
o Telephone questionnaire without completing personal contact by the interviewer.
o Computer Assisted Interview (data entry control and filtering errors): • CATI (by telephone) • CAPI (personal) • CASI (self interviewing, by internet)
(*)Acknowledgement: Dr Tomas Aluja, by many good tips received on the subject.
Reality-Acts Questionnaire Data Information

Análisis de Datos de Transporte y Logística – MASTER LTM - UPC
Prof. Lídia Montero © Pàg. 1 - 4 Curs 201 3- 201 4
1-1 INTRODUCTION: QUESTIONNAIRE SURVEYS
⇒ By mere observation,such study conducted transactions or access to web servers.
⇒ For discussion among a group of experts (focus group).
The questionnaire collected data requires the development of a specific methodology (questionnaire design) and technology to filter, validate, store and subsequently perform statistical analyzes of data collected. They assume that public opinion is the sum of individual opinions, all opinions are equal and that everyone should have an opinion on the questions raised.
Fuente: M. Bécue– UPC
Análisis de Datos de Transporte y Logística – MASTER LTM - UPC
Prof. Lídia Montero © Pàg. 1 - 5 Curs 201 3- 201 4
1-1 INTRODUCTION: QUESTIONNAIRE SURVEYS
Difference data (associated with the values of variables) and information (associated with the concepts being studied).
Stages of a survey:
⇒ Planning: Questionnaire Design and Sampling Design Plan.
⇒ Fieldwork.
⇒ Exploiting data.
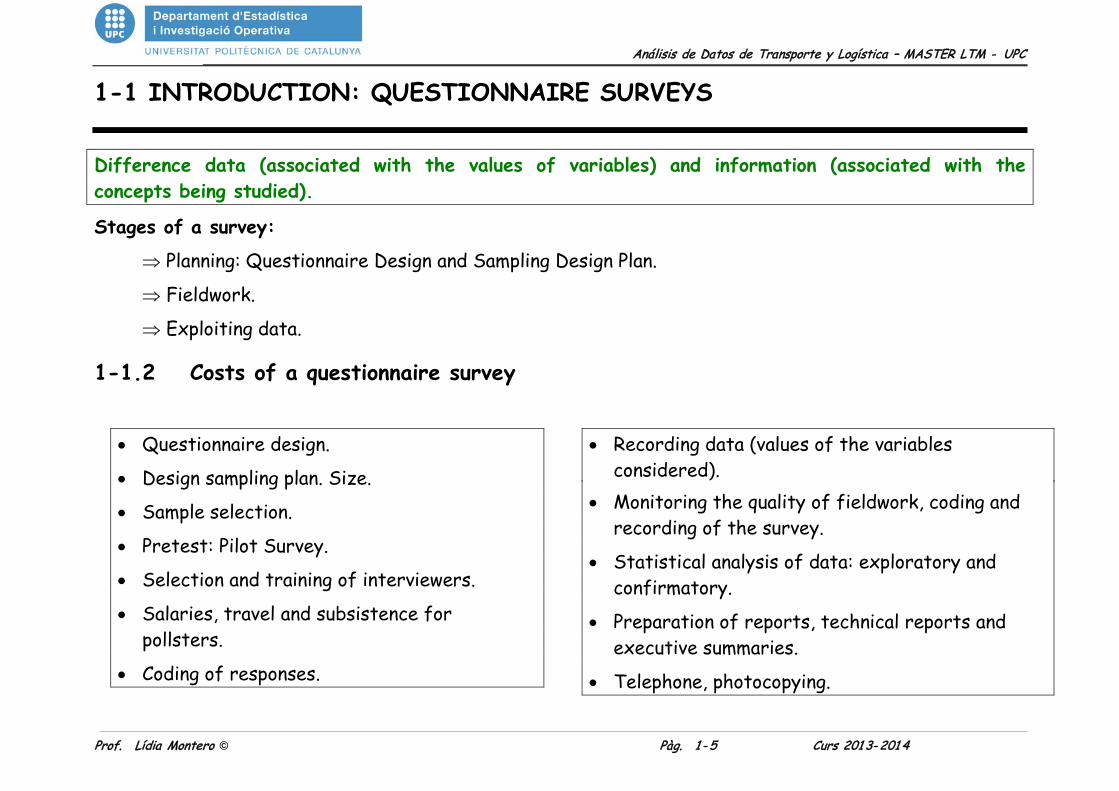
1-1.2 Costs of a questionnaire survey
• Questionnaire design.
• Design sampling plan. Size.
• Sample selection.
• Pretest: Pilot Survey.
• Selection and training of interviewers.
• Salaries, travel and subsistence for pollsters.
• Coding of responses.
• Recording data (values of the variables considered).
• Monitoring the quality of fieldwork, coding and recording of the survey.
• Statistical analysis of data: exploratory and confirmatory.
• Preparation of reports, technical reports and executive summaries.
• Telephone, photocopying.

Análisis de Datos de Transporte y Logística – MASTER LTM - UPC
Prof. Lídia Montero © Pàg. 1 - 6 Curs 201 3- 201 4
1-1 INTRODUCTION: DESIGN QUESTIONNAIRE SURVEYS
1-1.3 Design of questionnaire: questionnaire design The questionnaire is determined by the objective of the research, the type of management and use of data. It is essential to know what different social stakeholders, experts say and data sources available to build characterize the study population.
It is necessary to introduce a terminology: the aim of the survey is to be specified by the significant concepts under which will be observed. The questions are the means to capture data and to allow values to observable characteristics (variables) or obtain indicators on complex variables. Indicators and variables provide data that will later be transformed into information about significant concepts in order to study.
1 - 1 . 3. 1 Anatomy of the questionnaire • Socioeconomic descriptors of individuals (gender, age, education, social status, employment status,
occupation, residence, family structure, income, wealth, etc.).
• Contextual Descriptors: highly dependent on the object of study (contextual knowledge, behaviors, etc.).
• Practices descriptors and opinions (attitudes, habits, collective membership, etc).

Análisis de Datos de Transporte y Logística – MASTER LTM - UPC
Prof. Lídia Montero © Pàg. 1 - 7 Curs 201 3- 201 4
1-1 INTRODUCTION: DESIGN QUESTIONNAIRE SURVEYS
Experts suggest using a type booklet format:
• Clear typography.
• Differentiate typographically questions, filter questions, transitional statements, answers, notes for survey and trademarks for encoding.
• It should be as short as possible, depending on the topic, the study population and the mode of administration (telephone or in person).
1 - 1 . 3. 2 Order of questions of the questionnaire: The structure of the questionnaire content can vary, but in any case must be consistent and facilitate the development and continuity of the questions in it.
The general organization, and especially of the questions is important and can give some advice:
1. Go from the general to the particular.
2. Go from less committed to the most committed.
3. Delicate questions must never go to the beginning or end.
4. The socio-economic questions are going to end.
5. They have to use transitional phrases to break the monotony and thematic changes.
6. The first questions are usually strategic set the tone and predispose the respondent: must be neutral, pleasant and easy.

Análisis de Datos de Transporte y Logística – MASTER LTM - UPC
Prof. Lídia Montero © Pàg. 1 - 8 Curs 201 3- 201 4
1-1 INTRODUCTION: DESIGN QUESTIONNAIRE SURVEYS
7. Avoid a question (or set of questions) conditioning the response to the following questions.
8. It is essential for designing filter questions not frustrate people who do not have certain requirements or to avoid constraints.
9. The order of questions can influence non-response, the worst burdens of a questionnaire survey on sensitive issues nonresponse tends to increase with the respondent's age, female gender, less qualified professional activities, the low educational level and smaller groups belonging.
1 - 1 . 3. 3 Principles of drafting the questionnaire.
1. Employ a simple and suited to the type of population studied vocabulary. Pay attention to the opening words of issues and questions.
2. Avoid asking a question so that response involves meet certain requirements.
3. Check the logical structure of the questions: interrogative sentences with negations, double negatives that can lead to ambiguity, misunderstanding and finally observation errors.
4. Avoid introduction of two concepts in the same question and double questions.
Análisis de Datos de Transporte y Logística – MASTER LTM - UPC
Prof. Lídia Montero © Pàg. 1 - 9 Curs 201 3- 201 4
1-1 INTRODUCTION: DESIGN QUESTIONNAIRE SURVEYS
5. Avoid loaded terms of affection, value judgments or sentences of different connotations depending on the context because the meaning of the question depending on the context of the individual changes.
6. Avoid situations where ambiguities and to the same question can give you the same answer, but for different reasons.
7. Authorize double responses in closed questions, but at least minimize them since the subsequent statistical analysis is greatly complicated.
8. Closed questions (where individuals choose the answer from a list of possibilities) must cover all possible situations. Be established, where appropriate, a balance between positive and negative forms, checking the list of good possibilities offered.
9. Rate the inclusion of non-responses and intermediate or neutral alternatives. Open-ended questions provide differential positioning.
10. If the respondent is offered the "NS / NC" option is given the option of avoiding the answer, but assumes no opinion to force the review, be decreasing nonresponse
11. In sensitive questions, beliefs and attitudes turn combine with irrelevant questions. Verbal modes are extremely important in these questions.
Análisis de Datos de Transporte y Logística – MASTER LTM - UPC
Prof. Lídia Montero © Pàg. 1 - 1 0 Curs 201 3- 201 4
1-1 INTRODUCTION: DESIGN QUESTIONNAIRE SURVEYS
1-1.4 Planning survey: design of the sampling plan The sampling plan operational details:
• The available resources and expected costs.
• Calendar.
• The size and composition of the sample. Description of the sampling frame.
• The responsibilities of the persons doing fieldwork.
• The selection of the sample. Routes and schedules pollsters.
• Forms of fieldwork supervision: Reviews of responses to questionnaires, sample control, repeat the survey to complete non-response, imputation for nonresponse.
1-1.5 Sample selection: probabilistic or not probabilistic. The study population may be available digitally (sampling frame of reference), so that it is possible for a random selection of sampling units to integrate the sample: a priori probability of each individual part of the sample (probabilistic sampling) is known.
For reasons of cost, there is often an available sampling frame and opt for some non-probabilistic sampling method.There are two main families: quota or itineraries.
Análisis de Datos de Transporte y Logística – MASTER LTM - UPC
Prof. Lídia Montero © Pàg. 1 - 1 1 Curs 201 3- 201 4
1-1 INTRODUCTION: DESIGN QUESTIONNAIRE SURVEYS
Quotas method impose the distribution of the sample according to quotas (marginal or joint) in the population. The principle is to select a structure of the same sample to the population structure and therefore the variables that define quotas (in general, gender and age group) have to have a major influence on the study objective.
Requires trained interviewers to administer their assessments well (and in the end have left to interview an athlete over 80 years). The population shares in the different macro-areas of study must be recent and reliable. Generally perform on small samples and therefore are combined with probabilistic first stage designs.
Routes method defines a fixed itinerary on a plane to the interviewer and survey points. The cost of implementation to develop itineraries that provide satisfactory coverage of the target population is not negligible. Give good results.
The sample must be representative (reproduce the characteristics of the whole population). Differentiate between population (finite or infinite) and sample.
• The selection of the sample by quotas, by random walk, etc. takes samples called non-probabilistic.
There are techniques for selecting the sample (sampling techniques) leading to probabilistic samples on which statisticians can apply all the apparatus of conventional mathematical statistical inference.
Análisis de Datos de Transporte y Logística – MASTER LTM - UPC
Prof. Lídia Montero © Pàg. 1 - 1 2 Curs 201 3- 201 4
1-2 1-1 INTRODUCTION: DESIGN QUESTIONNAIRE SURVEYS
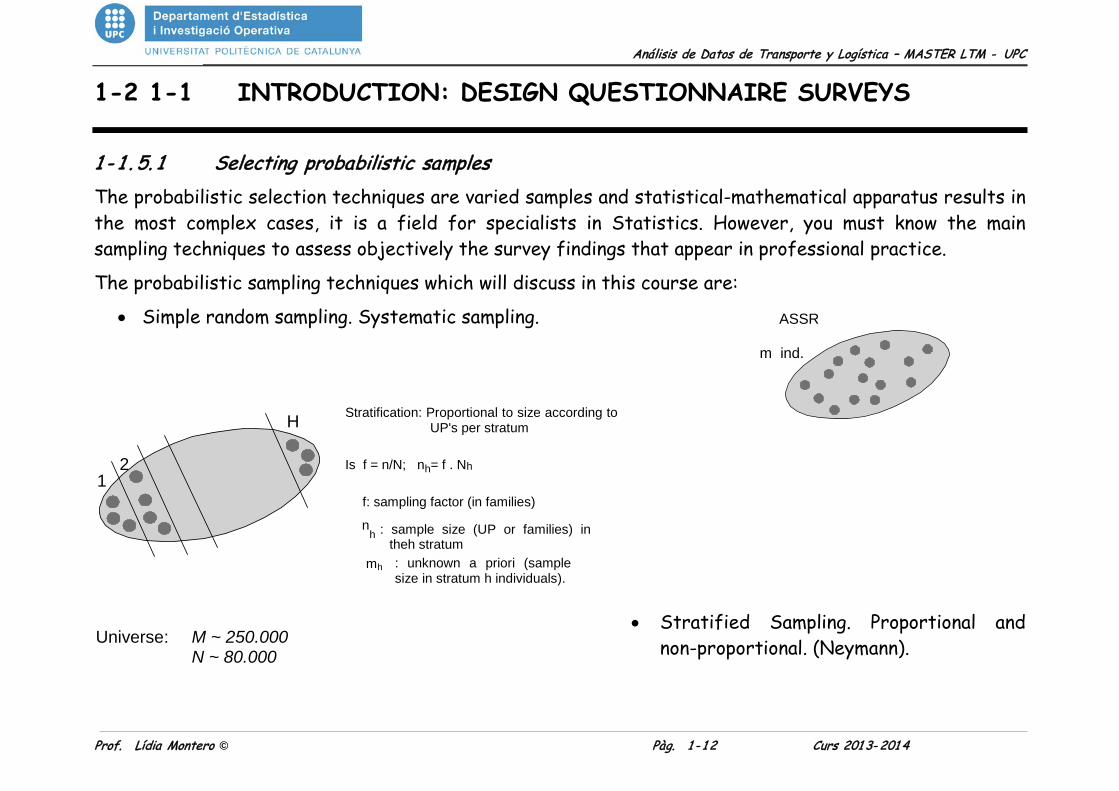
1 - 1 . 5. 1 Selecting probabilistic samples The probabilistic selection techniques are varied samples and statistical-mathematical apparatus results in the most complex cases, it is a field for specialists in Statistics. However, you must know the main sampling techniques to assess objectively the survey findings that appear in professional practice.
The probabilistic sampling techniques which will discuss in this course are:
• Simple random sampling. Systematic sampling.
• Stratified Sampling. Proportional and non-proportional. (Neymann).
ASSR
m ind.
Universe: M ~ 250.000 N ~ 80.000
H
1 2
Stratification: Proportional to size according to UP's per stratum
Is f = n/N; n h = f . N h
f: sampling factor (in families) n
h : sample size (UP or families) in theh stratum
m h : unknown a priori (sample size in stratum h individuals).
m

Análisis de Datos de Transporte y Logística – MASTER LTM - UPC
Prof. Lídia Montero © Pàg. 1 - 1 3 Curs 201 3- 201 4
1-1 UNIT 1: INTRODUCTION TO THE TYPES OF DATA COLLECTION
• Cluster sampling and multistage sampling.
CLUSTER
m = n m n cluster (fam.) size m each (ind.)
To correct deficiencies representativeness of the samples are post-adjustment techniques of the samples. The techniques are classified as:
• Weighting tecniques.
• Estimators by ratio and by regression.
The samples are used to estimate population parameters, the sampling error always exists and is inherent variability in the population and the fact of working with a subset of it (the sample). Sampling error can be bounded and is generally inversely proportional to the sample size: the chosen sampling plan is what determines the formulas to be used.
The sampling bias should not be confused with the sampling error: the failure of a sample, that is, their lack of representativeness is the cause of this source of error.
Análisis de Datos de Transporte y Logística – MASTER LTM - UPC
Prof. Lídia Montero © Pàg. 1 - 1 4 Curs 201 3- 201 4
1-1 UNIT 1: INTRODUCTION TO THE TYPES OF DATA COLLECTION
1-1.6 Data processing Afterfieldwork final stage:
• Control of closed answers. Coding reporting of cases of non-response for subsequent statistical treatment.
• Coding of open questions: manually (you have to align the criteria for coding) or statistical techniques of lexicometric analysis.
• Encoded data is recorded in a computerized file with prescribed format: creating a raw data file. Sometimes there are multiple files in function of the various parties in which breaks down the agenda of the survey.Double recording or assisted recording.
Análisis de Datos de Transporte y Logística – MASTER LTM - UPC
Prof. Lídia Montero © Pàg. 1 - 1 5 Curs 201 3- 201 4
1-1 UNIT 1: INTRODUCTION TO THE TYPES OF DATA COLLECTION
The data types are often very varied: numerical (discrete or continuous), qualitative (nominal or ordinal), text, images, videos, etc.
• Storage environments of the data should allow the definition of different types.
• The filtering and validation procedures are different depending on the type of data.
• The introduction of meta-information is essential for the correct interpretation of the results as well as the initial steps of the analysis process, allowing sorting between different types of missing data and facilitates the detection of outliers (stranger securities either for its specificity or by incorrect result). Example of measurement of ozone in the Antarctic ice.
⇒ There are standards for storage and exchange of computerized data (XML).
⇒ Standards exist for the characterization of the metadata. Not all statistical packages allow exhaustive definition of metadata (Best SPAD, an acceptable environment SPSS).
⇒ The historical databases are called in the jargon of Data Mining data warehouses.
⇒ The raw data must be controlled and even transformed before statistical processes developed.

Análisis de Datos de Transporte y Logística – MASTER LTM - UPC
Prof. Lídia Montero © Pàg. 1 - 1 6 Curs 201 3- 201 4
1-1UNIT 1: INTRODUCTION TO THE TYPES OF DATA COLLECTION
1 - 1 . 6. 1 Debugging the data file and statistical treatment • Obvious coding error control: age ranges, number of children, bus lines available, gross income, etc.
• Recoding: perhaps the list of options for answers to some closed questions is too large to be no options selected by respondents.
• Treatment of non-response:
o Deterministic: For example, when asked the district of residence but the respondent only knows the address, it can be inferred.
o Allocation of a default: to ask the number of children an individual who is under 10 years old.
o Techniques of hot-deck imputation from a donor and other strategies with high statistical substrate.
Statistics as a discipline will be to quantify the level of uncertainty associated with measures extracted data and in that sense is a tool that assists the technician in the process of decision making under randomness. The statistic is presented as a discipline that can treat the randomness and work with this regularity in non-deterministic processes.
Análisis de Datos de Transporte y Logística – MASTER LTM - UPC
Prof. Lídia Montero © Pàg. 1 - 1 7 Curs 201 3- 201 4
1-1 INTRODUCTION: DESIGN QUESTIONNAIRE SURVEYS
The data for the study were obtained as a sample of observations from a population of interest, which is not technically or economically feasible to observe in its entirety. We must differentiate between population and sample. Surveys often present problems in the effective sample collection:
• Response rate and validity is rarely 100% (mortality shown).
• Sampling bias: some individuals of the population are excluded intentionally or unintentionally.
o A sample with incomplete coverage of the population is selected as there are individuals that have no chance of being selected. Related selection bias in non-probabilistic sampling.
o It can detect a high rate of non-complete response (characteristic of mail surveys). Techniques to alleviate the deficiency consist in replacing the individual (equivalent) or the reweighting of estimates to be obtained from the statistical analysis process.
o Social bias: when certain individuals avoid answering some awkward questions.
o Measurement bias: when the observation process is distorted by the respondent (forget fulness, misunderstanding, why is socially wrong or give a concrete answer, etc.), by the instrument (defects in the questionnaire) or by the interviewer (race, social class, personality).
ArticleDaly-Ortúzar TEC (December 1990): Forescasting and data aggregation theory and practice

Análisis de Datos de Transporte y Logística – MASTER LTM - UPC
Prof. Lídia Montero © Pàg. 1 - 1 8 Curs 201 3- 201 4
1-1UNIT 1: INTRODUCTION TO THE TYPES OF DATA COLLECTION
The inclusion of open questions makes the process of filtering and validation and requires the use of techniques of statistical analysis of texts that are not broad professional, or aren’t implemented in standard statistical packages.
The current trend with the introduction of computer and information technology in the professional environments of engineering, science and even in private life leads to the availability of mega databases without sample design and therefore unrepresentative statistics. It is a challenge for the development of statistical procedures to quantify and exploit the inherent uncertainty. Additionally, it should raise the issue of the confidentiality of the data that is highly developed in the official statistical environments.
The integration of different data sources has led to a very fashionable discipline called data fusion. Data fusion is the problem of mixing information from different sources and one of the star problems is the charge of an entire block of missing variables.The interest in data fusion lies in the use of data from other studies available and may not be available (for technical or economic issues) in a current study.
Análisis de Datos de Transporte y Logística – MASTER LTM - UPC
Prof. Lídia Montero © Pàg. 1 - 1 9 Curs 201 3- 201 4
File Receiver
Donor File Specific Variables
Common variables
1-1UNIT 1: INTRODUCTION TO THE TYPES OF DATA COLLECTION
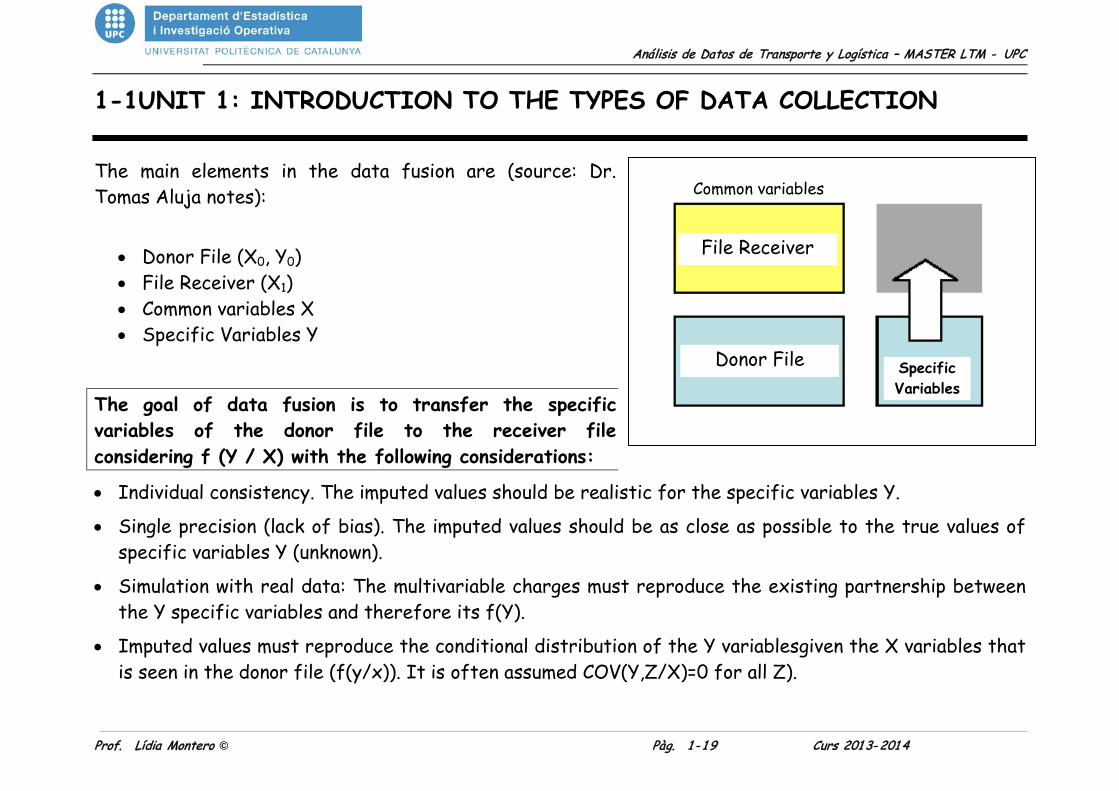
The main elements in the data fusion are (source: Dr. Tomas Aluja notes):
• Donor File (X0, Y0) • File Receiver (X1) • Common variables X • Specific Variables Y
The goal of data fusion is to transfer the specific variables of the donor file to the receiver file considering f (Y / X) with the following considerations:
• Individual consistency. The imputed values should be realistic for the specific variables Y.
• Single precision (lack of bias). The imputed values should be as close as possible to the true values of specific variables Y (unknown).
• Simulation with real data: The multivariable charges must reproduce the existing partnership between the Y specific variables and therefore its f(Y).
• Imputed values must reproduce the conditional distribution of the Y variablesgiven the X variables that is seen in the donor file (f(y/x)). It is often assumed COV(Y,Z/X)=0 for all Z).

Análisis de Datos de Transporte y Logística – MASTER LTM - UPC
Prof. Lídia Montero © Pàg. 1 - 20 Curs 201 3- 201 4
File Receiver
Donor File
Specific Variables
Common variables
1-1UNIT 1: INTRODUCTION TO THE TYPES OF DATA COLLECTION
An example of data fusion in marketing is the measure of the effectiveness of television advertising campaigns
• Donor File: Hearing panel.
• File Receiver: Consumer panel.
Methodologies for data fusion:
• Explicit models: Establish a model linking the Y variables with X variables in the donor file and apply this model to the receiver file. Usually statistical models: principal component regression, multiple linear regression (generalized or not), partial least squares regression (PLSR), etc.
• Implicit models (hot deck). Find receptor for each individual file one or more individuals as similar as possible donor file and then transfer the values of Y variables to each individual receiver file: K-NN (K Nearest Neighbour), clustering, segmentation trees, etc.
• Cold deck models: there is in use information of the donor corresponding to every recipient and to values of the variables in some previous date.
Análisis de Datos de Transporte y Logística – MASTER LTM - UPC
Prof. Lídia Montero © Pàg. 1 - 21 Curs 201 3- 201 4
1-1UNIT 1: INTRODUCTION TO THE TYPES OF DATA COLLECTION
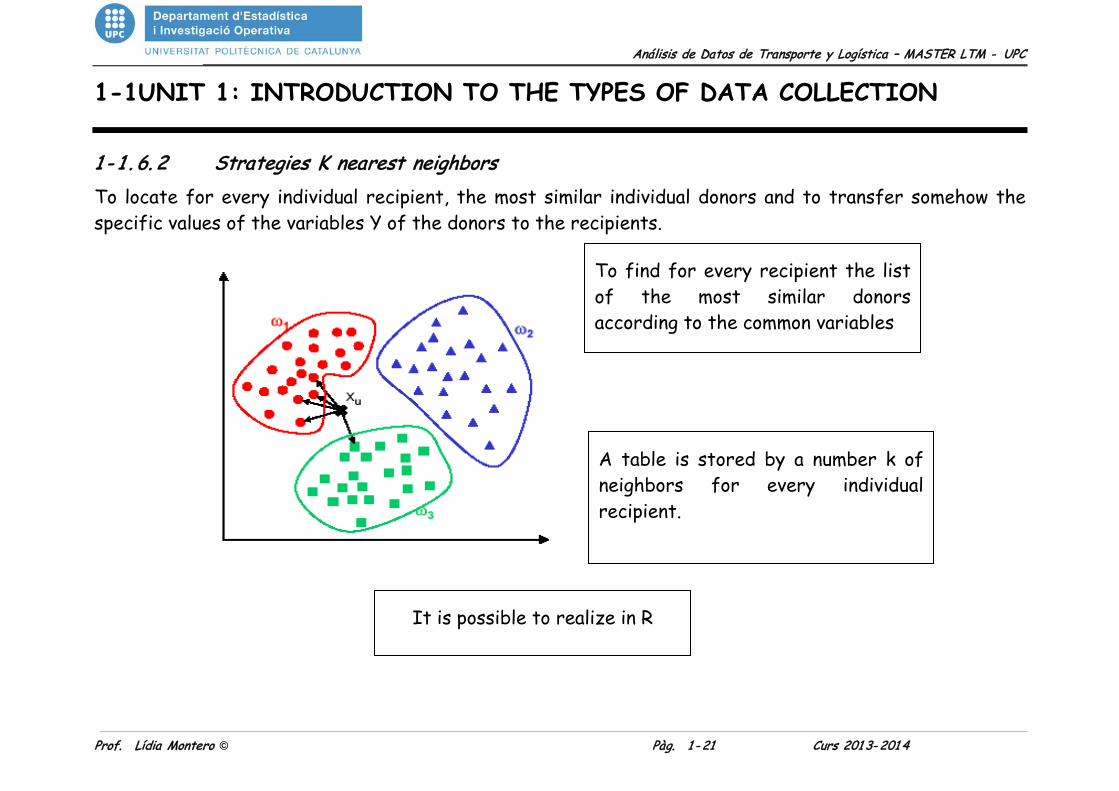
1 - 1 . 6. 2 Strategies K nearest neighbors To locate for every individual recipient, the most similar individual donors and to transfer somehow the specific values of the variables Y of the donors to the recipients.
To find for every recipient the list of the most similar donors according to the common variables
A table is stored by a number k of neighbors for every individual recipient.
It is possible to realize in R

Análisis de Datos de Transporte y Logística – MASTER LTM - UPC
Prof. Lídia Montero © Pàg. 1 - 22 Curs 201 3- 201 4
1-1UNIT 1: INTRODUCTION TO THE TYPES OF DATA COLLECTION
Stages of data fusion according to the algorithm of K-nearest neighbors:
• Preprocessing of the data file of donors.To quantify the representativeness of the donor with respect to the population, to establish statistical differences between donors and recipients, statistical description of the specific variables for common variables (quantify the predictive power of each of the common variables with or without changes , etc.).
• Selection of effective common variables: parsimony criterion, selection of the minimum set of common variables with the highest predictive ability of specific variables.
• Possible need to establish clusters sets of instruments between the donors (according to size of the
file).
Original space Factorial space

Análisis de Datos de Transporte y Logística – MASTER LTM - UPC
Prof. Lídia Montero © Pàg. 1 - 23 Curs 201 3- 201 4
1-2UNIT 1: INTRODUCTION TO THE TYPES OF DATA COLLECTION
• To position donors and recipients in the same subspace defined by the common variables, to construct a common file from the statistical point of view (dataframe in R): in it spread originally or in space factorial transformed (principal components, simple or multiple correspondences). One recommends to be employed at the transformed factor space.
• Determine the K nearest neighbors table that relates each receiver with its K closest donors as public variables X (in the transformed factor space).
• Allocation of Y specific variables in the file recipient. Diverse strategies each one with his pros and cons: impute according to the nearest neighbor (consistency) or by the local average of r closest neighbors (minimizes the error in predicting) selected deterministically or stochastic or strategies of generation of multivariate random values that are more complex.
• Validation of the complaint.

Análisis de Datos de Transporte y Logística – MASTER LTM - UPC
Prof. Lídia Montero © Pàg. 1 - 24 Curs 201 3- 201 4
COMPLEXITY MODEL
AVAILABILITY AND ACCURACY OF EXPLANATORY
VARIABLES
TRADE-OFF
1-2. TYPOLOGY OF ERRORS IN MODELS AND IN PREDICTIONS
The purpose of the model is its ability to make predictions and more complex models are not necessarily always those who give the most accurate predictions, since the explanatory variables are subject to measurement errors or inaccuracies. Given a budget and requirement accuracy in predictions, the engineer must decide the level of complexity of the model to use given the precision available in the explanatory variables of the model.
For example, in models of trip generation is possible to be employed with the total population for zone of transport or with the population for socioeconomic level, if these explanatory variables were not available to level of zone of transport, only globally for municipal then there would be no sense to develop a multiple regression model considering these variables at zonal level.

Análisis de Datos de Transporte y Logística – MASTER LTM - UPC
Prof. Lídia Montero © Pàg. 1 - 25 Curs 201 3- 201 4
1-2 1-2. TYPOLOGY OF ERRORS IN MODELS AND IN PREDICTIONS
The most common errors in data collection processes are:
⇒ The measurement errors. For example, imprecision inherent in decision data starting as a misinterpretation of the questions in a questionnaire (eg, duration of a shift, it means all its stages or globally, either generally or specifically in one day?), measurement errors in some network magnitudes (light time) recording or coding errors (for example, round trip times to multiples of 5 minutes) or just make a simple recording instead of recording on a double household survey. In any case if more budgets are dedicated to quality control of the data, this source of disturbance is reduced.
• If the data quality is not good, will almost always be safer to make predictions more simple and robust models. The accuracy of the explanatory variables should always be considered.
⇒ Sampling errors are due to the use of samples, not populations, and are generally inversely proportional to the square root of the sample size (m.a.s. samples).
⇒ Specification errors are due to the formulation of the model itself as simplification of one's own reality, in this group include:

Análisis de Datos de Transporte y Logística – MASTER LTM - UPC
Prof. Lídia Montero © Pàg. 1 - 26 Curs 201 3- 201 4
1-2 TYPOLOGY OF ERRORS IN MODELS AND IN PREDICTIONS
• Inclusion of irrelevant variables. For example, in regression bias does not produce, but increase the variability of the estimators and the predictions (increase the sampling error).
• Omission of relevant variables. Cause bias in predictions and increase the uncertainty of the predictions.
• (cont.) Exclusion of subjective variables like, eg modal split models.
• Omission of habit variables or inertia or definition of linear relationships when the effects are not really linear.
⇒ Transfer errors and portability. The models are formulated, estimated and validated for a particular field of study and their studies or transfer to other contexts may not be adequate. They are eliminated re-estimating the models in the new contexts, but can be costly. A recurring example is the value of time for different reasons books.
⇒ The errors of aggregation. Basically originated at the required predictions by groups of individuals while the available models define the predictions at the individual level (for example, the modal distribution models of disaggregated).
• In actual studies, the options presented to individuals are added and you should make your choice using average values (in the explanatory variables or even alternative).
Análisis de Datos de Transporte y Logística – MASTER LTM - UPC
Prof. Lídia Montero © Pàg. 1 - 27 Curs 201 3- 201 4
1-3. TYPES OF SURVEYS IN TRANSPORT
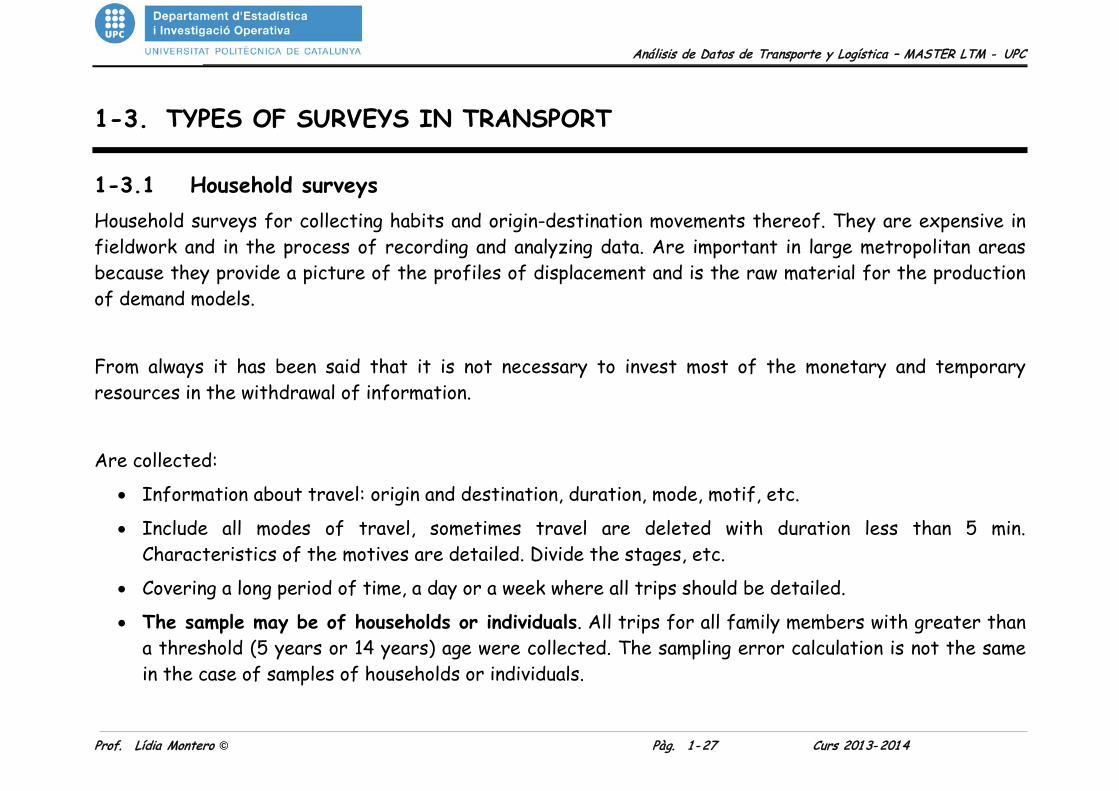
1-3.1 Household surveys Household surveys for collecting habits and origin-destination movements thereof. They are expensive in fieldwork and in the process of recording and analyzing data. Are important in large metropolitan areas because they provide a picture of the profiles of displacement and is the raw material for the production of demand models.
From always it has been said that it is not necessary to invest most of the monetary and temporary resources in the withdrawal of information.
Are collected:
• Information about travel: origin and destination, duration, mode, motif, etc.
• Include all modes of travel, sometimes travel are deleted with duration less than 5 min. Characteristics of the motives are detailed. Divide the stages, etc.
• Covering a long period of time, a day or a week where all trips should be detailed.
• The sample may be of households or individuals. All trips for all family members with greater than a threshold (5 years or 14 years) age were collected. The sampling error calculation is not the same in the case of samples of households or individuals.

Análisis de Datos de Transporte y Logística – MASTER LTM - UPC
Prof. Lídia Montero © Pàg. 1 - 28 Curs 201 3- 201 4
1-3. TYPES OF SURVEYS IN TRANSPORTATION: HOUSEHOLD, ETC
The criticisms leveled against OD surveys are usually:
• Some of them only gather the average or habitual behavior, not the real behavior. Typical of the surveys that gather what trips are realized habitually, they are in the habit of showing a bias on having scorned the occasional or inadvertently little important trips according to the individuals.
• The information gathered on travel times are often inaccurate, biased and are not associated with the levels of service modes. The solution is simple: instead of asking for duration should ask for start and completion of a stage of a specific displacement. By public transport, valuation opinion timeout, path or level of service has proved very important in the development of alternative selection models.
• Household surveys are performed in usual periods-type or day and cann’t generally be used to study mobility in tourist areas with summer peaks.
• Household surveys should also consider household staff involved with the family (maids, babysitters, etc.).
The design of the survey booklet lies specialists and often give better results household surveys where common visit to collect information and socio-economic characteristics of all household members and is left for a booklet detailing the journeys made in the study period (with contact numbers in case of doubt on the self-completion and / or second visit to collect the booklet displacements).
Análisis de Datos de Transporte y Logística – MASTER LTM - UPC
Prof. Lídia Montero © Pàg. 1 - 29 Curs 201 3- 201 4
1-3. TYPES OF SURVEYS IN TRANSPORTATION: HOUSEHOLD, ETC
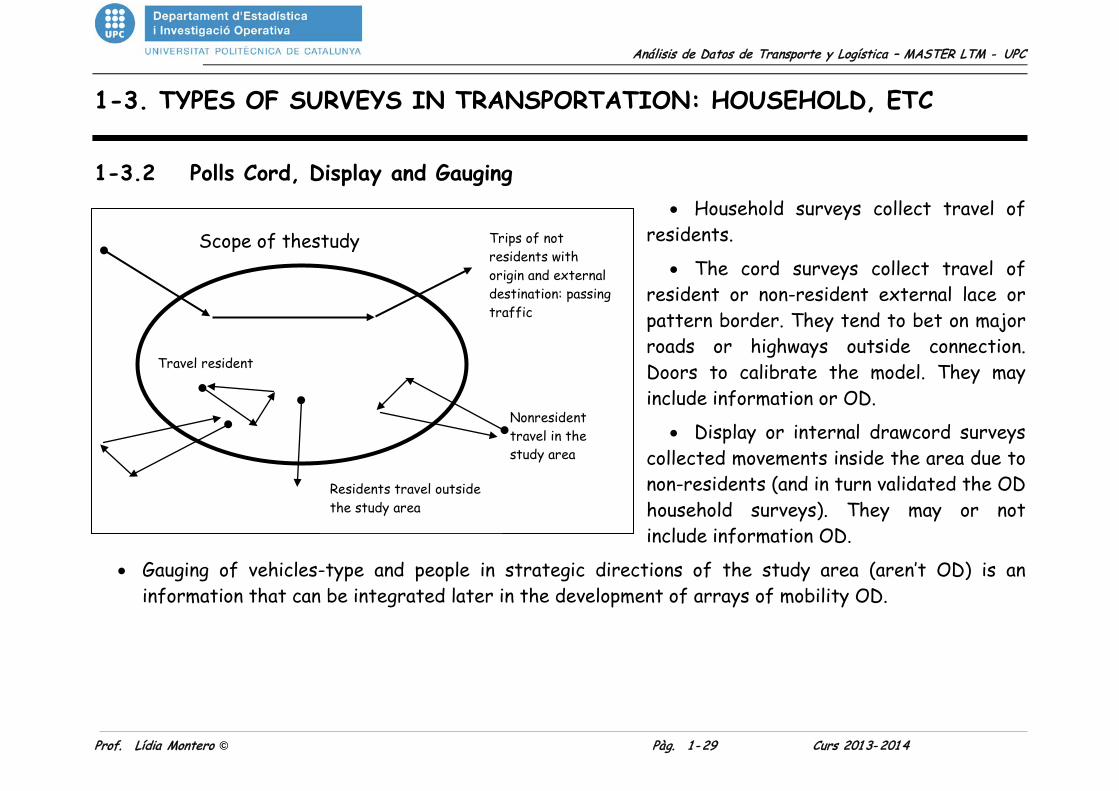
1-3.2 Polls Cord, Display and Gauging • Household surveys collect travel of
residents.
• The cord surveys collect travel of resident or non-resident external lace or pattern border. They tend to bet on major roads or highways outside connection. Doors to calibrate the model. They may include information or OD.
• Display or internal drawcord surveys collected movements inside the area due to non-residents (and in turn validated the OD household surveys). They may or not include information OD.
• Gauging of vehicles-type and people in strategic directions of the study area (aren’t OD) is an information that can be integrated later in the development of arrays of mobility OD.
Scope of thestudy Trips of not residents with origin and external destination: passing traffic
Travel resident
Nonresident travel in the study area
Residents travel outside the study area
Análisis de Datos de Transporte y Logística – MASTER LTM - UPC
Prof. Lídia Montero © Pàg. 1 - 30 Curs 201 3- 201 4
1-3. TYPES OF SURVEYS IN TRANSPORTATION: HOUSEHOLD
1-3.3 Other information gathered The development of models of demand implies the need to collect information on land use (population, housing, m2 by sector differentiating small businesses and large surface area, number of jobs by industry, parking spaces, location services how schools theaters, medical centers, etc.).
Advances in computing environments allow increasing the detail of the information collected requesting the information from the environment by layers with different georeferenced units. In GeoMedia, there is evidence of the collection of information on the location of each and every one of the trees, street furniture, and elements of economic activity in medium-sized cities such as Barcelona or in case of Vitoria-Gasteiz. The GIS environments are associated with relational databases which can then be exported to tables most commonly managed by engineers in access or excel (entorn MS-Windows).
Quality Surveys are conducted periodically by public transport operators and allows obtaining anindex of satisfaction, detection of areas for improvement in service or simply not important respects. A comparison of indicators over time (every 5 years) gives an idea of the evolution of user feedback.
Up / Down Surveys on the various stops of the bus lines of an operator and OD configuration between stops is usually performed regularly.
Análisis de Datos de Transporte y Logística – MASTER LTM - UPC
Prof. Lídia Montero © Pàg. 1 - 31 Curs 201 3- 201 4
1-3. TYPES OF SURVEYS IN TRANSPORTATION: SP VS RP
1-3.4 Stated Preference surveys The household surveys collected actual travel and therefore allow the estimation of models of modal distribution (generically, of selecting alternatives) on choices made by individuals, therefore respond to information about revealed preferences (RP, revealed-preference surveys).
The profile of travel or travel behavior in a base situation is reflected in the collection of type information revealed preferences, but the prognosis for future scenarios with major changes in transport infrastructure, the model predictions of demand over RP basis often weak because they use explanatory variables that may be correlated to the base situation or are secondary variables that have not been introduced in the models (variables of comfort or safety very important in the use of public transport) or the future scenario includes drastic changes such as the emergence of a new mode or the implementation of road pricing in the CBD.
The solution resides in submitting to hypothetical fictitious conditions the individuals, with typical variables to levels intelligently defined by means of experimental design and measuring the position or alternative selected by the individuals in different conditions. This one is information of declared preferences (SP survey).
Análisis de Datos de Transporte y Logística – MASTER LTM - UPC
Prof. Lídia Montero © Pàg. 1 - 32 Curs 201 3- 201 4
1-3. TYPES OF SURVEYS IN TRANSPORTATION: SP VS RP
The revealed preferences survey (RP) for the estimation of modal split models is usually pre. These surveys require a sample of 600 individuals (50 to 100 individuals per parameter, with the implicit parsimony criterion, no points to overcome 6-8 explanatory variables). Individuals PR survey are the basis from which to survey the SP, where the captives or individuals with very specific needs have to be removed.
Combining data of Revealed Preferences (RP) and Declared (SP) in order to estimate a single model of RP / SP is provided as a future option for building good predictive models (Discrete Choice Methods with Simulation Kenneth Train Cambridge University Press, 2003).
SP survey data are good to determine the subjective assessment of attributes, but may not be reliable in terms of predicting the future. The conditions for the SP with valid conclusions are:
• The design of the SP surveys is very complex, this must be done and have monitoring by expert personnel.
• Alternatives should be described realistically and accurately from attributes such as travel time, cost, frequency, comfort, and layout. The different hypothetical alternatives are constructed so that it can estimate the individual effect of each attribute (design of experiments).
• The presentation of hypothetical alternatives must be intelligible and concise.
• The responses to hypothetical situations may be choosing an alternative or establishing a ranking of preference among the alternatives or selection by competition between pairs of alternatives, etc.
Análisis de Datos de Transporte y Logística – MASTER LTM - UPC
Prof. Lídia Montero © Pàg. 1 - 33 Curs 201 3- 201 4
1-3. TYPES OF SURVEYS IN TRANSPORTATION: SP VS RP
The order and presentation of alternatives has proved important. The effect of fatigue appears respondents easily if the number of choices is high (greater than 10), possibly due to the large number of attributes included or to the many levels of variation to which they are subjected. A pilot test is usually necessary to detect problems in the design or define appropriate levels of attributes.
Experienced authors argue that specific algorithms implemented in the design of the questionnaire to reduce discomfort of the interviewee.
A comprehensive discussion on the relevant questionnaire design, item issues that experts say is critical in the text edited by Ortúzar, Hensher, Jara-Díaz (1998) in Elsevier “Travel Behavior Research: Updating the State of Play”, specifically the contribution of StaffanWidlertStated Preferente Studies: The Design Affects the Results.
There are three main ways to collect data from SP: Hierarchies (rankings). Elections. Generalized elections or escalations.
Análisis de Datos de Transporte y Logística – MASTER LTM - UPC
Prof. Lídia Montero © Pàg. 1 - 34 Curs 201 3- 201 4
1-3. TYPES OF SURVEYS IN TRANSPORTATION: SP, RP
The SP survey design contemplates:
• The definition of the technologically possible alternatives (feasible).
• The selection of attributes that will characterize each option.
• The selection of units of measure for each attribute (or the name given to the different levels).
• The definition of levels to consider in each attribute and the combination of attribute levels that will characterize each option (experimental design).
According to Louviere (Louviere, J.J., Hensher D.A. and Swait J (2000) Stated Choice Methods: Analysis and Application. Cambridge Univ. Press, Cambridge): • The main effects explain 80% or more of the variance. • The double interactions rarely explain more than 3%. The triple interactions explain still smaller
portions of the data variance, rarely more than 0.5 to 1%. • Higher order effects explain a minuscule proportion of the variance in the data.
Basically, the cost of introducing interactions is greater complexity (most situations requires evaluation hypothetical). If the number of alternatives, attributes, etc. not remain low, the design may become impracticable. The solution is to use a block design, applied to several sub-samples, which greatly complicates the design Sampling Plan and tends to require some increase in the total sample size.

Análisis de Datos de Transporte y Logística – MASTER LTM - UPC
Prof. Lídia Montero © Pàg. 1 - 35 Curs 201 3- 201 4
( )21 12
N N+ −
1-3. TYPES OF SURVEYS IN TRANSPORTATION: SP, RP
All are designed analogously; in the latter two cases only changes the scale to respond. Scaling or Generalized Election data allow use scales as rates and thus estimate the effect of each factor on individual choices.
The hierarchy is more complex; the number of assessments required to sort N options:
The information of hierarchical organization needs of the explosion of the ranking; the order:
U1 ≥ U2 ≥ …. ≥ Um
This can be transformed to m - 1 equivalent choice:
U1 ≥Uj j = {2, 3, …, m}
U2 ≥Uj j = {3, 4, …, m}
•
•
•
Um-1 ≥ Um
Análisis de Datos de Transporte y Logística – MASTER LTM - UPC
Prof. Lídia Montero © Pàg. 1 - 36 Curs 201 3- 201 4
1-3. TYPES OF SURVEYS IN TRANSPORTATION: SP, RP
The generated elections are treated as in the case of Revealed Preferences. The identified problems usually are: separate options, noise depth (as Ben Akiva authors recommend not exceed the depth of 4, whereas other authors claim as Ortúzar to reach up to 8-9, if the design of the alternatives is very studied and refined after undergoing tests in pilot surveys 30-40 individuals).
Estimation methods for Generalised Elections: Linear regression after transformation of Berkson-Theil Ordinal probit Binary Logit (not recommended)
Estimation methods for Election Data: As in the case of data Revealed Preferences - maximum likelihood.
Previous methods require a potentially invalid assumption; all observations of an individual are independent. At present, it is subject of scientific research extension of the usual disaggregated models (RP or SP origin) to repeated observations (random effects).
Análisis de Datos de Transporte y Logística – MASTER LTM - UPC
Prof. Lídia Montero © Pàg. 1 - 37 Curs 201 3- 201 4
1-3. TYPES OF SURVEYS IN TRANSPORTATION: SP, RP
1-3.5 Surveys Revealed Preferences in modal split Modal split models are probably the most important models in Transportation Planning.This is due to the role of collective / private transport dichotomy in maintaining acceptable levels of congestion in major western cities. The current modal distribution of a field of study requires Revealed Preferences Surveys.
Factors that influence the choice of travel mode can be classified into several groups:
• Characteristic of the traveler.
• Availability of private vehicles.
• Structure of housing.
• Income level.
• Population density.
Travel Features:
• The purpose of travel (business travel are more likely to use public transport).
• Time of day is done the trip.

Análisis de Datos de Transporte y Logística – MASTER LTM - UPC
Prof. Lídia Montero © Pàg. 1 - 38 Curs 201 3- 201 4
1-3. TYPES OF SURVEYS IN TRANSPORTATION: RP
Characteristics of the transport system:
• Time Travel (Travel more pending) in different ways.
• Monetary cost of travel in each mode.
• Availability and cost of parking in private mode.
• Comfort and convenience of the ways.
• Safety and regularity of service.
In most cases, the modal split models were subsequently applied to the travel distribution, considering as significant variables one or two characteristics of the trip (usually travel time in the car) and should calibrate an exponential curve looks representing the proportion of trips in each mode, from the difference in travel cost (time).
More inaccurate models are aggregated modal split and represent the collective / private modal split where the main factor of discrimination between the two modes is the generalized cost of travel,tijk, supposedly values supplied to the starting model for each OD pair (i, j ) and k (1 or 2) mode.

Análisis de Datos de Transporte y Logística – MASTER LTM - UPC
Prof. Lídia Montero © Pàg. 1 - 39 Curs 201 3- 201 4
1-3. TYPES OF SURVEYS IN TRANSPORTATION: RP
The disaggregated demands models are based on observed choices individual travelers consider the probabilities of individual choice. Using this second approach should enable the development of more realistic models. In general it is postulated that:
• The probability of individual choice depends on the socioeconomic characteristics of each person and the relative attractiveness of each of the alternatives.
The concept of utility is used to represent attractiveness, (tautologically defined as that which the individual seeks to maximize):
Usually systematic or representative utility is specified as a linear combination of variables, for example:
Vauto = 0,25 – 1,2 TVauto – 2,5 Accauto – 0,3 (C/I)auto + 1,1 Naut
In this case a unit change in the Time (Acc) has an impact of about twice the travel time in the vehicle (TV), and more than seven times that of a unit change in the variable cost divided by income (C / I). Naut is the number of cars in the household of the individual modeling. The specific constant (0.25) represents the net influence of all unobserved or non-explicitly, of the individual or the alternative in their utility function.
Análisis de Datos de Transporte y Logística – MASTER LTM - UPC
Prof. Lídia Montero © Pàg. 1 - 40 Curs 201 3- 201 4
1-3. TYPES OF SURVEYS IN TRANSPORTATION: RP
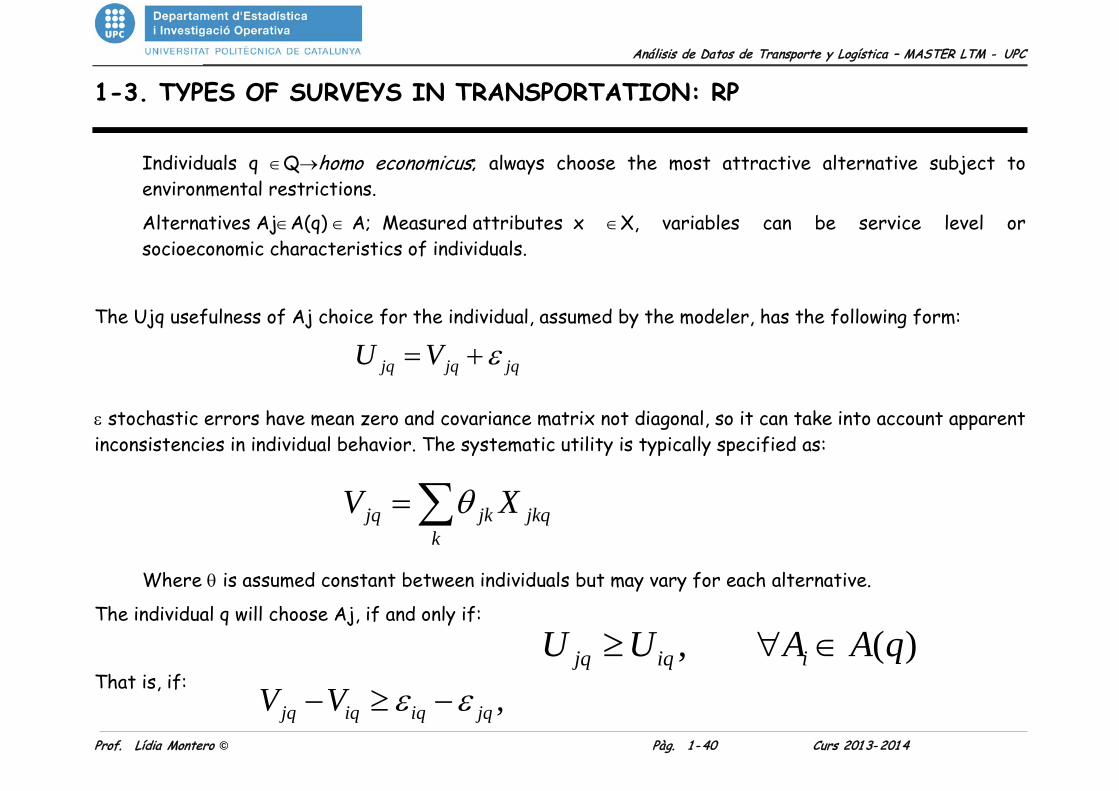
Individuals q ∈Q→homo economicus; always choose the most attractive alternative subject to environmental restrictions.
Alternatives Aj∈A(q) ∈ A; Measured attributes x ∈X, variables can be service level or socioeconomic characteristics of individuals.
The Ujq usefulness of Aj choice for the individual, assumed by the modeler, has the following form:
ε stochastic errors have mean zero and covariance matrix not diagonal, so it can take into account apparent inconsistencies in individual behavior. The systematic utility is typically specified as:
Where θ is assumed constant between individuals but may vary for each alternative.
The individual q will choose Aj, if and only if:
That is, if:
jq jq jqU V ε= +
, ( )jq iq iU U A A q≥ ∀ ∈,jq iq iq jqV V ε ε− ≥ −
jq jk jkqk
V Xθ=∑
Análisis de Datos de Transporte y Logística – MASTER LTM - UPC
Prof. Lídia Montero © Pàg. 1 - 41 Curs 201 3- 201 4
1-3. TYPES OF SURVEYS IN TRANSPORTATION: RP
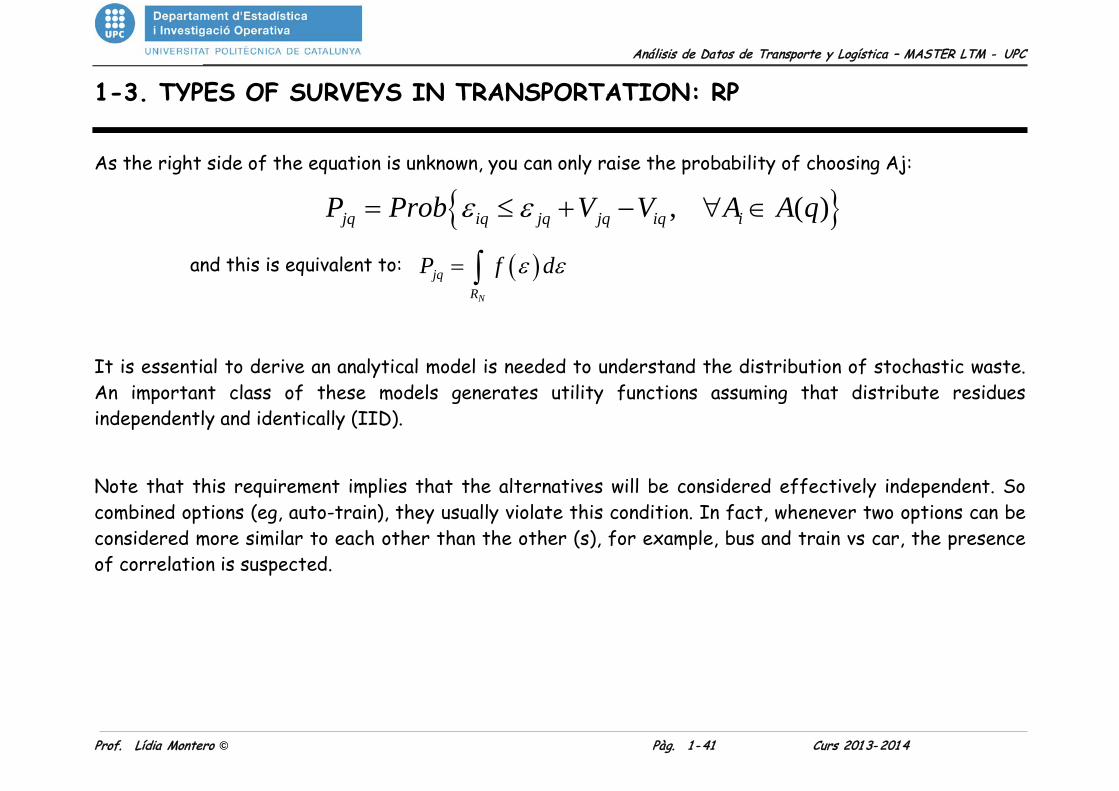
As the right side of the equation is unknown, you can only raise the probability of choosing Aj:
and this is equivalent to:
It is essential to derive an analytical model is needed to understand the distribution of stochastic waste. An important class of these models generates utility functions assuming that distribute residues independently and identically (IID).
Note that this requirement implies that the alternatives will be considered effectively independent. So combined options (eg, auto-train), they usually violate this condition. In fact, whenever two options can be considered more similar to each other than the other (s), for example, bus and train vs car, the presence of correlation is suspected.
{ }, ( )jq iq jq jq iq iP Prob V V A A qε ε= ≤ + − ∀ ∈
( )N
jqR
P f dε ε= ∫
Análisis de Datos de Transporte y Logística – MASTER LTM - UPC
Prof. Lídia Montero © Pàg. 1 - 42 Curs 201 3- 201 4
1-3. TYPES OF SURVEYS IN TRANSPORTATION: RP
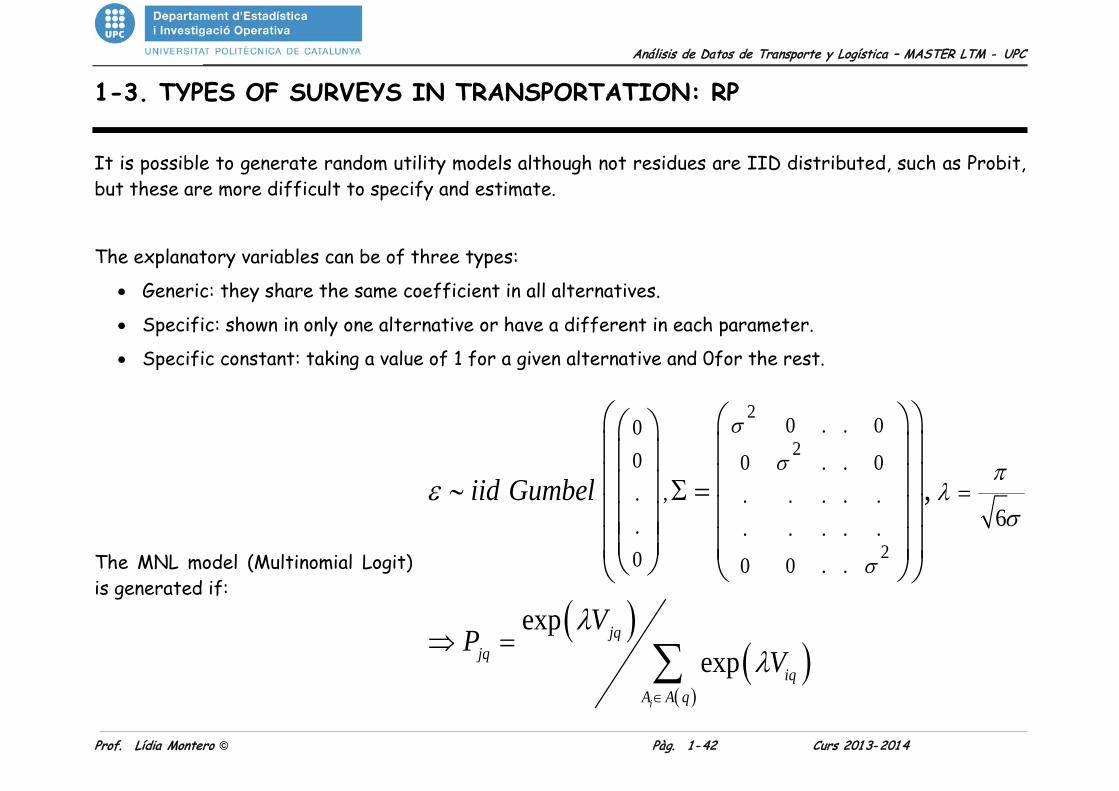
It is possible to generate random utility models although not residues are IID distributed, such as Probit, but these are more difficult to specify and estimate.
The explanatory variables can be of three types:
• Generic: they share the same coefficient in all alternatives.
• Specific: shown in only one alternative or have a different in each parameter.
• Specific constant: taking a value of 1 for a given alternative and 0for the rest.
The MNL model (Multinomial Logit) is generated if:
( )( )
( )
2
2
2
0 . . 000 0 . . 0
,. . . . . .. . . . . .0 0 0 . .
6
expexp
,
i
jqjq
iqA A q
iid Gumbel
VP
V
σ
σ
σ
πλ
σε
λλ
∈
=∼ Σ =
⇒ =
∑

Análisis de Datos de Transporte y Logística – MASTER LTM - UPC
Prof. Lídia Montero © Pàg. 1 - 43 Curs 201 3- 201 4
1-3. TYPES OF SURVEYS IN TRANSPORTATION: RP
The MNL does not allow changes in taste (ie, that each individual has different θ parameters), or try the case of having more than one observation from the same person, nor can treat heteroskedasticity correctly.
The Mixed Logit, however, combines white noise errors Gumbel type as the MNL, with errors from other distributions. While today is the standard, its estimation, and especially the interpretation of their results, it is much more complex. The consultants are familiar with these models and with the free software accessible through the website of Professor Kenneth Train, University of Berkeley in the U.S.A.
Williams (1977) realized that there are situations where extreme generality allowed by the Joint Logit can be an unnecessary luxury. A good example is two-dimensional situations of choice (eg, destination and mode), where you can apply:
U(d, m) = Ud + Udm = Vd + εd + Vdm + εdm
If ε are IID separately,
under certain conditions is obtained
the hierarchical or nested logit model (NL):
( )( )
( ) ∑∑′′
+
+
′∗′′
∗
⋅=
m
V
V
d
VV
VV
md
dm
dd
dd
ee
eemdP λ
λ
β
β
,
Análisis de Datos de Transporte y Logística – MASTER LTM - UPC
Prof. Lídia Montero © Pàg. 1 - 44 Curs 201 3- 201 4
car taxi bus train metro
Tr.
1-3. TYPES OF SURVEYS IN TRANSPORTATION: RP
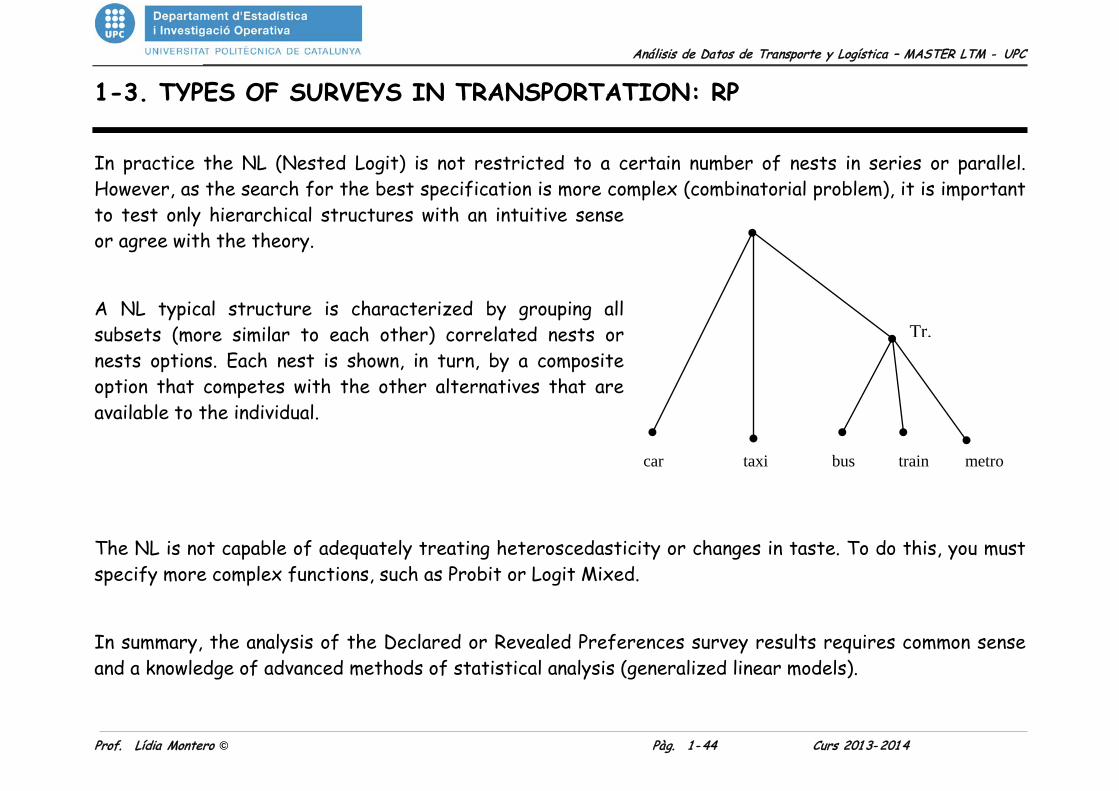
In practice the NL (Nested Logit) is not restricted to a certain number of nests in series or parallel. However, as the search for the best specification is more complex (combinatorial problem), it is important to test only hierarchical structures with an intuitive sense or agree with the theory.
A NL typical structure is characterized by grouping all subsets (more similar to each other) correlated nests or nests options. Each nest is shown, in turn, by a composite option that competes with the other alternatives that are available to the individual.
The NL is not capable of adequately treating heteroscedasticity or changes in taste. To do this, you must specify more complex functions, such as Probit or Logit Mixed.
In summary, the analysis of the Declared or Revealed Preferences survey results requires common sense and a knowledge of advanced methods of statistical analysis (generalized linear models).

Análisis de Datos de Transporte y Logística – MASTER LTM - UPC
Prof. Lídia Montero © Pàg. 1 - 45 Curs 201 3- 201 4
1-3. TYPES OF SURVEYS IN TRANSPORTATION: RP
Ortuzar According, a practical guide to examine the consistency of the estimated values of the parameters, you could summarize generically in the following table:
Variable Significantly different from 0 Not significantly different from zero
Relevant or Policy
Correct sign OK Keep in model
Wrong sign Serious problem Problem
Additional Correct sign OK Try if possible out of the model
Wrong sign Out of the model. Out of the model.

Análisis de Datos de Transporte y Logística – MASTER LTM - UPC
Prof. Lídia Montero © Pàg. 1 - 46 Curs 201 3- 201 4
1-4. EXAMPLES OF TRANSPORTATION SURVEYS: SP, RP, QUALITY
1-4.1 Example PD: Changes in the supply of buses, competition between bus, car and foot.
The variables considered relevant for the discrete modal response are:
1. Price: Two Actual levels (reference) and +20% (20% higher than currently).
2. Distance to save Departure: <150m and over 150m (reference).
3. Stopping distance at destination: < 150m and over 150m (reference).
4. Frequency of the line or lines involved in the movement: 3 (reference) and 6 units per hour (i.e., frequency of 15 or 10 minutes).
5. Displacement length <500 m (reference Bus-Pie) and over 500 m (reference in Bus-Car).
6. Price Check Parking: Actual (reference) and +20% (20% higher than currently).
The configuration of the survey reflects a fractional factorial design with 2 levels k = 6 dichotomous explanatory variables and fractional reduction of 1-4, with resolution of order 4. All main effects will be estimated and there only to confusion between main effects and interactions from order 3.

Análisis de Datos de Transporte y Logística – MASTER LTM - UPC
Prof. Lídia Montero © Pàg. 1 - 47 Curs 201 3- 201 4
1-4. EXAMPLES OF TRANSPORTATION SURVEYS: SP
CHOOSE TRAVEL MODE, A FOOT OR BY BUS, ACCORDING TO HYPOTHETICAL DISPLACEMENT CHARACTERISTICS DESCRIBED FOOT DISTANCE DISTANCE FREQUENCY PRICE PARKING LENGTH
O STOP IN STOP IN OF A BUS LINE HOUR OFFSET
AUTOBUS ORIGIN DESTINATION IN UNITS PER HOUR PRICE
1. Foot 2. Bus Campo 12 13 14 15 16 17 3. Others o NS/NC "ID SP-Fila 1 Col.18 <150 m <150 m 3 Actual Actual < 500 m "ID SP-Fila 2 Col.18 <150 m <150 m 3 Rises 20% Actual 500 m or more "ID SP-Fila 3 Col.18 <150 m <150 m 6 Actual Rises 20% 500 m or more "ID SP-Fila 4 Col.18 <150 m <150 m 6 Rises 20% Rises 20% < 500 m "ID SP-Fila 5 Col.18 <150 m 150 m+ 3 Actual Rises 20% 500 m or more "ID SP-Fila6 Col.18 <150 m 150 m+ 3 Rises 20% Rises 20% < 500 m "ID SP-Fila 7 Col.18 <150 m 150 m+ 6 Actual Actual < 500 m "ID SP-Fila 8 Col.18 <150 m 150 m+ 6 Rises 20% Actual 500 m or more "ID SP-Fila 9 Col.18 150 m+ <150 m 3 Actual Rises 20% < 500 m "ID SP-Fila 10 Col.18 150 m+ <150 m 3 Rises 20% Rises 20% 500 m or more "ID SP-Fila 11 Col.18 150 m+ <150 m 6 Actual Actual 500 m or more "ID SP-Fila 12 Col.18 150 m+ <150 m 6 Rises 20% Actual < 500 m "ID SP-Fila 13 Col.18 150 m+ 150 m+ 3 Actual Actual 500 m or more "ID SP-Fila 14 Col.18 150 m+ 150 m+ 3 Rises 20% Actual < 500 m "ID SP-Fila 15 Col.18 150 m+ 150 m+ 6 Actual Rises 20% < 500 m "ID SP-Fila 16 Col.18 150 m+ 150 m+ 6 Rises 20% Rises 20% 500 m or more

Análisis de Datos de Transporte y Logística – MASTER LTM - UPC
Prof. Lídia Montero © Pàg. 1 - 48 Curs 201 3- 201 4
1-4. EXAMPLES OF TRANSPORTATION SURVEYS: SP
The most important design factors are: Length and Frequency of Travel on the positive side for the capture of the bus and on the negative side, the price of the ticket. In the table below are summarized in the main effects of the different factors in terms of log-odds, odds and probabilities, on the basis of probability bus use the reference group estimated by the model.
MODAL DISTRIBUTION BUS-CAR (Only Factors Design)
VARIABLE Category LOG-ODDS ODDS PROBABILITY (approximate)
Reference 150 m+ 150 m+ 3uni/h Actual Actual +500m -0,71334 0,49000485 33%
Dist. Stop in origin <150m 0,32896 39% 8%
Dist. Stop in destination <150m
0,25969 30% 6%
Buses per Hour 6 uni/hora
0,39229 48% 10%
Price of the Ticket Rises 20%
-0,37306 -31% -9%
Parking hour price Rises 20%
0,28150 33% 7%
Length of trip Less than 500 m
0,44103 55% 11%
Análisis de Datos de Transporte y Logística – MASTER LTM - UPC
Prof. Lídia Montero © Pàg. 1 - 49 Curs 201 3- 201 4
1-4. EXAMPLES OF TRANSPORTATION SURVEYS: SP
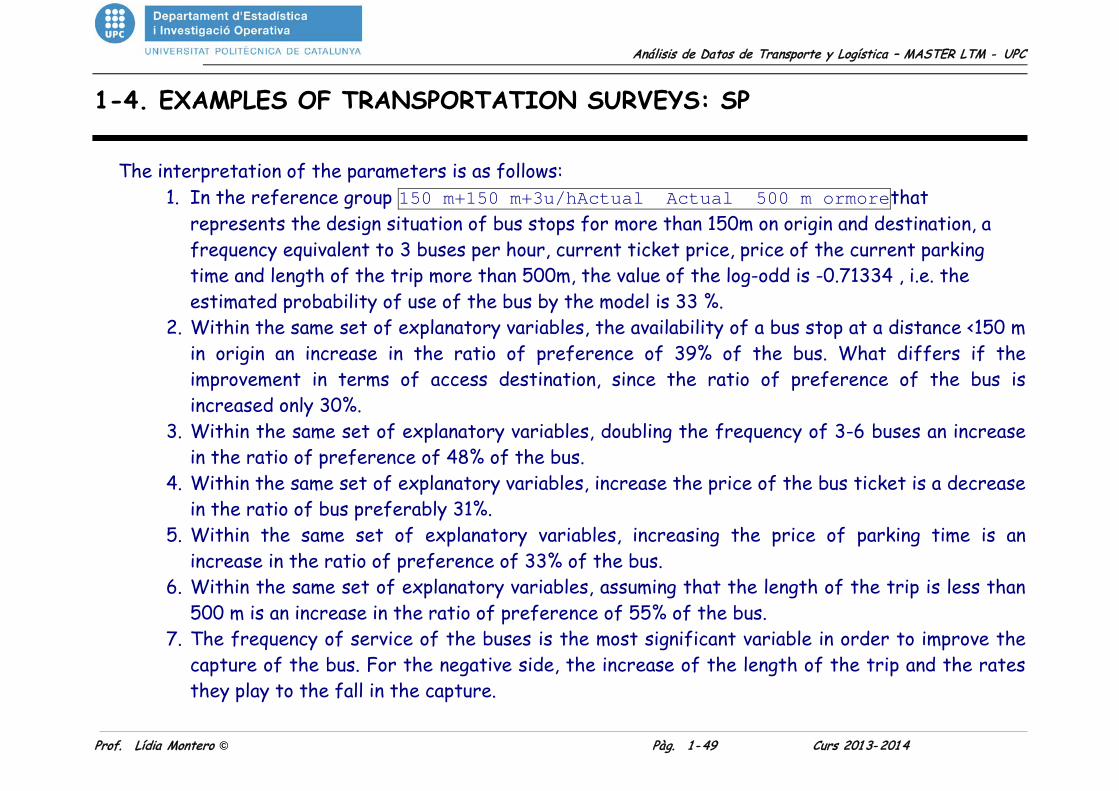
The interpretation of the parameters is as follows: 1. In the reference group 150 m+150 m+3u/hActual Actual 500 m ormorethat
represents the design situation of bus stops for more than 150m on origin and destination, a frequency equivalent to 3 buses per hour, current ticket price, price of the current parking time and length of the trip more than 500m, the value of the log-odd is -0.71334 , i.e. the estimated probability of use of the bus by the model is 33 %.
2. Within the same set of explanatory variables, the availability of a bus stop at a distance <150 m in origin an increase in the ratio of preference of 39% of the bus. What differs if the improvement in terms of access destination, since the ratio of preference of the bus is increased only 30%.
3. Within the same set of explanatory variables, doubling the frequency of 3-6 buses an increase in the ratio of preference of 48% of the bus.
4. Within the same set of explanatory variables, increase the price of the bus ticket is a decrease in the ratio of bus preferably 31%.
5. Within the same set of explanatory variables, increasing the price of parking time is an increase in the ratio of preference of 33% of the bus.
6. Within the same set of explanatory variables, assuming that the length of the trip is less than 500 m is an increase in the ratio of preference of 55% of the bus.
7. The frequency of service of the buses is the most significant variable in order to improve the capture of the bus. For the negative side, the increase of the length of the trip and the rates they play to the fall in the capture.
Análisis de Datos de Transporte y Logística – MASTER LTM - UPC
Prof. Lídia Montero © Pàg. 1 - 50 Curs 201 3- 201 4
1-4. EXAMPLES OF SURVEYS IN TRANSPORT: QUALITY
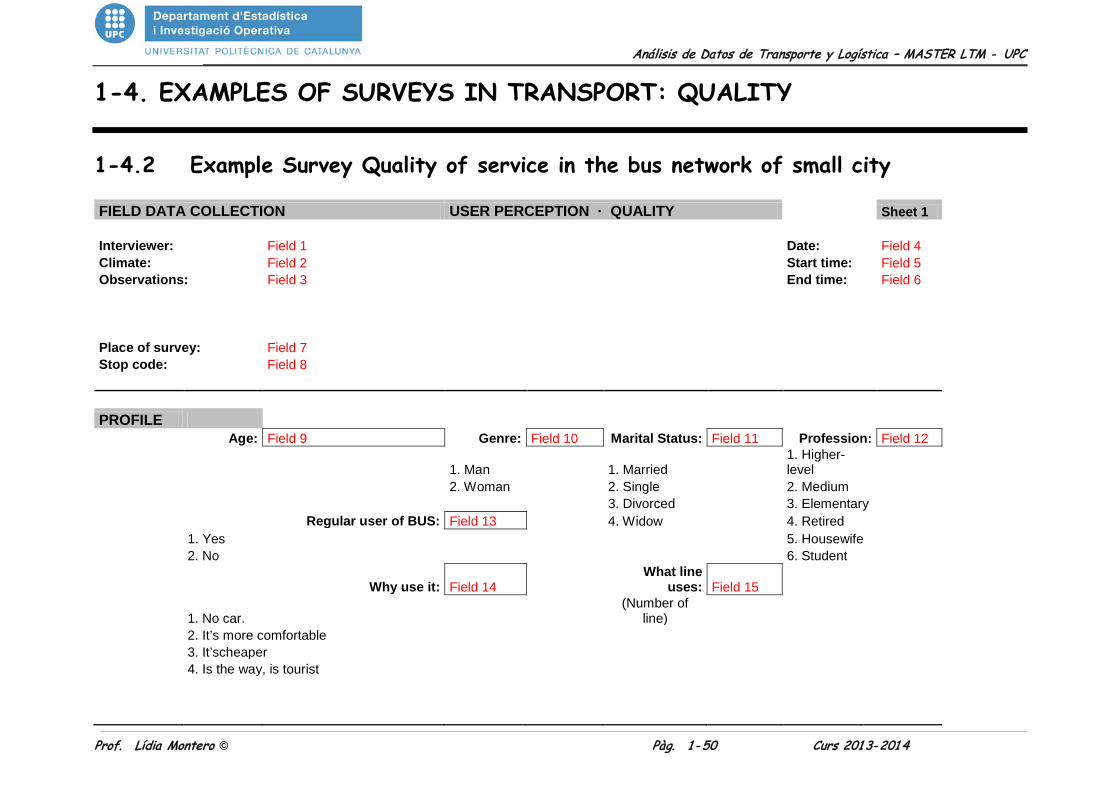
1-4.2 Example Survey Quality of service in the bus network of small city FIELD DATA COLLECTION USER PERCEPTION · QUALITY Sheet 1 Interviewer: Field 1 Date: Field 4 Climate: Field 2 Start time: Field 5 Observations: Field 3 End time: Field 6 Place of survey: Field 7 Stop code: Field 8 PROFILE Age: Field 9 Genre: Field 10 Marital Status: Field 11 Profession: Field 12
1. Man 1. Married 1. Higher-level
2. Woman 2. Single 2. Medium 3. Divorced 3. Elementary Regular user of BUS: Field 13 4. Widow 4. Retired 1. Yes 5. Housewife 2. No 6. Student
Why use it: Field 14 What line
uses: Field 15
1. No car. (Number of
line) 2. It’s more comfortable 3. It’scheaper 4. Is the way, is tourist

Análisis de Datos de Transporte y Logística – MASTER LTM - UPC
Prof. Lídia Montero © Pàg. 1 - 51 Curs 201 3- 201 4
COVERAGE Time Distance (minutes) (meters) How much time / distance walks from your origin to the stop: Field 16 Field 17 How much time / distance walk from the bus stop to your destination: Field 18 Field 19 You need to do some transfer in your trip: Field 20 1. Yes 2. No There are reasons for travel or destinations that do not use the BUS: Field 21 1. Yes 2. No In travel destinations or reasons that do not use the BUS, Why does not?: Field 22 1. Notcomfortablefor me. 2. Stops are away 3. Travel time or frequency is not good 4. No service at this time 5. I'm accompanied by person with reduced mobility (PRM) FIELD DATA COLLECTION USER PERCEPTION • QUALITY Sheet 2 SERVICE Consider that the average waiting time at stops is: Field 23 1. Acceptable 2. Short 3. Excessivelylong Consider that the total travel time is: Field 24 1. Acceptable 2. Competitivewith car 3. Excessive Considers that the service is prompt, turn on time: Field 25 1. Punctual 2. Little 3. Variable 4. Unacceptable Consider the service, punctuality and travel time is: Field 26 1. Stable 2. Withspecificvariations 3. Highly variable

Análisis de Datos de Transporte y Logística – MASTER LTM - UPC
Prof. Lídia Montero © Pàg. 1 - 52 Curs 201 3- 201 4
Considers the quality of the vehicles is adequate: Field 27 1. Yes 2. No Seatsnumber: Field 28 Cleaning: Field 29 Accessibility Field 30 Comfort Field 31 Considers the attention of staff adequate: Field 32 1. Yes 2. No know the information thatXXXX.SA provides: Field 33 1. Yes 2. No Considers information about the service is adequate: Field 34 1. Yes 2. No Brochures: Field 35 Stops: Field 36 Internet: Field 37 What type of payment used for transportation: Field 38 1. Bus pass 2. One-way ticket 3. Student 4. Free It seems appropriate that the price is based on quality of service: Field 39 1. Yes 2. No Level of satisfaction with services: Field 40 Score from 0 to 10. Rate the importance of the service to the following areas Sheet 3 and the level of satisfaction that you perceive in each. Score from 0 to 10. Importance Satisfaction 1. Having modern and advanced buses. Field 41 Field 42 2. Have stops very clean and well maintained. Field 43 Field 44 3. Arrange panels schedules in conspicuous places. Field 45 Field 46 4. Always fulfill the promises of service. Field 47 Field 48 5. Always very punctual. Field 49 Field 50 6. Give the necessary information to users. Field 51 Field 52 7. Making bus pass with the right frequency. Field 53 Field 54 8. Place larger buses to more baggy. Field 55 Field 56 9. Having drivers who drive very well. Field 57 Field 58

Análisis de Datos de Transporte y Logística – MASTER LTM - UPC
Prof. Lídia Montero © Pàg. 1 - 53 Curs 201 3- 201 4
10. Having employees who can deal with much kindness. Field 59 Field 60 11. To be able to take the first bus line that passes that interests me. Field 61 Field 62 12. Have schedules and notices easily understood. Field 63 Field 64 13. Having stops well localized. Field 65 Field 66 14. Having employees that address and resolve complaints. Field 67 Field 68 15. Ensure the safety of people and their property. Field 69 Field 70 16. Fast service. Field 71 Field 72 MEAN Field 73 Field 74 Rate the evolution in time of the following aspects of the service: 1. Greatly improved 2. Improved somewhat 3. Equal 4.Deteriorated somewhat 5. Much worse 1. Cleanliness of buses and stops. Field 75 2. Compliance with the time of arrival and departure. Field 76 3. Bus frequency and amplitude in the bus seats. Field 77 4. Competence and friendliness of the staff. Field 78 5. Quickly to complete the journey. Field 79 You've had any problem with XXXX.S.A.: Field 80 1. Yes 2. No If you have had a problem, which has been? 1. Uneducated drivers. Field 81 2. Starting studs, closing doors, poor driving. Field 82 3. No stopping at stops, to pass by without stopping. Field 83 4. Loss of license Field 84 5. Problemsaccessingthe bus. Field 85 6. Disagreement by removing the line stops. Field 86 7. Discussion with another traveler for a seat. Field 87 8. Other: Field 88 If you've had it, you believe it is Field 89 1. Serious 2. Annoying 3. Inconsequential 4. Ns./Nc.

Análisis de Datos de Transporte y Logística – MASTER LTM - UPC
Prof. Lídia Montero © Pàg. 1 - 54 Curs 201 3- 201 4
Variable Mean Satisfaction Mean Importance
1. Modern buses 6,7926 8,4579
2. Stop cleaning 6,381 8,2793
3. Schedules panels 6,319 8,7668
4. Promises of Service 6,274 8,7482
5. Punctuality 6,502 9,1577
6. Request info 6,190 8,7815
7. Bus frequency 6,393 9,1716 8. Large buses 6,605 8,445
9. Good drivers 7,058 8,9653
10.Friendly employees 6,799 8,504
11.Buses go full 6,597 8,714
12.Easy information 6,409 8,8937
13.Stops location 6,770 8,8828
14.Attention to customer 6,371 8,930
15.Security 6,891 9,443
16.Fast service 6,397 9,1181
Average satisfaction 6,583 8,966
1-4. EXAMPLES OF SURVEYS IN TRANSPORT: QUALITY
Let us now look at a graph the distribution according to the importance and satisfaction ratings for each of the concepts.
8,5 9,0 9,5
6,2
6,3
6,4
6,5
6,6
6,7
6,8
6,9
7,0
7,1
importancia
satis
facc
ión 1
23
4
5
6
7
8
9
10
11
12
13
14
15
16
media de importancia=8,966
media de satisfacción=6,5830
The points less satisfied customers, even when they give them greater importance, are the timeliness and frequency of buses, and fast service. Thus, it is important to improve that aspect: the client does not experience delays or delays in their journeys due to urban transport service.

Análisis de Datos de Transporte y Logística – MASTER LTM - UPC
Prof. Lídia Montero © Pàg. 1 - 55 Curs 201 3- 201 4
1-4. EXAMPLES OF SURVEYS IN TRANSPORT: QUALITY
Frequency and patterns of use of urban transport
80.4% of respondents are regular users of urban transport, although the majority of respondents were female (70%) within the group of men 75% are a regular user, compared to 83% in women.
No Si
Superi
or
Medio
Jubil
ado
Estudia
nte
Elemen
tal
AmaCas
a
100
50
0
Cou
nt o
f For
mac
ion
51
13
121
30
44
4
34
1
55
16
1
80
1312
Formación-Ocupación según UsuarioHabitual
TabulatedStatistics: UsuarioHabitual; Genre
Rows: UsuarioHColumns: Genre
Man Woman All
No 30 45 75
Yes 88 220 308
All 118 265 383

Análisis de Datos de Transporte y Logística – MASTER LTM - UPC
Prof. Lídia Montero © Pàg. 1 - 56 Curs 201 3- 201 4
1-4. EXAMPLES OF SURVEYS IN TRANSPORT: QUALITY
In relative terms, students, retirees and housewives have a higher incidence of regular users group. Pursuant to Civil State, divorced and widowers have a higher incidence of regular users.
No Si
NS/NC
Mayore
s
Median
aEda
d
Jóve
nes
MuyJó
vene
s
100
50
0
Cou
nt o
f Gru
po_E
dad
300
96
17
2
88
14
0
104
29
0
96
17
0
Grupo_Edad según UsuarioHabitual
No Si
Viudo/a
Soltero
/a
Divorci
ado/a
Casad
o/a
200
100
0
Cou
nt o
f Est
ado C
ivil
39
4
143
33
10
192
38
3
EstadoCivil según UsuarioHabitual
According to age groups, we found that the very young are regular users of urban transport by 82%, youth 72%, the middle-aged 84% and elderly 82%.
Análisis de Datos de Transporte y Logística – MASTER LTM - UPC
Prof. Lídia Montero Pàg. 1 - 57 Curs 2. 006- 2. 007
1-4. EXAMPLES OF SURVEYS IN TRANSPORT: QUALITY
( 26; 6,7%)
Economia ( 16; 4,1%)
Turista ( 5; 1,3%)
Comodidad (162; 41,9%)
Cautivo (178; 46,0%)
Pie Chart of Pq_UsHab?
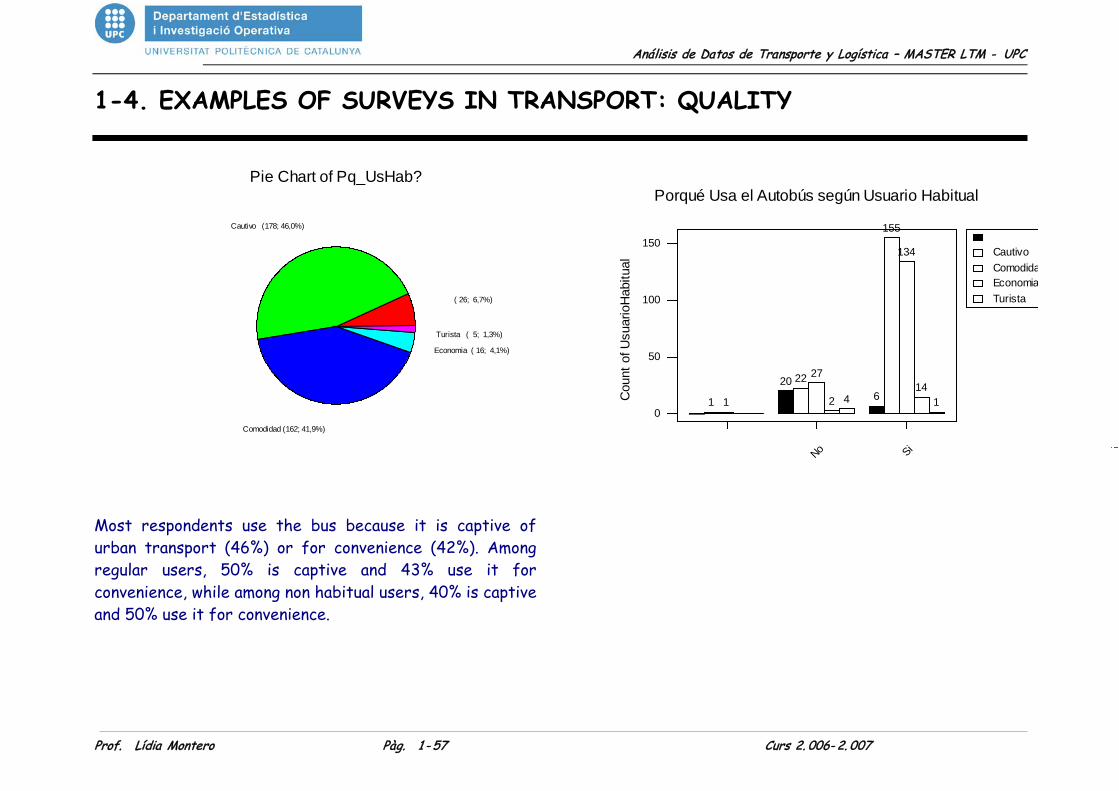
Most respondents use the bus because it is captive of urban transport (46%) or for convenience (42%). Among regular users, 50% is captive and 43% use it for convenience, while among non habitual users, 40% is captive and 50% use it for convenience.
Cautivo Comodida Economia Turista
SiNo
150
100
50
0
Cou
nt o
f Usu
ario
Hab
itual
114
134
155
642
272220
11
Porqué Usa el Autobús según Usuario Habitual
Análisis de Datos de Transporte y Logística – MASTER LTM - UPC
Prof. Lídia Montero © Pàg. 1 - 58 Curs 201 2- 201 3
1-4. EXAMPLES OF TRANSPORTATION SURVEYS: HOUSEHOLD
1-4.3 Example: Household Survey of Mobility in regionally Objective: The completion of this study in the interest of the Department of Transport and Public Works to know the habits of population displacement in the Autonomous Community XXXX and diagnose the current transportation system, which will allow a reorganization and optimization of same. The specific objective is to know the following: -Mobility of residents in the Autonomous Community XXXX. -Global, inter-regional and onshore-Mobility. -Vectors-generation and attraction in every area of transport. – Distribution of trips by mode of transport:
• Distribution of trips by mode of transport (walking, car, public transport, etc.). Characterization of the group of users. • Analysis of transhipments in the public transport network.
– Origin-destination matrix for target activity: work, school, shopping and entertainment. Properties of these groups. - Labor-self-restraint. – Offer public transport:
• Operators. • Offer places / time and demand Territories, Counties and Municipalities. • Connectivity. • Share of public transport.

Análisis de Datos de Transporte y Logística – MASTER LTM - UPC
Prof. Lídia Montero © Pàg. 1 - 59 Curs 201 2- 201 3
1-4. EXAMPLES OF TRANSPORTATION SURVEYS: HOUSEHOLD
Methodology: The purpose of this survey was to obtain information on trips made by residents of the Autonomous Community XXXX aged over six years.
Specifically have collected all motorized trips and journeys made on foot which is longer than five minutes, except for trips made for work and studies that have collected all regardless of the mode of transport used.
The data collected in relation to the movement are, among others, the source and destination of the trip, mode of transport, purpose of travel, duration, number of stages, etc.
Alongside this have obtained a series of characterization data and their family members (age, education level, occupation, etc..).
To carry out the household survey has taken a sample of 10,800 households, which has resulted in an overall sampling error of ± 1% for a confidence level of 95.5%. He has interviewed 10,674 families, which involved a total of 29,624 individuals over six years.
The fieldwork was carried out during the months of October, November and December 2002.
Análisis de Datos de Transporte y Logística – MASTER LTM - UPC
Prof. Lídia Montero © Pàg. 1 - 60 Curs 201 2- 201 3
1-4. EXAMPLES OF TRANSPORTATION SURVEYS: HOUSEHOLD
Sampling Plan:
The sample size was 10,800 households, structured according to the following sampling plan.
1st STAGE SAMPLING
Proportional allocation according to the existing population (legal population) in each of the areas that has been structured the Autonomous Community XXXX.
In turn, within each zone has distributed the sample assigned to the same proportion to the resident in each of the census tracts comprising population.
2nd STAGE SAMPLING
The selection of sampling units within each zone was performed by systematic and random start drawing, establishing the condition that the house is inhabited and alternates are found at a distance of holders of at least three homes.
Análisis de Datos de Transporte y Logística – MASTER LTM - UPC
Prof. Lídia Montero © Pàg. 1 - 61 Curs 201 2- 201 3
1-4. EXAMPLES OF TRANSPORTATION SURVEYS: HOUSEHOLD
Processing information:
All results have been elevated to the total population corresponding to each of the areas of transportation that has been structured the Autonomous Community XXXX, yielding different origin-destination matrices of displacement.
The elevation of the results of the household survey was conducted in two stages:
a) Obtaining initial elevators (corresponding to the family unit and therefore applicable acada one of its members).
b) Preparation of the final elevators (incorporating the correction factor of the initial elevators).
From the universe for each stratum and the sample obtained, we proceeded to the determination of the coefficients of elevation.
The use of elevators (since working with decimals) causes in certain tables, the sum of the data for each area may not match the total reflected, so that there are small differences.
In turn, information, along with the mapping of the Autonomous Community XXXX, on which they have been digitized all public transport lines, has been integrated into a geographic information system (GIS), which allows farm level graph of all data obtained in carrying out this study by generating different thematic maps.
Análisis de Datos de Transporte y Logística – MASTER LTM - UPC
Prof. Lídia Montero © Pàg. 1 - 62 Curs 201 2- 201 3
1-4. EXAMPLES OF TRANSPORTATION SURVEYS: HOUSEHOLD
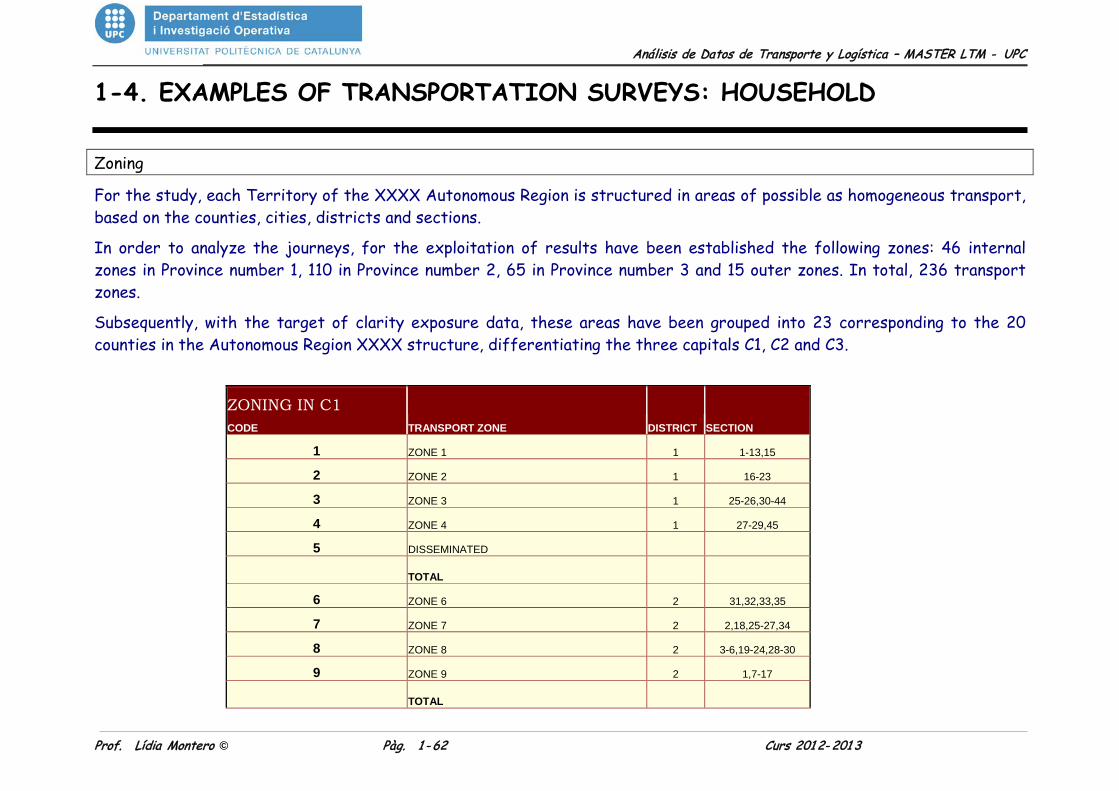
Zoning
For the study, each Territory of the XXXX Autonomous Region is structured in areas of possible as homogeneous transport, based on the counties, cities, districts and sections.
In order to analyze the journeys, for the exploitation of results have been established the following zones: 46 internal zones in Province number 1, 110 in Province number 2, 65 in Province number 3 and 15 outer zones. In total, 236 transport zones.
Subsequently, with the target of clarity exposure data, these areas have been grouped into 23 corresponding to the 20 counties in the Autonomous Region XXXX structure, differentiating the three capitals C1, C2 and C3.
ZONING IN C1 CODE TRANSPORT ZONE DISTRICT SECTION
1 ZONE 1 1 1-13,15
2 ZONE 2 1 16-23
3 ZONE 3 1 25-26,30-44
4 ZONE 4 1 27-29,45
5 DISSEMINATED
TOTAL
6 ZONE 6 2 31,32,33,35
7 ZONE 7 2 2,18,25-27,34
8 ZONE 8 2 3-6,19-24,28-30
9 ZONE 9 2 1,7-17
TOTAL
Análisis de Datos de Transporte y Logística – MASTER LTM - UPC
Prof. Lídia Montero © Pàg. 1 - 63 Curs 201 2- 201 3
1-4. EXAMPLES OF TRANSPORTATION SURVEYS: HOUSEHOLD
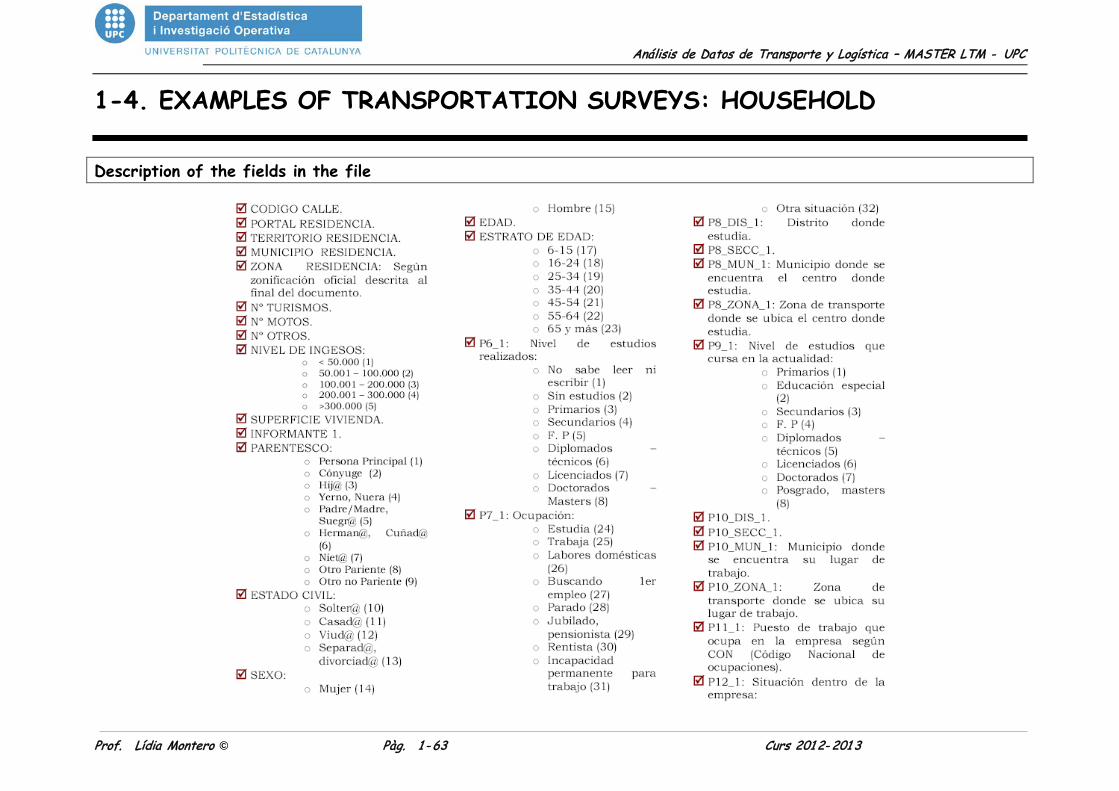
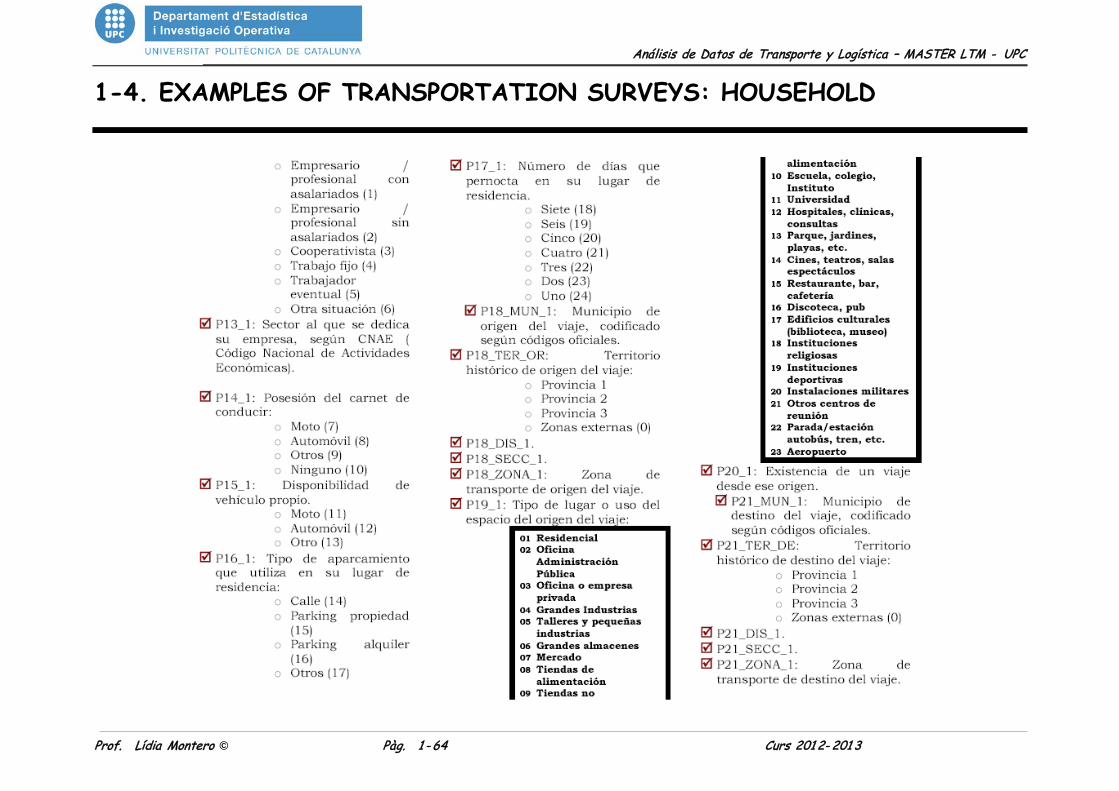
Description of the fields in the file
Análisis de Datos de Transporte y Logística – MASTER LTM - UPC
Prof. Lídia Montero © Pàg. 1 - 64 Curs 201 2- 201 3
1-4. EXAMPLES OF TRANSPORTATION SURVEYS: HOUSEHOLD
Análisis de Datos de Transporte y Logística – MASTER LTM - UPC
Prof. Lídia Montero © Pàg. 1 - 65 Curs 201 2- 201 3
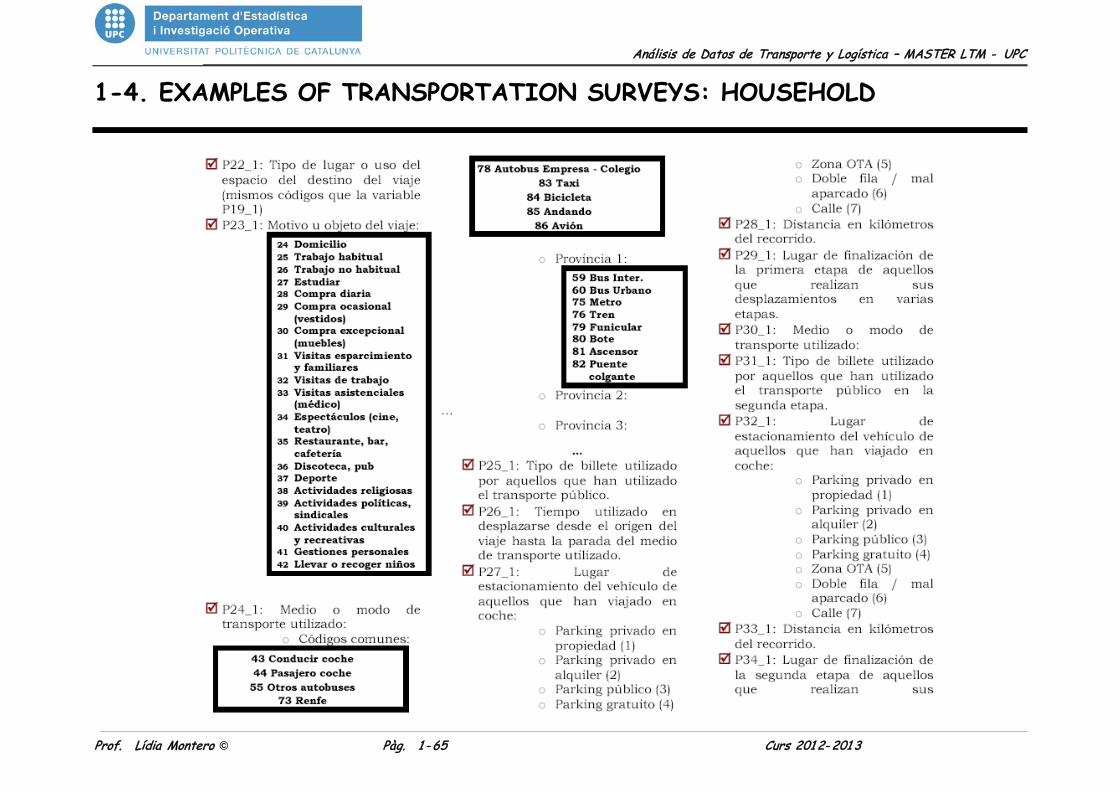
1-4. EXAMPLES OF TRANSPORTATION SURVEYS: HOUSEHOLD

Análisis de Datos de Transporte y Logística – MASTER LTM - UPC
Prof. Lídia Montero © Pàg. 1 - 66 Curs 201 2- 201 3
1-4. EXAMPLES OF TRANSPORTATION SURVEYS: HOUSEHOLD


![Logística y Transporte [1]](https://static.fdocuments.ec/doc/165x107/62e5283b7fa9d71e9611ff29/logstica-y-transporte-1.jpg)