ADICA Training Report - JICA WASP 2007
78
ADICA CONSULTING, LLC 2021 Midwest Road, Suite 200 Telephone: +1 (630) 705-3060 Oak Brook, IL 60523 USA Facsimile: +1 (630) 705-3061 Website: www.adica.com Email: [email protected] Training Report Presented to: Japan International Cooperation Agency (JICA), and PT Indokoei International, Jakarta, Indonesia for: Intensive Training on Generation Planning using WASP-IV organized at APJ PLN Bogor, Indonesia, during 22 January – 2 February 2007 2 February 2007 Submitted by: ADICA Consulting, LLC The Ultimate in Strategic Analysis
Transcript of ADICA Training Report - JICA WASP 2007

ADICA CONSULTING, LLC 2021 Midwest Road, Suite 200 Telephone: +1 (630) 705-3060 Oak Brook, IL 60523 USA Facsimile: +1 (630) 705-3061
Website: www.adica.com Email: [email protected]
Training Report Presented to:
Japan International Cooperation Agency (JICA), and
PT Indokoei International, Jakarta, Indonesia for:
Intensive Training on Generation Planning using WASP-IV organized at APJ PLN Bogor, Indonesia, during 22 January – 2 February 2007
2 February 2007
Submitted by:
ADICA Consulting, LLC The Ultimate in Strategic Analysis
Table of Contents
1. EXECUTIVE SUMMARY .................................................................................................3 2. SCOPE OF THE TRAINING..............................................................................................3 3. FACILITIES, WORKING CONDITIONS AND PARTICIPATION.................................6 4. TRAINING STAFF .............................................................................................................6 5. CONCLUSIONS AND RECOMMENDATIONS ..............................................................7 6. ANNEX I - TRAINING SCHEDULE...............................................................................9 7. ANNEX II - TRAINEE PRESENTATIONS OF WASP-IV REFERENCE CASES FOR
INDONESIA......................................................................................................................12
Intensive Training on Generation Planning using WASP-IV
3
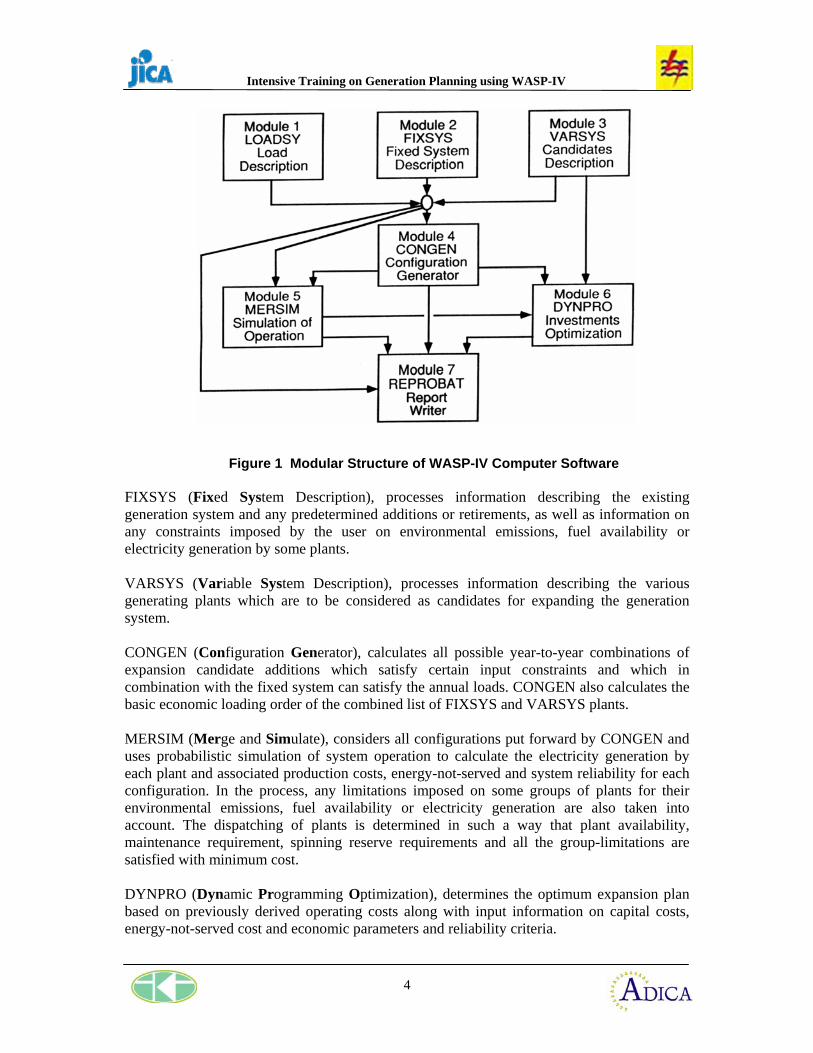
1. EXECUTIVE SUMMARY Nineteen staff of the national electricity company PT. PLN (Persero) were trained on how to apply the Wien Automatic System Planning (WASP) Package for determining the power generating system expansion plan that meets demand at minimum cost while satisfying user-specified constraints for the electricity system in Indonesia. The course participants were also guided through the development of a WASP Reference Case and several Sensitivity Analysis Cases using country specific data from Indonesia. The training was completed in accordance with the agreed schedule from 22 January until 2 February 2007. Upon completion of the training, the course staff provided the trainees a copy of the lectures presented, WASP cases developed during the course, as well as various support material to be further used for actual WASP studies and for energy planning activities in general. 2. SCOPE OF THE TRAINING Objectives of the Training The main objective of the assignment was to train PLN staff on the use of the WASP-IV software for conducting power generating system expansion planning in Indonesia. Presentation of WASP Methodology WASP is the most well-known and widely used optimization model for examining medium- to long-term expansion options for electrical generating systems. National electric power utilities and electricity regulation agencies in many countries, as well as The World Bank and other international institutions and organizations, regularly use WASP to help examine long-term generation expansion plans. Nowadays, over 90 countries and 12 international organizations use WASP. The most recent version of the software, WASP-IV, includes additional features compared to the previous version, namely the calculation of environmental emissions associated with electricity generation and the possibility of imposing development limitations related to the use of various types of fuels, the electricity generation and the environmental emissions by different power plants. These new features allow a very accurate modeling of particular constraints existent in various countries including Indonesia. The WASP methodology utilizes probabilistic simulation for estimating power generating system production costs, unserved energy costs, and reliability, linear programming technique for determining optimal dispatch policy satisfying the user-specified constraints on fuel availability, electricity generation, and environmental emissions by groups of plants, and the dynamic programming method of optimization for comparing the costs of alternative system expansion policies. The WASP computer program includes the following modules (Figure 1): LOADSY (Load System Description), processes information describing electric load for the power system over the study period.
Intensive Training on Generation Planning using WASP-IV
4
FIXSYS (Fixed System Description), processes information describing the existing generation system and any predetermined additions or retirements, as well as information on any constraints imposed by the user on environmental emissions, fuel availability or electricity generation by some plants. VARSYS (Variable System Description), processes information describing the various generating plants which are to be considered as candidates for expanding the generation system. CONGEN (Configuration Generator), calculates all possible year-to-year combinations of expansion candidate additions which satisfy certain input constraints and which in combination with the fixed system can satisfy the annual loads. CONGEN also calculates the basic economic loading order of the combined list of FIXSYS and VARSYS plants. MERSIM (Merge and Simulate), considers all configurations put forward by CONGEN and uses probabilistic simulation of system operation to calculate the electricity generation by each plant and associated production costs, energy-not-served and system reliability for each configuration. In the process, any limitations imposed on some groups of plants for their environmental emissions, fuel availability or electricity generation are also taken into account. The dispatching of plants is determined in such a way that plant availability, maintenance requirement, spinning reserve requirements and all the group-limitations are satisfied with minimum cost. DYNPRO (Dynamic Programming Optimization), determines the optimum expansion plan based on previously derived operating costs along with input information on capital costs, energy-not-served cost and economic parameters and reliability criteria.
Figure 1 Modular Structure of WASP-IV Computer Software

Intensive Training on Generation Planning using WASP-IV
5
REPROBAT (Report Writer of WASP in a Batched Environment), writes a report summarizing the total or partial results for the optimum or near optimum power system expansion plan and for fixed expansion schedules. The modular structure of WASP-IV permits the user to monitor intermediate results, avoiding waste of large amounts of computer time due to input data errors. The information from one module is passed to the subsequent modules through binary files. Each module also produces its own printable output, which can be viewed on display or printed by the user to detect input data errors.
Organization of a Two-week Training Course on WASP-IV ADICA Consulting, LLC partnered with PT Indokoei International in organizing a 2-week training course on the most recent version of the WASP software for 19 participants from PLN. The training schedule is provided in Annex I while the list of participants is given in Annex II. The training consisted of 18 lectures on the principles of power system expansion planning and use of the WASP-IV software, as well as work sessions to apply the software for analyzing six power generating systems in Indonesia. The course participants received assistance for the installation of the WASP-IV software on their own computers, creation/deletion/back-up/restoration of system expansion cases and on the use of all mod The following expansion cases were analyzed for the Indonesian power generating system:
1. Java Bali 2. Kalbar – West Kalimantan 3. Kaltim & Kalselteng – East, South and Central Kalimantan 4. Sumatera 5. Sulselrabar – South, Southeast and West Sulawesi 6. Suluttenggo – North and Central Sulawesi
For each expansion case, a team comprised of two to five trainees prepared a “Reference Case” to assess the least cost generation expansion plan during the period 2007-2026, using country specific data for the electric load and existing generating system description, as well as for expansion candidates (e.g., coal, combined cycle, geothermal, hydro). For additional expansion candidates (e.g., nuclear power) for which country specific data were not available, the technical and economic parameters provided as input data for WASP were assessed on the basis of international references. The trainees also performed “Sensitivity Analysis” to assess the influence on the optimal expansion plan of possible future changes in the main WASP-IV input parameters, e.g., Economic Information (fuel prices, investment cost, O&M cost), Economic Parameters (discount rates, escalation rates), and Level of Quality of Supply (reserve margins, LOLP constraints, and ENS cost.
Intensive Training on Generation Planning using WASP-IV
6
During the execution of this task, the course staff advised participants on how to use the WASP software in order to find the least cost expansion plans for the above-mentioned cases, and rectify problems that were encountered while running the software. ADICA provided each participant a CD containing lectures presented at the course, the input data and results of the WASP cases developed by the course participants and additional support files to be used in the future energy and electricity planning activities. 3. FACILITIES, WORKING CONDITIONS AND PARTICIPATION The training was organized at the APJ PLN office in Bogor, Indonesia, which provided an excellent venue for the course. The administrative staff from PT Indokoei and PLN did an excellent job in preparing the training facilities; were responsive to the evolving needs during the course; and provided daily logistical oversight, support and guidance. The course staff is very impressed with the performance of the course participants. The group performed exceptionally well and exhibited:
1. Strong capability and commitment to learning, 2. High level of attention throughout the course, 3. Quick understanding of new concepts, 4. Natural ability and interest to work together in discussing generation planning
concepts, sharing experience and developing best solutions, and 5. Focus on obtaining knowledge and skills necessary to provide decision-making
support for Senior Management. The leadership and support of Senior Management from PLN and JICA also contributed greatly to the success of this training event. 4. TRAINING STAFF The training was carried out by two international consultants with extensive experience in the use of the WASP software for generation expansion planning, including: Bruce Hamilton President, ADICA Consulting LLC Mr. Hamilton has an extensive background in the development of advanced computing techniques and analysis of energy systems, including the leadership he provided for energy and environmental projects conducted, in more than twenty countries, for the World Bank, USDOE, and International Atomic Energy Agency (IAEA). Mr. Hamilton's previous position was as Head of the Energy Modeling, Databanks and Capacity Building Unit at the IAEA, where he directed multi-disciplinary teams in the development of technology databases and analytical software (including WASP-IV), and conduct of technical assistance projects focused on energy sector development and environmental assessment. Mr. Hamilton
Intensive Training on Generation Planning using WASP-IV
7
organized regional projects in Africa, Asia & the South Pacific, Europe, Latin America, and West Asia to address energy/electricity planning needs of developing countries. As a course director and lecturer, he trained over 500 experts from 40 countries in the areas of demand forecasting, electricity system expansion planning, energy policy analysis and strategy development, environmental assessment, and financial analysis of energy options. In recent years, he led training and analysis activities for power sector restructuring and electricity market analysis studies in Europe, Asia and the South Pacific. Mladen Zeljko Department Head, Energy Generation and Conversion Energy Institute “Hrvoje Požar” (EIHP), Zagreb, Croatia Dr. Zeljko manages a department at EIHP that is responsible for research into problems of power system expansion, deregulation in the electricity market, system development and operation planning within a competitive environment. He is among the most experienced users of the IAEA’s WASP-IV software and is regularly recruited by the IAEA to serve as an invited expert for technical assistance missions and training courses on the use of this software. In August 2002, Mr. Zeljko joined with staff from ADICA Consulting in organizing a two-week training course on WASP-IV for Tenaga Nasional Berhad, in Malaysia. 6. CONCLUSIONS AND RECOMMENDATIONS We believe that the Intensive Training on Generation Planning using WASP-IV was successfully completed. With the trainees’ strong effort, they developed a good understanding of the WASP-IV functionality and successfully produced initial model results. However, it is necessary for the course participants to gain additional experience by following-up the training with real work in applying WASP-IV for an actual study. With the above comments in mind, we offer the following recommendations for consideration by PLN:
1. The energy planning staff in Indonesia should collect and enter into WASP improved technical, economic and environmental data for existing units and expansion candidates.
2. An Indonesian WASP Users Meeting should be organized annually. If desired, the meeting could be made open to other WASP users from the region (e.g., Malaysia, Korea).
3. Additional training should be organized for energy planning staff at PLN on the following subjects: a. Energy Demand Forecasting using the MAED software, b. Electricity System Operation and Pricing using the GTMax software, c. Environmental Analysis, and d. Energy Project Finance.

Intensive Training on Generation Planning using WASP-IV
8
We would like to thank JICA and PLN for the opportunity to collaborate in this training event. We appreciate the strong effort by the course participants, excellent working conditions, superb logistical support from Indokoei, and gracious hospitality from all. It has been a pleasure working together. We are proud of our joint success and look forward to our continued collaboration.
Sincerely yours, Bruce P. Hamilton President, ADICA Consulting LLC
Intensive Training on Generation Planning using WASP-IV
9
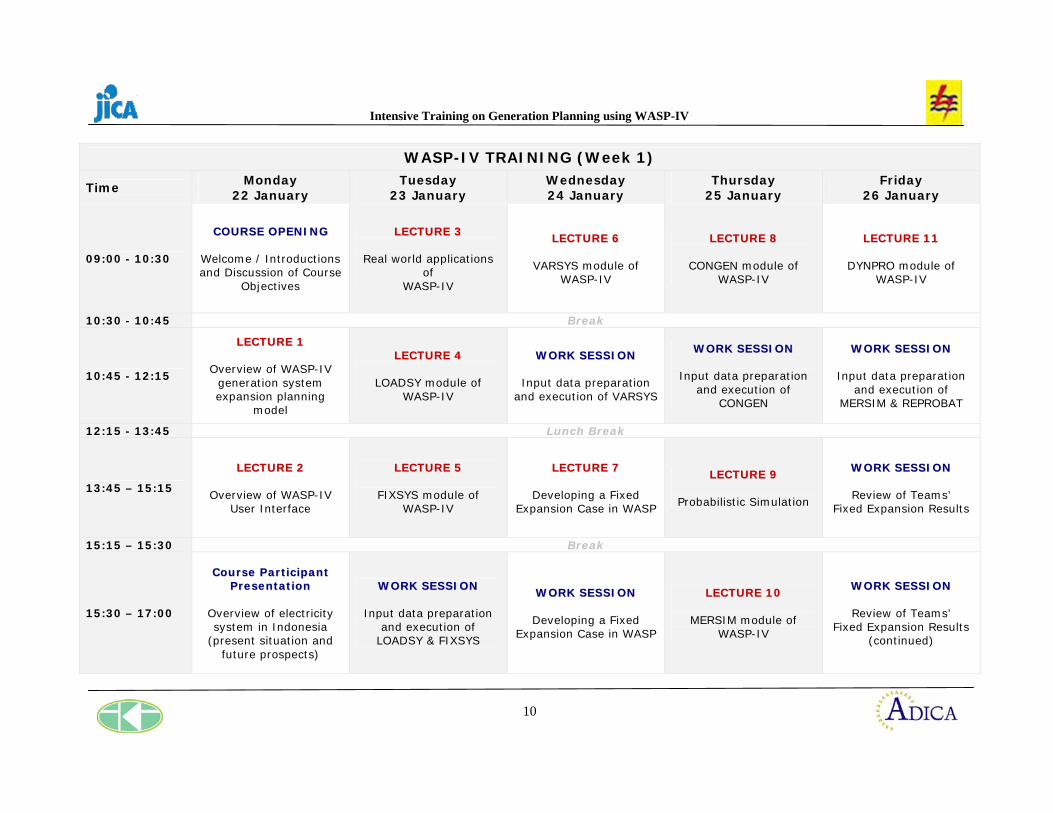
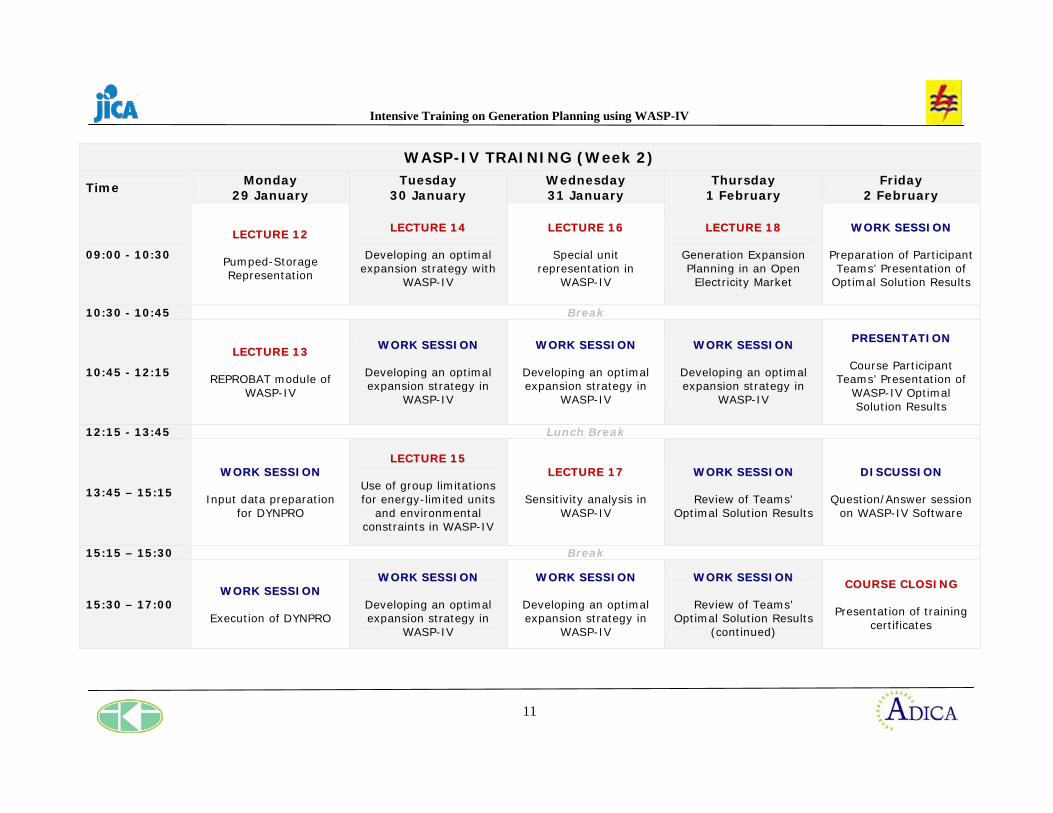
ANNEX I
Training Schedule
Intensive Training on Generation Planning using WASP-IV
10
WASP-IV TRAINING (Week 1)
Time Monday
22 January Tuesday
23 January Wednesday 24 January
Thursday 25 January
Friday 26 January
09:00 - 10:30
CCOOUURRSSEE OOPPEENNIINNGG
Welcome / Introductions and Discussion of Course
Objectives
LLEECCTTUURREE 33
Real world applications of
WASP-IV
LLEECCTTUURREE 66
VARSYS module of WASP-IV
LLEECCTTUURREE 88
CONGEN module of WASP-IV
LLEECCTTUURREE 1111
DYNPRO module of WASP-IV
10:30 - 10:45 Break
10:45 - 12:15
LLEECCTTUURREE 11
Overview of WASP-IV generation system expansion planning
model
LLEECCTTUURREE 44
LOADSY module of WASP-IV
WWOORRKK SSEESSSSIIOONN
Input data preparation and execution of VARSYS
WWOORRKK SSEESSSSIIOONN
Input data preparation and execution of
CONGEN
WWOORRKK SSEESSSSIIOONN
Input data preparation and execution of
MERSIM & REPROBAT
12:15 - 13:45 Lunch Break
13:45 – 15:15
LLEECCTTUURREE 22
Overview of WASP-IV User Interface
LLEECCTTUURREE 55
FIXSYS module of WASP-IV
LLEECCTTUURREE 77
Developing a Fixed Expansion Case in WASP
LLEECCTTUURREE 99
Probabilistic Simulation
WWOORRKK SSEESSSSIIOONN
Review of Teams’ Fixed Expansion Results
15:15 – 15:30 Break
15:30 – 17:00
CCoouurrssee PPaarrttiicciippaanntt PPrreesseennttaattiioonn
Overview of electricity system in Indonesia
(present situation and future prospects)
WWOORRKK SSEESSSSIIOONN
Input data preparation and execution of
LOADSY & FIXSYS
WWOORRKK SSEESSSSIIOONN
Developing a Fixed Expansion Case in WASP
LLEECCTTUURREE 1100
MERSIM module of WASP-IV
WWOORRKK SSEESSSSIIOONN
Review of Teams’ Fixed Expansion Results
(continued)
Intensive Training on Generation Planning using WASP-IV
11
WASP-IV TRAINING (Week 2)
Time Monday
29 January Tuesday
30 January Wednesday 31 January
Thursday 1 February
Friday 2 February
09:00 - 10:30
LLEECCTTUURREE 1122
Pumped-Storage Representation
LLEECCTTUURREE 1144
Developing an optimal expansion strategy with
WASP-IV
LLEECCTTUURREE 1166
Special unit representation in
WASP-IV
LLEECCTTUURREE 1188
Generation Expansion Planning in an Open
Electricity Market
WWOORRKK SSEESSSSIIOONN
Preparation of Participant Teams’ Presentation of
Optimal Solution Results
10:30 - 10:45 Break
10:45 - 12:15
LLEECCTTUURREE 1133
REPROBAT module of WASP-IV
WWOORRKK SSEESSSSIIOONN
Developing an optimal expansion strategy in
WASP-IV
WWOORRKK SSEESSSSIIOONN
Developing an optimal expansion strategy in
WASP-IV
WWOORRKK SSEESSSSIIOONN
Developing an optimal expansion strategy in
WASP-IV
PPRREESSEENNTTAATTIIOONN
Course Participant Teams’ Presentation of
WASP-IV Optimal Solution Results
12:15 - 13:45 Lunch Break
13:45 – 15:15
WWOORRKK SSEESSSSIIOONN
Input data preparation for DYNPRO
LLEECCTTUURREE 1155
Use of group limitations for energy-limited units
and environmental constraints in WASP-IV
LLEECCTTUURREE 1177
Sensitivity analysis in WASP-IV
WWOORRKK SSEESSSSIIOONN
Review of Teams’ Optimal Solution Results
DDIISSCCUUSSSSIIOONN
Question/Answer session on WASP-IV Software
15:15 – 15:30 Break
15:30 – 17:00 WWOORRKK SSEESSSSIIOONN
Execution of DYNPRO
WWOORRKK SSEESSSSIIOONN
Developing an optimal expansion strategy in
WASP-IV
WWOORRKK SSEESSSSIIOONN
Developing an optimal expansion strategy in
WASP-IV
WWOORRKK SSEESSSSIIOONN
Review of Teams’ Optimal Solution Results
(continued)
CCOOUURRSSEE CCLLOOSSIINNGG
Presentation of training certificates

Intensive Training on Generation Planning using WASP-IV
12
ANNEX II
Trainee Presentations of WASP-IV
Reference Cases for Indonesia
1
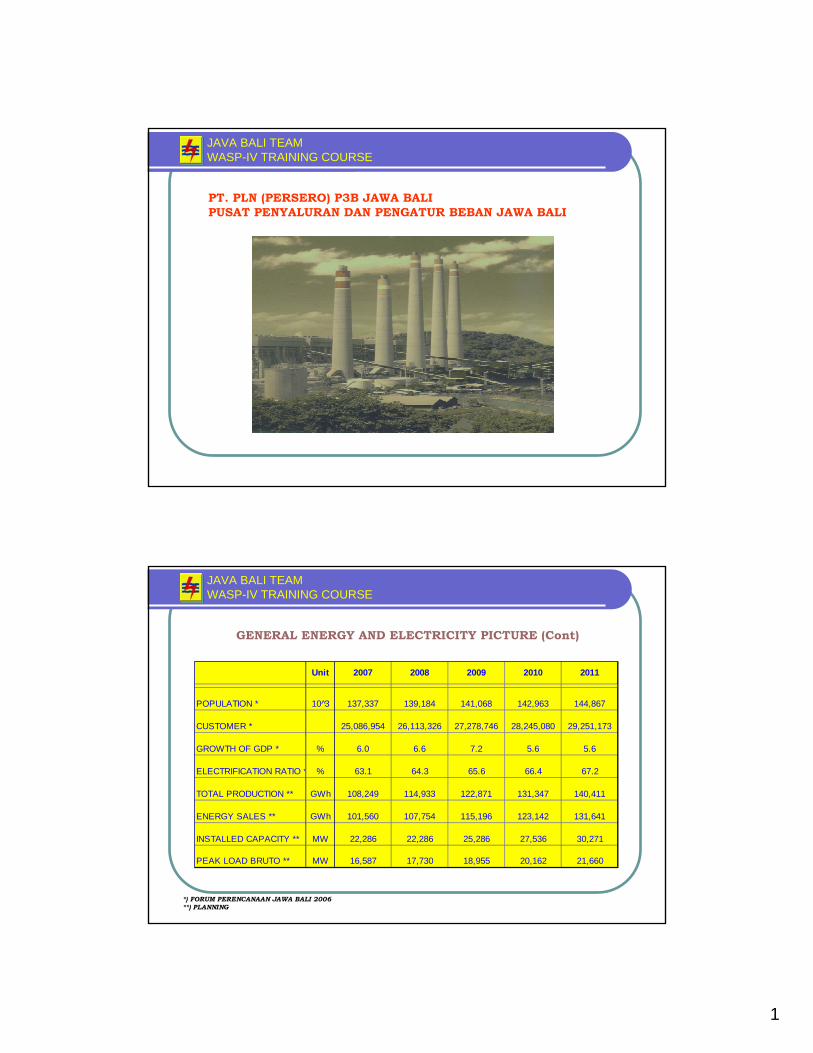
JAVA BALI TEAM WASP-IV TRAINING COURSE
PT. PLN (PERSERO) P3B JAWA BALIPUSAT PENYALURAN DAN PENGATUR BEBAN JAWA BALI
JAVA BALI TEAM WASP-IV TRAINING COURSE
Unit 2007 2008 2009 2010 2011
POPULATION * 10 3̂ 137,337 139,184 141,068 142,963 144,867
CUSTOMER * 25,086,954 26,113,326 27,278,746 28,245,080 29,251,173
GROWTH OF GDP * % 6.0 6.6 7.2 5.6 5.6
ELECTRIFICATION RATIO * % 63.1 64.3 65.6 66.4 67.2
TOTAL PRODUCTION ** GWh 108,249 114,933 122,871 131,347 140,411
ENERGY SALES ** GWh 101,560 107,754 115,196 123,142 131,641
INSTALLED CAPACITY ** MW 22,286 22,286 25,286 27,536 30,271
PEAK LOAD BRUTO ** MW 16,587 17,730 18,955 20,162 21,660
*) FORUM PERENCANAAN JAWA BALI 2006**) PLANNING
GENERAL ENERGY AND ELECTRICITY PICTURE (Cont)

2
JAVA BALI TEAM WASP-IV TRAINING COURSE
Resources of Natural Gas and CoalResources of Natural Gas and Coal
Irian Jaya
Singapore
Medan
Surabaya
Malaysia
Kalimantan 53.813.2
3.73.2
Proven and Probable Gas Reserves (2P)(in trillion cubic feet)
12.1
0.4
26.9
Pipelines Under Development
Existing Pipelines
Planned Projects
Existing MarketTarget Market
Jakarta
61.2
3.6
178 Coal Resources
JAVA BALI TEAM WASP-IV TRAINING COURSE
Hydro PP
SURALAYACILEGON
M.TAWAR
GANDULCIBATU
CIBINONG
CIRATA
SAGULING
DEPOK
BEKASICAWANG
TASIKMALAYA
BANDUNGSELATAN
MANDIRANCAN
UNGARAN
T.JATI
PEDAN
KEDIRIPAITON
GRATI
KRIAN
GRESIK
KEMBANGAN
GLNUKPMRON
BTRTI
KAPAL
NGARA
ANTRI GNYAR
AMPLA
NSDUA
GTENG
STBDO
BWNGI
BDWSO
JMBERTNGUL
LMJNG
GNDING
PBLGO
PAKIS
WLNGIKKTES
KBAGN
BNGIL
BNGIL
SKLNG
KBAGN
BNRAN
GLTMR
BKLAN
SPANG
PMKSN
SMNEP
LNGAN
NGBNG
MKRTO
NGOROKTSNO
SBLTN
TUBAN
BABAT
DWIMA
BJGRO
NGAWI
MNRJO
RBANG
BLORA
CEPU
SRGEN
PWRDI
KDMBO
PATIJPARA
KUDUSTBROKKRPYKWLERI
KLNGU
GRUNG
DIENG
WSOBO
WALIN
PWRJO
WATES
BNTUL
SMANU
MDARIKNTUG
WNGIRI
WNSRI
PALURJAJAR
MJNGO
KBSENBRBES
KBSEN
RWALO
CLCAP
GBONG
KBMEN
MRICA
MNANGBNJARCAMIS
JTBRGHRGLS
SRAGI
SKMDIINDMY
SBANGPWKTACKPAY
PBRAN
GARUT
DRJAT
CKSKA
RCKEK
KMJNG
CGRLG
UBRNG
PDLRGDAGO
KSBRU
RGDLK
KNGAN
BBKAN
MLBNG
ARJWN
PMPEK
SMDRASNTSA
CNJUR
LBSTUPRATU
UBRUG
SALAK
BGBRUBUNAR
RKBTGMENES
TNAGA
BLRJA
P
P
PP
P
TLGNG
TLGNG
TUREN
PBIAN
UBUD
CLGONGU
GU GUMKRNG PRIOK
GU
GU
MRGEN
MSPTI
PLOSO
PCTAN
NGJUK
SMANMDLAN
SLRJO
.
Muarakarang1150 MW
Tj Priok900 MW
Cirata1000 MW
Saguling700 MW
Paiton3200 MW
Grati800 MW
Semarang1300 MW
Gresik2000 MW
TjJati B1320 MW
Cilacap600 MW
Cilegon740 MW
SPP coal-firedCC gas-firedCC oil-fired
500 kV, 39 lines, 3578 kms150 kV 664 lines, 12204 kms70 kV 199 lines, 3604 kms
ENERGY SUPPLIESON JAWA BALI SYSTEM 2006
Installed capacity thermal 19.590 MWInstalled capacity hydro 2.536 MW Installed capacity 22.126 MW

3
JAVA BALI TEAM WASP-IV TRAINING COURSE
REALISATION AND PLANNING ON POWER PLANT KOMPOSITION 1998 - 2011
0%
20%
40%
60%
80%
100%
1998 1999 2000 2001 2002 2003 2004 2005 2006 2007 2008 2009 2010 2011
RencanaRealisasi
Air Panas Bumi Batu Bara Gas Minyak
JAVA BALI TEAM WASP-IV TRAINING COURSE
Capacity Balance 2007 - 2011
ITEM 2007 2008 2009 2010 2011
Installed Capacity (MW) 22126 22236 22236 26736 30486
Additional Capacity (MW) 110 0 4500 3750 2735
Total Installed Capacity (MW) 22236 22236 26736 30486 33221
Beban Puncak (MW) 16587 17730 18955 20262 21660
Peak Load Growth % 4.0 6.9 6.9 6.9 6.9
Reserve Margin % 34 25 41 50 53
Load Factor % 75.3 74.5 74.0 74.0 74.0
Production (GWh) 108249 114933 122871 131346 140412
Production Growth % 2.9 6.2 6.9 6.9 6.9
1) 2) 3) 4)
Sumber : Buku PASA 2007-2011
4
JAVA BALI TEAM WASP-IV TRAINING COURSE
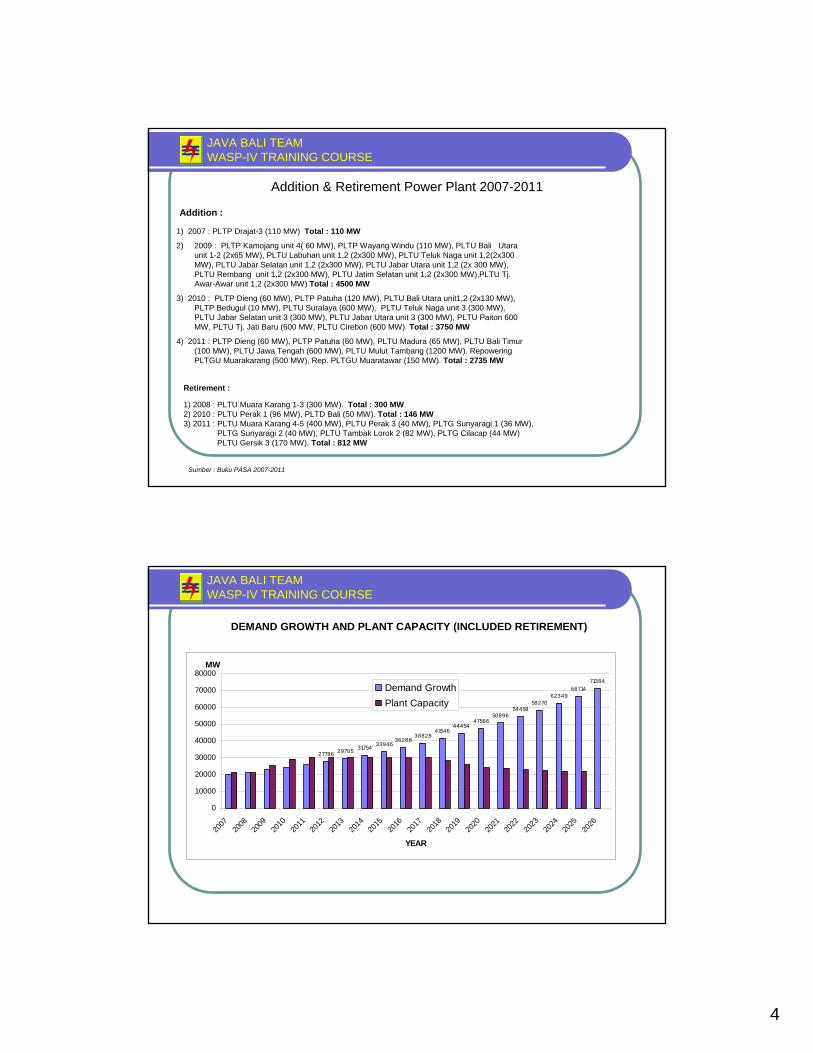
1) 2007 : PLTP Drajat-3 (110 MW) Total : 110 MW
2) 2009 : PLTP Kamojang unit 4( 60 MW), PLTP Wayang Windu (110 MW), PLTU Bali Utara unit 1-2 (2x65 MW), PLTU Labuhan unit 1,2 (2x300 MW), PLTU Teluk Naga unit 1,2(2x300 MW), PLTU Jabar Selatan unit 1,2 (2x300 MW), PLTU Jabar Utara unit 1,2 (2x 300 MW), PLTU Rembang unit 1,2 (2x300 MW), PLTU Jatim Selatan unit 1,2 (2x300 MW),PLTU Tj. Awar-Awar unit 1,2 (2x300 MW) Total : 4500 MW
3) 2010 : PLTP Dieng (60 MW), PLTP Patuha (120 MW), PLTU Bali Utara unit1,2 (2x130 MW), PLTP Bedugul (10 MW), PLTU Suralaya (600 MW), PLTU Teluk Naga unit 3 (300 MW), PLTU Jabar Selatan unit 3 (300 MW), PLTU Jabar Utara unit 3 (300 MW), PLTU Paiton 600 MW, PLTU Tj. Jati Baru (600 MW, PLTU Cirebon (600 MW). Total : 3750 MW
4) 2011 : PLTP Dieng (60 MW), PLTP Patuha (60 MW), PLTU Madura (65 MW), PLTU Bali Timur(100 MW), PLTU Jawa Tengah (600 MW), PLTU Mulut Tambang (1200 MW). RepoweringPLTGU Muarakarang (500 MW), Rep. PLTGU Muaratawar (150 MW). Total : 2735 MW
Addition & Retirement Power Plant 2007-2011
Sumber : Buku PASA 2007-2011
Addition :
Retirement :
1) 2008 : PLTU Muara Karang 1-3 (300 MW). Total : 300 MW2) 2010 : PLTU Perak 1 (96 MW), PLTD Bali (50 MW). Total : 146 MW3) 2011 : PLTU Muara Karang 4-5 (400 MW), PLTU Perak 3 (40 MW), PLTG Sunyaragi 1 (36 MW),
PLTG Sunyaragi 2 (40 MW), PLTU Tambak Lorok 2 (82 MW), PLTG Cilacap (44 MW)PLTU Gersik 3 (170 MW). Total : 812 MW
JAVA BALI TEAM WASP-IV TRAINING COURSE
27786 29705 31754 3394636288
3882841546
4445447566
5089654458
5827062349
6671471384
0
10000
20000
30000
40000
50000
60000
70000
80000
2007
2008
2009
2010
2011
2012
2013
2014
2015
2016
2017
2018
2019
2020
2021
2022
2023
2024
2025
2026
YEAR
MW
Demand GrowthPlant Capacity
DEMAND GROWTH AND PLANT CAPACITY (INCLUDED RETIREMENT)

5
JAVA BALI TEAM WASP-IV TRAINING COURSE
Future Options for Electricity Supply
MW MW Base LoadAverage
Incremental
Domestic Foreign
1 C6H 0 300 600 2510 2389 667 0 0 5 7 422 LNG 0 375 750 1911 1744 0 1984 2 7 7 423 N10H 0 1000 1000 2606 2606 0 239 6 0 7 284 G150 0 75 150 3150 2625 2743 0 4 10 7 285 PUMP 0 250 500
Days Schedule
Maintenance MW
CapacityHeat Rates Fuel Costs
Spinning Reserveas
FORKcal/kWh Cents/Million Kcal Fuel Type
No. NameNo. of
Sets
Min. Load
Scenario Assumption1. Variable Expansion (Pump Storage 2 X 500 MW Fixed in 2013 and 2014)2. Variable Expansion (Pump Storage in VARSYS)3. Variable Expansion (Pump Storage in VARSYS and Coal Limitted Up To 40 Units)
JAVA BALI TEAM WASP-IV TRAINING COURSE
Scenario Assumption1. Loads Demand in Bruto (Net Load Demand + Aux Plant+Losses)2. Load Growth 6.9% from 2007 to 20263. No Change in LDC (No Demand side management )4. Availability for Energy Resources (Coal, LNG, Oil, Nuclear)
Scenarios1. Variable Expansion (Pump Storage 2 X 500 MW Fixed in 2013 and 2014)2. Variable Expansion (Pump Storage in VARSYS)3. Variable Expansion (Pump Storage in VARSYS and Coal Limitted Up To 40 Units)
6
JAVA BALI TEAM WASP-IV TRAINING COURSE
PU0
0.1
0.2
0.3
0.4
0.5
0.6
0.7
0.8
0.9
1
0.0 0.1 0.2 0.3 0.4 0.5 0.6 0.7 0.8 0.9 1.0
PU
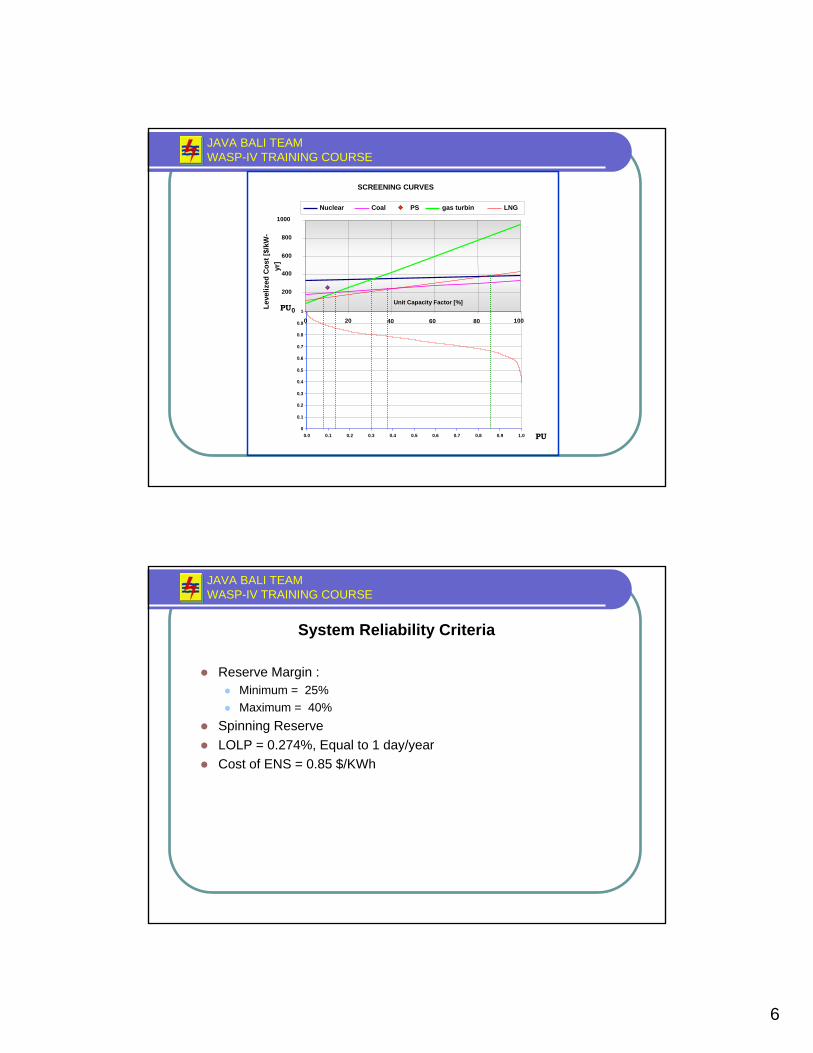
SCREENING CURVES
0
200
400
600
800
1000
0 20 40 60 80 100
Unit Capacity Factor [%]Leve
lized
Cos
t [$/
kW-
yr]
Nuclear Coal PS gas turbin LNG
JAVA BALI TEAM WASP-IV TRAINING COURSE
System Reliability Criteria
Reserve Margin :Minimum = 25% Maximum = 40%
Spinning ReserveLOLP = 0.274%, Equal to 1 day/yearCost of ENS = 0.85 $/KWh
7
JAVA BALI TEAM WASP-IV TRAINING COURSE
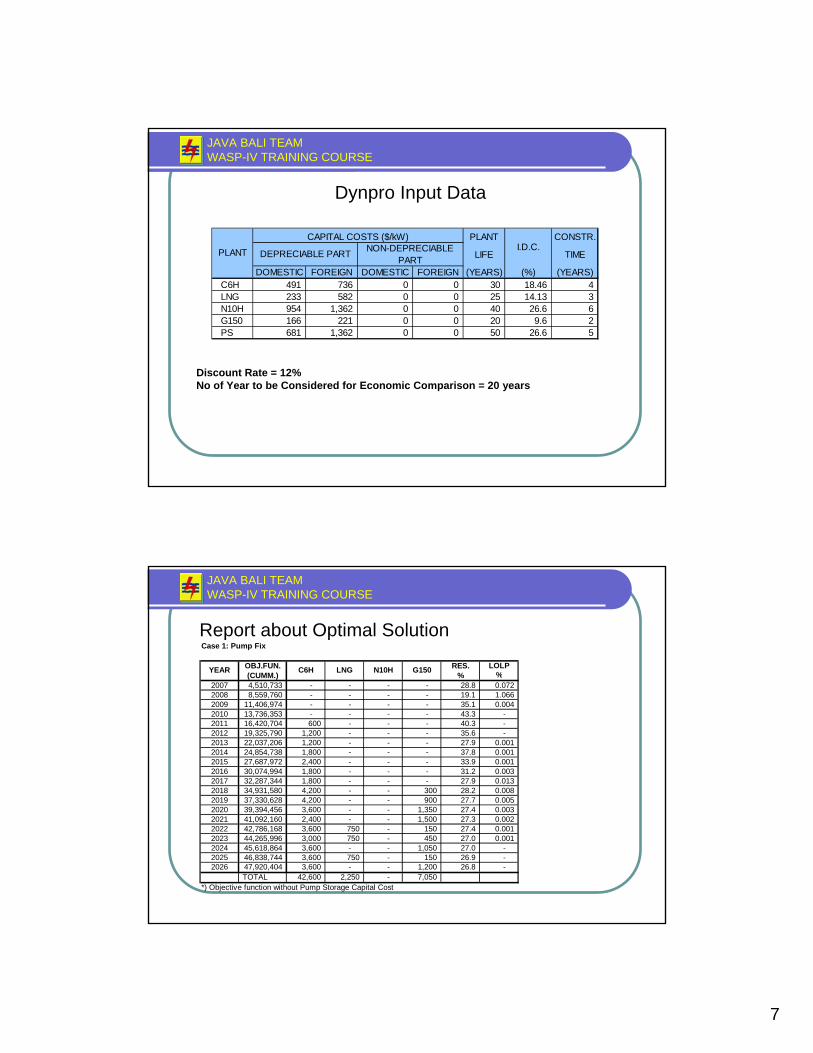
Dynpro Input Data
PLANT CONSTR.
LIFE TIME
DOMESTIC FOREIGN DOMESTIC FOREIGN (YEARS) (%) (YEARS)C6H 491 736 0 0 30 18.46 4LNG 233 582 0 0 25 14.13 3N10H 954 1,362 0 0 40 26.6 6G150 166 221 0 0 20 9.6 2PS 681 1,362 0 0 50 26.6 5
CAPITAL COSTS ($/kW)
DEPRECIABLE PART NON-DEPRECIABLE PART
I.D.C.PLANT
Discount Rate = 12%No of Year to be Considered for Economic Comparison = 20 years
JAVA BALI TEAM WASP-IV TRAINING COURSE
Report about Optimal SolutionCase 1: Pump Fix
OBJ.FUN. RES. LOLP(CUMM.) % %
2007 4,510,733 - - - - 28.8 0.072 2008 8,559,760 - - - - 19.1 1.066 2009 11,406,974 - - - - 35.1 0.004 2010 13,736,353 - - - - 43.3 - 2011 16,420,704 600 - - - 40.3 - 2012 19,325,790 1,200 - - - 35.6 - 2013 22,037,206 1,200 - - - 27.9 0.001 2014 24,854,738 1,800 - - - 37.8 0.001 2015 27,687,972 2,400 - - - 33.9 0.001 2016 30,074,994 1,800 - - - 31.2 0.003 2017 32,287,344 1,800 - - - 27.9 0.013 2018 34,931,580 4,200 - - 300 28.2 0.008 2019 37,330,628 4,200 - - 900 27.7 0.005 2020 39,394,456 3,600 - - 1,350 27.4 0.003 2021 41,092,160 2,400 - - 1,500 27.3 0.002 2022 42,786,168 3,600 750 - 150 27.4 0.001 2023 44,265,996 3,000 750 - 450 27.0 0.001 2024 45,618,864 3,600 - - 1,050 27.0 - 2025 46,838,744 3,600 750 - 150 26.9 - 2026 47,920,404 3,600 - - 1,200 26.8 -
TOTAL 42,600 2,250 - 7,050 *) Objective function without Pump Storage Capital Cost
YEAR C6H LNG N10H G150

8
JAVA BALI TEAM WASP-IV TRAINING COURSE
Case 2: Pump Var Free Optimization
OBJ.FUN. RES. LOLP(CUMM.) % %
2007 4,513,270 - - - - - 28.8 0.074 2008 8,559,675 - - - - - 19.1 1.077 2009 11,405,314 - - - - - 35.1 0.004 2010 13,737,286 - - - - - 43.3 - 2011 16,421,868 600 - - - - 43.1 - 2012 19,328,064 1,200 - - - - 38.2 - 2013 22,043,950 1,200 - - - - 33.2 0.003 2014 25,118,910 2,400 - - - - 32.1 0.004 2015 27,926,160 2,400 - - - - 30.7 0.004 2016 30,292,732 1,800 - - - - 28.2 0.011 2017 32,650,432 2,400 - - - - 27.0 0.014 2018 35,258,524 4,200 - - 150 - 26.5 0.012 2019 37,646,488 4,200 - - 900 - 26.5 0.007 2020 39,684,156 3,000 750 - 1,200 - 26.3 0.004 2021 41,418,972 2,400 750 - 750 - 26.2 0.003 2022 43,063,036 3,000 750 - 600 - 26.0 0.002 2023 44,559,724 3,600 - - 750 - 26.1 0.001 2024 45,865,400 2,400 - - 2,100 - 25.8 0.001 2025 47,091,860 3,600 750 - 150 - 25.8 - 2026 48,189,652 4,800 - - - - 25.8 -
TOTAL 43,200 3,000 - 6,600 -
YEAR C6H PUMPG150LNG N10H
Report about Optimal Solution (Cont)
JAVA BALI TEAM WASP-IV TRAINING COURSE
Report about Optimal Solution (Cont)Case 3: Pump Var Coal Limit
OBJ.FUN. RES. LOLP(CUMM.) % %
2007 4,513,270 - - - - - 28.8 0.074 2008 8,559,675 - - - - - 19.1 1.077 2009 11,405,314 - - - - - 35.1 0.004 2010 13,737,286 - - - - - 43.3 - 2011 16,421,868 600 - - - - 43.1 - 2012 19,328,064 1,200 - - - - 38.2 - 2013 22,043,950 1,200 - - - - 33.2 0.003 2014 25,118,910 2,400 - - - - 32.1 0.004 2015 27,926,160 2,400 - - - - 30.7 0.004 2016 30,292,732 1,800 - - - - 28.2 0.011 2017 32,650,432 2,400 - - - - 27.0 0.014 2018 35,258,524 4,200 - - 150 - 26.5 0.012 2019 37,646,488 4,200 - - 900 - 26.5 0.007 2020 39,684,156 3,000 750 - 1,200 - 26.3 0.004 2021 41,336,288 600 2,250 - 1,050 - 26.2 0.003 2022 43,245,252 - 750 3,000 600 - 26.0 0.002 2023 44,750,828 - 3,000 1,000 300 - 26.0 0.002 2024 46,150,204 - 750 2,000 1,800 - 25.8 0.001 2025 47,357,132 - 3,750 - 750 - 25.8 0.001 2026 48,507,652 - 1,500 3,000 300 - 25.8 -
TOTAL 24,000 12,750 9,000 7,050 -
YEAR C6H LNG N10H G150 PUMP
9
JAVA BALI TEAM WASP-IV TRAINING COURSE
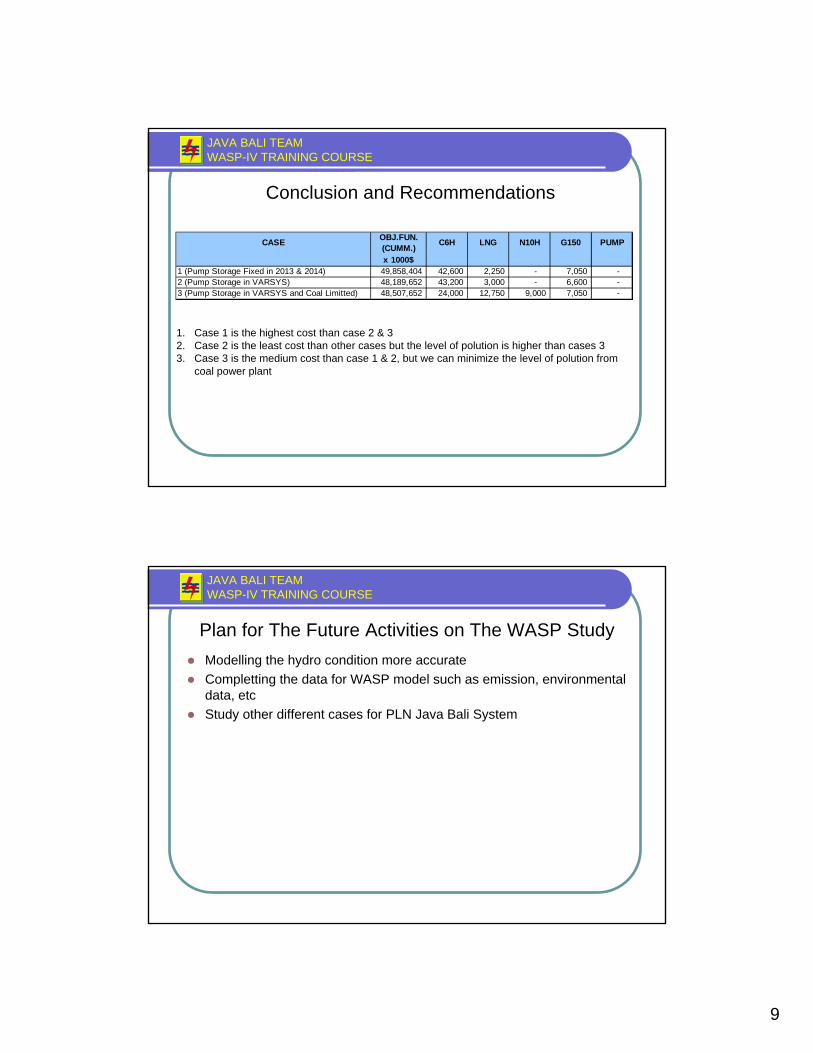
Conclusion and Recommendations
OBJ.FUN.(CUMM.)x 1000$
1 (Pump Storage Fixed in 2013 & 2014) 49,858,404 42,600 2,250 - 7,050 - 2 (Pump Storage in VARSYS) 48,189,652 43,200 3,000 - 6,600 - 3 (Pump Storage in VARSYS and Coal Limitted) 48,507,652 24,000 12,750 9,000 7,050 -
G150 PUMPCASE C6H LNG N10H
1. Case 1 is the highest cost than case 2 & 32. Case 2 is the least cost than other cases but the level of polution is higher than cases 33. Case 3 is the medium cost than case 1 & 2, but we can minimize the level of polution from
coal power plant
JAVA BALI TEAM WASP-IV TRAINING COURSE
Plan for The Future Activities on The WASP StudyModelling the hydro condition more accurateCompletting the data for WASP model such as emission, environmental data, etcStudy other different cases for PLN Java Bali System

10
JAVA BALI TEAM WASP-IV TRAINING COURSE
*) FORUM PERENCANAAN JAWA BALI 2006**) REALISASI
Unit 2002 2003 2004 2005 2006
POPULATION * 10 3̂ 126,580 129,207 131,783 133,618 135,519
CUSTOMER * 21,086,702 21,840,468 22,531,579 23,369,514 24,187,332
GROWTH OF GDP * % 2.7 3.8 4.5 5.0 5.5
ELECTRIFICATION RATIO * % 60.6 61.4 62.2 63.2 62.2
TOTAL PRODUCTION ** GWh 86,608 89,976 95,993 101,552 105,222
ENERGY SALES ** GWh 69,960 72,190 79,333 85,492 98,720
INSTALLED CAPACITY ** MW 18,096 18,608 19,466 19,466 22,126
PEAK LOAD BRUTO ** MW 13,780 14,172 14,920 15,352 15,954
GENERAL ENERGY AND ELECTRICITY PICTURE
JAVA BALI TEAM WASP-IV TRAINING COURSE
1
www.plnkalbar.co.idwww.pln.co.id
Electricity For A Better Life
Electricity for Better Life
GENERATION EXPANSION GENERATION EXPANSION PLANNING OF WEST PLANNING OF WEST
KALIMANTANKALIMANTAN
By Team 3 :
IRA SAVITRI
ISMAIL DEU
PURWANTO
FINAL PRESENTATION OF WASP IV
WEST KALIMANTANTEAM 3
Electricity For
A Better LifeGeneral Energy & Electricity Picture-(1)
Data
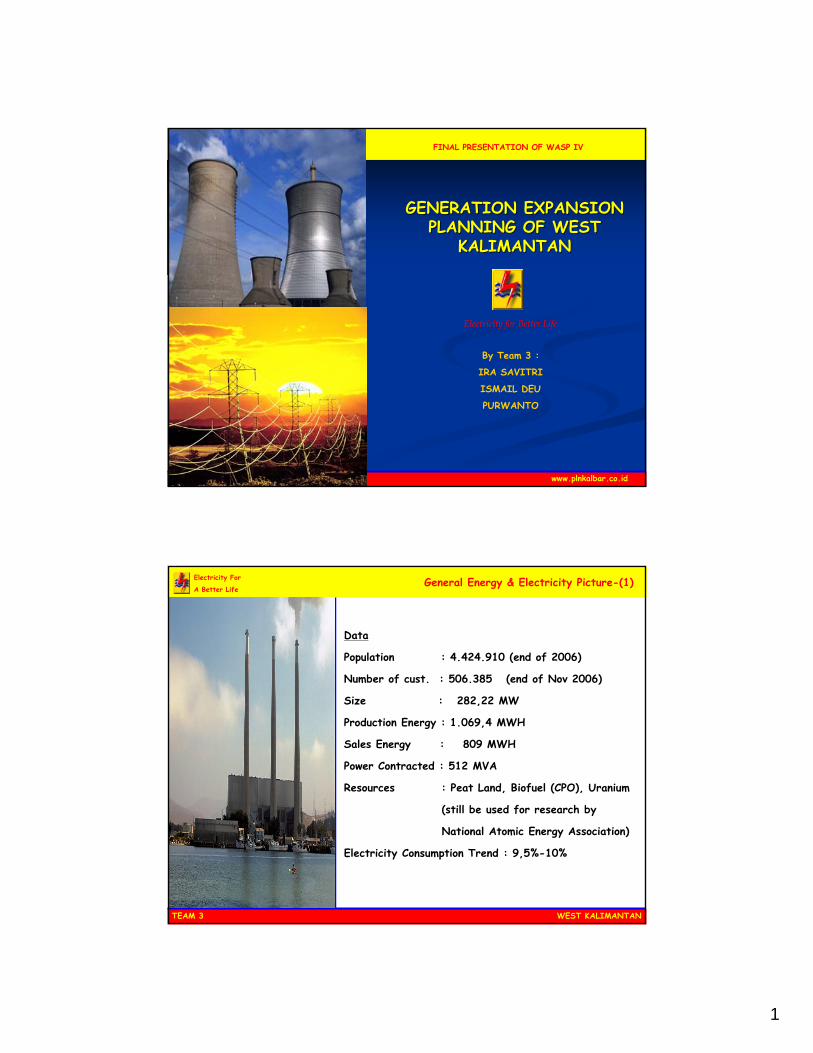
Population : 4.424.910 (end of 2006)
Number of cust. : 506.385 (end of Nov 2006)
Size : 282,22 MW
Production Energy : 1.069,4 MWH
Sales Energy : 809 MWH
Power Contracted : 512 MVA
Resources : Peat Land, Biofuel (CPO), Uranium
(still be used for research by
National Atomic Energy Association)
Electricity Consumption Trend : 9,5%-10%

2
WEST KALIMANTANTEAM 3
Electricity For
A Better LifeGeneral Energy & Electricity Picture-(2)
System
WEST KALIMANTANTEAM 3
Electricity For
A Better Life
Main assumption regarding to demand growth :
GDP Growth rate : 6,5% -8,0%
Population Growth : 1,1%-1,63%
Electrification Ratio : 52,13 (end 2006),
expectation 65% (end of 2010)
Projections of Future Electricity Requirements
3
WEST KALIMANTANTEAM 3
Electricity For
A Better Life
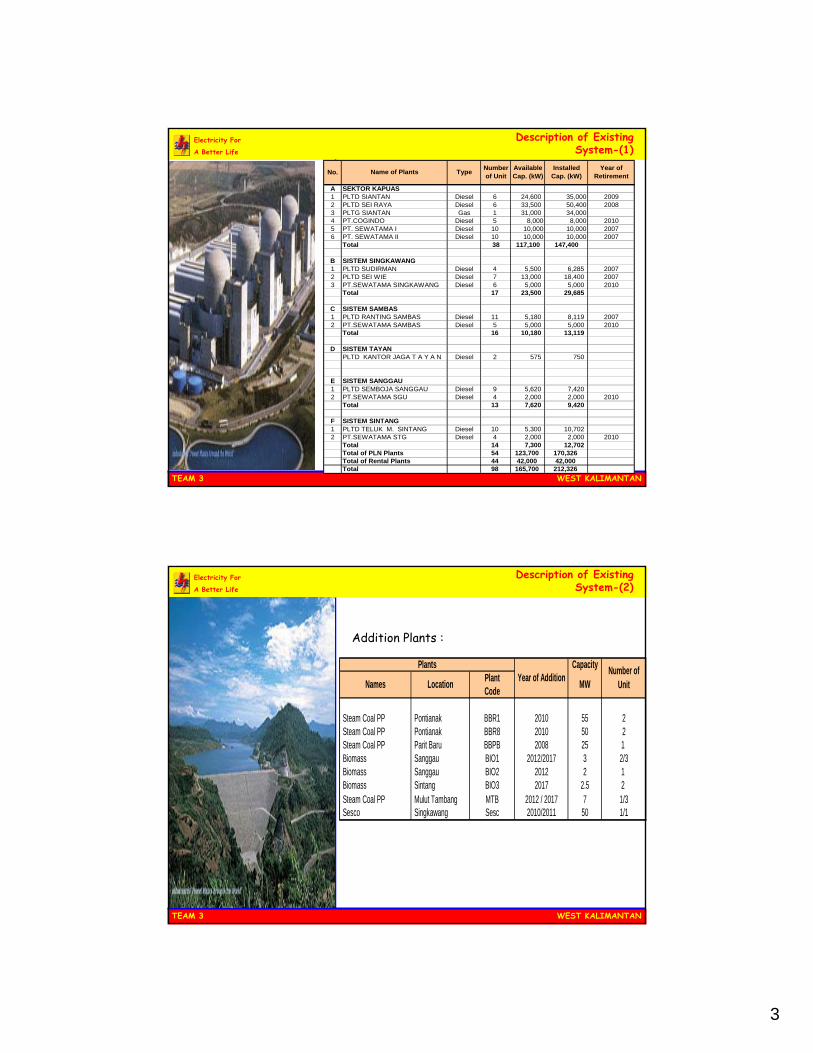
Description of Existing System-(1)
No.
A SEKTOR KAPUAS1 PLTD SIANTAN Diesel 6 24,600 35,000 20092 PLTD SEI RAYA Diesel 6 33,500 50,400 20083 PLTG SIANTAN Gas 1 31,000 34,0004 PT.COGINDO Diesel 5 8,000 8,000 20105 PT. SEWATAMA I Diesel 10 10,000 10,000 20076 PT. SEWATAMA II Diesel 10 10,000 10,000 2007
Total 38 117,100 147,400
B SISTEM SINGKAWANG1 PLTD SUDIRMAN Diesel 4 5,500 6,285 20072 PLTD SEI WIE Diesel 7 13,000 18,400 20073 PT.SEWATAMA SINGKAWANG Diesel 6 5,000 5,000 2010
Total 17 23,500 29,685
C SISTEM SAMBAS1 PLTD RANTING SAMBAS Diesel 11 5,180 8,119 20072 PT.SEWATAMA SAMBAS Diesel 5 5,000 5,000 2010
Total 16 10,180 13,119
D SISTEM TAYANPLTD KANTOR JAGA T A Y A N Diesel 2 575 750
E SISTEM SANGGAU1 PLTD SEMBOJA SANGGAU Diesel 9 5,620 7,4202 PT.SEWATAMA SGU Diesel 4 2,000 2,000 2010
Total 13 7,620 9,420
F SISTEM SINTANG1 PLTD TELUK M. SINTANG Diesel 10 5,300 10,7022 PT.SEWATAMA STG Diesel 4 2,000 2,000 2010
Total 14 7,300 12,702Total of PLN Plants 54 123,700 170,326Total of Rental Plants 44 42,000 42,000Total 98 165,700 212,326
Year of RetirementType Number
of UnitInstalled
Cap. (kW)Available Cap. (kW)Name of Plants
WEST KALIMANTANTEAM 3
Electricity For
A Better Life
Addition Plants :
Description of Existing System-(2)
CapacityPlantCode
Steam Coal PP Pontianak BBR1 2010 55 2Steam Coal PP Pontianak BBR8 2010 50 2Steam Coal PP Parit Baru BBPB 2008 25 1Biomass Sanggau BIO1 2012/2017 3 2/3Biomass Sanggau BIO2 2012 2 1Biomass Sintang BIO3 2017 2.5 2Steam Coal PP Mulut Tambang MTB 2012 / 2017 7 1/3Sesco Singkawang Sesc 2010/2011 50 1/1
Plants
LocationNames MWYear of Addition Number of Unit
4
WEST KALIMANTANTEAM 3
Electricity For
A Better Life
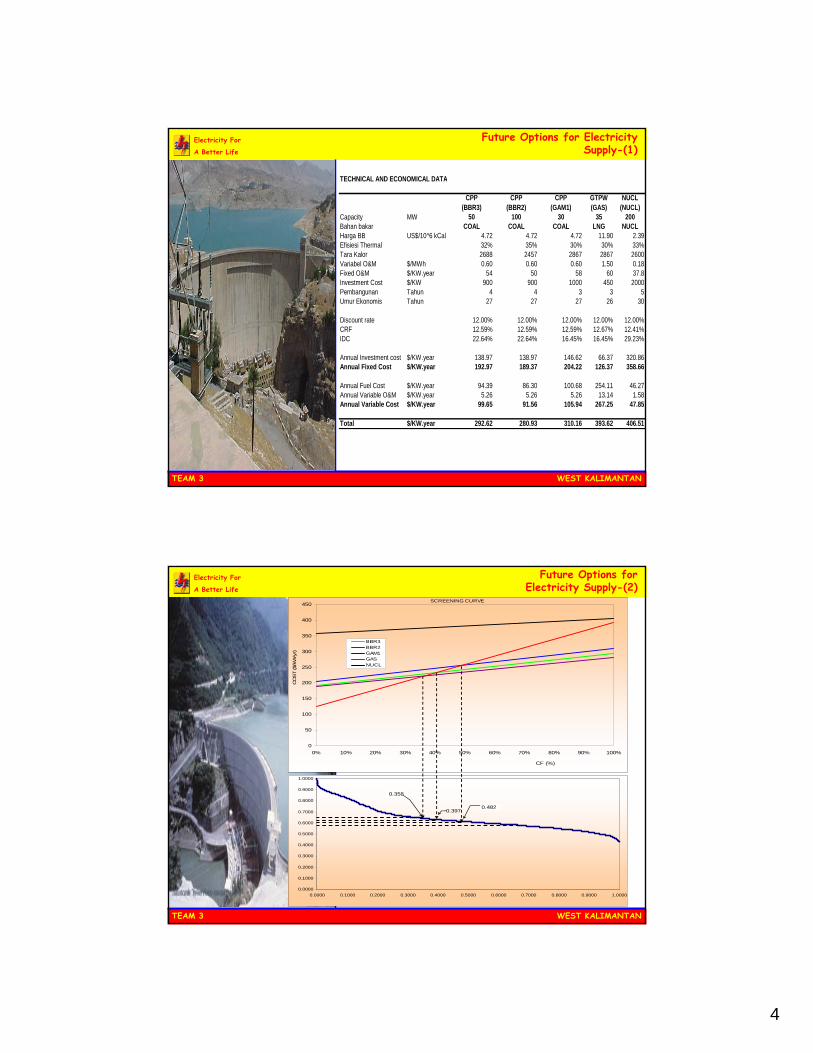
Future Options for Electricity Supply-(1)
TECHNICAL AND ECONOMICAL DATA
CPP(BBR3)
CPP(BBR2)
CPP(GAM1)
GTPW(GAS)
NUCL(NUCL)
Capacity MW 50 100 30 35 200Bahan bakar COAL COAL COAL LNG NUCLHarga BB US$/10^6 kCal 4.72 4.72 4.72 11.90 2.39Efisiesi Thermal 32% 35% 30% 30% 33%Tara Kalor 2688 2457 2867 2867 2600Variabel O&M $/MWh 0.60 0.60 0.60 1.50 0.18Fixed O&M $/KW.year 54 50 58 60 37.8Investment Cost $/KW 900 900 1000 450 2000Pembangunan Tahun 4 4 3 3 5Umur Ekonomis Tahun 27 27 27 26 30
Discount rate 12.00% 12.00% 12.00% 12.00% 12.00%CRF 12.59% 12.59% 12.59% 12.67% 12.41%IDC 22.64% 22.64% 16.45% 16.45% 29.23%
Annual Investment cost $/KW.year 138.97 138.97 146.62 66.37 320.86Annual Fixed Cost $/KW.year 192.97 189.37 204.22 126.37 358.66
Annual Fuel Cost $/KW.year 94.39 86.30 100.68 254.11 46.27Annual Variable O&M $/KW.year 5.26 5.26 5.26 13.14 1.58Annual Variable Cost $/KW.year 99.65 91.56 105.94 267.25 47.85
Total $/KW.year 292.62 280.93 310.16 393.62 406.51
WEST KALIMANTANTEAM 3
Electricity For
A Better Life
Future Options for Electricity Supply-(2)
SCREENING CURVE
0
50
100
150
200
250
300
350
400
450
0% 10% 20% 30% 40% 50% 60% 70% 80% 90% 100%
CF (%)
CO
ST
($/k
W-y
r)
BBR3BBR2GAM1GASNUCL
0.0000
0.1000
0.2000
0.3000
0.4000
0.5000
0.6000
0.7000
0.8000
0.9000
1.0000
0.0000 0.1000 0.2000 0.3000 0.4000 0.5000 0.6000 0.7000 0.8000 0.9000 1.0000
0.4820.397
0.358

5
WEST KALIMANTANTEAM 3
Electricity For
A Better Life
System Reliability Criteria
Feasible year of operation candidate unit is
2015
No limit due to fuel constraints
Maximum acceptable unit size is 200 MW
Reserve margin : 30% – 40%
LOLP limit : 1 day/year
ENS Cost : 0.85 US$/kWh
WEST KALIMANTANTEAM 3
Electricity For
A Better LifeDynpro Input
BBR3 BBR2 GAM1 GAS NUCLInvest Cost $/kW 1226.40 1103.76 1226.40 524.025 2584.60IDC % 18.46 18.46 18.46 14.13 22.62Plant Life Years 27 27 27 25 30Construction Time Years 4 4 4 3 5Discount rate 12% (based year 2007)
Data for Dynpro Input
6
WEST KALIMANTANTEAM 3
Electricity For
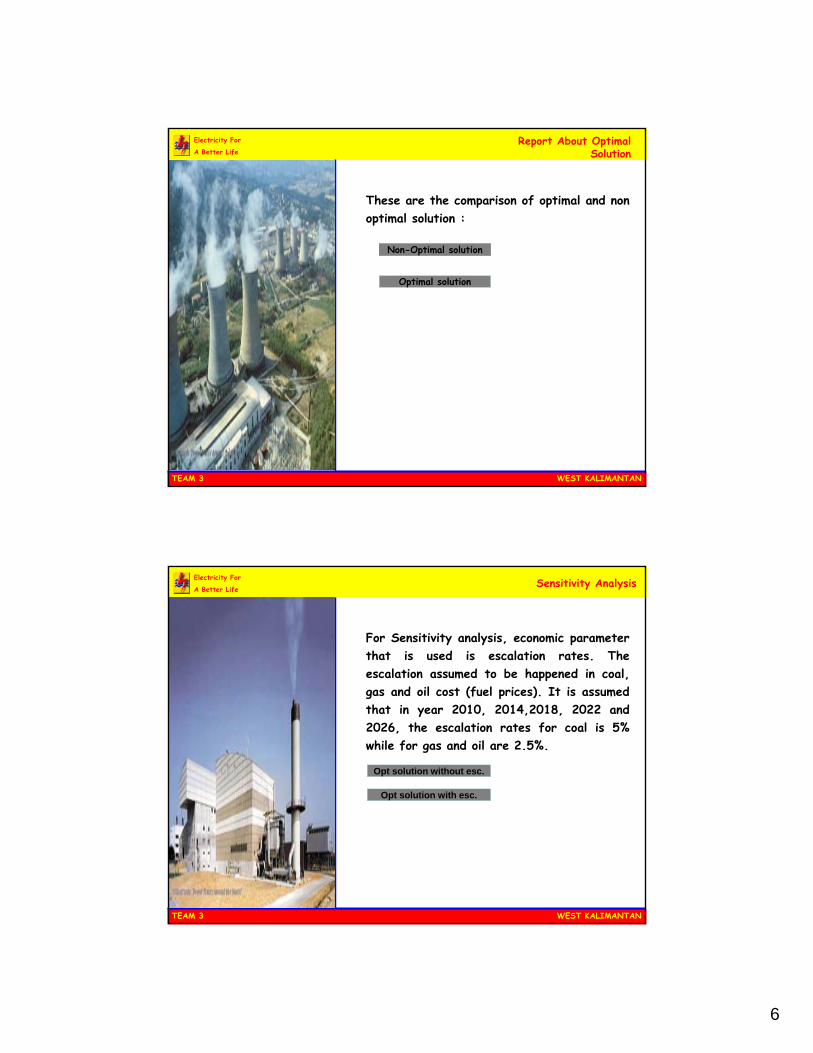
A Better LifeReport About Optimal
Solution
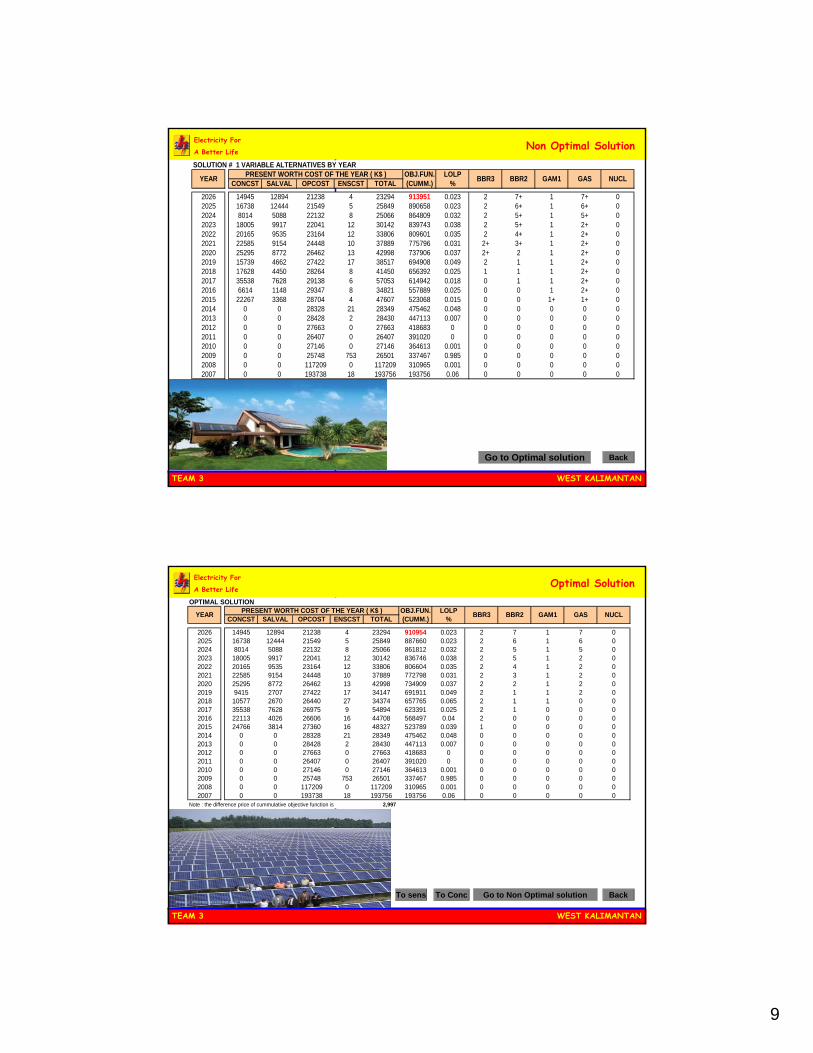
These are the comparison of optimal and non optimal solution :
Non-Optimal solution
Optimal solution
WEST KALIMANTANTEAM 3
Electricity For
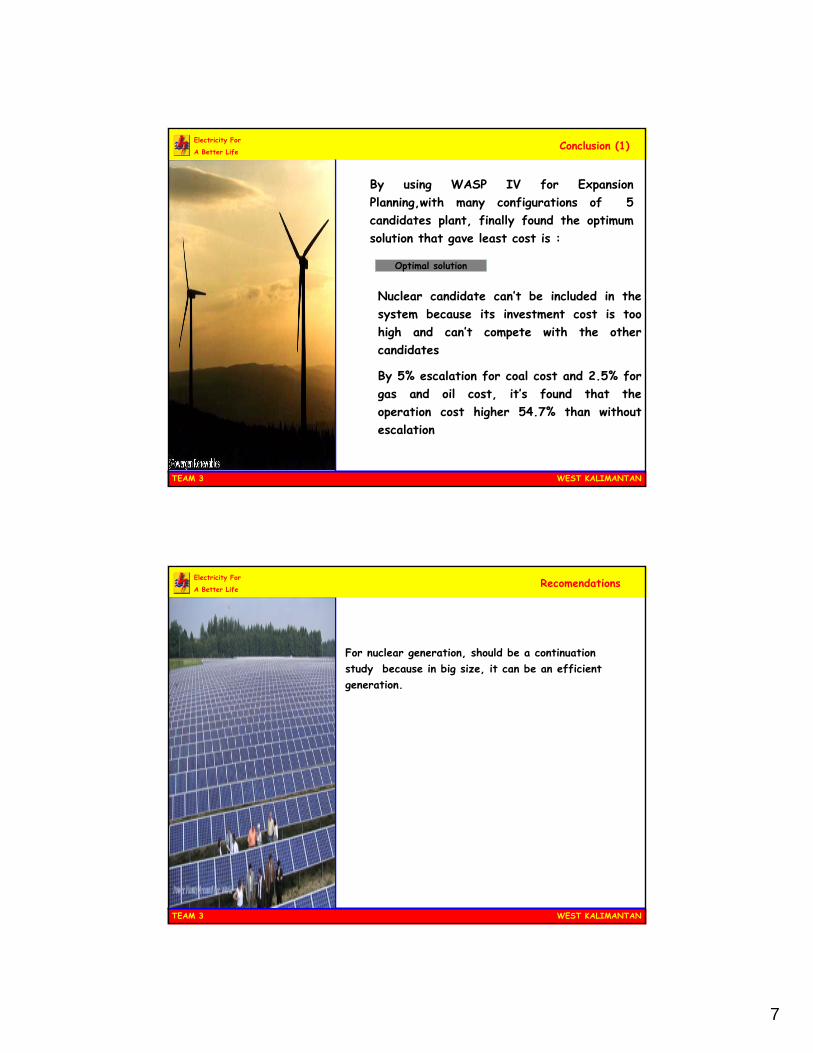
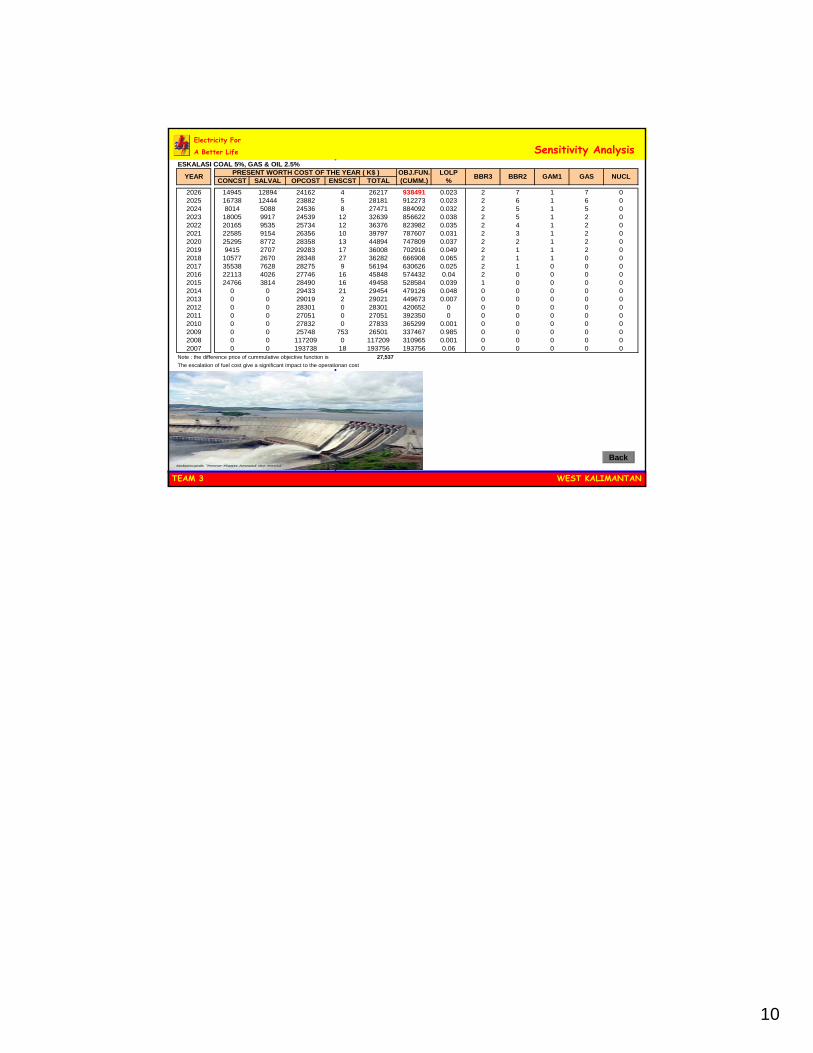
A Better LifeSensitivity Analysis
For Sensitivity analysis, economic parameter that is used is escalation rates. The escalation assumed to be happened in coal, gas and oil cost (fuel prices). It is assumed that in year 2010, 2014,2018, 2022 and 2026, the escalation rates for coal is 5% while for gas and oil are 2.5%.
Opt solution without esc.
Opt solution with esc.
7
WEST KALIMANTANTEAM 3
Electricity For
A Better LifeConclusion (1)
By using WASP IV for Expansion Planning,with many configurations of 5 candidates plant, finally found the optimum solution that gave least cost is :
Optimal solution
Nuclear candidate can’t be included in the system because its investment cost is too high and can’t compete with the other candidates
By 5% escalation for coal cost and 2.5% for gas and oil cost, it’s found that the operation cost higher 54.7% than without escalation
WEST KALIMANTANTEAM 3
Electricity For
A Better LifeRecomendations
For nuclear generation, should be a continuation study because in big size, it can be an efficient generation.
8
WEST KALIMANTANTEAM 3
Electricity For
A Better Life
Kashiwazaki-Kariwa8,212 MW (Steam) Japan
Plan For the Future Activities
We expect WASP IV program can be used for long
term planning generation in West Kalimantan
WEST KALIMANTANTEAM 3
Electricity For
A Better Life
9
WEST KALIMANTANTEAM 3
Electricity For
A Better LifeNon Optimal Solution
BackGo to Optimal solution
SOLUTION # 1 VARIABLE ALTERNATIVES BY YEAROBJ.FUN. LOLP
CONCST SALVAL OPCOST ENSCST TOTAL (CUMM.) %
2026 14945 12894 21238 4 23294 913951 0.023 2 7+ 1 7+ 02025 16738 12444 21549 5 25849 890658 0.023 2 6+ 1 6+ 02024 8014 5088 22132 8 25066 864809 0.032 2 5+ 1 5+ 02023 18005 9917 22041 12 30142 839743 0.038 2 5+ 1 2+ 02022 20165 9535 23164 12 33806 809601 0.035 2 4+ 1 2+ 02021 22585 9154 24448 10 37889 775796 0.031 2+ 3+ 1 2+ 02020 25295 8772 26462 13 42998 737906 0.037 2+ 2 1 2+ 02019 15739 4662 27422 17 38517 694908 0.049 2 1 1 2+ 02018 17628 4450 28264 8 41450 656392 0.025 1 1 1 2+ 02017 35538 7628 29138 6 57053 614942 0.018 0 1 1 2+ 02016 6614 1148 29347 8 34821 557889 0.025 0 0 1 2+ 02015 22267 3368 28704 4 47607 523068 0.015 0 0 1+ 1+ 02014 0 0 28328 21 28349 475462 0.048 0 0 0 0 02013 0 0 28428 2 28430 447113 0.007 0 0 0 0 02012 0 0 27663 0 27663 418683 0 0 0 0 0 02011 0 0 26407 0 26407 391020 0 0 0 0 0 02010 0 0 27146 0 27146 364613 0.001 0 0 0 0 02009 0 0 25748 753 26501 337467 0.985 0 0 0 0 02008 0 0 117209 0 117209 310965 0.001 0 0 0 0 02007 0 0 193738 18 193756 193756 0.06 0 0 0 0 0
NUCLBBR3 BBR2 GAM1 GASPRESENT WORTH COST OF THE YEAR ( K$ )YEAR
WEST KALIMANTANTEAM 3
Electricity For
A Better LifeOptimal Solution
Go to Non Optimal solution
OPTIMAL SOLUTIONOBJ.FUN. LOLP
CONCST SALVAL OPCOST ENSCST TOTAL (CUMM.) %
2026 14945 12894 21238 4 23294 910954 0.023 2 7 1 7 02025 16738 12444 21549 5 25849 887660 0.023 2 6 1 6 02024 8014 5088 22132 8 25066 861812 0.032 2 5 1 5 02023 18005 9917 22041 12 30142 836746 0.038 2 5 1 2 02022 20165 9535 23164 12 33806 806604 0.035 2 4 1 2 02021 22585 9154 24448 10 37889 772798 0.031 2 3 1 2 02020 25295 8772 26462 13 42998 734909 0.037 2 2 1 2 02019 9415 2707 27422 17 34147 691911 0.049 2 1 1 2 02018 10577 2670 26440 27 34374 657765 0.065 2 1 1 0 02017 35538 7628 26975 9 54894 623391 0.025 2 1 0 0 02016 22113 4026 26606 16 44708 568497 0.04 2 0 0 0 02015 24766 3814 27360 16 48327 523789 0.039 1 0 0 0 02014 0 0 28328 21 28349 475462 0.048 0 0 0 0 02013 0 0 28428 2 28430 447113 0.007 0 0 0 0 02012 0 0 27663 0 27663 418683 0 0 0 0 0 02011 0 0 26407 0 26407 391020 0 0 0 0 0 02010 0 0 27146 0 27146 364613 0.001 0 0 0 0 02009 0 0 25748 753 26501 337467 0.985 0 0 0 0 02008 0 0 117209 0 117209 310965 0.001 0 0 0 0 02007 0 0 193738 18 193756 193756 0.06 0 0 0 0 0
Note : the difference price of cummulative objective function is 2,997
GAM1 GAS NUCLBBR3 BBR2YEAR PRESENT WORTH COST OF THE YEAR ( K$ )
BackTo ConcTo sens
10
WEST KALIMANTANTEAM 3
Electricity For
A Better Life Sensitivity AnalysisESKALASI COAL 5%, GAS & OIL 2.5%
OBJ.FUN. LOLPCONCST SALVAL OPCOST ENSCST TOTAL (CUMM.) %
2026 14945 12894 24162 4 26217 938491 0.023 2 7 1 7 02025 16738 12444 23882 5 28181 912273 0.023 2 6 1 6 02024 8014 5088 24536 8 27471 884092 0.032 2 5 1 5 02023 18005 9917 24539 12 32639 856622 0.038 2 5 1 2 02022 20165 9535 25734 12 36376 823982 0.035 2 4 1 2 02021 22585 9154 26356 10 39797 787607 0.031 2 3 1 2 02020 25295 8772 28358 13 44894 747809 0.037 2 2 1 2 02019 9415 2707 29283 17 36008 702916 0.049 2 1 1 2 02018 10577 2670 28348 27 36282 666908 0.065 2 1 1 0 02017 35538 7628 28275 9 56194 630626 0.025 2 1 0 0 02016 22113 4026 27746 16 45848 574432 0.04 2 0 0 0 02015 24766 3814 28490 16 49458 528584 0.039 1 0 0 0 02014 0 0 29433 21 29454 479126 0.048 0 0 0 0 02013 0 0 29019 2 29021 449673 0.007 0 0 0 0 02012 0 0 28301 0 28301 420652 0 0 0 0 0 02011 0 0 27051 0 27051 392350 0 0 0 0 0 02010 0 0 27832 0 27833 365299 0.001 0 0 0 0 02009 0 0 25748 753 26501 337467 0.985 0 0 0 0 02008 0 0 117209 0 117209 310965 0.001 0 0 0 0 02007 0 0 193738 18 193756 193756 0.06 0 0 0 0 0
Note : the difference price of cummulative objective function is 27,537 The escalation of fuel cost give a significant impact to the operationan cost
BBR3 NUCLGASGAM1BBR2PRESENT WORTH COST OF THE YEAR ( K$ )YEAR
Back

1
Company
LOGO
Optimizing KaltimseltengGeneration System Planning
Optimizing KaltimseltengGeneration System Planning
WASP TrainingBogor, 2007
PLTA PLTA SebakungSebakung
PLTA PLTA SesayapSesayap
Batakan
S.EmpatS.EmpatBatuBatu LicinLicin
PLTA PLTA KayanKayan
PLTA PLTA KelaiKelai
GI.T.SelorGI.T.Selor
PLTA PLTA BohBoh II
PLTA PLTA BohBoh IIII
GI. GI. TJ.RedepTJ.Redep
GI.SanggattaGI.Sanggatta
GI.PurukCahuGI.PurukCahu
GI.BuntokGI.Buntok
GI.M.TewehGI.M.TewehGI.KualaKurunGI.KualaKurun
MantuilMantuil
SamarindaSamarinda
BarasBaras
BalikpapanG. Malang
Electricity MapElectricity Map
Mahakam
195 / 168 MW
Barito
256 / 265 MW
Population : 8 106 821 people
Electrification ratio : 55.2 %
2
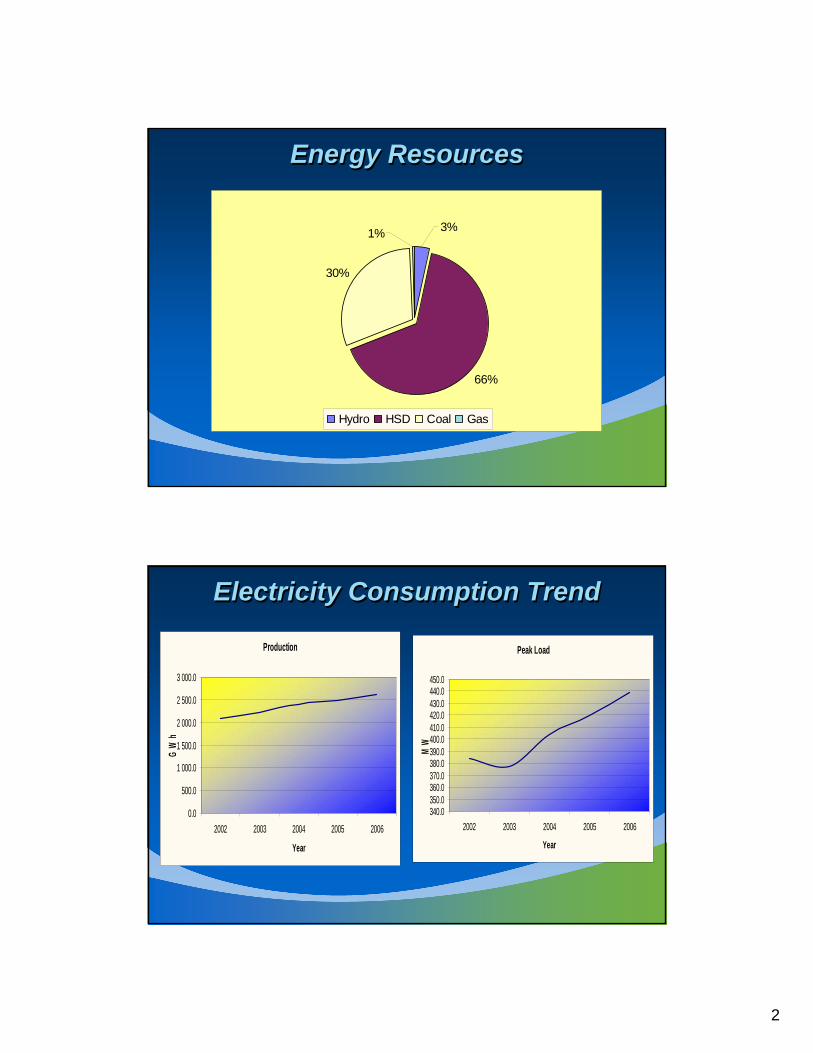
Energy ResourcesEnergy Resources
66%
30%
3%1%
Hydro HSD Coal Gas
Electricity Consumption TrendElectricity Consumption Trend
Production
0.0
500.0
1 000.0
1 500.0
2 000.0
2 500.0
3 000.0
2002 2003 2004 2005 2006
Year
GW
h
Peak Load
340.0350.0360.0370.0380.0390.0400.0410.0420.0430.0440.0450.0
2002 2003 2004 2005 2006
Year
MW
3
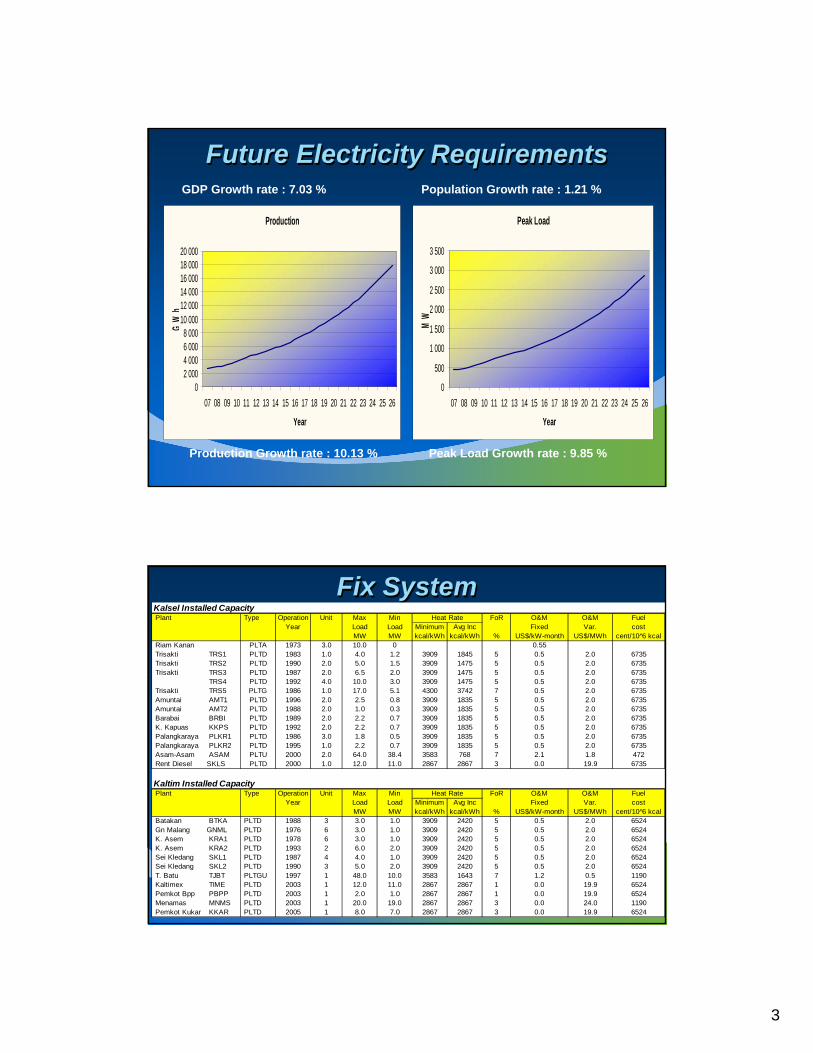
Future Electricity RequirementsFuture Electricity RequirementsGDP Growth rate : 7.03 % Population Growth rate : 1.21 %
Production
02 0004 0006 0008 000
10 00012 00014 00016 00018 00020 000
07 08 09 10 11 12 13 14 15 16 17 18 19 20 21 22 23 24 25 26
Year
GW
h
Peak Load
0
500
1 000
1 500
2 000
2 500
3 000
3 500
07 08 09 10 11 12 13 14 15 16 17 18 19 20 21 22 23 24 25 26
YearM
W
Production Growth rate : 10.13 % Peak Load Growth rate : 9.85 %
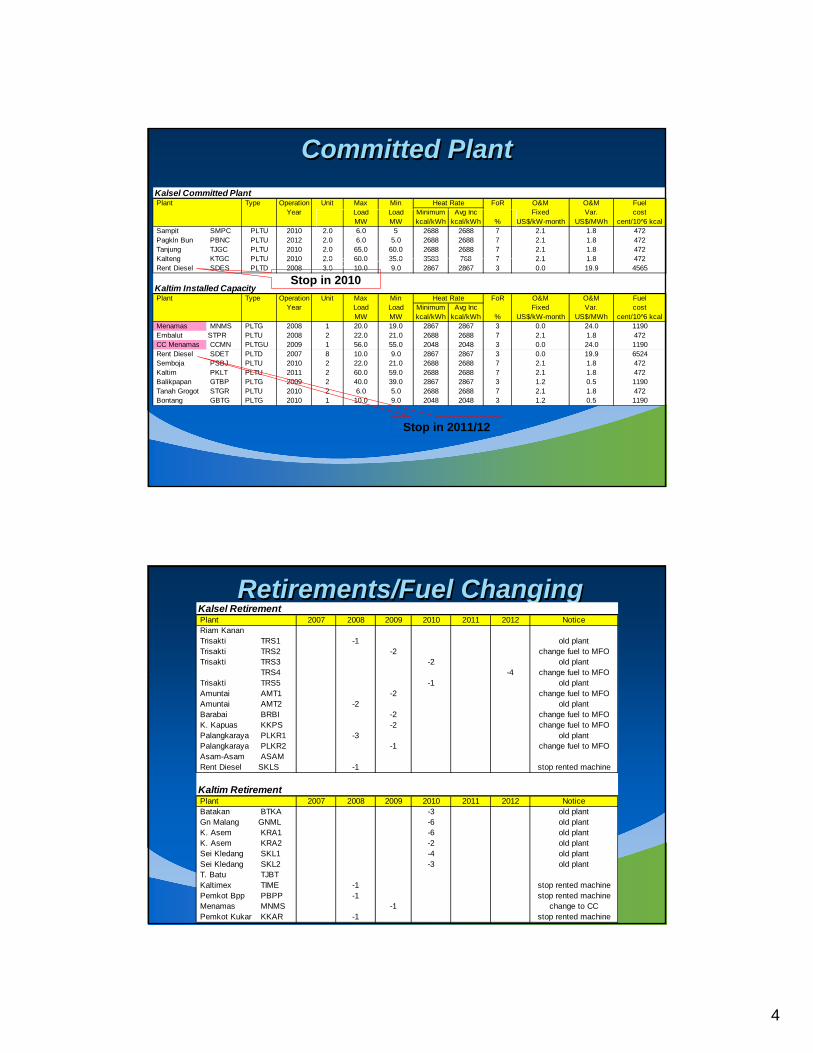
Fix SystemFix SystemKalsel Installed CapacityPlant Type Operation Unit Max Min FoR O&M O&M Fuel
Year Load Load Minimum Avg Inc Fixed Var. costMW MW kcal/kWh kcal/kWh % US$/kW-month US$/MWh cent/10 6̂ kcal
Riam Kanan PLTA 1973 3.0 10.0 0 0.55Trisakti TRS1 PLTD 1983 1.0 4.0 1.2 3909 1845 5 0.5 2.0 6735Trisakti TRS2 PLTD 1990 2.0 5.0 1.5 3909 1475 5 0.5 2.0 6735Trisakti TRS3 PLTD 1987 2.0 6.5 2.0 3909 1475 5 0.5 2.0 6735 TRS4 PLTD 1992 4.0 10.0 3.0 3909 1475 5 0.5 2.0 6735Trisakti TRS5 PLTG 1986 1.0 17.0 5.1 4300 3742 7 0.5 2.0 6735Amuntai AMT1 PLTD 1996 2.0 2.5 0.8 3909 1835 5 0.5 2.0 6735Amuntai AMT2 PLTD 1988 2.0 1.0 0.3 3909 1835 5 0.5 2.0 6735Barabai BRBI PLTD 1989 2.0 2.2 0.7 3909 1835 5 0.5 2.0 6735K. Kapuas KKPS PLTD 1992 2.0 2.2 0.7 3909 1835 5 0.5 2.0 6735Palangkaraya PLKR1 PLTD 1986 3.0 1.8 0.5 3909 1835 5 0.5 2.0 6735Palangkaraya PLKR2 PLTD 1995 1.0 2.2 0.7 3909 1835 5 0.5 2.0 6735Asam-Asam ASAM PLTU 2000 2.0 64.0 38.4 3583 768 7 2.1 1.8 472Rent Diesel SKLS PLTD 2000 1.0 12.0 11.0 2867 2867 3 0.0 19.9 6735
Kaltim Installed CapacityPlant Type Operation Unit Max Min FoR O&M O&M Fuel
Year Load Load Minimum Avg Inc Fixed Var. costMW MW kcal/kWh kcal/kWh % US$/kW-month US$/MWh cent/10 6̂ kcal
Batakan BTKA PLTD 1988 3 3.0 1.0 3909 2420 5 0.5 2.0 6524Gn Malang GNML PLTD 1976 6 3.0 1.0 3909 2420 5 0.5 2.0 6524K. Asem KRA1 PLTD 1978 6 3.0 1.0 3909 2420 5 0.5 2.0 6524K. Asem KRA2 PLTD 1993 2 6.0 2.0 3909 2420 5 0.5 2.0 6524Sei Kledang SKL1 PLTD 1987 4 4.0 1.0 3909 2420 5 0.5 2.0 6524Sei Kledang SKL2 PLTD 1990 3 5.0 2.0 3909 2420 5 0.5 2.0 6524T. Batu TJBT PLTGU 1997 1 48.0 10.0 3583 1643 7 1.2 0.5 1190Kaltimex TIME PLTD 2003 1 12.0 11.0 2867 2867 1 0.0 19.9 6524Pemkot Bpp PBPP PLTD 2003 1 2.0 1.0 2867 2867 1 0.0 19.9 6524Menamas MNMS PLTD 2003 1 20.0 19.0 2867 2867 3 0.0 24.0 1190Pemkot Kukar KKAR PLTD 2005 1 8.0 7.0 2867 2867 3 0.0 19.9 6524
Heat Rate
Heat Rate
4
Committed PlantCommitted PlantKalsel Committed PlantPlant Type Operation Unit Max Min FoR O&M O&M Fuel
Year Load Load Minimum Avg Inc Fixed Var. costMW MW kcal/kWh kcal/kWh % US$/kW-month US$/MWh cent/10 6̂ kcal
Sampit SMPC PLTU 2010 2.0 6.0 5 2688 2688 7 2.1 1.8 472Pagkln Bun PBNC PLTU 2012 2.0 6.0 5.0 2688 2688 7 2.1 1.8 472Tanjung TJGC PLTU 2010 2.0 65.0 60.0 2688 2688 7 2.1 1.8 472Kalteng KTGC PLTU 2010 2.0 60.0 35.0 3583 768 7 2.1 1.8 472Rent Diesel SDES PLTD 2008 3.0 10.0 9.0 2867 2867 3 0.0 19.9 4565
Kaltim Installed CapacityPlant Type Operation Unit Max Min FoR O&M O&M Fuel
Year Load Load Minimum Avg Inc Fixed Var. costMW MW kcal/kWh kcal/kWh % US$/kW-month US$/MWh cent/10 6̂ kcal
Menamas MNMS PLTG 2008 1 20.0 19.0 2867 2867 3 0.0 24.0 1190Embalut STPR PLTU 2008 2 22.0 21.0 2688 2688 7 2.1 1.8 472CC Menamas CCMN PLTGU 2009 1 56.0 55.0 2048 2048 3 0.0 24.0 1190Rent Diesel SDET PLTD 2007 8 10.0 9.0 2867 2867 3 0.0 19.9 6524Semboja PSBJ PLTU 2010 2 22.0 21.0 2688 2688 7 2.1 1.8 472Kaltim PKLT PLTU 2011 2 60.0 59.0 2688 2688 7 2.1 1.8 472Balikpapan GTBP PLTG 2009 2 40.0 39.0 2867 2867 3 1.2 0.5 1190Tanah Grogot STGR PLTU 2010 2 6.0 5.0 2688 2688 7 2.1 1.8 472Bontang GBTG PLTG 2010 1 10.0 9.0 2048 2048 3 1.2 0.5 1190
Heat Rate
Heat Rate
Stop in 2010
Stop in 2011/12
Retirements/Fuel ChangingRetirements/Fuel ChangingKalsel RetirementPlant 2007 2008 2009 2010 2011 2012 NoticeRiam Kanan Trisakti TRS1 -1 old plantTrisakti TRS2 -2 change fuel to MFOTrisakti TRS3 -2 old plant TRS4 -4 change fuel to MFOTrisakti TRS5 -1 old plantAmuntai AMT1 -2 change fuel to MFOAmuntai AMT2 -2 old plantBarabai BRBI -2 change fuel to MFOK. Kapuas KKPS -2 change fuel to MFOPalangkaraya PLKR1 -3 old plantPalangkaraya PLKR2 -1 change fuel to MFOAsam-Asam ASAMRent Diesel SKLS -1 stop rented machine
Kaltim RetirementPlant 2007 2008 2009 2010 2011 2012 NoticeBatakan BTKA -3 old plantGn Malang GNML -6 old plantK. Asem KRA1 -6 old plantK. Asem KRA2 -2 old plantSei Kledang SKL1 -4 old plantSei Kledang SKL2 -3 old plantT. Batu TJBTKaltimex TIME -1 stop rented machinePemkot Bpp PBPP -1 stop rented machineMenamas MNMS -1 change to CCPemkot Kukar KKAR -1 stop rented machine
5
RetirementsRetirementsKalsel RetirementPlant 2007 2008 2009 2010 2011 2012 NoticeRiam Kanan Trisakti TRS1 -1 old plantTrisakti TRS2 -2 change fuel to MFOTrisakti TRS3 -2 old plant TRS4 -4 change fuel to MFOTrisakti TRS5 -1 old plantAmuntai AMT1 -2 change fuel to MFOAmuntai AMT2 -2 old plantBarabai BRBI -2 change fuel to MFOK. Kapuas KKPS -2 change fuel to MFOPalangkaraya PLKR1 -3 old plantPalangkaraya PLKR2 -1 change fuel to MFOAsam-Asam ASAMRent Diesel SKLS -1 stop rented machine
Kaltim RetirementPlant 2007 2008 2009 2010 2011 2012 NoticeBatakan BTKA -3 old plantGn Malang GNML -6 old plantK. Asem KRA1 -6 old plantK. Asem KRA2 -2 old plantSei Kledang SKL1 -4 old plantSei Kledang SKL2 -3 old plantT. Batu TJBTKaltimex TIME -1 stop rented machinePemkot Bpp PBPP -1 stop rented machineMenamas MNMS -1 change to CCPemkot Kukar KKAR -1 stop rented machine
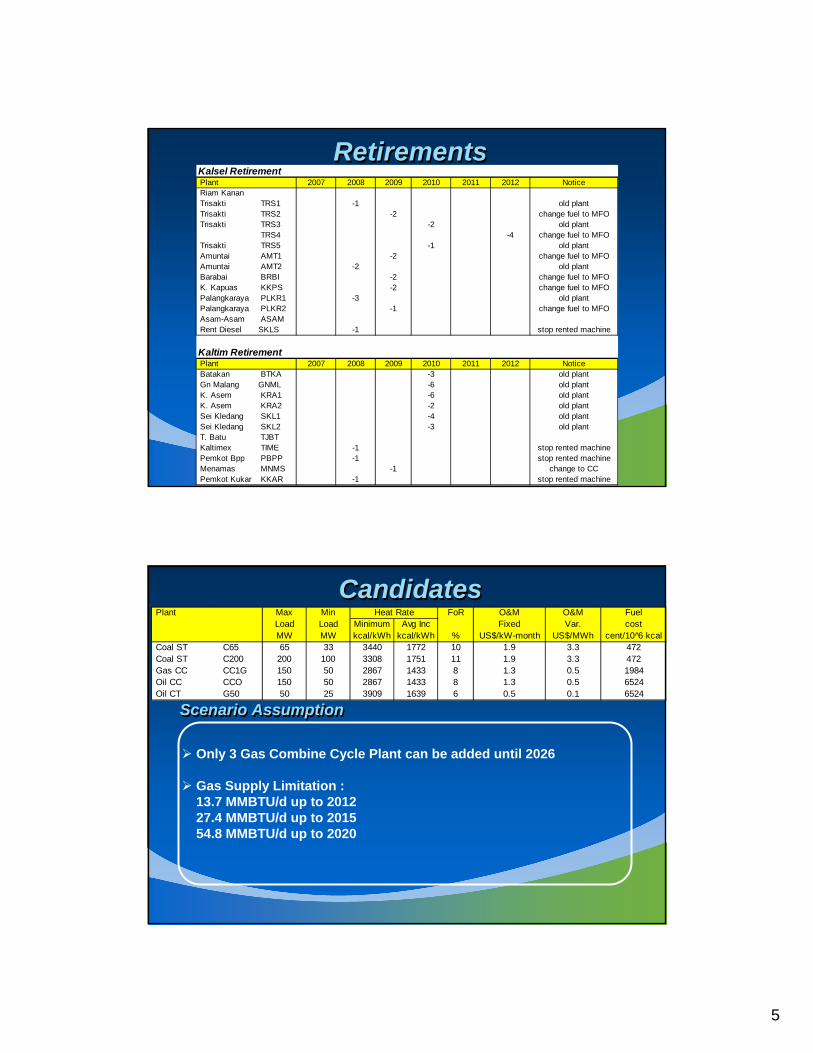
CandidatesCandidatesPlant Max Min FoR O&M O&M Fuel
Load Load Minimum Avg Inc Fixed Var. costMW MW kcal/kWh kcal/kWh % US$/kW-month US$/MWh cent/10 6̂ kcal
Coal ST C65 65 33 3440 1772 10 1.9 3.3 472Coal ST C200 200 100 3308 1751 11 1.9 3.3 472Gas CC CC1G 150 50 2867 1433 8 1.3 0.5 1984Oil CC CCO 150 50 2867 1433 8 1.3 0.5 6524Oil CT G50 50 25 3909 1639 6 0.5 0.1 6524
Heat Rate
Scenario AssumptionScenario Assumption
Only 3 Gas Combine Cycle Plant can be added until 2026
Gas Supply Limitation :13.7 MMBTU/d up to 201227.4 MMBTU/d up to 201554.8 MMBTU/d up to 2020
6
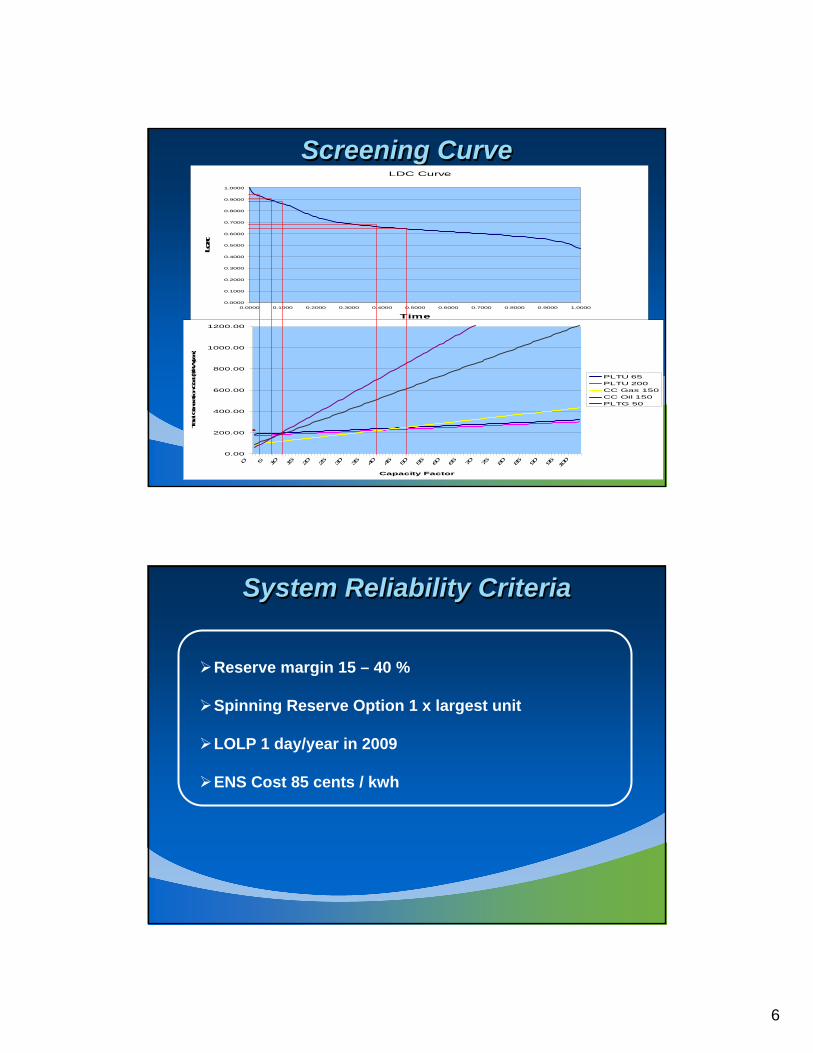
Screening CurveScreening CurveLDC Curve
0.0000
0.1000
0.2000
0.3000
0.4000
0.5000
0.6000
0.7000
0.8000
0.9000
1.0000
0.0000 0.1000 0.2000 0.3000 0.4000 0.5000 0.6000 0.7000 0.8000 0.9000 1.0000
Time
Load
0.00
200.00
400.00
600.00
800.00
1000.00
1200.00
0 5 10 15 20 25 30 35 40 45 50 55 60 65 70 75 80 85 90 95 100
Capacity Factor
Total G
eneration Cos
t ($/kW
-year)
PLTU 65PLTU 200CC Gas 150CC Oil 150PLTG 50
System Reliability Criteria System Reliability Criteria
Reserve margin 15 – 40 %
Spinning Reserve Option 1 x largest unit
LOLP 1 day/year in 2009
ENS Cost 85 cents / kwh
7
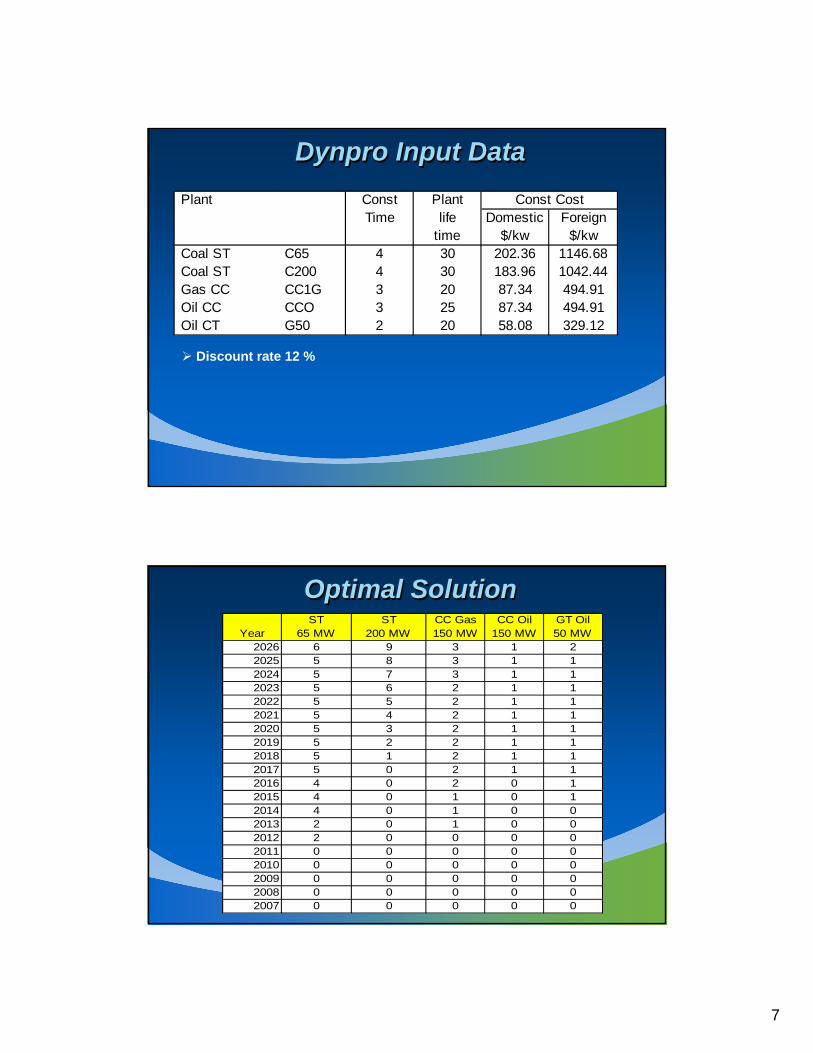
Dynpro Input DataDynpro Input DataPlant Const Plant
Time life Domestic Foreigntime $/kw $/kw
Coal ST C65 4 30 202.36 1146.68Coal ST C200 4 30 183.96 1042.44Gas CC CC1G 3 20 87.34 494.91Oil CC CCO 3 25 87.34 494.91Oil CT G50 2 20 58.08 329.12
Const Cost
Discount rate 12 %
Optimal SolutionOptimal SolutionYear
ST 65 MW
ST 200 MW
CC Gas150 MW
CC Oil150 MW
GT Oil50 MW
2026 6 9 3 1 22025 5 8 3 1 12024 5 7 3 1 12023 5 6 2 1 12022 5 5 2 1 12021 5 4 2 1 12020 5 3 2 1 12019 5 2 2 1 12018 5 1 2 1 12017 5 0 2 1 12016 4 0 2 0 12015 4 0 1 0 12014 4 0 1 0 02013 2 0 1 0 02012 2 0 0 0 02011 0 0 0 0 02010 0 0 0 0 02009 0 0 0 0 02008 0 0 0 0 02007 0 0 0 0 0

8
Optimal SolutionOptimal Solution
Optimization Result
2 676
2 4582 412
2 372 2 349
2 100
2 200
2 300
2 400
2 500
2 600
2 700
2 800
Fix Expans 1st iteration 2nd iteration 3rd iteration 4th iteration
M U
SD
Energy Resources (2026)Energy Resources (2026)
11.3%
0.3%0.8%
0.8%
86.8%
Coal Gas MFO HSD Hydro

9
Sensitivity Analysis Sensitivity Analysis
High Load Forecasting (9.85 % Peak Load Growth rate) VS
Medium Load Forecasting (8.58 % Peak Load Growth rate)
Coal Price Escalation
Scenario 1 :5 % in 2010, 10 % in 2015, 10 % in 2020
Scenario 2:10 % in 2010, 20 % in 2015, 20 % in 2020
Sensitivity AnalysysSensitivity AnalysysObjc Cumm
( M USD)LOLP(%)
Objc Cumm ( M USD)
LOLP(%)
2026 2 349 0.245 2 187 0.181 7.4%2025 2 297 0.258 2 139 0.197 7.4%2024 2 240 0.131 2 086 0.137 7.4%2023 2 172 0.248 2 025 0.102 7.3%2022 2 099 0.166 1 949 0.169 7.7%2021 2 018 0.121 1 871 0.188 7.9%2020 1 929 0.098 1 782 0.225 8.2%2019 1 831 0.089 1 713 0.271 6.9%2018 1 720 0.082 1 649 0.051 4.3%2017 1 596 0.068 1 553 0.061 2.8%2016 1 484 0.182 1 467 0.101 1.2%2015 1 394 0.201 1 381 0.172 0.9%2014 1 329 0.078 1 315 0.102 1.0%2013 1 205 0.143 1 220 0.220 -1.3%2012 1 104 0.240 1 126 0.184 -2.0%2011 955 0.242 978 0.254 -2.4%2010 895 0.052 918 0.084 -2.5%2009 823 0.263 842 0.852 -2.3%2008 580 0.750 580 0.798 -0.1%2007 319 1.459 319 1.459 0.0%
YearHigh Load Forecasting Medium Load Forecasting
%

10
Sensitivity AnalysysSensitivity AnalysysYear Ref case
M USD M USD % M USD %2026 2 349 2 489 6.0% 2 705 15.1%2025 2 297 2 410 4.9% 2 571 12.0%2024 2 240 2 330 4.0% 2 450 9.4%2023 2 172 2 242 3.3% 2 330 7.3%2022 2 099 2 154 2.6% 2 218 5.7%2021 2 018 2 060 2.1% 2 099 4.0%2020 1 929 1 962 1.7% 1 988 3.1%2019 1 831 1 858 1.5% 1 875 2.4%2018 1 720 1 744 1.3% 1 754 1.9%2017 1 596 1 615 1.2% 1 619 1.4%2016 1 484 1 499 1.0% 1 515 2.1%2015 1 394 1 406 0.8% 1 417 1.7%2014 1 329 1 336 0.6% 1 343 1.1%2013 1 205 1 211 0.5% 1 216 1.0%2012 1 104 1 108 0.4% 1 113 0.8%2011 955 958 0.3% 961 0.6%2010 895 896 0.1% 897 0.3%2009 823 823 0.0% 823 0.0%2008 580 580 0.0% 580 0.0%2007 319 319 0.0% 319 0.0%
Objective Cummulative Functionscenario 1 ( 5 10 10) scenario 2 (10 20 20)
Sensitivity ConclusionSensitivity Conclusion
Because the difference of High Forecasting Total Cost to Medium Forecasting is 7.4 %, High Forecasting WASP Result is Recommended (when there is sufficient fund)
Increasing of total cost with coal price escalation is lower than escalation ratio
11
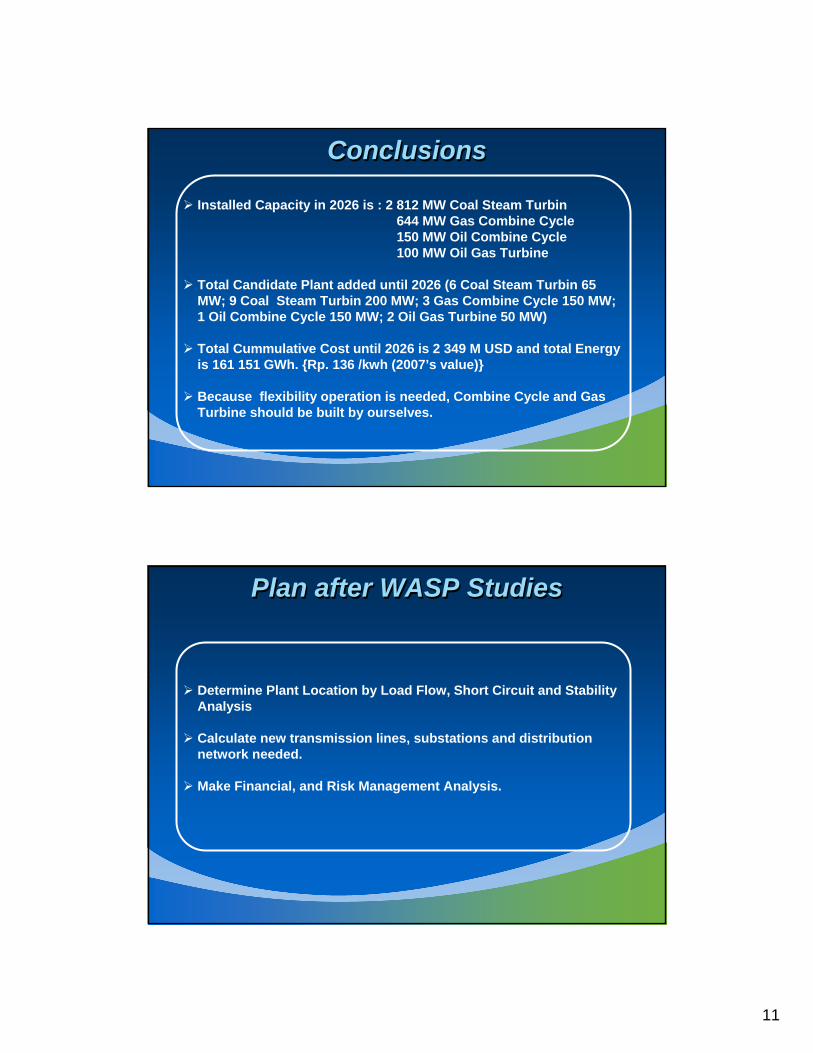
ConclusionsConclusions
Installed Capacity in 2026 is : 2 812 MW Coal Steam Turbin644 MW Gas Combine Cycle150 MW Oil Combine Cycle100 MW Oil Gas Turbine
Total Candidate Plant added until 2026 (6 Coal Steam Turbin 65 MW; 9 Coal Steam Turbin 200 MW; 3 Gas Combine Cycle 150 MW; 1 Oil Combine Cycle 150 MW; 2 Oil Gas Turbine 50 MW)
Total Cummulative Cost until 2026 is 2 349 M USD and total Energy is 161 151 GWh. {Rp. 136 /kwh (2007’s value)}
Because flexibility operation is needed, Combine Cycle and Gas Turbine should be built by ourselves.
Plan after WASP StudiesPlan after WASP Studies
Determine Plant Location by Load Flow, Short Circuit and Stability Analysis
Calculate new transmission lines, substations and distribution network needed.
Make Financial, and Risk Management Analysis.

12
Company
LOGO
THANK YOUTHANK YOU

1
Study Generation Expansion Planning ofMinahasa SystemBy Ikhsan & Marlon
PT PLN PERSEROWILAYAH SULUTTENGGO
WORKING AREA PLN WIL. SULUTTENGGO
SULUTAREA : 15.271,19 Km2
Population : 2.043.241Customer : 365.556 Plg
GORONTALOArea : 12.215,19 Km2
Population : 888.555Customer : 102.997 Plg
SULTENGArea : 68.033,01 Km2
Population : 2.109.824Customer : 270.925 Plg
TOTAL SULUTTENGGOArea : 95.519,39 Km2
Population : 5.041.620Customer : 739.458 Plg
SULUTHYDRO : 80 MWGEO THERMAL : 500 MW
GORONTALOHYDRO : 30 MWGEO THERMAL : 9 MW
SULTENGHYDRO : 780 MWGAS : 20 MW
TOTAL SULUTTENGGOHYDRO : 890 MWGEO THERMAL : 509 MWGAS : 20 MW
2
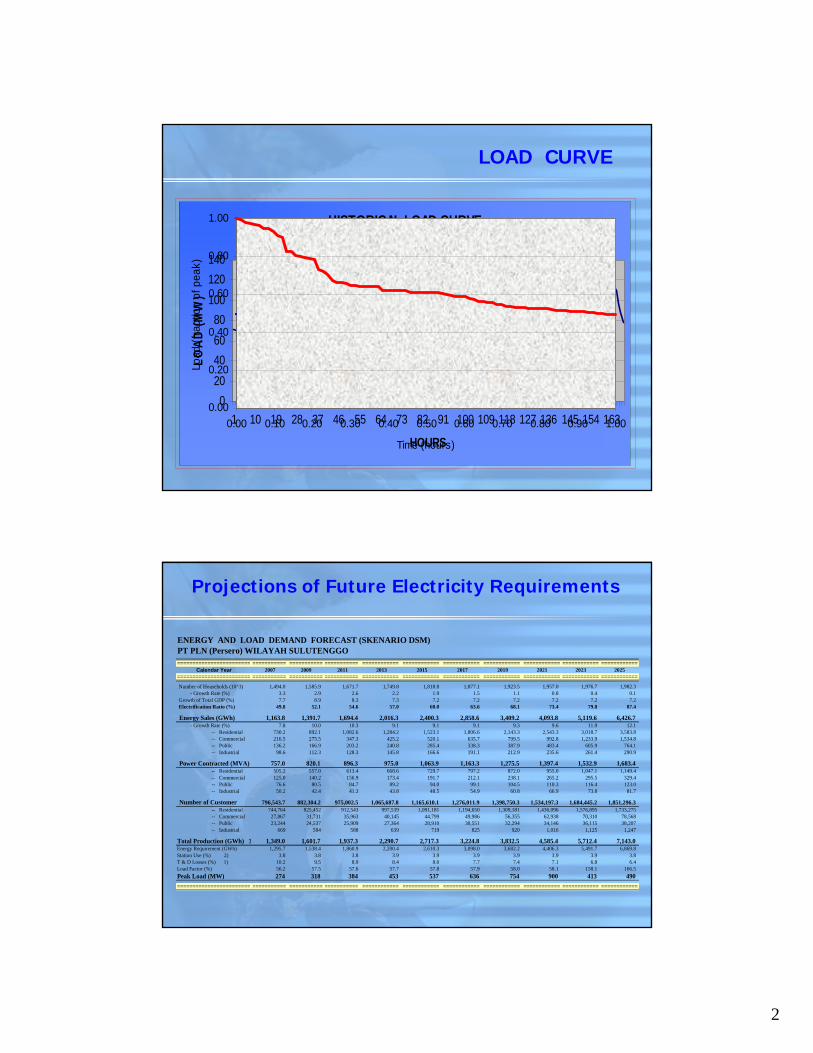
HISTORICAL LOAD CURVE
020406080
100120140
1 10 19 28 37 46 55 64 73 82 91 100 109 118 127 136 145 154 163
HOURS
LOAD
(MW
)
LOAD CURVE
0.00
0.20
0.40
0.60
0.80
1.00
0.00 0.10 0.20 0.30 0.40 0.50 0.60 0.70 0.80 0.90 1.00
Time (hours)
Load
(fra
ctio
n of
pea
k)
ENERGY AND LOAD DEMAND FORECAST (SKENARIO DSM)PT PLN (Persero) WILAYAH SULUTENGGO======================== =========== =========== =========== ============ ============ ============ ============ ============ ============ ============
Calendar Year 2007 2009 2011 2013 2015 2017 2019 2021 2023 2025======================== =========== =========== =========== ============ ============ ============ ============ ============ ============ ============
Number of Households (10^3) 1,494.0 1,585.9 1,671.7 1,749.8 1,818.8 1,877.1 1,923.5 1,957.0 1,976.7 1,982.3 - Growth Rate (%) 3.3 2.9 2.6 2.2 1.9 1.5 1.1 0.8 0.4 0.1 Growth of Total GDP (%) 7.7 8.9 8.3 7.3 7.2 7.2 7.2 7.2 7.2 7.2 Electrification Ratio (%) 49.8 52.1 54.6 57.0 60.0 63.6 68.1 73.4 79.8 87.4
Energy Sales (GWh) 1,163.8 1,391.7 1,694.4 2,016.3 2,400.3 2,858.6 3,409.2 4,093.8 5,119.6 6,426.7 - Growth Rate (%) 7.8 10.0 10.3 9.1 9.1 9.1 9.3 9.6 11.9 12.1 -- Residential 730.2 892.1 1,082.6 1,284.2 1,523.1 1,806.6 2,143.3 2,543.3 3,018.7 3,583.8 -- Commercial 216.5 275.5 347.3 425.2 520.1 635.7 799.5 992.8 1,233.9 1,534.8 -- Public 136.2 166.9 203.2 240.8 285.4 338.3 387.9 483.4 605.9 764.1 -- Industrial 98.6 112.3 128.3 145.8 166.6 191.1 212.9 235.6 261.4 290.9
Power Contracted (MVA) 757.0 820.1 896.3 975.0 1,063.9 1,163.3 1,275.5 1,397.4 1,532.9 1,683.4 -- Residential 505.2 557.0 613.4 668.6 729.7 797.2 872.0 955.0 1,047.1 1,149.4 -- Commercial 125.0 140.2 156.9 173.4 191.7 212.1 238.1 265.2 295.5 329.4 -- Public 76.6 80.5 84.7 89.2 94.0 99.1 104.5 110.3 116.4 123.0 -- Industrial 50.2 42.4 41.3 43.8 48.5 54.9 60.8 66.9 73.8 81.7
Number of Customer 796,543.7 882,304.2 975,002.5 1,065,687.8 1,165,610.1 1,276,011.9 1,398,750.3 1,534,197.3 1,684,445.2 1,851,296.3 -- Residential 744,764 825,452 912,543 997,539 1,091,181 1,194,650 1,309,181 1,436,096 1,576,895 1,733,275 -- Commercial 27,867 31,731 35,963 40,145 44,799 49,986 56,355 62,938 70,310 78,568 -- Public 23,244 24,537 25,909 27,364 28,910 30,551 32,294 34,146 36,115 38,207 -- Industrial 669 584 588 639 719 825 920 1,016 1,125 1,247
Total Production (GWh) 3 1,349.0 1,601.7 1,937.3 2,290.7 2,717.3 3,224.8 3,832.5 4,585.4 5,712.4 7,143.0 Energy Requirement (GWh) 1,295.7 1,538.4 1,860.9 2,200.4 2,610.3 3,098.0 3,682.2 4,406.3 5,491.7 6,869.8 Station Use (%) 2) 3.8 3.8 3.8 3.9 3.9 3.9 3.9 3.9 3.9 3.8 T & D Losses (%) 1) 10.2 9.5 8.9 8.4 8.0 7.7 7.4 7.1 6.8 6.4 Load Factor (%) 56.2 57.5 57.6 57.7 57.8 57.9 58.0 58.1 158.1 166.5 Peak Load (MW) 274 318 384 453 537 636 754 900 413 490 ======================== =========== =========== =========== ============ ============ ============ ============ ============ ============ ============
Projections of Future Electricity Requirements
3
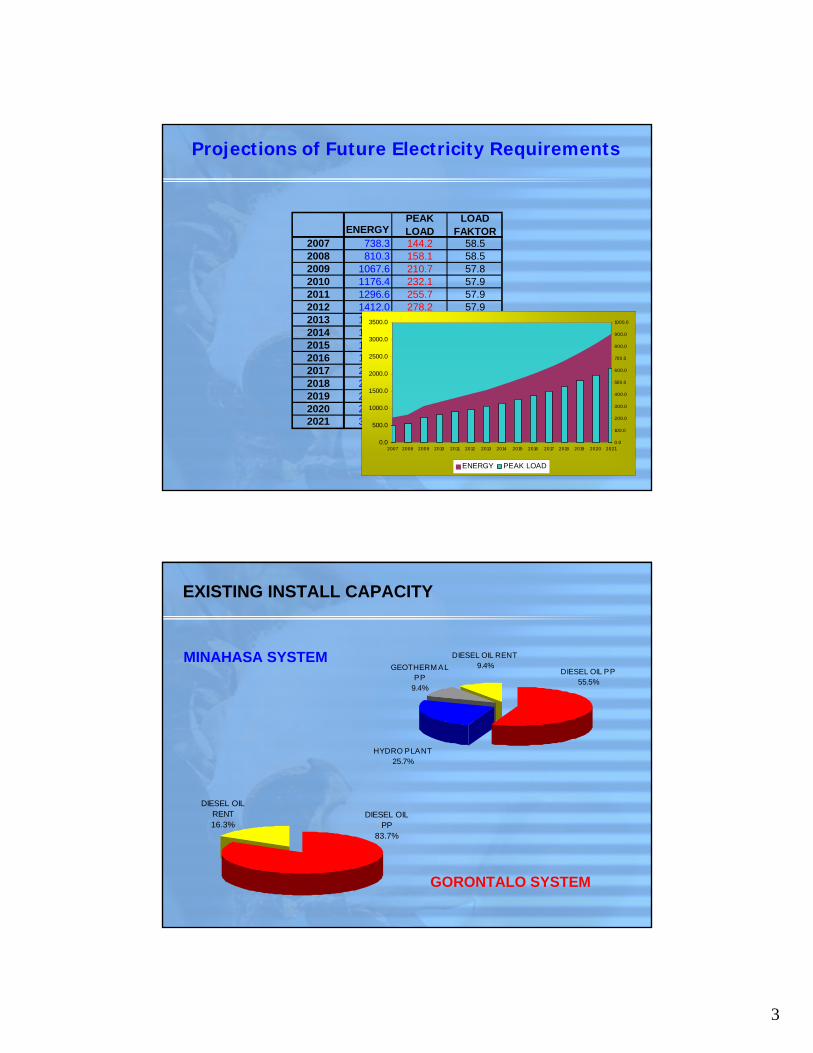
ENERGYPEAK LOAD
LOAD FAKTOR
2007 738.3 144.2 58.52008 810.3 158.1 58.52009 1067.6 210.7 57.82010 1176.4 232.1 57.92011 1296.6 255.7 57.92012 1412.0 278.2 57.92013 1538.0 302.8 58.02014 1678.4 330.1 58.02015 1831.6 359.9 58.12016 1998.8 392.4 58.12017 2182.6 428.2 58.22018 2383.6 467.3 58.22019 2618.4 512.8 58.32020 2879.3 563.5 58.32021 3168.0 619.6 58.4
0.0
500.0
1000.0
1500.0
2000.0
2500.0
3000.0
3500.0
2007 2008 2009 2010 2011 2012 2013 2014 2015 2016 2017 2018 2019 2020 20210.0
100.0
200.0
300.0
400.0
500.0
600.0
700.0
800.0
900.0
1000.0
ENERGY PEAK LOAD
Projections of Future Electricity Requirements
EXISTING INSTALL CAPACITY
HYDRO PLANT25.7%
DIESEL OIL RENT9.4%GEOTHERM AL
PP9.4%
DIESEL OIL PP55.5%
DIESEL OIL PP
83.7%
DIESEL OIL RENT16.3%
MINAHASA SYSTEM
GORONTALO SYSTEM
4
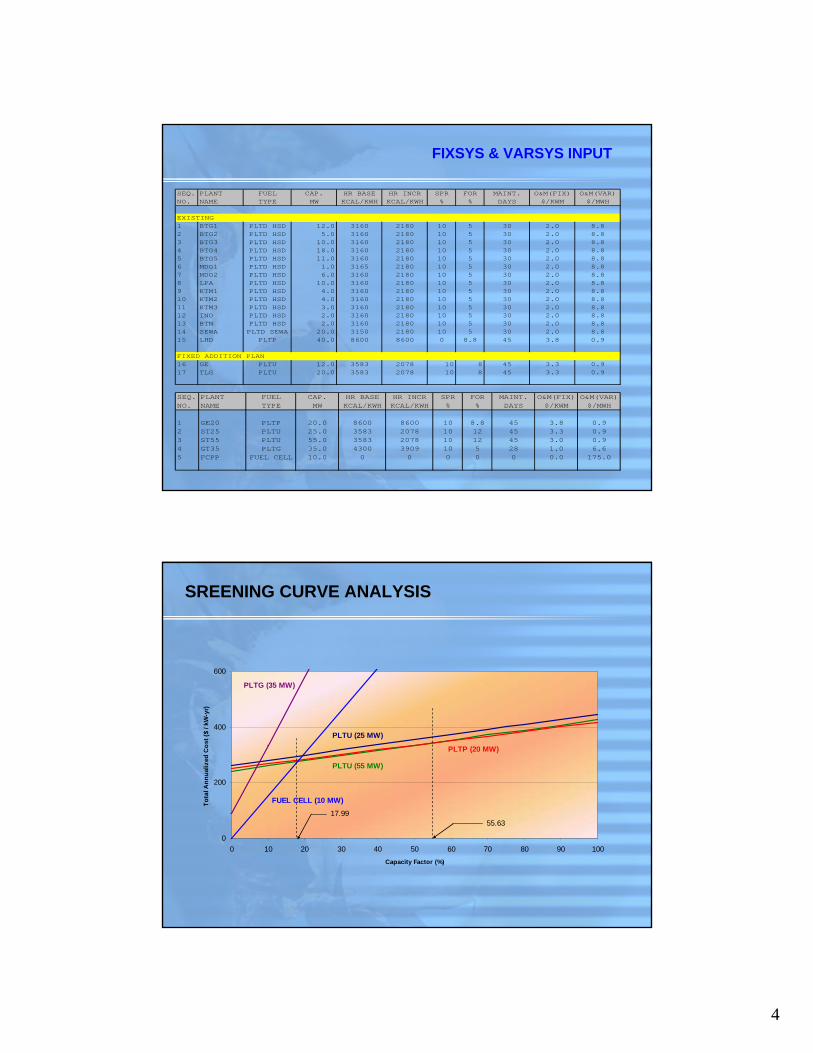
FIXSYS & VARSYS INPUT
SEQ. PLANT FUEL CAP. HR BASE HR INCR SPR FOR MAINT. O&M(FIX) O&M(VAR)NO. NAME TYPE MW KCAL/KWH KCAL/KWH % % DAYS $/KWM $/MWH
EXISTING1 BTG1 PLTD HSD 12.0 3160 2180 10 5 30 2.0 8.82 BTG2 PLTD HSD 5.0 3160 2180 10 5 30 2.0 8.83 BTG3 PLTD HSD 10.0 3160 2180 10 5 30 2.0 8.84 BTG4 PLTD HSD 18.0 3160 2180 10 5 30 2.0 8.85 BTG5 PLTD HSD 11.0 3160 2180 10 5 30 2.0 8.86 MDO1 PLTD HSD 1.0 3165 2180 10 5 30 2.0 8.87 MDO2 PLTD HSD 6.0 3160 2180 10 5 30 2.0 8.88 LPA PLTD HSD 10.0 3160 2180 10 5 30 2.0 8.89 KTM1 PLTD HSD 4.0 3160 2180 10 5 30 2.0 8.810 KTM2 PLTD HSD 4.0 3160 2180 10 5 30 2.0 8.811 KTM3 PLTD HSD 3.0 3160 2180 10 5 30 2.0 8.812 INO PLTD HSD 2.0 3160 2180 10 5 30 2.0 8.813 BTN PLTD HSD 2.0 3160 2180 10 5 30 2.0 8.814 SEWA PLTD SEWA 20.0 3150 2180 10 5 30 2.0 8.815 LHD PLTP 40.0 8600 8600 0 8.8 45 3.8 0.9
FIXED ADDITION PLAN16 GE PLTU 12.0 3583 2078 10 8 45 3.3 0.917 TLG PLTU 20.0 3583 2078 10 8 45 3.3 0.9
SEQ. PLANT FUEL CAP. HR BASE HR INCR SPR FOR MAINT. O&M(FIX) O&M(VAR)NO. NAME TYPE MW KCAL/KWH KCAL/KWH % % DAYS $/KWM $/MWH
1 GE20 PLTP 20.0 8600 8600 10 8.8 45 3.8 0.92 ST25 PLTU 25.0 3583 2078 10 12 45 3.3 0.93 ST55 PLTU 55.0 3583 2078 10 12 45 3.0 0.94 GT35 PLTG 35.0 4300 3909 10 5 28 1.0 6.65 FCPP FUEL CELL 10.0 0 0 0 0 0 0.0 175.0
SREENING CURVE ANALYSIS
0
200
400
600
0 10 20 30 40 50 60 70 80 90 100Capacity Factor (%)
Tota
l Ann
ualiz
ed C
ost (
$ / k
W-y
r)
55.6317.99
PLTP (20 MW)
PLTU (25 MW)
PLTU (55 MW)
PLTG (35 MW)
FUEL CELL (10 MW)
5
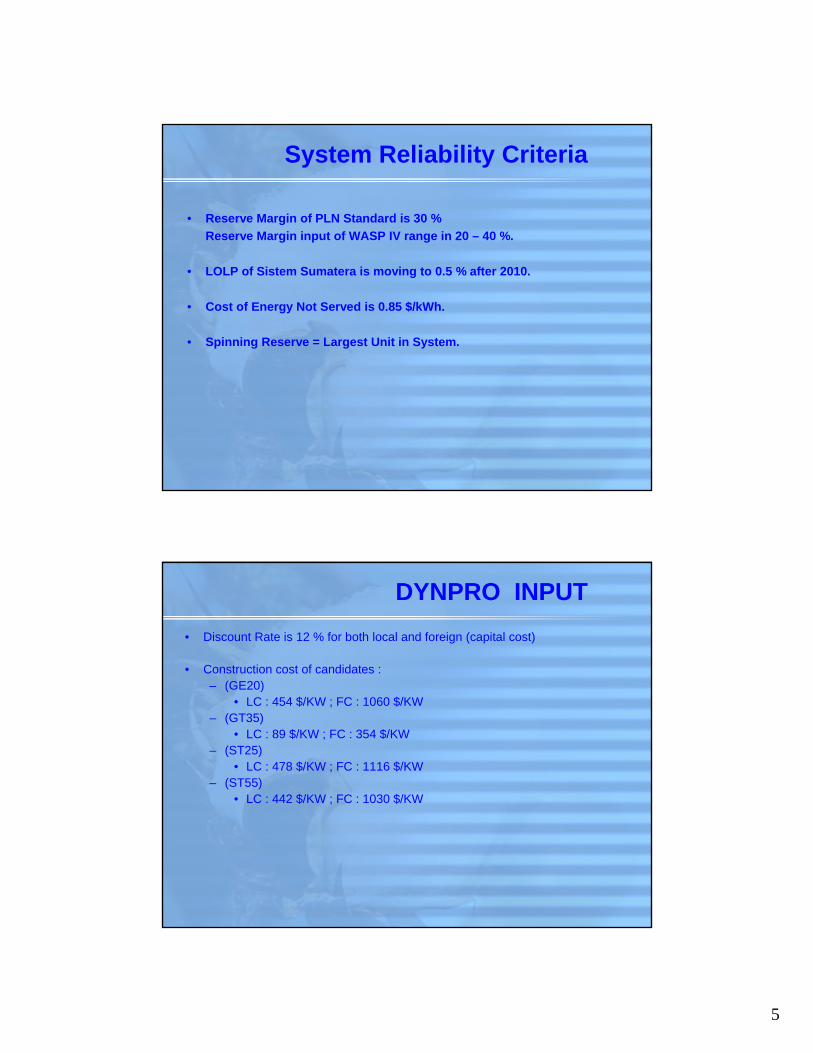
System Reliability Criteria
• Reserve Margin of PLN Standard is 30 % Reserve Margin input of WASP IV range in 20 – 40 %.
• LOLP of Sistem Sumatera is moving to 0.5 % after 2010.
• Cost of Energy Not Served is 0.85 $/kWh.
• Spinning Reserve = Largest Unit in System.
• Discount Rate is 12 % for both local and foreign (capital cost)
• Construction cost of candidates :– (GE20)
• LC : 454 $/KW ; FC : 1060 $/KW– (GT35)
• LC : 89 $/KW ; FC : 354 $/KW– (ST25)
• LC : 478 $/KW ; FC : 1116 $/KW– (ST55)
• LC : 442 $/KW ; FC : 1030 $/KW
DYNPRO INPUT
6
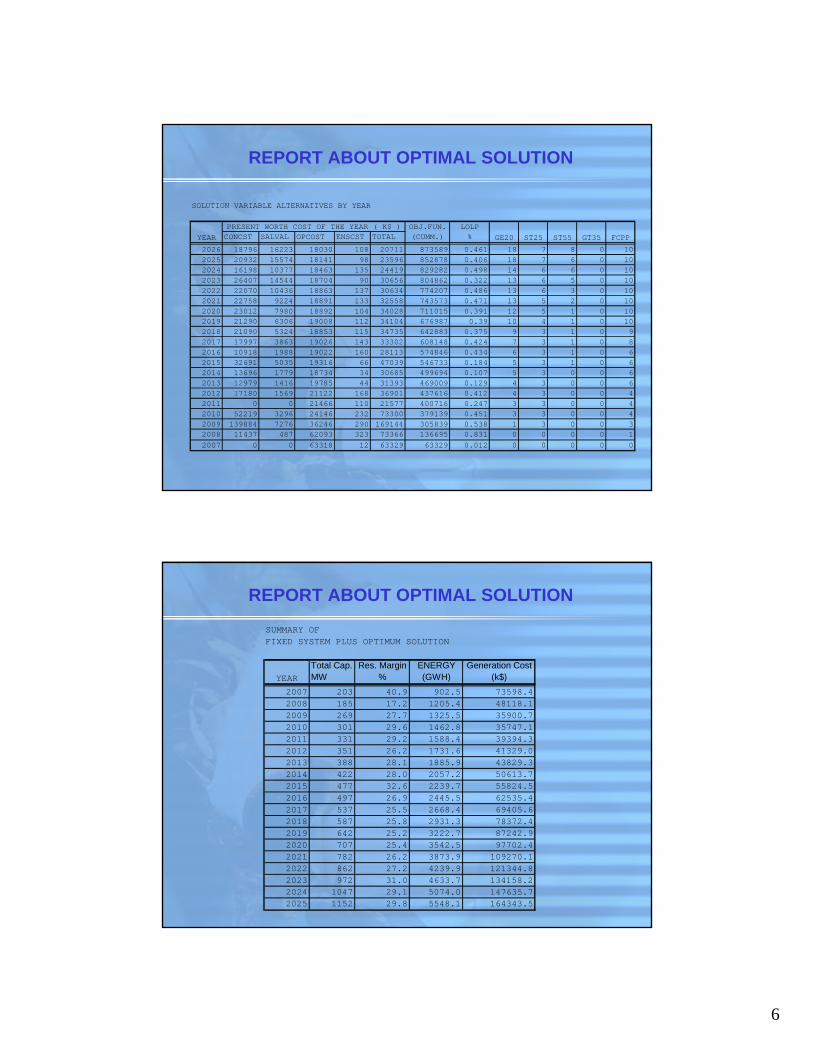
REPORT ABOUT OPTIMAL SOLUTION
SOLUTION VARIABLE ALTERNATIVES BY YEAR
OBJ.FUN. LOLPCONCST SALVAL OPCOST ENSCST TOTAL (CUMM.) %
2026 18796 16223 18030 108 20711 873589 0.461 18 7 8 0 102025 20932 15574 18141 98 23596 852878 0.406 18 7 6 0 102024 16198 10377 18463 135 24419 829282 0.498 14 6 6 0 102023 26407 14544 18704 90 30656 804862 0.322 13 6 5 0 102022 22070 10436 18863 137 30634 774207 0.486 13 6 3 0 102021 22758 9224 18891 133 32558 743573 0.471 13 5 2 0 102020 23012 7980 18892 104 34028 711015 0.391 12 5 1 0 102019 21290 6306 19008 112 34104 676987 0.39 10 4 1 0 102018 21090 5324 18853 115 34735 642883 0.375 9 3 1 0 92017 17997 3863 19026 143 33302 608148 0.424 7 3 1 0 82016 10918 1988 19022 160 28113 574846 0.434 6 3 1 0 62015 32691 5035 19316 66 47039 546733 0.184 5 3 1 0 62014 13696 1779 18734 34 30685 499694 0.107 5 3 0 0 62013 12979 1416 19785 44 31393 469009 0.129 4 3 0 0 62012 17180 1569 21122 168 36901 437616 0.412 4 3 0 0 42011 0 0 21466 110 21577 400716 0.247 3 3 0 0 42010 52219 3296 24146 232 73300 379139 0.451 3 3 0 0 42009 139884 7276 36246 290 169144 305839 0.538 1 3 0 0 32008 11437 487 62093 323 73366 136695 0.831 0 0 0 0 12007 0 0 63318 12 63329 63329 0.012 0 0 0 0 0
ST55 GT35 FCPPPRESENT WORTH COST OF THE YEAR ( K$ )
YEAR GE20 ST25
REPORT ABOUT OPTIMAL SOLUTION
SUMMARY OFFIXED SYSTEM PLUS OPTIMUM SOLUTION
Total Cap. Res. Margin ENERGY Generation CostMW % (GWH) (k$)
2007 203 40.9 902.5 73598.42008 185 17.2 1205.4 48118.12009 269 27.7 1325.5 35900.72010 301 29.6 1462.8 35747.12011 331 29.2 1588.4 39394.32012 351 26.2 1731.6 41329.02013 388 28.1 1885.9 43829.32014 422 28.0 2057.2 50613.72015 477 32.6 2239.7 55824.52016 497 26.9 2445.5 62535.42017 537 25.5 2668.4 69405.62018 587 25.8 2931.3 78372.42019 642 25.2 3222.7 87242.92020 707 25.4 3542.5 97702.42021 782 26.2 3873.9 109270.12022 862 27.2 4239.9 121344.82023 972 31.0 4633.7 134158.22024 1047 29.1 5074.0 147635.72025 1152 29.8 5548.1 164343.5
YEAR

7
Evolution Obj. FunctionDuring the Optimization Proces
873000
873500
874000
874500
875000
875500
876000
876500
1st 2nd 3th 4th 5th 6th 7th
Iteration (Var. Expansion)
Obj
. Fun
c. (M
illio
n)
Plan for future activities on WASP study
• We should update information and technology of power plant because result of WASP depands on accuraty data.
• To get more detail explanation for the participant needs more amount of time and experience.
• Try to find plants that have characteristics low cost, renewable energy, reliable, environmental friendly.

8
pakatuan pakalawiren
1
1electricity For a better life
Generation Expansion Plan of Generation Expansion Plan of
South, South East & West SulawesiSouth, South East & West Sulawesi
Bogor, February 2 2007Bogor, February 2 2007
2electricity For a better life
General Energy and Electricity PictureGeneral Energy and Electricity Picture
2
3electricity For a better life
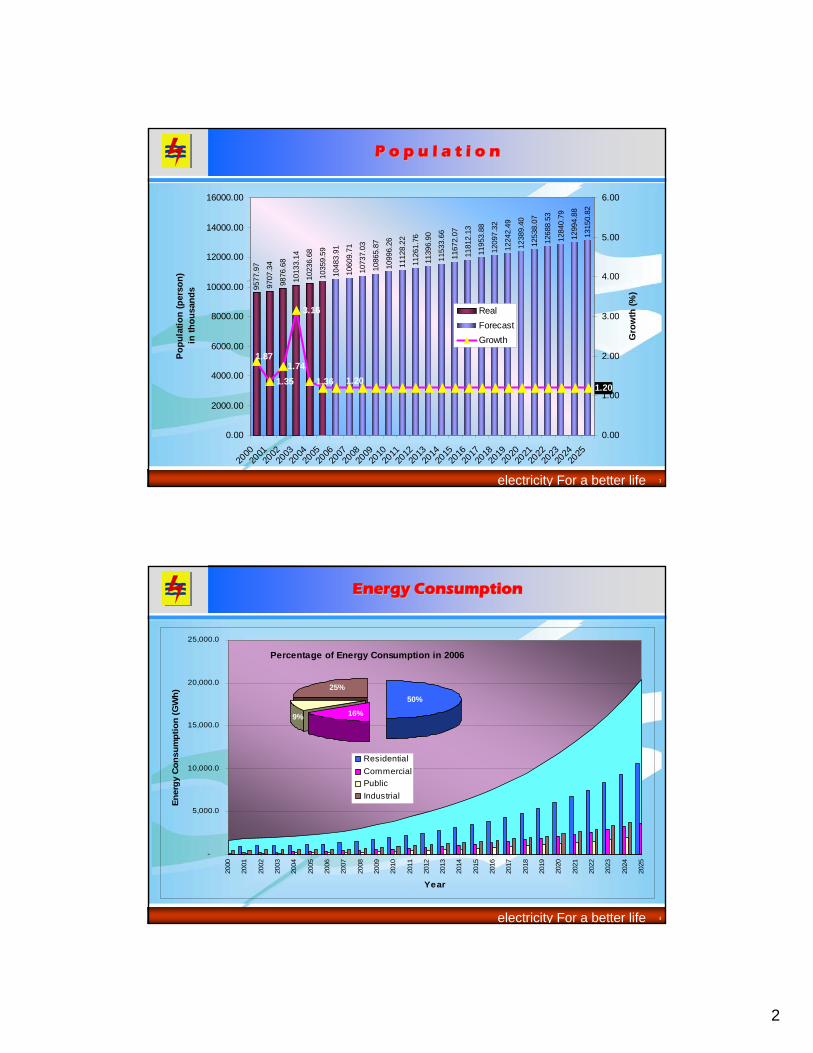
9876
.68
1023
6.68
1035
9.59
1048
3.91
1060
9.71
1073
7.03
1086
5.87
1099
6.26
1112
8.22
1126
1.76
1153
3.66
1167
2.07
1181
2.13
1195
3.88
1209
7.32
1224
2.49
1238
9.40
1253
8.07
1268
8.53
1284
0.79
1299
4.88
1315
0.82
9577
.97
1013
3.14
9707
.34 11
396.
90
1.35
3.16
1.361.20
1.20
1.871.74
0.00
2000.00
4000.00
6000.00
8000.00
10000.00
12000.00
14000.00
16000.00
2000
2001
2002
2003
2004
2005
2006
2007
2008
2009
2010
2011
2012
2013
2014
2015
2016
2017
2018
2019
2020
2021
2022
2023
2024
2025
Popu
latio
n (p
erso
n)
in th
ousa
nds
0.00
1.00
2.00
3.00
4.00
5.00
6.00
Gro
wth
(%)
RealForecastGrowth
P o p u l a t i o nP o p u l a t i o n
4electricity For a better life
-
5,000.0
10,000.0
15,000.0
20,000.0
25,000.0
2000
2001
2002
2003
2004
2005
2006
2007
2008
2009
2010
2011
2012
2013
2014
2015
2016
2017
2018
2019
2020
2021
2022
2023
2024
2025
Year
Ener
gy C
onsu
mpt
ion
(GW
h)
Percentage of Energy Consumption in 2006
16%
50%25%
9%
ResidentialCommercialPublicIndustrial
Energy ConsumptionEnergy Consumption
3
5electricity For a better life
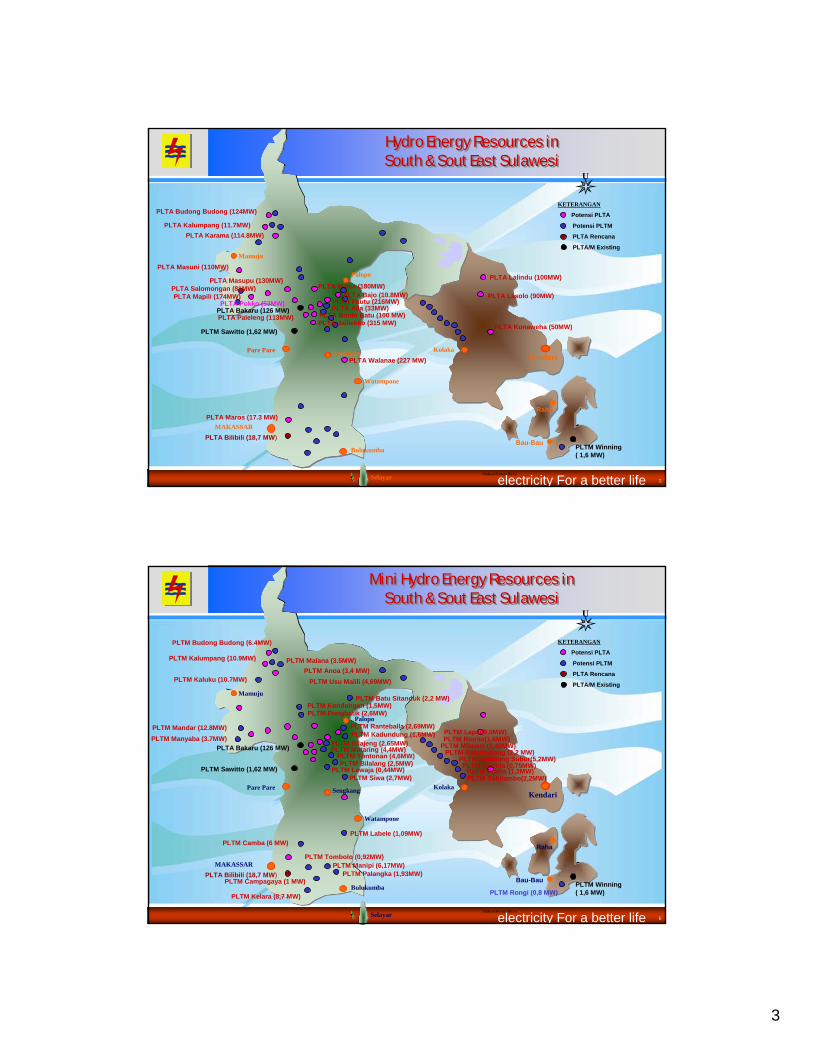
Hydro Energy Resources in South & Sout East SulawesiHydro Energy Resources in South & Sout East Sulawesi
Kendari
PLTM Winning( 1,6 MW)
Selayar
MAKASSARPLTA Bilibili (18,7 MW)
PLTA Malea (180MW)
PLTA Bakaru (126 MW)
Raha
Bau-Bau
Maksan/Rensis/Biren
U
PLTM Sawitto (1,62 MW)
Pare Pare
Palopo
Watampone
Bulukumba
Sengkang
KETERANGAN
Potensi PLTA
Potensi PLTM
PLTA Rencana
PLTA/M Existing
PLTA Budong Budong (124MW)
Mamuju
Kolaka
PLTA Kalumpang (11.7MW)
PLTA Mapili (174MW)
PLTA Karama (114.8MW)
PLTA Masuni (110MW)
PLTA Salomongan (81MW)PLTA Masupu (130MW)
PLTA Pokko (53MW)PLTA Bajo (10.8MW)
PLTA Pautu (216MW)PLTA Alla (33MW)
PLTA Bonto Batu (100 MW)PLTA Jalilekko (315 MW)
PLTA Paleleng (113MW)
PLTA Walanae (227 MW)
PLTA Maros (17.3 MW)
PLTA Lalindu (100MW)
PLTA Lasolo (90MW)
PLTA Konaweha (50MW)
6electricity For a better life
Kendari
PLTM Winning( 1,6 MW)
Selayar
PLTM Kadundung (1,6MW)
MAKASSARPLTA Bilibili (18,7 MW)
PLTA Bakaru (126 MW)
Raha
Bau-Bau
Maksan/Rensis/Biren
U
PLTM Campagaya (1 MW)
PLTM Pongbatik (2,6MW)PLTM Kondongan (1,5MW)
PLTM Batu Sitanduk (2,2 MW)
PLTM Ranteballa (2,69MW)
PLTM Usu Malili (4,69MW)PLTM Anoa (3,4 MW)
PLTM Bilalang (2,5MW)
PLTM Mataring (4,4MW)PLTM Tontonan (4,6MW)
PLTM Bilajeng (2,65MW)
PLTM Lewaja (0,44MW)
PLTM Manipi (6,17MW)PLTM Palangka (1,93MW)
PLTM Mikuasi (2,40MW)
PLTM Sabilambo(2,2MW)PLTM Sawitto (1,62 MW)
Pare Pare
Palopo
Watampone
Bulukumba
Sengkang
KETERANGAN
Potensi PLTA
Potensi PLTM
PLTA Rencana
PLTA/M Existing
PLTM Ratelimbong (2,2 MW)
PLTM Rongi (0,8 MW)
PLTM Budong Budong (6.4MW)
Mamuju
Kolaka
PLTM Kalumpang (10.9MW) PLTM Malana (3.5MW)
PLTM Mandar (12.8MW)PLTM Manyaba (3.7MW)
PLTM Siwa (2,7MW)
PLTM Labele (1,09MW)PLTM Camba (6 MW)
PLTM Tombolo (0,92MW)
PLTM Kelara (8,7 MW)
PLTM Kaluku (10.7MW)
PLTM Kembang Subur(5,2MW)PLTM Ulurina (0,75MW)
PLTM Toaha (1,2MW)
PLTM Riorita(1,6MW)PLTM Lapai(9,0MW)
Mini Hydro Energy Resources in South & Sout East Sulawesi
Mini Hydro Energy Resources in South & Sout East Sulawesi
4
7electricity For a better life
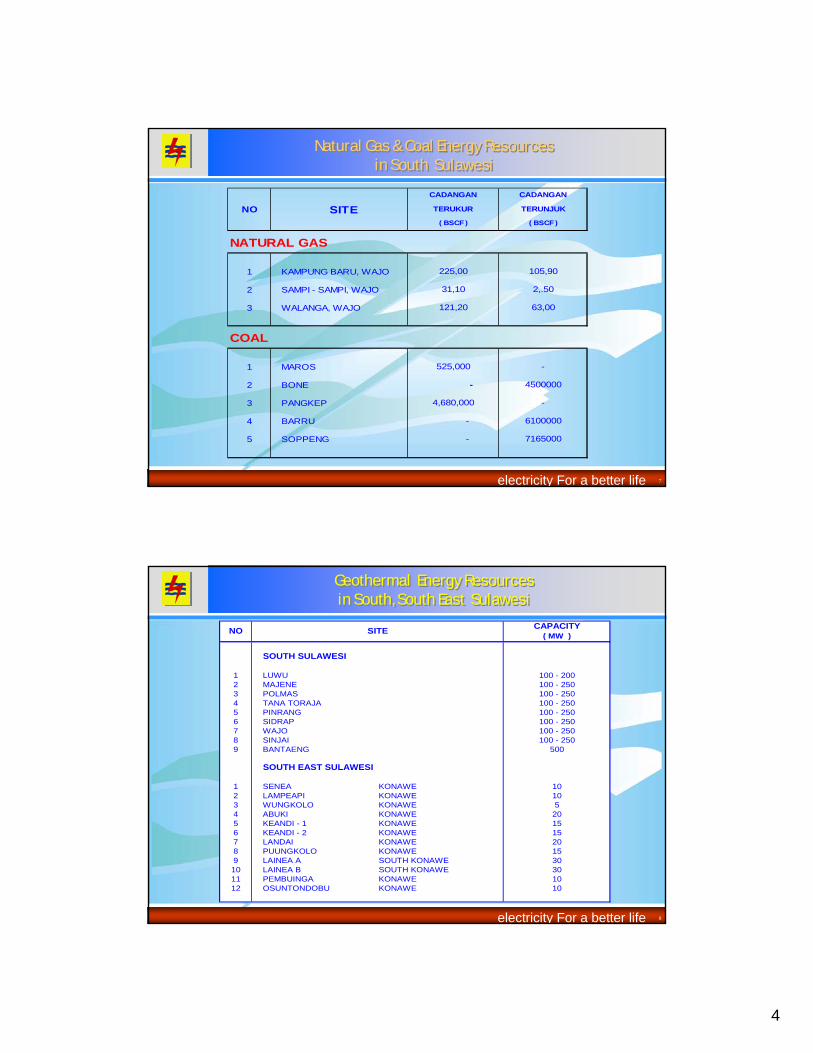
NO SITE
NATURAL GAS
1 KAMPUNG BARU, WAJO
2 SAMPI - SAMPI, WAJO
3 WALANGA, WAJO
COAL
1 MAROS
2 BONE
3 PANGKEP
4 BARRU
5 SOPPENG
-
6100000
CADANGAN
TERUKUR
( BSCF )
225,00
31,10
CADANGAN
TERUNJUK
( BSCF )
4500000
-525,000
-
121,20
105,90
2,.50
63,00
7165000
-
-
4,680,000
Natural Gas & Coal Energy Resources in South Sulawesi
Natural Gas & Coal Energy Resources in South Sulawesi
8electricity For a better life
CAPACITY( MW )
SOUTH SULAWESI
1 LUWU 100 - 2002 MAJENE 100 - 2503 POLMAS 100 - 2504 TANA TORAJA 100 - 2505 PINRANG 100 - 2506 SIDRAP 100 - 2507 WAJO 100 - 2508 SINJAI 100 - 2509 BANTAENG 500
SOUTH EAST SULAWESI
1 SENEA KONAWE 102 LAMPEAPI KONAWE 103 WUNGKOLO KONAWE 54 ABUKI KONAWE 205 KEANDI - 1 KONAWE 156 KEANDI - 2 KONAWE 157 LANDAI KONAWE 208 PUUNGKOLO KONAWE 159 LAINEA A SOUTH KONAWE 3010 LAINEA B SOUTH KONAWE 3011 PEMBUINGA KONAWE 1012 OSUNTONDOBU KONAWE 10
NO SITE
Geothermal Energy Resources in South, South East Sulawesi
Geothermal Energy Resources in South, South East Sulawesi
5
9electricity For a better life
Projections of Future Electricity RequirementsProjections of Future Electricity Requirements
10electricity For a better life
0.00%
2.00%
4.00%
6.00%
8.00%
10.00%
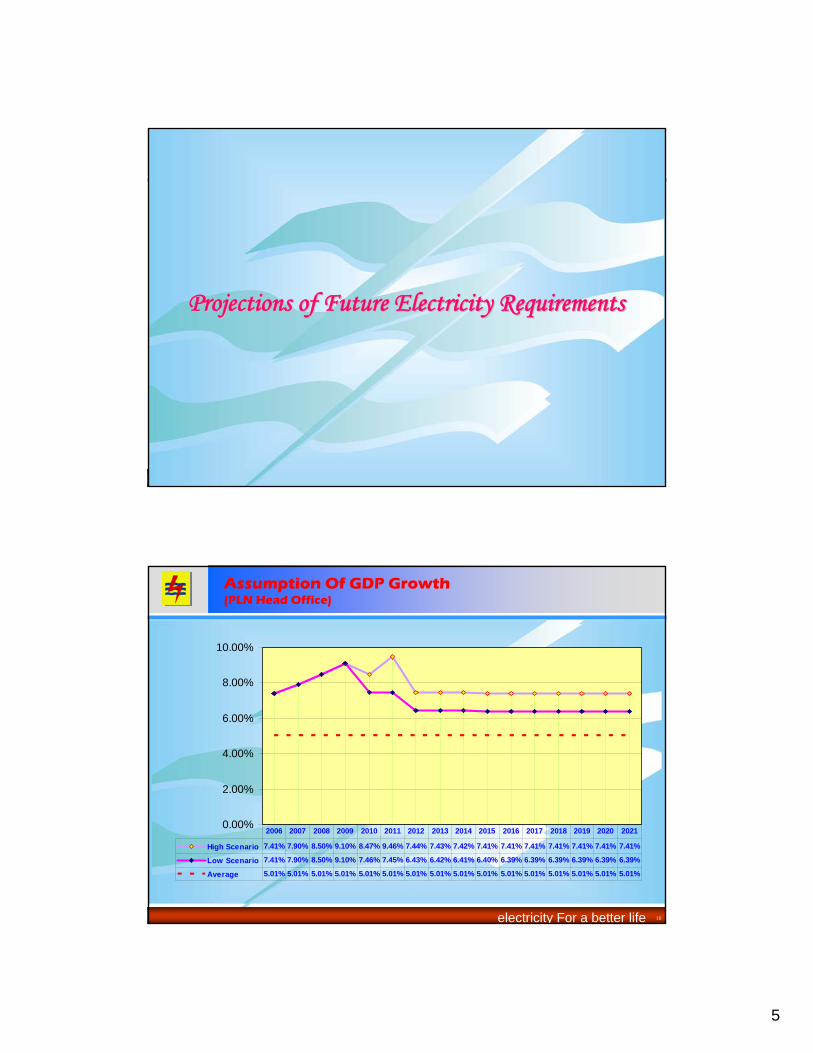
High Scenario 7.41% 7.90% 8.50% 9.10% 8.47% 9.46% 7.44% 7.43% 7.42% 7.41% 7.41% 7.41% 7.41% 7.41% 7.41% 7.41%
Low Scenario 7.41% 7.90% 8.50% 9.10% 7.46% 7.45% 6.43% 6.42% 6.41% 6.40% 6.39% 6.39% 6.39% 6.39% 6.39% 6.39%
Average 5.01% 5.01% 5.01% 5.01% 5.01% 5.01% 5.01% 5.01% 5.01% 5.01% 5.01% 5.01% 5.01% 5.01% 5.01% 5.01%
2006 2007 2008 2009 2010 2011 2012 2013 2014 2015 2016 2017 2018 2019 2020 2021
Assumption Of GDP Growth(PLN Head Office)

6
11electricity For a better life
-
25,000,000
50,000,000
75,000,000
100,000,000
125,000,000
150,000,000
175,000,000
200,000,000
225,000,000
2000 2002 2004 2006 2008 2010 2012 2014 2016 2018 2020 2022 2024
Agriculture (Real) Agriculture (Forecasting)Mining&Quarrying (Real) Mining&Quarrying (Forecasting)Manufacturing Industries (Real) Manufacturing Industries (Forecasting)Eletric, Gas &Water Supply (Real) Eletric, Gas &Water Supply (Forecasting)Construction (Real) Construction (Forecasting)Trade, Restauran&Hotel (Real) Trade, Restauran&Hotel (Forecasting)Transportation & Communication (Real) Transportation & Communication (Forecasting)Finance, Rent Of Build.&Business Service (Real) Finance, Rent Of Build.&Business Service (Forecasting)Services (Real) Services (Forecasting)Total Include Oil&Gas & Its Product
Growth
4.5%
9.1%
4.9%
7.4%
0.0%
2.0%
4.0%
6.0%
8.0%
10.0%
2000
2002
2004
2006
2008
2010
2012
2014
2016
2018
2020
2022
2024
Gross Domestic ProductGross Domestic Product
12electricity For a better life
Description of The Existing System & Future Description of The Existing System & Future Options for Electricity SupplyOptions for Electricity Supply

7
13electricity For a better life
Existing Thermal Power PlantExisting Thermal Power Plant
3909390939092400Heat Rate At Minimum Load (kcal/kWh)
1
1.5
9000
2.4
4.8
0
5170
15
30
9
10
2393.6
3
12.5
3.8
2
1
1.5
10000
8.8
1.7
0
7757
15
30
5
10
1757.5
1
14.5
4.3
1
11Pollutant II (%w of fuel)
1.51.5Pollutant I (% w of fuel)
1000010000Heat Value of the Fuel Used
8.88.8Variable O & M Cost (US$/MWh)
1.71.7Fixed O & M Cost (US$/kW-month)
00Foreign Fuel Cost (c/MkCal)
77577757Domestic Fuel Cost (c/MkCal)
3520Maintenance Class (MW)
4040Scheduled Maintenance Day
55Forced Outage Rate (%)
1010Spinning Reserve (%)
2128.42123.4Average Incremental Heat Rate (kcal/kWh)
11Fuel Type
3521Max. Generating Capacity in Each Year (MW)
10.56.4Min. Operating Level in Each Year (MW)
22Number of Unit
Jugo TurbinaTEL 1
WESTCANTEL 2
GETEL 4
ALSTOMTEL 3
14electricity For a better life
Existing Thermal Power PlantExisting Thermal Power Plant
3909358335833909Heat Rate At Minimum Load (kcal/kWh)
1
1.5
10000
8.6
3.1
0
5170
15
30
5
10
2781.7
7
12.6
3.8
4
1
1.5
5300
2.3
2.9
0
493
100
45
7
10
1807.4
5
100
32
0
11Pollutant II (%w of fuel)
1.51.5Pollutant I (% w of fuel)
1000010000Heat Value of the Fuel Used
2.60.9Variable O & M Cost (US$/MWh)
3.14.2Fixed O & M Cost (US$/kW-month)
00Foreign Fuel Cost (c/MkCal)
77577757Domestic Fuel Cost (c/MkCal)
1550Maintenance Class (MW)
3045Scheduled Maintenance Day
512Forced Outage Rate (%)
1010Spinning Reserve (%)
2292.51231Average Incremental Heat Rate (kcal/kWh)
80Fuel Type
12.550Max. Generating Capacity in Each Year (MW)
615Min. Operating Level in Each Year (MW)
60Number of Unit
MITS & SWDTEL 5
TLAMATEL 6
PLTD RENTTEL 4
CCPPTEL 3

8
15electricity For a better life
Existing Thermal Power PlantExisting Thermal Power Plant
3909296635833583Heat Rate At Minimum Load (kcal/kWh)
1
1.5
11124
0.9
3.1
0
1190
135
60
16
10
1886.4
6
135
40.5
1
1
1.5
11124
1.4
3.1
0
1190
50
45
5
10
1207.8
2
65
45
0
11Pollutant II (%w of fuel)
1.51.5Pollutant I (% w of fuel)
900011124Heat Value of the Fuel Used
2.61.4Variable O & M Cost (US$/MWh)
3.13.1Fixed O & M Cost (US$/kW-month)
00Foreign Fuel Cost (c/MkCal)
51701190Domestic Fuel Cost (c/MkCal)
1520Maintenance Class (MW)
3045Scheduled Maintenance Day
55Forced Outage Rate (%)
1010Spinning Reserve (%)
2272.81207.8Average Incremental Heat Rate (kcal/kWh)
82Fuel Type
1520Max. Generating Capacity in Each Year (MW)
4.510Min. Operating Level in Each Year (MW)
41Number of Unit
ALSTOMSKG
ALSTOMSKG1
WARTSILAPARE
INTERIMSKG2
16electricity For a better life
Existing Thermal Power PlantExisting Thermal Power Plant
358335833583Heat Rate At Minimum Load (kcal/kWh)
1
1.5
5300
0.9
4.2
0
493
50
45
12
10
1525.3
0
50
20
0
1
1.5
5300
0.9
4.2
0
493
100
45
12
10
1388.1
0
100
50
0
1Pollutant II (%w of fuel)
1.5Pollutant I (% w of fuel)
5300Heat Value of the Fuel Used
0.9Variable O & M Cost (US$/MWh)
4.2Fixed O & M Cost (US$/kW-month)
0Foreign Fuel Cost (c/MkCal)
493Domestic Fuel Cost (c/MkCal)
100Maintenance Class (MW)
45Scheduled Maintenance Day
12Forced Outage Rate (%)
10Spinning Reserve (%)
1388.1Average Incremental Heat Rate (kcal/kWh)
0Fuel Type
100Max. Generating Capacity in Each Year (MW)
50Min. Operating Level in Each Year (MW)
0Number of Unit
PLTU KFFLAKT
PLTU PLNJEN1
PLTU BSWJEN2
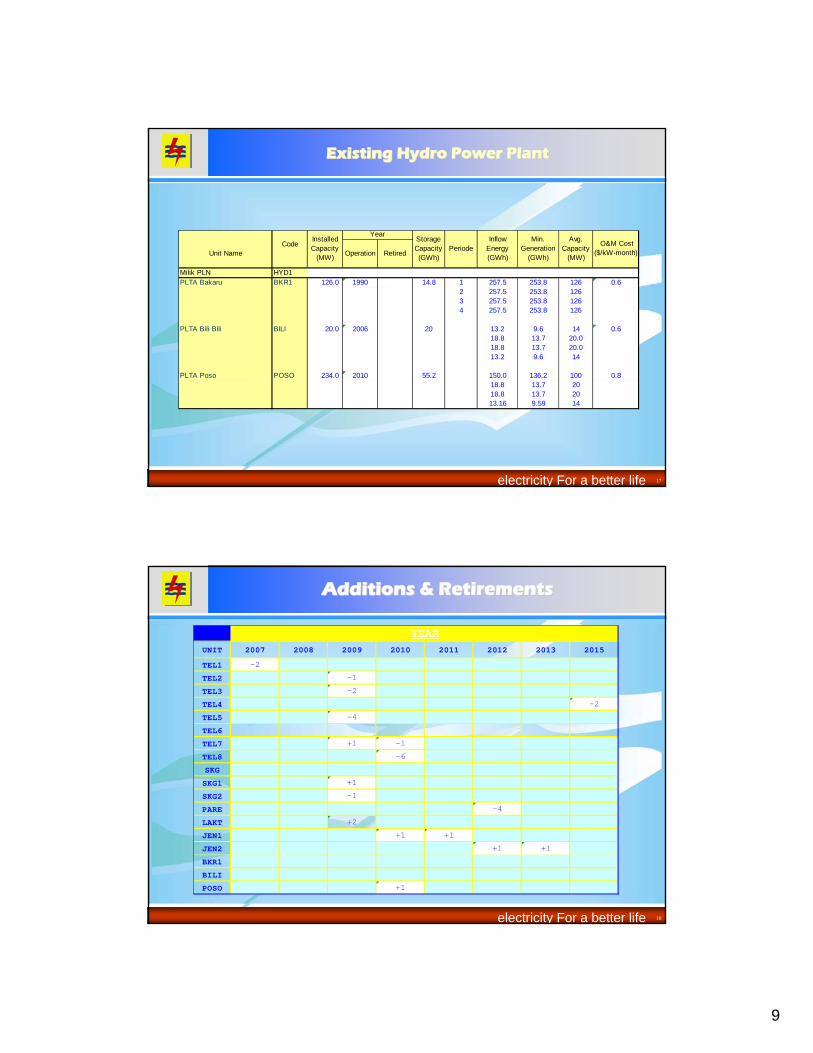
9
17electricity For a better life
Existing Hydro Power PlantExisting Hydro Power Plant
CodeUnit Name Operation Retired
Milik PLN HYD1PLTA Bakaru BKR1 126.0 1990 14.8 1 257.5 253.8 126 0.6
2 257.5 253.8 1263 257.5 253.8 1264 257.5 253.8 126
PLTA Bili Bili BILI 20.0 2006 20 13.2 9.6 14 0.618.8 13.7 20.018.8 13.7 20.013.2 9.6 14
PLTA Poso POSO 234.0 2010 55.2 150.0 136.2 100 0.818.8 13.7 2018.8 13.7 2013.16 9.59 14
Installed Capacity
(MW)
Storage Capacity (GWh)
O&M Cost ($/kW-month)
Year
PeriodeInflow
Energy (GWh)
Min. Generation
(GWh)
Avg. Capacity
(MW)
18electricity For a better life
Additions & RetirementsAdditions & Retirements
UNIT 2007 2008 2009 2010 2011 2012 2013 2015
TEL1 -2
TEL2 -1
TEL3 -2
TEL4 -2
TEL5 -4
TEL6
TEL7 +1 -1
TEL8 -6
SKG
SKG1 +1
SKG2 -1
PARE -4
LAKT +2
JEN1 +1 +1
JEN2 +1 +1
BKR1
BILI
POSO +1
YEAR
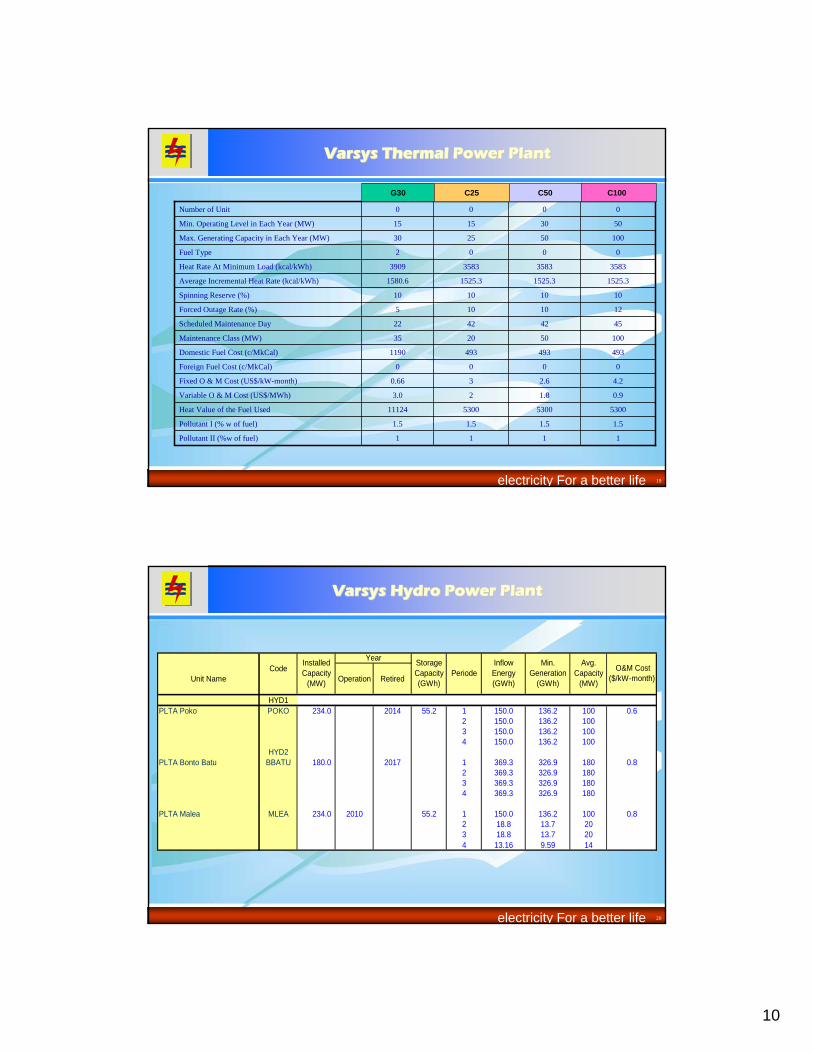
10
19electricity For a better life
VarsysVarsys Thermal Power PlantThermal Power Plant
3583358335833909Heat Rate At Minimum Load (kcal/kWh)
1
1.5
11124
3.0
0.66
0
1190
35
22
5
10
1580.6
2
30
15
0
1
1.5
5300
2
3
0
493
20
42
10
10
1525.3
0
25
15
0
11Pollutant II (%w of fuel)
1.51.5Pollutant I (% w of fuel)
53005300Heat Value of the Fuel Used
0.91.8Variable O & M Cost (US$/MWh)
4.22.6Fixed O & M Cost (US$/kW-month)
00Foreign Fuel Cost (c/MkCal)
493493Domestic Fuel Cost (c/MkCal)
10050Maintenance Class (MW)
4542Scheduled Maintenance Day
1210Forced Outage Rate (%)
1010Spinning Reserve (%)
1525.31525.3Average Incremental Heat Rate (kcal/kWh)
00Fuel Type
10050Max. Generating Capacity in Each Year (MW)
5030Min. Operating Level in Each Year (MW)
00Number of Unit
G30 C25 C100C50
20electricity For a better life
VarsysVarsys Hydro Power PlantHydro Power Plant
CodeUnit Name Operation Retired
HYD1PLTA Poko POKO 234.0 2014 55.2 1 150.0 136.2 100 0.6
2 150.0 136.2 1003 150.0 136.2 1004 150.0 136.2 100
HYD2PLTA Bonto Batu BBATU 180.0 2017 1 369.3 326.9 180 0.8
2 369.3 326.9 1803 369.3 326.9 1804 369.3 326.9 180
PLTA Malea MLEA 234.0 2010 55.2 1 150.0 136.2 100 0.82 18.8 13.7 203 18.8 13.7 204 13.16 9.59 14
Installed Capacity
(MW)
Storage Capacity (GWh)
O&M Cost ($/kW-month)
Year
PeriodeInflow Energy (GWh)
Min. Generation
(GWh)
Avg. Capacity
(MW)
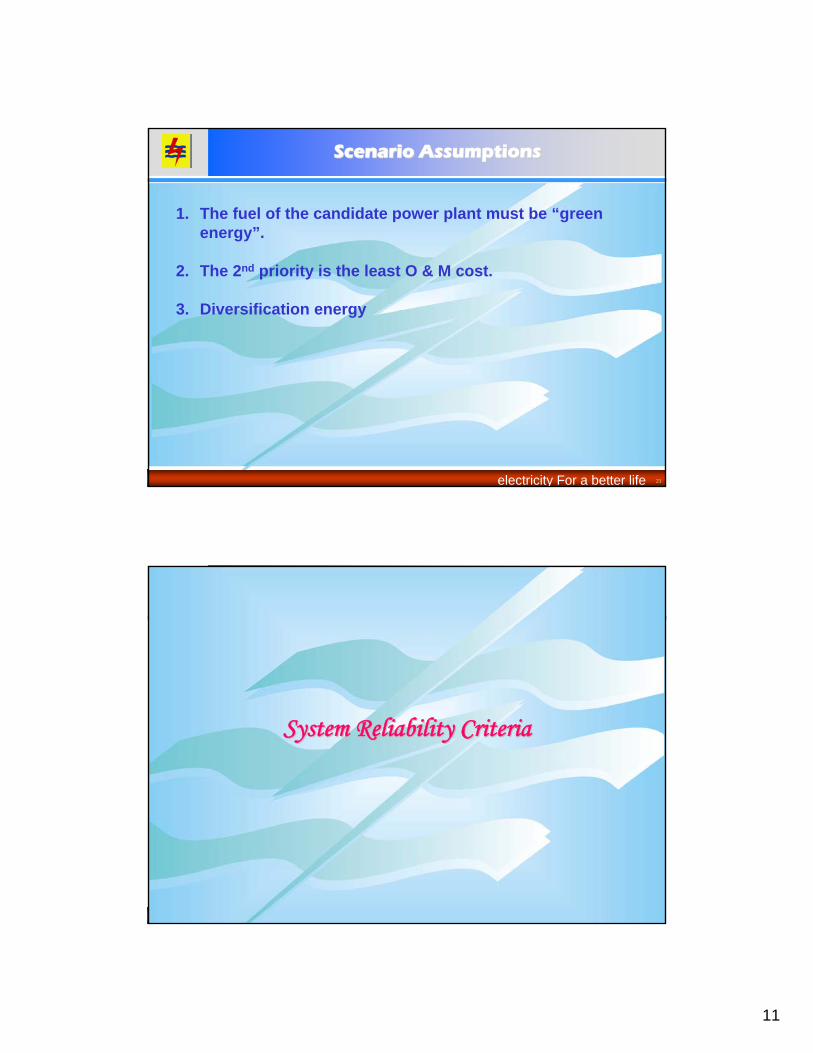
11
21electricity For a better life
Scenario AssumptionsScenario Assumptions
1. The fuel of the candidate power plant must be “green energy”.
2. The 2nd priority is the least O & M cost.
3. Diversification energy
22electricity For a better life
System Reliability CriteriaSystem Reliability Criteria
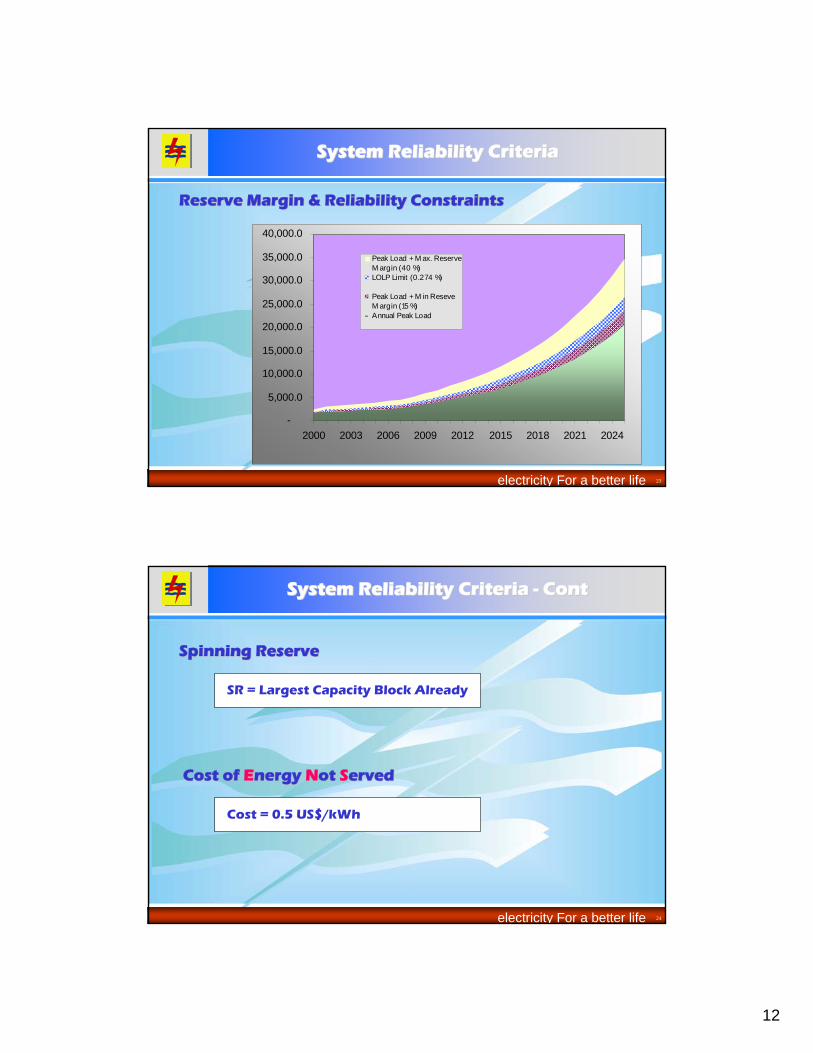
12
23electricity For a better life
System Reliability CriteriaSystem Reliability Criteria
Reserve Margin & Reliability ConstraintsReserve Margin & Reliability Constraints
-
5,000.0
10,000.0
15,000.0
20,000.0
25,000.0
30,000.0
35,000.0
40,000.0
2000 2003 2006 2009 2012 2015 2018 2021 2024
Peak Load + M ax. ReserveM argin (40 %)LOLP Limit (0.274 %)
Peak Load + M in ReseveM argin (15 %)Annual Peak Load
24electricity For a better life
System Reliability Criteria System Reliability Criteria -- ContCont
Spinning ReserveSpinning Reserve
SR = Largest Capacity Block Already
Cost of Cost of EEnergy nergy NNot ot SServederved
Cost = 0.5 US$/kWh
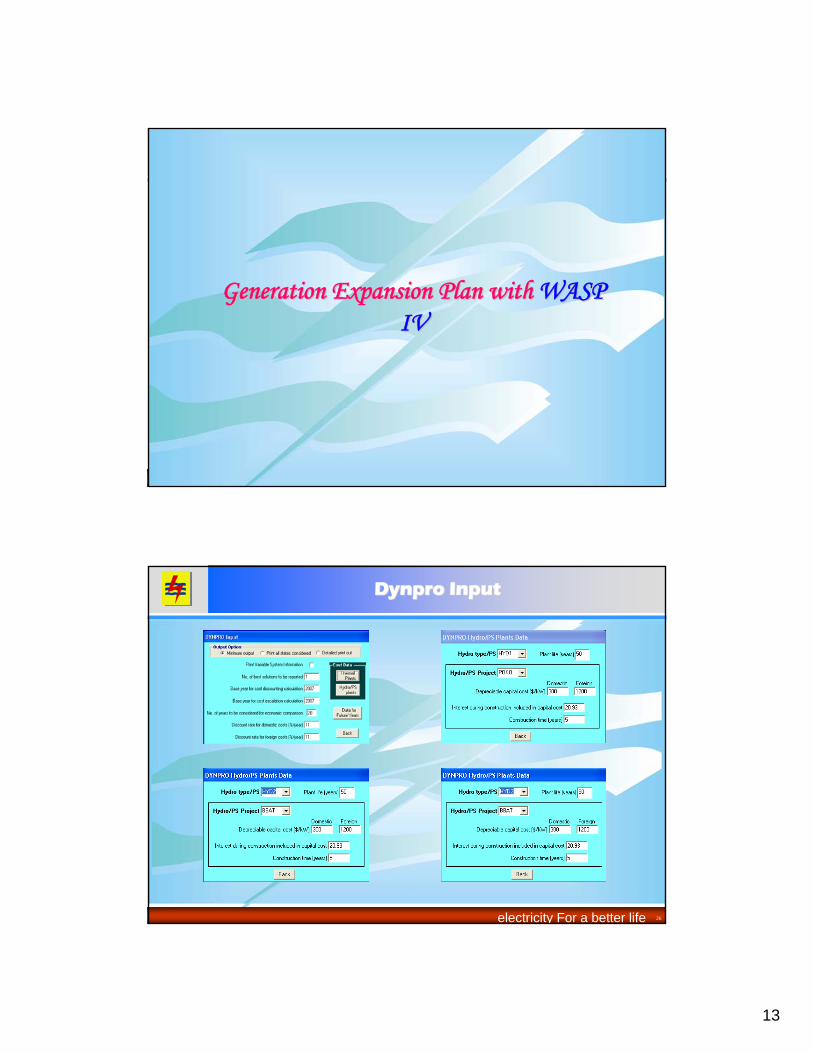
13
25electricity For a better life
Generation Expansion Plan with Generation Expansion Plan with WASP WASP IVIV
26electricity For a better life
DynproDynpro InputInput
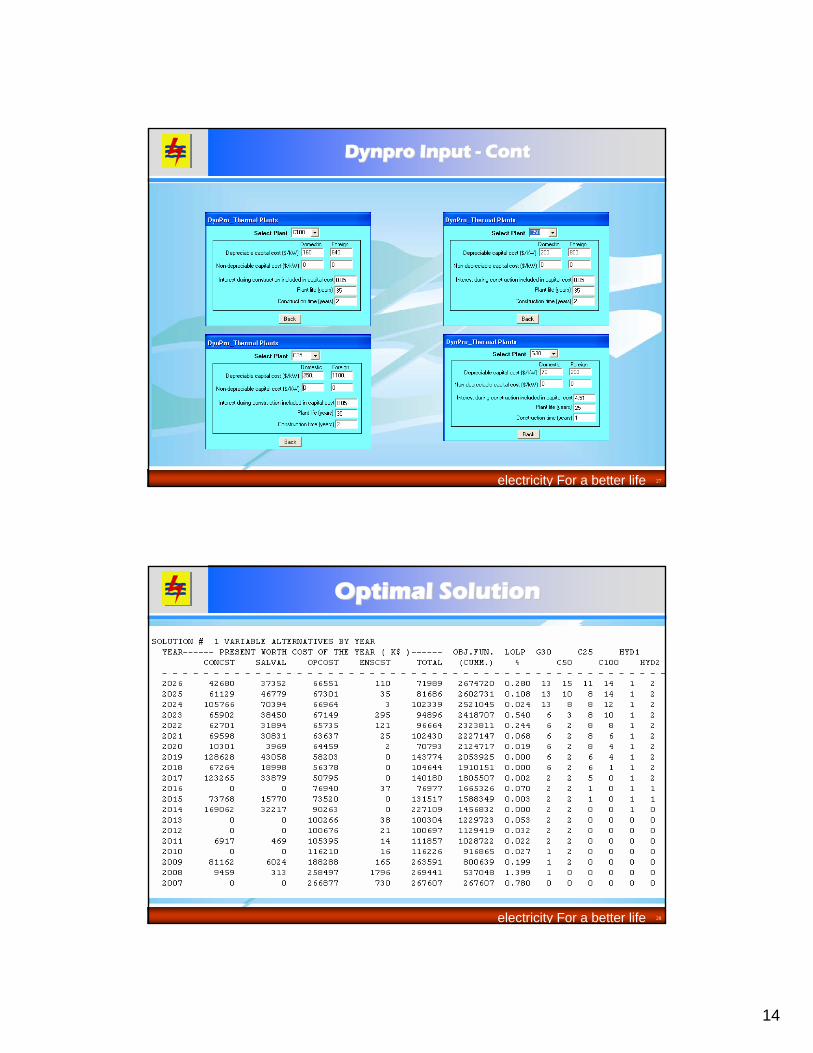
14
27electricity For a better life
DynproDynpro Input Input -- ContCont
28electricity For a better life
Optimal SolutionOptimal Solution

15
29electricity For a better life
Sensitivity AnalysesSensitivity Analyses
Sensitivity Analysis demands on the external and internal factor
For Example :
1. Government Policy about fuel price, interest rate, GDP Growt & escalation
2. Hydrology3. Technology4. Diversification Energy5. Least Cost Model
Case :
The management of the utility makes a rule that the minimum capacity of the power plant is more than 10 % of the peak load in a system. The peak Load of South Sulawesi is 445 MW in 2006. So, it is analysed if the 25 MW Coal Power Plant wouldn’t be in the system.
30electricity For a better life
Sensitivity Analyses Sensitivity Analyses -- ContCont
Dynpro report of the case without 25 MW Coal Power Plant
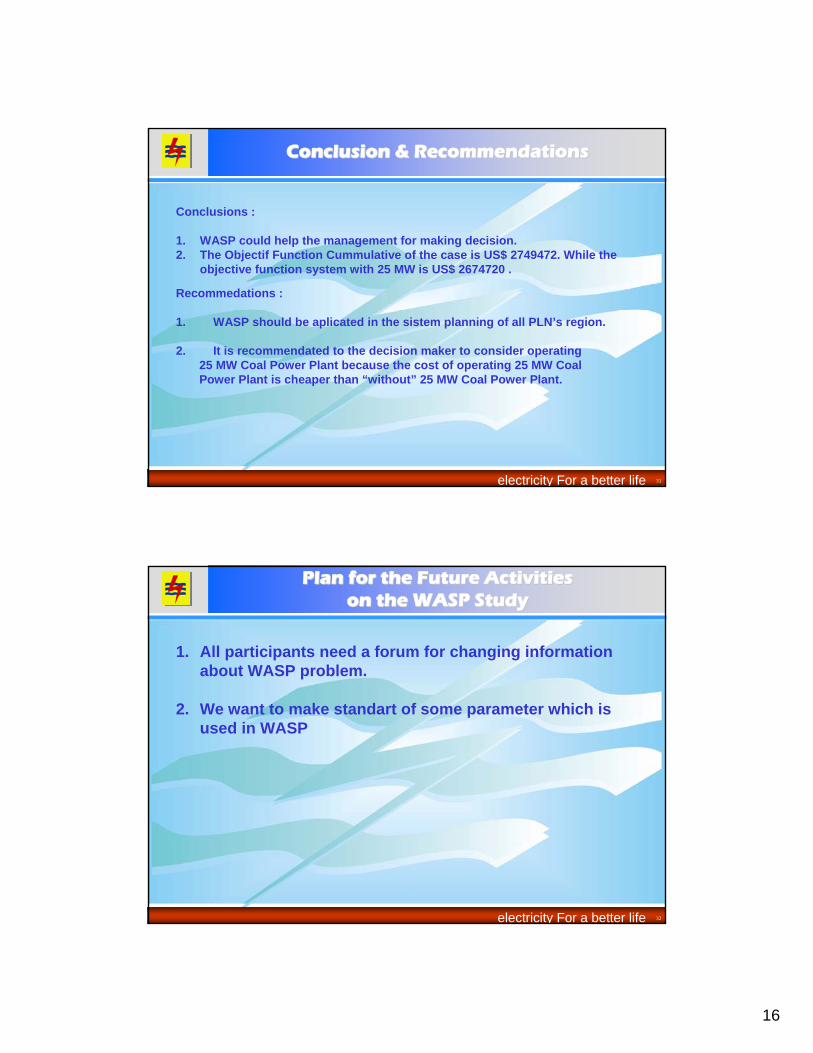
16
31electricity For a better life
Conclusion & RecommendationsConclusion & Recommendations
Conclusions :
1. WASP could help the management for making decision.2. The Objectif Function Cummulative of the case is US$ 2749472. While the
objective function system with 25 MW is US$ 2674720 .
Recommedations :
1. WASP should be aplicated in the sistem planning of all PLN’s region.
2. It is recommendated to the decision maker to consider operating25 MW Coal Power Plant because the cost of operating 25 MW Coal Power Plant is cheaper than “without” 25 MW Coal Power Plant.
32electricity For a better life
Plan for the Future Activities Plan for the Future Activities on the WASP Studyon the WASP Study
1. All participants need a forum for changing information about WASP problem.
2. We want to make standart of some parameter which is used in WASP

17
33electricity For a better life
Terima Kasih
Losari Beach 2006

1
Generation Expansion Planning of SumateraElectricity for a better life
PT PLN (PERSERO)P3B SUMATERA
Sumatera Interconnection System
Malaysia
JAWA
PLTG
BENGKULU
KULIM
PIP
S.EMPAT
SUMBAR
N A D
SUMUT
RIAU
P. Selincah
Aur Duri
JAMBI
PLTG
BETUNG
TL.KELAPA
BORANG
L.LINGGAU
KERAMASANMARIANA
PRABUMULIH
SP.TIGA
BK.ASAMLAHAT
BATURAJAP.ALAM
SUMSEL
LAMPUNG
BANGKO
MUARO BUNGO
2006Peak Load Sumbagut : 1.051,1 MW Peak Load Sumbagsel : 1.372,8 MWInstalled Capacity : 3.480,2 MW
PLN Pembangkitan Sumbagut : 1.579,55 MWPLN Pembangjkitan Sumbagsel : 1.638,36 MWPT Inalum : 50,00 MWIPP : 150,00 MWRental : 110,14 MW
Energy Production (until TW III 2006 ) : 10.896,48 GWhGeneration Mix 2006 (until TW III) :
Coal : 18,42 %Gas : 22,14 %Oil Fuel : 39,86 %Hydro : 19,58 %
Transformer Cap. : 4.949 MVATrans. Lenght : 8.809,87 kms ( Length of Sumatera : 1.800 km )
U
2007
Notes :Notes :EksistingEksisting 70 kV70 kVEksistingEksisting 150 kV150 kVEksistingEksisting 275 kV (275 kV (OperasiOperasi 150 kV)150 kV)PlaningPlaning 150 kV150 kV

2
Fuel Mix of Sumatera
PLTG
KULIM
PIP
S.EMPAT
P. Selincah
Aur Duri
PLTG
BETUNG
TL.KELAPA
BORANG
L.LINGGAU
KERAMASANMARIANA
PRABUMULIH
SP.TIGA
BK.ASAMLAHAT
BATURAJAP.ALAM
BANGKO
MUARO BUNGO
Oil Fuel7.10%
Gas29.30%
Coal33.40%
Hydro30.20%
Oil Fuel80.00%
Hydro6.60%Gas
13.40%
PLTG HSD2.60%
PLTU Gas1.30%PLTG Gas
11.60%PLTD IDO0.80%
PLTD HSD3.00%
PLTD MFO0.70%
PLTGU Gas16.30%
PLTU Bbara33.40%
PLTA30.20%
PLTD HSD3.50%
PLTU MFO13.40%PLTG HSD
4.60%
PLTA6.60%
PLTGU HSD, 58.50%
PLTU Gas0.04%
PLTGU Gas, 13.30%
SumbagselSumbagselSumbagutSumbagut
Fuel Mix of Sumatera
PLTG
KULIM
PIP
S.EMPAT
P. Selincah
Aur Duri
PLTG
BETUNG
TL.KELAPA
BORANG
L.LINGGAU
KERAMASANMARIANA
PRABUMULIH
SP.TIGA
BK.ASAMLAHAT
BATURAJAP.ALAM
BANGKO
MUARO BUNGO
Coal18.42%
Gas22.14%
Oil Fuel39.86%
Hydro19.58%

3
PROVINCE CUSTOMER 2007
NAD 749,240 Sumut 2,322,209 Sumbar 827,268 Riau 640,354 S2JB 1,318,407 Lampung 832,364
P3B Sumatera 6,689,842
Sumatera in Number
PROVINCE POPULATION 2007
NAD 3,955,122 Sumut 12,599,356 Sumbar 4,735,085 Riau 5,334,530 S2JB 11,003,162 Lampung 7,145,990
SUMATERA 44,773,244
Number of population
Polulation Growth : 5 %
Number of customer
Customer Growth : 5 %PEAK DEMAND 2007-2026
Growth : 9.9 %
6,516.8
2,724.9
16,234
-
2,000.0
4,000.0
6,000.0
8,000.0
10,000.0
12,000.0
14,000.0
16,000.0
18,000.0
2007 2008 2009 2010 2011 2012 2013 2014 2015 2016 2017 2018 2019 2020 2021 2022 2023 2024 2025 2026
MW
0
0.1
0.2
0.3
0.4
0.5
0.6
0.7
0.8
0.9
1
0.00 0.17 0.35 0.52 0.70 0.87
Import : 45 MW, 6 hoursPeak Periode
Load Duration Curve
0
0.1
0.2
0.3
0.4
0.5
0.6
0.7
0.8
0.9
1
0.00 0.17 0.35 0.52 0.70 0.87
Export : 15 MW, 18 hoursOff-Peak Periode
0.00
0.50
1.00
0.0000 0.1812 0.3625 0.5437 0.7250 0.9062
Original LDC
0.0
0.5
1.0
0.0000 0.1812 0.3625 0.5437 0.7250 0.9062
Final LDC
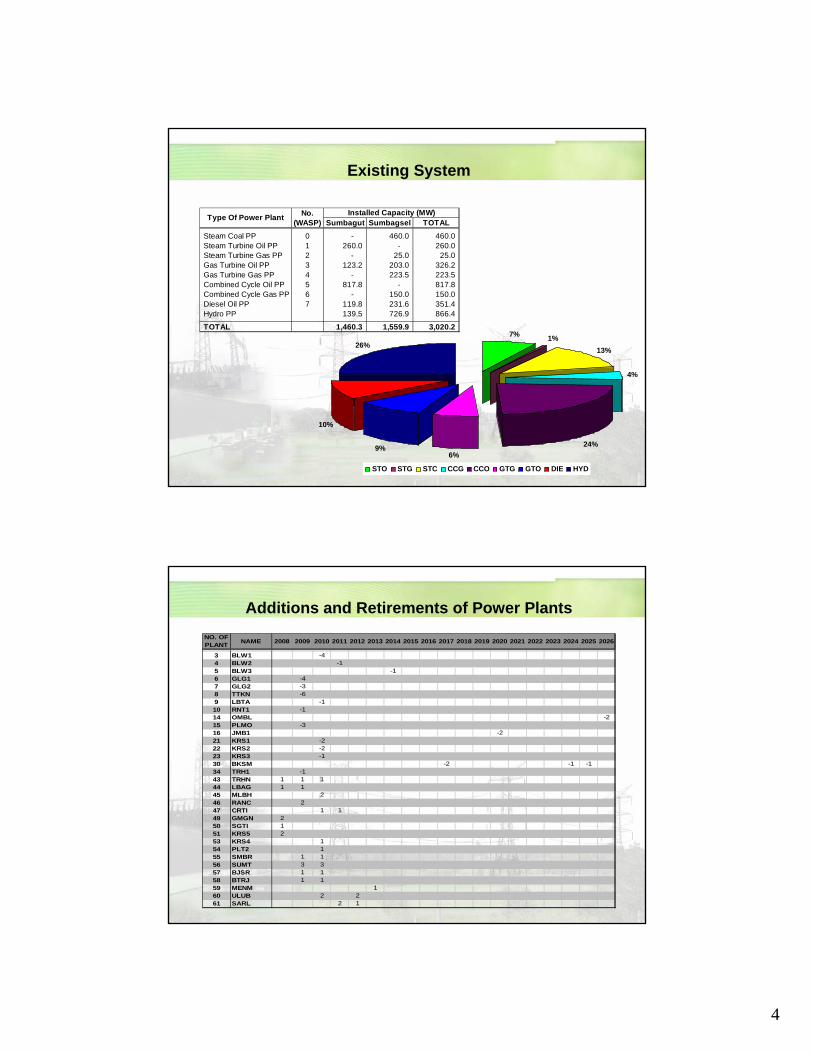
4
Existing System
7% 1%13%
4%
24%6%
9%
10%
26%
STO STG STC CCG CCO GTG GTO DIE HYD
Sumbagut Sumbagsel TOTALSteam Coal PP 0 - 460.0 460.0 Steam Turbine Oil PP 1 260.0 - 260.0 Steam Turbine Gas PP 2 - 25.0 25.0 Gas Turbine Oil PP 3 123.2 203.0 326.2 Gas Turbine Gas PP 4 - 223.5 223.5 Combined Cycle Oil PP 5 817.8 - 817.8 Combined Cycle Gas PP 6 - 150.0 150.0 Diesel Oil PP 7 119.8 231.6 351.4 Hydro PP 139.5 726.9 866.4
TOTAL 1,460.3 1,559.9 3,020.2
Type Of Power Plant Installed Capacity (MW)No. (WASP)
Additions and Retirements of Power PlantsNO. OF PLANT NAME 2008 2009 2010 2011 2012 2013 2014 2015 2016 2017 2018 2019 2020 2021 2022 2023 2024 2025 2026
3 BLW1 -44 BLW2 -15 BLW3 -16 GLG1 -47 GLG2 -38 TTKN -69 LBTA -110 RNT1 -114 OMBL -215 PLMO -316 JMB1 -221 KRS1 -222 KRS2 -223 KRS3 -130 BKSM -2 -1 -134 TRH1 -143 TRHN 1 1 144 LBAG 1 145 MLBH 246 RANC 247 CRTI 1 149 GMGN 250 SGTI 151 KRS5 253 KRS4 154 PLT2 155 SMBR 1 156 SUMT 3 357 BJSR 1 158 BTRJ 1 159 MENM 160 ULUB 2 261 SARL 2 1

5
Energy Resources of Sumatera
POTENSI GAS ALAM
BATU BARA
1. Sumut ( 2.016,841 BSCF )2. Riau ( 300 juta SCF ) ==> ( 300 MMSCF )3. Jambi ( 1.011BSCF )4. Grisik - Sumsel ( 1.479,62 BSCF )5. Prabumulih - Sumsel ( 1.421,69 BSCF )
1. Cerenti - Riau ( 1.675,6 juta ton )2. Sawah Lunto - Sumbar ( 205,9 juta Ton )3. Muara Enim - Sumsel ( 9.538 juta Ton )4. Musi Banyu Asin - Sumsel ( 3.313 juta Ton )5. Jambi ( 367 juta Ton )6. Bengkulu Selatan ( 13,867 juta Ton )7. Bengkulu Utara ( 30,22 juta Ton )8. Blambangan Umpu - Lampung ( 131,27 juta Ton )9. Kec. Aceh Barat - NAD ( 1.074,543 juta Ton )
PANAS BUMI
POTENSI HIDRO
1. Sarulla - Sumut ( 1200 MWe )2. Kab. Pasunan- Sumbar ( 365 MWe )3. Kab. Solok - Sumbar ( 325 MWe )4. Kerinci - Jambi ( 100 MWe )5. Lahat - Sumsel ( 470 MWe )6. OKU - Sumsel (47 MWe )7. Bukit Daun - Bengkulu ( 250 MWe )8. Gedang Hululais -Bengkulu ( 500 MWe )9. Desa Tambang Sawah - Bengkulu ( 400 MWe )10. Ulu Belu - Lampung ( 400 MWe )11. Suoh - Lampung ( 300 MWe )12. Sekincau - Lampung ( 130 MWe )
14. Sibayak - Sumut ( 100 MWe )15. Kab. Aceh Besar - NAD ( 50 MWe )16. Sabang - NAD ( 25 MWe )
1. Sumut ( 690MW )2. Riau ( 763 MW )3. Batang Maninjau - Jambi ( 300 MW )4. Muara Enim ( 319,8 MW )5. Ketahun ( 84 MW )6. Musi ( 210 MW )7. Peusangan - NAD ( 86,4 MW )8. Tampur - NAD ( 428 MW )
13. G. Raja Basa - Lampung ( 40MWe )
1
14
1
1
2
2
3
2
2
1
5
3
3
4
4
4
4
5
53
6
5 6
6
7
7
9
8
8
712
10
11 138
7
15
16
8
9
-
200.00
400.00
600.00
800.00
1,000.00
1,200.00
0 10 20 30 40 50 60 70 80 90 100
COAL200 CC150 GT100 COAL600
VARSYS of WASP IV (Sumatera)
The Candidate of plants- (STC2) Steam Turbine 200 MW- (GT10) Gas Turbine 100 MW- (CC15) Combined Cycle 150 MW- (STC6) Steam Turbine 600 MW- (ASH3) Hydro Plant 154 MW- (MRGN) Hydro Plant 350 MW
Scenario assumption of varsys(ASH3) available year in 2013(MRGN) available year in 2013
-
200.00
400.00
0 10 20 30 40
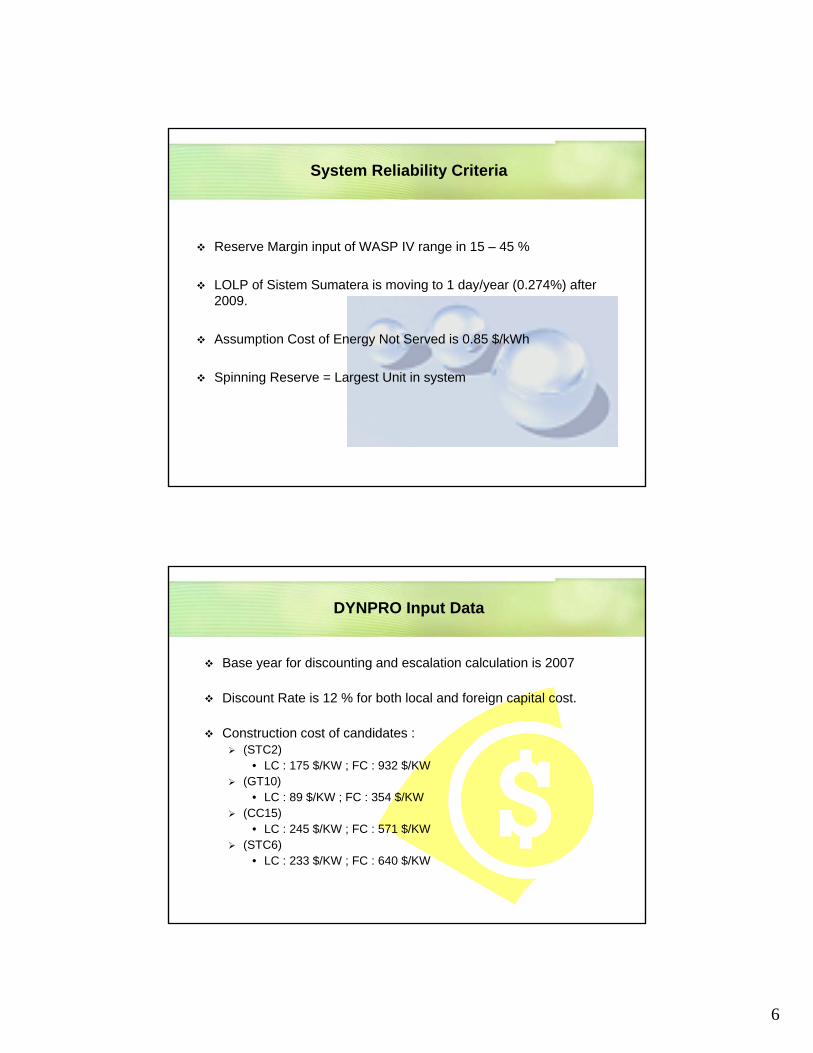
6
System Reliability Criteria
Reserve Margin input of WASP IV range in 15 – 45 %
LOLP of Sistem Sumatera is moving to 1 day/year (0.274%) after 2009.
Assumption Cost of Energy Not Served is 0.85 $/kWh
Spinning Reserve = Largest Unit in system
DYNPRO Input Data
Base year for discounting and escalation calculation is 2007
Discount Rate is 12 % for both local and foreign capital cost.
Construction cost of candidates :(STC2)
• LC : 175 $/KW ; FC : 932 $/KW(GT10)
• LC : 89 $/KW ; FC : 354 $/KW(CC15)
• LC : 245 $/KW ; FC : 571 $/KW(STC6)
• LC : 233 $/KW ; FC : 640 $/KW
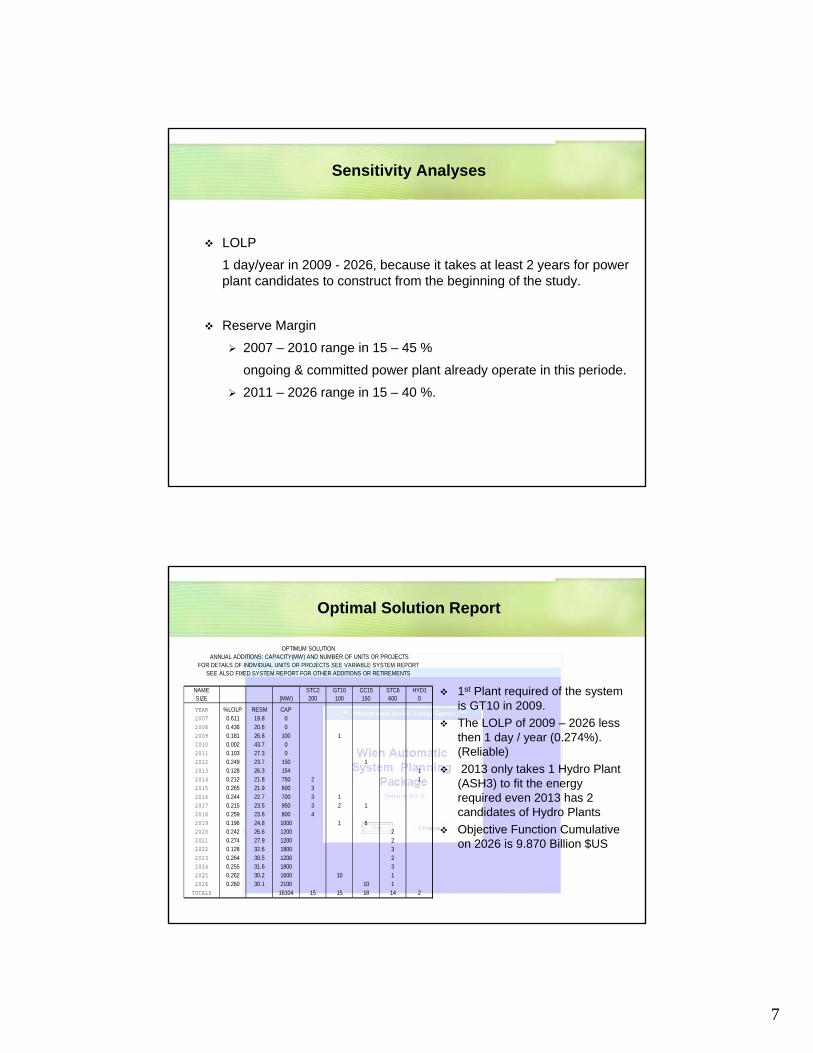
7
Sensitivity Analyses
LOLP
1 day/year in 2009 - 2026, because it takes at least 2 years for power plant candidates to construct from the beginning of the study.
Reserve Margin
2007 – 2010 range in 15 – 45 %
ongoing & committed power plant already operate in this periode.
2011 – 2026 range in 15 – 40 %.
Optimal Solution Report
1st Plant required of the system is GT10 in 2009.The LOLP of 2009 – 2026 less then 1 day / year (0.274%). (Reliable)2013 only takes 1 Hydro Plant
(ASH3) to fit the energy required even 2013 has 2 candidates of Hydro PlantsObjective Function Cumulative on 2026 is 9.870 Billion $US
NAME STC2 GT10 CC15 STC6 HYD1SIZE (MW) 200 100 150 600 0
YEAR %LOLP RESM CAP2007 0.611 19.8 02008 0.436 20.6 02009 0.181 26.8 100 12010 0.002 43.7 02011 0.103 27.3 02012 0.249 23.7 150 12013 0.128 26.3 154 12014 0.212 21.8 750 2 12015 0.265 21.9 600 32016 0.244 22.7 700 3 12017 0.215 23.5 950 3 2 12018 0.259 23.6 800 42019 0.196 24.8 1000 1 62020 0.242 26.6 1200 22021 0.274 27.9 1200 22022 0.128 32.6 1800 32023 0.264 30.5 1200 22024 0.255 31.6 1800 32025 0.262 30.2 1600 10 12026 0.260 30.1 2100 10 1
TOTALS 16104 15 15 18 14 2
SEE ALSO FIXED SYSTEM REPORT FOR OTHER ADDITIONS OR RETIREMENTSFOR DETAILS OF INDIVIDUAL UNITS OR PROJECTS SEE VARIABLE SYSTEM REPORT
ANNUAL ADDITIONS: CAPACITY(MW) AND NUMBER OF UNITS OR PROJECTSOPTIMUM SOLUTION

8
Conclusions and Recomendations
WASP is one of reliable tools to analyze and optimize generationexpansion planning.
To get a good result required accurate data and sensitive analysis (What if question).
To get more detail explanation for the participant needs more amount of time and experience.
Plan for future activities on WASP study
Try to find plants that have characteristics low cost, renewableenergy, reliable, environmental friendly.
Make a forum of WASP study to discuss techniques, updateinformation and technology of generation power planning.

9
THANK YOU
Presented by :
1. Taufiq Fahrudin2. Aris Sofian H.3. Nurul Hidayat4. Ainanto Nindyo