SOCIOGENETICA LATINOAMERICANA El Proceso de Aculturación ...
Upload
cucu-raussCategory
view
15download
2description
Acculturation, discrimination, and adaptation among second generationimmigrant youth in Montreal and Paris
John W. Berry a,*, Colette Sabatier b
a Department of Psychology, Queen’s University, Kingston, Ontario, Canada K7L 3N6b Universite Victor Segalen, Bordeaux, France
1. Introduction
Research with immigrant youth (e.g., Berry, Phinney, Sam, & Vedder, 2006) has shown that first and second generationimmigrants take a variety of courses through their acculturation process. These different paths or acculturation strategies
have been described by terms such as assimilation, integration, marginalisation and separation (AIMS). This research has alsoshown that there are variable outcomes to acculturation, including both psychological and sociocultural adaptation. Ofgreatest importance is the finding that these variations in adaptation are usually related to the acculturation strategies thatyouth use during their acculturation. Generally, those who involve themselves in both their heritage culture and that of the
International Journal of Intercultural Relations 34 (2010) 191–207
A R T I C L E I N F O
Article history:
Accepted 17 November 2009
Keywords:
Acculturation
Adaptation
Discrimination
Immigrant
Adolescents
National context
A B S T R A C T
Research with immigrant youth has shown that they have a variety of orientations to their
acculturation process. These different paths (‘‘acculturation strategies’’) have been
described in terms of assimilation, integration, marginalisation and separation (AIMS). This
research has also shown that there are variable adaptations or outcomes to acculturation.
Of greatest importance is the finding that these variations in adaptation are usually related
to the acculturation strategies that youth use. Generally, those who involve themselves in
both their heritage culture and that of the national society (by way of integration) have the
most positive psychological well-being, and are most adjusted in school and in the
community; in contrast, those who are minimally involved with either culture (the
marginalisation course), are least well-adapted; and those who are primarily oriented
towards one or the other culture (assimilation or separation) generally fall in between these
two adaptation poles. The present study examines the generality of this pattern by
comparing samples from two societies that have very different policies and practices with
respect immigration and acculturation: Canada and France. We measured acculturation
attitudes, identity and behaviours along the two basic dimensions of cultural maintenance
and social contact, and then cross-tabulated them, creating the four acculturation
orientations. In both societies the usual pattern is replicated: youth who prefer integration
have higher self-esteem scores than those who are marginalised; youth preferring
assimilation and separation fall in between. This pattern was stronger in Canada than in
France, a finding that is interpreted in terms of the differential social context faced by
youth in the two societies, particularly the differing national policies and youths’
experience of discrimination.
� 2009 Elsevier Ltd. All rights reserved.
* Corresponding author.
E-mail addresses: [email protected], [email protected] (J.W. Berry).
Contents lists available at ScienceDirect
International Journal of Intercultural Relations
journal homepage: www.elsev ier .com/ locate / i j in t re l
0147-1767/$ – see front matter � 2009 Elsevier Ltd. All rights reserved.
doi:10.1016/j.ijintrel.2009.11.007
national society (by way of integration) have the most positive psychological well-being, and are most adjusted in school andin the community; in contrast, those who are minimally involved with either culture (the marginalisation course), are leastwell-adapted; and those who are primarily oriented towards on, or the other, culture (assimilation or separation) generallyfall in between these two adaptation poles.
In much of this research, the experience of discrimination (or even the perception of discrimination) has a major impacton the ways in which youth acculturate, and on the degree of adaptive success. For example Berry et al. (2006) found thatyouth who seek integration report the least amount of discrimination, while those who are marginalised have the most;those seeking separation have moderately high discrimination (but less than for the marginalised), and those seekingassimilation have moderately low discrimination (but more than for the integrated youth). With respect to the relationshipbetween discrimination and adaptation, discrimination serves as the single strongest predictor; in a structural equationmodel (Berry et al., 2006) discrimination has a strong negative impact on both psychological and sociocultural adaptation.
These patterns of relationships are present, generally, in a data base that includes immigrant youth in 13 societies ofsettlement. One question that arises is whether these general findings might vary according to some specific features ofthe society of settlement. In this 13-country international study, two such features were examined: the degree of actualcultural diversity of a society, and the level of policy support for such diversity. With respect to actual diversity (madeup of a number of indicators, such as percentage of immigrants, and ethnolinguistic heterogeneity), greater diversitypredicted somewhat greater perceived discrimination, and greater expression of ethnic behaviours; greater diversityalso predicted somewhat lower psychological adaptation, but there was no relationship with sociocultural adaptation(Berry et al., 2006, Table 6.3). With respect to diversity policy (indicated by such factors as having a nationalmulticultural policy, and agencies promoting and implementing diversity and equity), the higher the degree of policysupport for cultural diversity, the higher the integration and assimilation orientations of immigrant youth, and thehigher the level of sociocultural adaptation; however, there was no relationship with discrimination or psychologicaladaptation (Berry et al., 2006; Table 6.4).
The present study examines the generality of this pattern of findings. We retain the same concepts (acculturationstrategies, cultural identity, discrimination and adaptation), but operationalise them in different ways. We use differentsamples (focusing specifically on second generation immigrant youth), and on two cities (Montreal in Canada, and Paris inFrance) that have clearly defined differences in their policies with respect to acculturation. Such replications and extensionsof previous studies can serve to establish the robustness of the generalizations made in earlier research.
Samples in Canada and France were selected because they present some important differences that may impact youthacculturation, on their experience of discrimination, and on their adaptation (Noels & Berry, 2006; Sabatier & Boutry, 2006).These societal features include the level of cultural diversity, the national policy concerning cultural diversity, and school andfamily practices and values. Hence, the comparison may give some indication of the role that national contexts play in theacculturation and adaptation of immigrant youth (Sabatier & Berry, 1994).
An initial comparison of immigrant youth acculturation and adaptation in Canada (Toronto) and France (Paris) wasextracted from the Berry et al. (2006) study. With respect to acculturation strategies, youth in Toronto were somewhat moreoriented toward integration than in Paris (50.4% vs. 45.6%), were less oriented toward separation (11.1% vs. 21.0%) andassimilation (22.1% vs. 26.3%), but were more marginal (16.4% vs. 7.2%) (x2 (3, N = 663) = 23.05, p< .001). With respect tocultural identity, youth in Toronto were higher than in Paris on both their ethnic identity (mean of 4.45 vs. 4.35, t = 2.04,p< .05) and national identity (4.02 vs. 3.29, t = 10.09, p< .001), and on perceived discrimination (2.00 vs. 1.90, t = 2.01,p< .05). Finally, with respect to psychological adaptation, youth in Toronto were less well-adapted than youth in Paris (�.21vs. �0.02, t =�2.97, p< .01), but on sociocultural adaptation the youth did not differ.
With respect to country similarities, both are modern, western democratic and individualistic societies, with a highlevel of affluence and quality of life. They have a long tradition of receiving immigrants and refugees and theirpopulations are diverse, multilingual, multicultural and multiconfessional. The two research settings (Montreal and itssuburbs and Paris area) are two dynamic metropolitan areas that offer a full range of ethnic associations and serviceswith relatively easy access to them. There are social services devoted to helping with their problems, and children canlearn their heritage language within the school system. These two areas receive the main proportion of immigrant fortheir country or Province.
Differences between the two countries are situated along three axes: the public policy and public attitudes towardsimmigration and diversity; the socio-economic conditions of immigrants; and family and school education. France has amoderate score on an index of actual diversity and a moderate level of immigration (Berry et al., 2006). The French politicalmodel of immigration and diversity can be characterised as ‘‘assimilationist citizenship’’, where political, socio-economicand civil rights are respected; however, the maintenance of cultural rights is seen as an obstacle to the equality of rights inother domains (see Sabatier & Boutry, 2006). In contrast, Canada has a high score on an index actual diversity and has a highlevel of immigration. There is also a high degree of policy support for diversity beginning with the adoption of a policy ofmulticulturalism in 1971 (Noels & Berry, 2006). However, it should be noted that Montreal is in the Province of Quebec,where the Canadian national policy of ‘multiculturalism’ is modified to be a policy of ‘interculturalism’ (Bouchard & Taylor,2008). The main difference is that in Canada, the policy states that ‘‘while there are two official languages, there are no officialcultures’’ (Government of Canada, 1971), in Quebec, priority is given to French language and culture. Thus, the situationfacing immigrant youth in Montreal, while largely multicultural, has some elements of assimilation; however, it falls wellshort of the assimilationist situation in Paris.
J.W. Berry, C. Sabatier / International Journal of Intercultural Relations 34 (2010) 191–207192
2. Variables in the study
2.1. Acculturation strategies
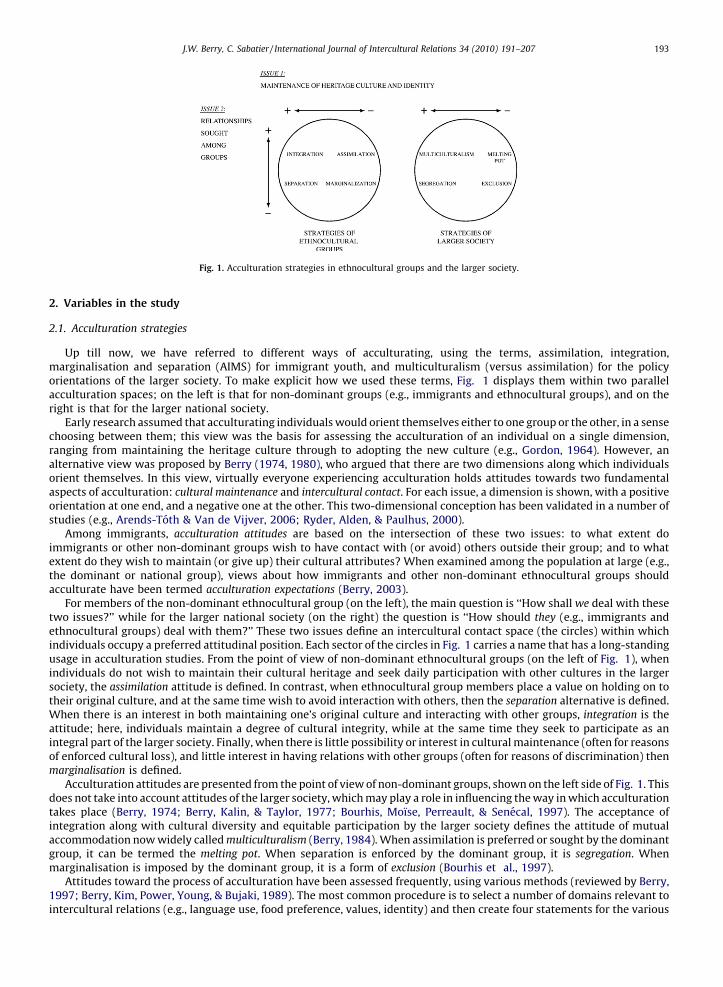
Up till now, we have referred to different ways of acculturating, using the terms, assimilation, integration,marginalisation and separation (AIMS) for immigrant youth, and multiculturalism (versus assimilation) for the policyorientations of the larger society. To make explicit how we used these terms, Fig. 1 displays them within two parallelacculturation spaces; on the left is that for non-dominant groups (e.g., immigrants and ethnocultural groups), and on theright is that for the larger national society.
Early research assumed that acculturating individuals would orient themselves either to one group or the other, in a sensechoosing between them; this view was the basis for assessing the acculturation of an individual on a single dimension,ranging from maintaining the heritage culture through to adopting the new culture (e.g., Gordon, 1964). However, analternative view was proposed by Berry (1974, 1980), who argued that there are two dimensions along which individualsorient themselves. In this view, virtually everyone experiencing acculturation holds attitudes towards two fundamentalaspects of acculturation: cultural maintenance and intercultural contact. For each issue, a dimension is shown, with a positiveorientation at one end, and a negative one at the other. This two-dimensional conception has been validated in a number ofstudies (e.g., Arends-Toth & Van de Vijver, 2006; Ryder, Alden, & Paulhus, 2000).
Among immigrants, acculturation attitudes are based on the intersection of these two issues: to what extent doimmigrants or other non-dominant groups wish to have contact with (or avoid) others outside their group; and to whatextent do they wish to maintain (or give up) their cultural attributes? When examined among the population at large (e.g.,the dominant or national group), views about how immigrants and other non-dominant ethnocultural groups shouldacculturate have been termed acculturation expectations (Berry, 2003).
For members of the non-dominant ethnocultural group (on the left), the main question is ‘‘How shall we deal with thesetwo issues?’’ while for the larger national society (on the right) the question is ‘‘How should they (e.g., immigrants andethnocultural groups) deal with them?’’ These two issues define an intercultural contact space (the circles) within whichindividuals occupy a preferred attitudinal position. Each sector of the circles in Fig. 1 carries a name that has a long-standingusage in acculturation studies. From the point of view of non-dominant ethnocultural groups (on the left of Fig. 1), whenindividuals do not wish to maintain their cultural heritage and seek daily participation with other cultures in the largersociety, the assimilation attitude is defined. In contrast, when ethnocultural group members place a value on holding on totheir original culture, and at the same time wish to avoid interaction with others, then the separation alternative is defined.When there is an interest in both maintaining one’s original culture and interacting with other groups, integration is theattitude; here, individuals maintain a degree of cultural integrity, while at the same time they seek to participate as anintegral part of the larger society. Finally, when there is little possibility or interest in cultural maintenance (often for reasonsof enforced cultural loss), and little interest in having relations with other groups (often for reasons of discrimination) thenmarginalisation is defined.
Acculturation attitudes are presented from the point of view of non-dominant groups, shown on the left side of Fig. 1. Thisdoes not take into account attitudes of the larger society, which may play a role in influencing the way in which acculturationtakes place (Berry, 1974; Berry, Kalin, & Taylor, 1977; Bourhis, Moıse, Perreault, & Senecal, 1997). The acceptance ofintegration along with cultural diversity and equitable participation by the larger society defines the attitude of mutualaccommodation now widely called multiculturalism (Berry, 1984). When assimilation is preferred or sought by the dominantgroup, it can be termed the melting pot. When separation is enforced by the dominant group, it is segregation. Whenmarginalisation is imposed by the dominant group, it is a form of exclusion (Bourhis et al., 1997).
Attitudes toward the process of acculturation have been assessed frequently, using various methods (reviewed by Berry,1997; Berry, Kim, Power, Young, & Bujaki, 1989). The most common procedure is to select a number of domains relevant tointercultural relations (e.g., language use, food preference, values, identity) and then create four statements for the various
Fig. 1. Acculturation strategies in ethnocultural groups and the larger society.
J.W. Berry, C. Sabatier / International Journal of Intercultural Relations 34 (2010) 191–207 193
domains, one for each of the four attitude sectors (e.g., Berry et al., 2006; Van de Vijver, Helms-Lornz, & Feltzer, 1999).Another is to create two statements for a particular domain, one for each of the two underlying dimensions and to classifyindividuals into the four categories by crossing the two dimensions (e.g., Dona & Berry, 1994; Ryder et al., 2000). We adoptthis second approach in this study and chose to cross the dimensions at the median point following the procedure adopted byDona and Berry (1994). By creating four acculturation attitude variables, instead of using the two underlying dimensions, weare able to make comparisons with much of the earlier literature that employed the four acculturation strategies.
2.2. Cultural identity
Cultural identity refers to the ways in which individuals conceive of themselves in relation to cultural communities; it is amultidimensional and dynamic sense of self as a member of a particular group or groups including affective, cognitive andbehavioural aspects (Phinney, 1990, 2003). Just as for acculturation orientations, the cultural identity of immigrants is nowunderstood to have two independent aspects: identity with one’s heritage group (ethnic identity), and identity with thelarger society in which a person now lives (national identity). And just as for acculturation attitudes, there is no necessarycontradiction between these two identities; individuals can be high or low on the ethnic and national dimensions of identity(Berry et al., 2006; Table 4.1).
2.3. Ethnic behaviour
Ethnic behaviour refers to the degree to which individuals keep elements of their culture and behave in accordance totheir cultural customs. Among these elements are language retention, ethnic social networks, participation in ethnicassociations, attending to media, reading newspapers, and other cultural habits such food (Berry et al., 1989; Knight, Bernal,Garzza, Cota, & Ocampo, 1993; Rosenthal & Cichello, 1986). Ethnic behaviour is a support and a context for identity andacculturation orientations.
2.4. Perceived discrimination
Perceived discrimination has been found to be an important predictor of acculturation attitudes, and of how wellimmigrant youth adapt, both psychologically and socioculturally, to life in their new society (Berry et al., 2006). Whenadolescents perceive that they are targets of discrimination, they are less likely to orient themselves to the larger society(Berry et al., 2006), and instead to reject the larger society. They are also less likely to exhibit psychological well-being (Gil,Vega, & Dimas, 1994; Greene, Way, & Pahl, 2006; Virta, Sam, & Westin, 2004), and less able to function successfully in schooland in the community (Vega, Khoury, Zimmerman, Gil, & Warheit, 1995).
2.5. Adaptation
Adaptation to acculturation has become understood as having two components: psychological and sociocultural (Ward,1996). Psychological adaptation refers to an individual’s personal sense of well-being. In this study, we examinepsychological adaptation of immigrant adolescents in terms of four different aspects of self-esteem, and level of stress.Studies have indicated two levels of self-esteem or self-appraisal; one is a general appreciation of self-worth; the other one isdomain-related. Immigrant and ethnocultural adolescents may vary in the importance they give to different domains; forexample, Asians value more the academic self and Euro-American and African-American value more the physical appearanceself than the other groups (Leiderman et al., 1989). While, family, school and peers are the main agencies of adolescentsocialization, we assess both the general self-esteem and domain-related self-esteem in three domains (family, socialrelationships and school).
Sociocultural adaptation refers to how well an individual is able to function in their daily lives in school or work, andgenerally in the community. In this study, we examine two aspects of adolescent sociocultural adaptation. Specifically, weassess adolescent academic performance and adolescent deviance, in terms of a number of activities, such as behaviourproblems and the use of drugs.
3. Hypotheses
In this study, we examine three main questions: How do immigrant youth acculturate; how well do they adapt; and arethere important relationships between, how they acculturate and how well they adapt? These questions are addressed intwo national settlement contexts to examine possible differences in how immigrant youth acculturate and how well theyadapt in relation to these contextual differences. In addition we examine the role of discrimination in these relationships.
Specifically, we hypothesised that:
3.1 The differences in acculturation strategies of youth between the two receiving societies (Canada and France) would beconsistent with their policies with respect to acculturation. That is, immigrant youth in Montreal would pursueintegration more than in Paris; and those in Paris would pursue assimilation more than those in Montreal.
J.W. Berry, C. Sabatier / International Journal of Intercultural Relations 34 (2010) 191–207194
3.2 The pattern of relationships between acculturation strategies and adaptation found in previous research with immigrantyouth will be replicated using different measurement techniques and scales. That is, those pursuing integration wouldhave more positive adaptation that those pursuing the other three ways of acculturating (assimilation, separation andmarginalisation).
3.3 With respects to discrimination: 3.3.1—youth seeking integration and assimilation would experience less discriminationthan those seeking separation and marginalisation; 3.3.2—immigrant youth in Montreal would experience lessdiscrimination than those in Paris; 3.3.3—in both national contexts, immigrant youth experiencing more discriminationwould have poorer adaptation.
4. Method
4.1. Participants
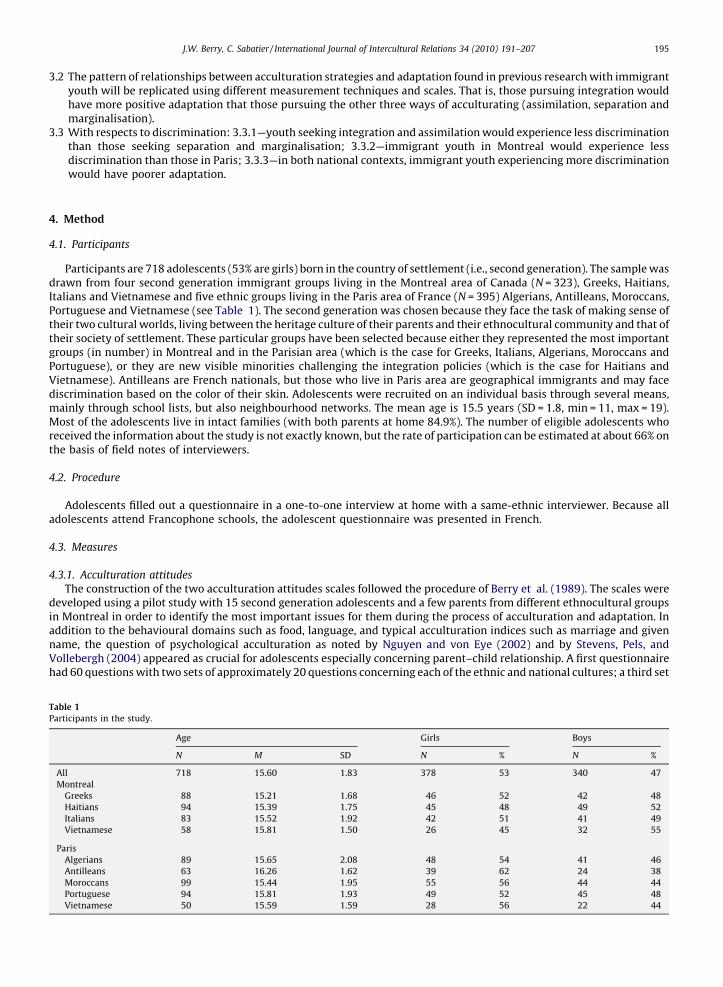
Participants are 718 adolescents (53% are girls) born in the country of settlement (i.e., second generation). The sample wasdrawn from four second generation immigrant groups living in the Montreal area of Canada (N = 323), Greeks, Haitians,Italians and Vietnamese and five ethnic groups living in the Paris area of France (N = 395) Algerians, Antilleans, Moroccans,Portuguese and Vietnamese (see Table 1). The second generation was chosen because they face the task of making sense oftheir two cultural worlds, living between the heritage culture of their parents and their ethnocultural community and that oftheir society of settlement. These particular groups have been selected because either they represented the most importantgroups (in number) in Montreal and in the Parisian area (which is the case for Greeks, Italians, Algerians, Moroccans andPortuguese), or they are new visible minorities challenging the integration policies (which is the case for Haitians andVietnamese). Antilleans are French nationals, but those who live in Paris area are geographical immigrants and may facediscrimination based on the color of their skin. Adolescents were recruited on an individual basis through several means,mainly through school lists, but also neighbourhood networks. The mean age is 15.5 years (SD = 1.8, min = 11, max = 19).Most of the adolescents live in intact families (with both parents at home 84.9%). The number of eligible adolescents whoreceived the information about the study is not exactly known, but the rate of participation can be estimated at about 66% onthe basis of field notes of interviewers.
4.2. Procedure
Adolescents filled out a questionnaire in a one-to-one interview at home with a same-ethnic interviewer. Because alladolescents attend Francophone schools, the adolescent questionnaire was presented in French.
4.3. Measures
4.3.1. Acculturation attitudes
The construction of the two acculturation attitudes scales followed the procedure of Berry et al. (1989). The scales weredeveloped using a pilot study with 15 second generation adolescents and a few parents from different ethnocultural groupsin Montreal in order to identify the most important issues for them during the process of acculturation and adaptation. Inaddition to the behavioural domains such as food, language, and typical acculturation indices such as marriage and givenname, the question of psychological acculturation as noted by Nguyen and von Eye (2002) and by Stevens, Pels, andVollebergh (2004) appeared as crucial for adolescents especially concerning parent–child relationship. A first questionnairehad 60 questions with two sets of approximately 20 questions concerning each of the ethnic and national cultures; a third set
Table 1
Participants in the study.
Age Girls Boys
N M SD N % N %
All 718 15.60 1.83 378 53 340 47
Montreal
Greeks 88 15.21 1.68 46 52 42 48
Haitians 94 15.39 1.75 45 48 49 52
Italians 83 15.52 1.92 42 51 41 49
Vietnamese 58 15.81 1.50 26 45 32 55
Paris
Algerians 89 15.65 2.08 48 54 41 46
Antilleans 63 16.26 1.62 39 62 24 38
Moroccans 99 15.44 1.95 55 56 44 44
Portuguese 94 15.81 1.93 49 52 45 48
Vietnamese 50 15.59 1.59 28 56 22 44
J.W. Berry, C. Sabatier / International Journal of Intercultural Relations 34 (2010) 191–207 195
dealt with acculturation to a more global culture. This questionnaire was administered to 30 adolescents. The questions forethnic acculturation were adapted to make items relevant to each specific ethnocultural group. A set of 45 questions wasretained after factor analysis. Most of the questions dealing with a global acculturation orientation were discarded. Factoranalysis and Tucker’s Phi calculations indicate that the two factor solution is preferable over a three factor solution, evenafter item normalization by each cultural group.
Internal consistencies (Cronbach’s alpha) for the two samples were good for each cultural group for each dimension, butbecause the factor analysis revealed different loading across groups we decided to proceed to a series of exploratory andconfirmatory factorial analysis in order to obtain the same factorial analysis for all groups with two orthogonal dimensions.This results in two sets of questions (one set for ethnic, and one set for national acculturation attitudes) dealing with variousdomains that are relevant to adolescents: language, marriage, social networks, values, emotions, parent–child relationshipand cultural transmission. As a result, many parallel questions (one for national and one ethnic orientation) that appear to beon a bipolar dimension were discarded after this last step of analysis. By doing this we obtain a true orthogonality and avoidthe question of bipolarity as mentioned by Nguyen and von Eye (2002). Two scales were constructed, with eight questions fornational acculturation (a = .77, range across ethnic groups: .65–.79); 15 questions for ethnic acculturation (a = .86, range:.63–.91).1 Tucker’s Phi coefficients with the 23 questions for a two factors solution are high for each group, but poor with athree factors solution. Sample items are:- National acculturation attitude: ‘‘I believe that [ethnic] parents should make an effort for their children to develop ties with
the Canadian society outside of school’’.- Ethnic acculturation attitude: I find it important that the [ethnic] culture be maintained from generation to generation.
The two scales were then crossed at the median point of each scale, following the procedure used by Dona and Berry(1994). This resulted in each individual being allocated to one of four acculturation attitudes: assimilation, integration,marginalisation or separation. In a discussion of various ways of splitting the two scales, Arends-Toth and Van de Vijver(2006) note that there is a choice between using the median, the mean or the theoretical mid-point, of each scale. Thereappears to be no ideal way of splitting the scales, since all three make an arbitrary cut near the middle of the scale where (in anormal distribution of scores) most respondents are likely to fall.
4.3.2. Cultural identity
We used one question for national and one for ethnic identity (1–5 point). Adolescents evaluate how much ethnicity ornational identity is one part of their self-concept: ‘‘To what degree do you feel yourself to be Canadian [or ethnic]?’’
4.3.3. Ethnic behaviours
Several questions were derived from Berry et al. (1989), Knight et al. (1993) and Rosenthal and Cichello (1986). Theseevaluate the commitment of adolescents in behaviours related to their cultural customs or which can sustain their ethnicidentity. The three following dimensions were used to construct an index (1–5 point): proportion of ethnic friends, mediaand competence in ethnic language (a = .84; range: .60–.86).
4.3.4. Acculturation orientations
An overall acculturation score (acculturation orientation) was created to provide an indication of how immigrant youthactually acculturate (including their behaviour and identity), which is more comprehensive than their attitudes orpreferences. Factor analyses of the acculturation variables were run for each sample separately, and the weights for theacculturation variables were used to create two orientation scores. Ethnic acculturation orientation score is the combinedfactor score of ethnic acculturation attitudes, ethnic identity and ethnic behaviour (lowest loading .83 in Montreal, .75 inParis; explained variance on a single factor, 73% in Montreal, 65% in Paris). The national acculturation orientation score is madeup of national acculturation attitudes and national identity (lowest loading .82 in Montreal, .83 in Paris; explained varianceon a single factor, 67% in Montreal, 70% in Paris).
4.3.5. Perceived discrimination
Twelve questions (derived from Tchoryk-Pelletier, 1989) had Likert response options (1 not at all, to 5 almost always) thattapped two dimensions of discrimination: personal and group discrimination. Six items focus on personal discriminationwithin the school context and the neighborhood; six other items focus on group discrimination and their future(employment, police and social services, lodging, and efforts). Cronbach’s alphas are for the whole scale .91 (range: .76–.93),for personal discrimination .79 (range: .70–.80), for group discrimination .91 (range: .77–.92). Sample items are:
Personal discrimination: ‘‘At school, do you have the feeling you are less accepted than Canadians because you are[ethnic]?’’Group discrimination: ‘‘Do you have the feeling that your group is discriminated against when it is the time to find a job?’’
1 This questionnaire is available on request to the authors.
J.W. Berry, C. Sabatier / International Journal of Intercultural Relations 34 (2010) 191–207196
4.3.6. Self-esteem
Two scales were used. The Rosenberg (1965) self-esteem scale (with a four point response scale) was used in bothsamples; it focuses on general self-esteem (a = .77; range: .66–.83). The other scale focuses on specific domains of self-esteem, and is different in each sample. In Paris, Coopersmith’s self-esteem inventory (Coopersmith, 1981) with fourdimensions of self-esteem (emotional, familial, social, and school) was used. The scale has five response points (from 1 ‘nottypical of me at all’, to 5 ‘completely typical of me’). Alphas are .84 for emotional (range: .81–.87), .80 for familial self-esteem(range: .61–.81), .66 for social (range: .57–.74), and .70 for school (range: .55–.78). In Montreal, the Offer Self-ImageQuestionnaire (Offer, Ostrov, Howard, & Atknson, 1988) was used. Following the procedure of Laukkanen, Halonen, Aivio,Viinamaki, and Lehtonen (2000) and Tremblay, Saucier, and Tremblay (2004) we extracted four dimensions, they are similaras those of the Coopersmith self-esteem inventory. Internal consistency (alpha and factor analysis) is good for all culturalgroups. Alphas are .88 for emotional (range: .77–.83), .83 for familial self-esteem (range: .77–.83), .73 for social (range: .68–.74), and .77 for school (range: .75–.81). Both scales have been used successfully in cross-cultural studies with secondgeneration adolescents (Herz & Gullone, 1999; Rosenthal & Cichello, 1986) and in each country.
4.3.7. Academic performance
An index was constructed on the basis of several questions about academic performance (grades, peer comparison,academic track and appropriate age for the grade level). There are four levels, ranging from very problematic to good (evenexcellent) performance. Because of different school systems in the two countries, the classification system was adapted toeach sample.
4.3.8. Deviance
There were 11 questions (from Dornbusch, Ritter, Chen, & Mont-Reynaud, 1989), ranging from minor behaviour problems(being late at school) to more serious ones (using drugs or having trouble with the police). Responses were made on a Likertresponse scale (1 never to 5 often); a is .73 (range: .64–.74).
5. Results
5.1. Strategy of analysis
The first part of this section presents the descriptive statistics for all the variables in the study and the correlations amongintercultural variables. The second presents the distribution of scores for the four acculturation strategies derived from thetwo acculturation attitude dimensions, and of the two overall acculturation orientations (based on the factor scores ofacculturation attitudes, identity and cultural behaviour). In the third part, we examine the relationships between the fouracculturation strategies and adaptation variables. In the fourth part we examine relationships between perceiveddiscrimination and the four acculturation strategies. And in the last part, we examine the relationships between perceiveddiscrimination and adaptation variables. Because we are mainly concerned with differences between societies of settlement,the analyses report systematically the country level differences and analyses; however, when it is appropriate and whenthey illustrate the special situation concerning specific immigrant groups, these are reported, in the text (but they do notappear in tables).
5.2. Descriptive data
Means, medians and standard deviations for all variables are presented in Table 2. Multiple analyses of variance revealthat the three ethnic acculturation variables (acculturation attitudes, ethnic identity and ethnic behaviours) are higher inMontreal than in Paris; however, there is no difference on national acculturation attitudes or identity. Perceiveddiscrimination is higher in Paris. Self-esteem is higher in Montreal (for Rosenberg, where the same scale was used in bothsamples). The means on the other self-esteem measures cannot be directly compared (because somewhat different measureswere used, see note b).
Correlations among intercultural variables are shown in Table 3. In general, as expected the same-focus variables (ethnicor national) are positively related in both samples: these intercorrelations provided the basis for creating the twoacculturation orientation factor scores, as noted above. For example, ethnic acculturation attitudes and ethnic identity arecorrelated +.55 in Paris and +.65 in Montreal; national acculturation attitudes and national identity are correlated +.39 and+.33 in Paris and Montreal, respectively. In contrast, some other-focussed variables are negatively related in Paris (�.20 forethnic and national identities, and �.21 for national identity and ethnic acculturation attitudes), but they are not related inMontreal. This pattern corresponds to the identity correlations in Berry et al. (2006), where the two identities werenegatively correlated in Paris (�.13), but not related in Montreal (+.09).
5.3. Acculturation strategies
To examine the first question guiding this study (how immigrant youth acculturate), and to assess the firsthypothesis (with respect to sample differences in these acculturation strategies), we employed two measures. The first
J.W. Berry, C. Sabatier / International Journal of Intercultural Relations 34 (2010) 191–207 197
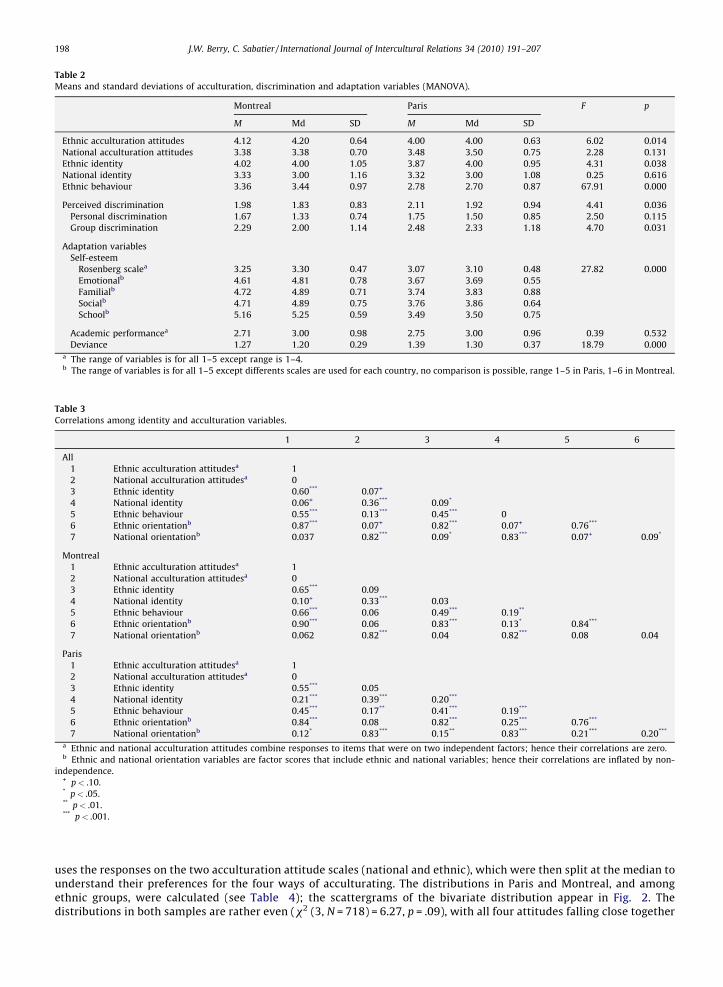
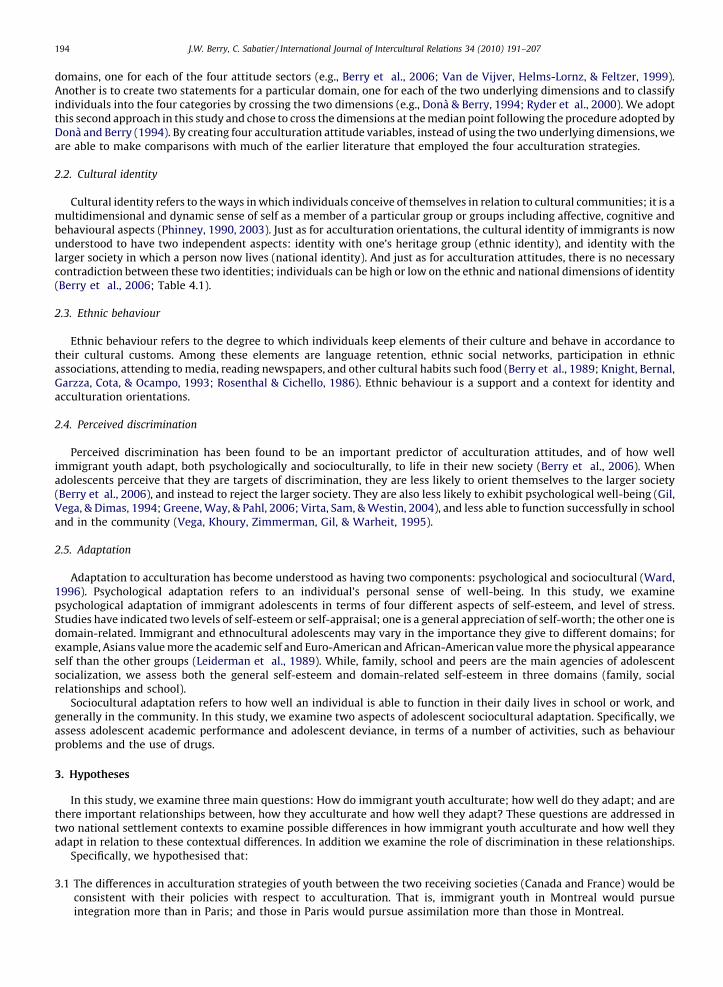
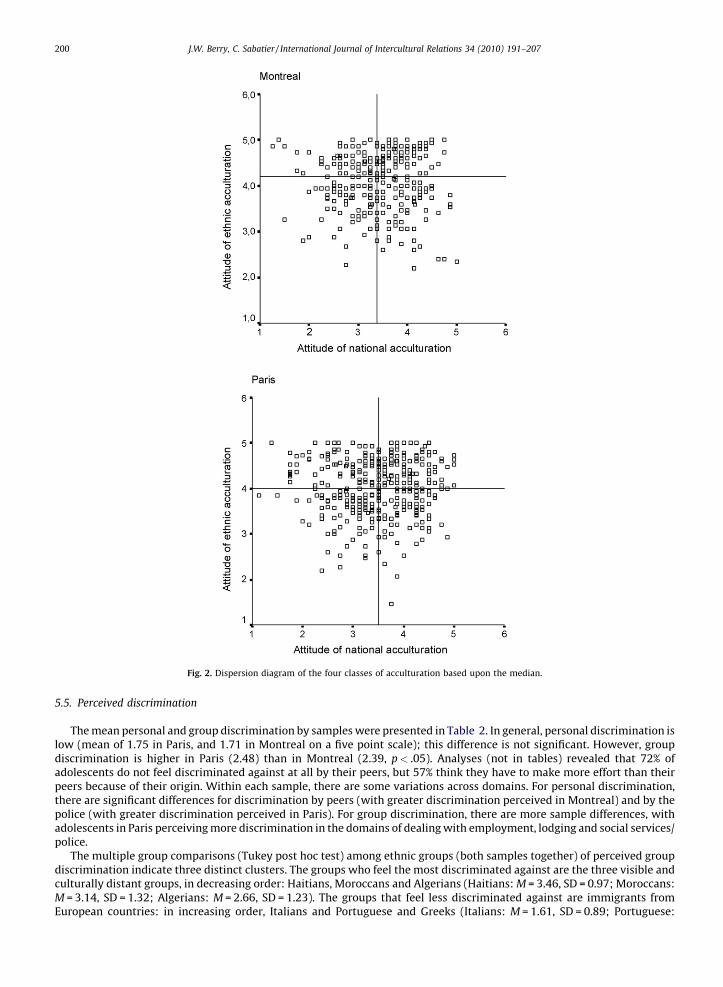
uses the responses on the two acculturation attitude scales (national and ethnic), which were then split at the median tounderstand their preferences for the four ways of acculturating. The distributions in Paris and Montreal, and amongethnic groups, were calculated (see Table 4); the scattergrams of the bivariate distribution appear in Fig. 2. Thedistributions in both samples are rather even (x2 (3, N = 718) = 6.27, p = .09), with all four attitudes falling close together
Table 2
Means and standard deviations of acculturation, discrimination and adaptation variables (MANOVA).
Montreal Paris F p
M Md SD M Md SD
Ethnic acculturation attitudes 4.12 4.20 0.64 4.00 4.00 0.63 6.02 0.014
National acculturation attitudes 3.38 3.38 0.70 3.48 3.50 0.75 2.28 0.131
Ethnic identity 4.02 4.00 1.05 3.87 4.00 0.95 4.31 0.038
National identity 3.33 3.00 1.16 3.32 3.00 1.08 0.25 0.616
Ethnic behaviour 3.36 3.44 0.97 2.78 2.70 0.87 67.91 0.000
Perceived discrimination 1.98 1.83 0.83 2.11 1.92 0.94 4.41 0.036
Personal discrimination 1.67 1.33 0.74 1.75 1.50 0.85 2.50 0.115
Group discrimination 2.29 2.00 1.14 2.48 2.33 1.18 4.70 0.031
Adaptation variables
Self-esteem
Rosenberg scalea 3.25 3.30 0.47 3.07 3.10 0.48 27.82 0.000
Emotionalb 4.61 4.81 0.78 3.67 3.69 0.55
Familialb 4.72 4.89 0.71 3.74 3.83 0.88
Socialb 4.71 4.89 0.75 3.76 3.86 0.64
Schoolb 5.16 5.25 0.59 3.49 3.50 0.75
Academic performancea 2.71 3.00 0.98 2.75 3.00 0.96 0.39 0.532
Deviance 1.27 1.20 0.29 1.39 1.30 0.37 18.79 0.000a The range of variables is for all 1–5 except range is 1–4.b The range of variables is for all 1–5 except differents scales are used for each country, no comparison is possible, range 1–5 in Paris, 1–6 in Montreal.
Table 3
Correlations among identity and acculturation variables.
1 2 3 4 5 6
All
1 Ethnic acculturation attitudesa 1
2 National acculturation attitudesa 0
3 Ethnic identity 0.60*** �0.07+
4 National identity �0.06+ 0.36*** �0.09*
5 Ethnic behaviour 0.55*** �0.13*** 0.45*** 0
6 Ethnic orientationb 0.87*** �0.07+ 0.82*** �0.07+ 0.76***
7 National orientationb �0.037 0.82*** �0.09* 0.83*** �0.07+ �0.09*
Montreal
1 Ethnic acculturation attitudesa 1
2 National acculturation attitudesa 0
3 Ethnic identity 0.65*** �0.09
4 National identity 0.10+ 0.33*** 0.03
5 Ethnic behaviour 0.66*** �0.06 0.49*** 0.19**
6 Ethnic orientationb 0.90*** �0.06 0.83*** 0.13* 0.84***
7 National orientationb 0.062 0.82*** �0.04 0.82*** 0.08 0.04
Paris
1 Ethnic acculturation attitudesa 1
2 National acculturation attitudesa 0
3 Ethnic identity 0.55*** �0.05
4 National identity �0.21*** 0.39*** �0.20***
5 Ethnic behaviour 0.45*** �0.17** 0.41*** �0.19***
6 Ethnic orientationb 0.84*** �0.08 0.82*** �0.25*** 0.76***
7 National orientationb �0.12* 0.83*** �0.15** 0.83*** �0.21*** �0.20***
a Ethnic and national acculturation attitudes combine responses to items that were on two independent factors; hence their correlations are zero.b Ethnic and national orientation variables are factor scores that include ethnic and national variables; hence their correlations are inflated by non-
independence.+ p< .10.* p< .05.** p< .01.*** p< .001.
J.W. Berry, C. Sabatier / International Journal of Intercultural Relations 34 (2010) 191–207198
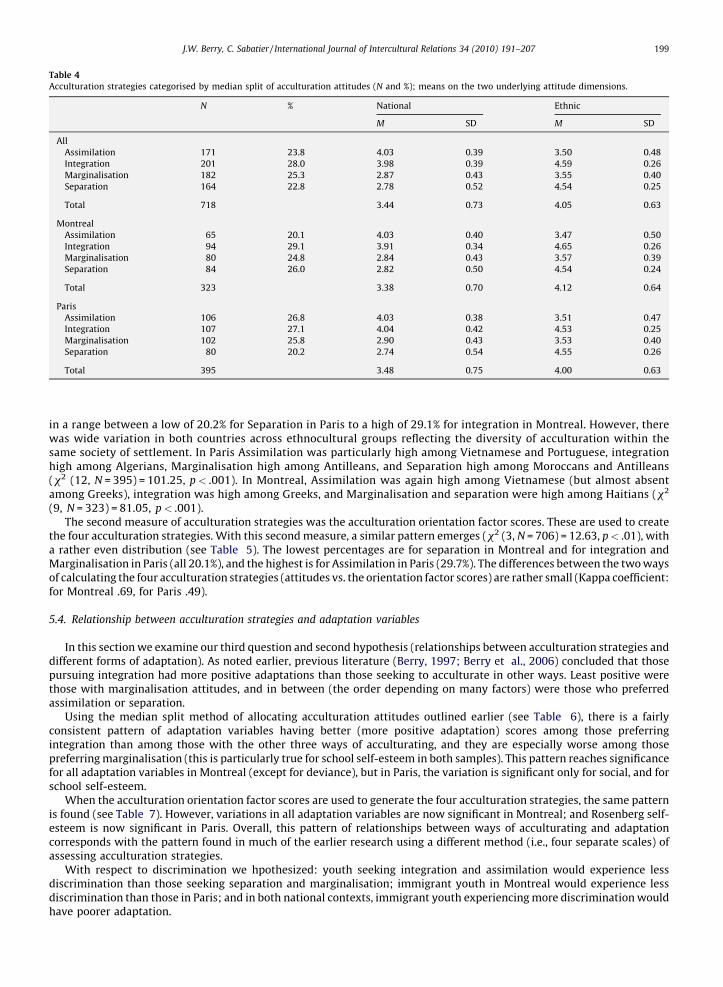
in a range between a low of 20.2% for Separation in Paris to a high of 29.1% for integration in Montreal. However, therewas wide variation in both countries across ethnocultural groups reflecting the diversity of acculturation within thesame society of settlement. In Paris Assimilation was particularly high among Vietnamese and Portuguese, integrationhigh among Algerians, Marginalisation high among Antilleans, and Separation high among Moroccans and Antilleans(x2 (12, N = 395) = 101.25, p< .001). In Montreal, Assimilation was again high among Vietnamese (but almost absentamong Greeks), integration was high among Greeks, and Marginalisation and separation were high among Haitians (x2
(9, N = 323) = 81.05, p< .001).The second measure of acculturation strategies was the acculturation orientation factor scores. These are used to create
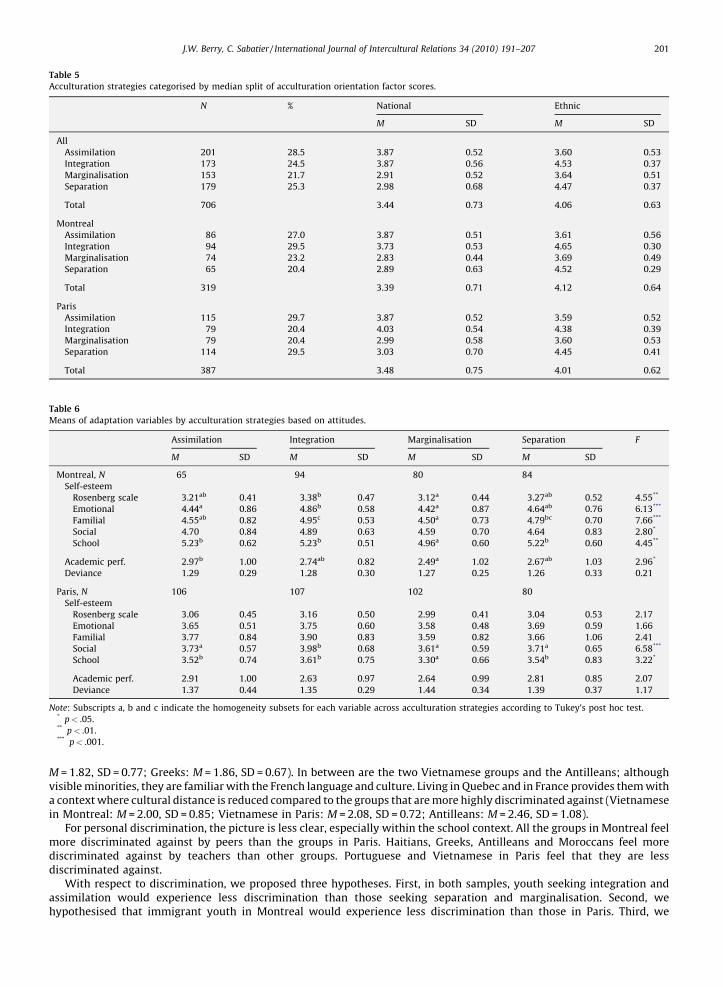
the four acculturation strategies. With this second measure, a similar pattern emerges (x2 (3, N = 706) = 12.63, p< .01), witha rather even distribution (see Table 5). The lowest percentages are for separation in Montreal and for integration andMarginalisation in Paris (all 20.1%), and the highest is for Assimilation in Paris (29.7%). The differences between the two waysof calculating the four acculturation strategies (attitudes vs. the orientation factor scores) are rather small (Kappa coefficient:for Montreal .69, for Paris .49).
5.4. Relationship between acculturation strategies and adaptation variables
In this section we examine our third question and second hypothesis (relationships between acculturation strategies anddifferent forms of adaptation). As noted earlier, previous literature (Berry, 1997; Berry et al., 2006) concluded that thosepursuing integration had more positive adaptations than those seeking to acculturate in other ways. Least positive werethose with marginalisation attitudes, and in between (the order depending on many factors) were those who preferredassimilation or separation.
Using the median split method of allocating acculturation attitudes outlined earlier (see Table 6), there is a fairlyconsistent pattern of adaptation variables having better (more positive adaptation) scores among those preferringintegration than among those with the other three ways of acculturating, and they are especially worse among thosepreferring marginalisation (this is particularly true for school self-esteem in both samples). This pattern reaches significancefor all adaptation variables in Montreal (except for deviance), but in Paris, the variation is significant only for social, and forschool self-esteem.
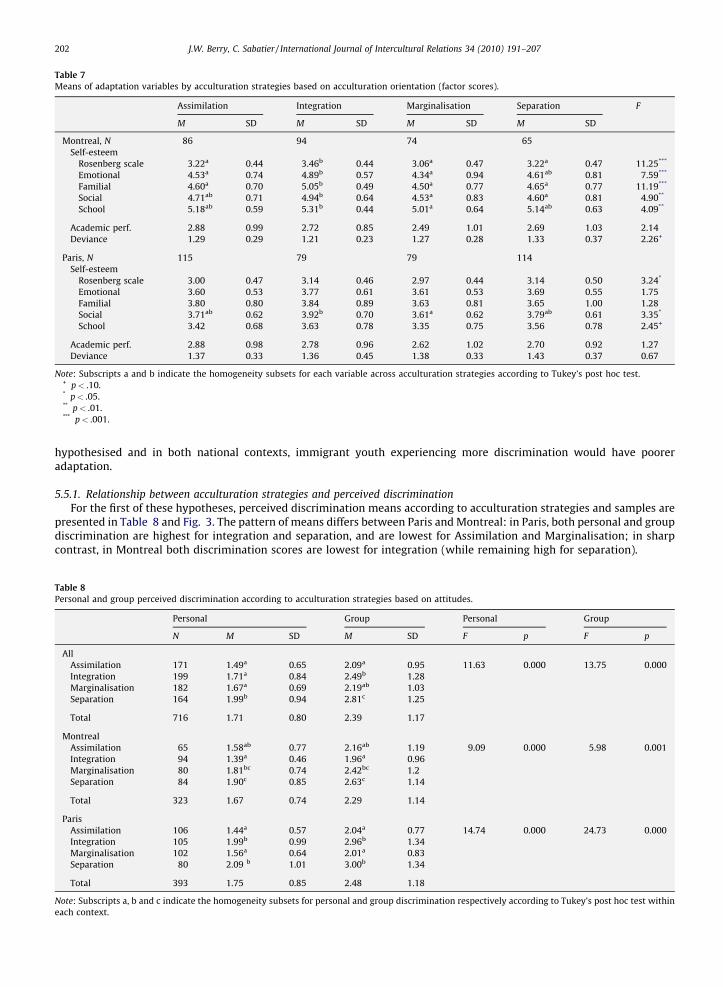
When the acculturation orientation factor scores are used to generate the four acculturation strategies, the same patternis found (see Table 7). However, variations in all adaptation variables are now significant in Montreal; and Rosenberg self-esteem is now significant in Paris. Overall, this pattern of relationships between ways of acculturating and adaptationcorresponds with the pattern found in much of the earlier research using a different method (i.e., four separate scales) ofassessing acculturation strategies.
With respect to discrimination we hpothesized: youth seeking integration and assimilation would experience lessdiscrimination than those seeking separation and marginalisation; immigrant youth in Montreal would experience lessdiscrimination than those in Paris; and in both national contexts, immigrant youth experiencing more discrimination wouldhave poorer adaptation.
Table 4
Acculturation strategies categorised by median split of acculturation attitudes (N and %); means on the two underlying attitude dimensions.
N % National Ethnic
M SD M SD
All
Assimilation 171 23.8 4.03 0.39 3.50 0.48
Integration 201 28.0 3.98 0.39 4.59 0.26
Marginalisation 182 25.3 2.87 0.43 3.55 0.40
Separation 164 22.8 2.78 0.52 4.54 0.25
Total 718 3.44 0.73 4.05 0.63
Montreal
Assimilation 65 20.1 4.03 0.40 3.47 0.50
Integration 94 29.1 3.91 0.34 4.65 0.26
Marginalisation 80 24.8 2.84 0.43 3.57 0.39
Separation 84 26.0 2.82 0.50 4.54 0.24
Total 323 3.38 0.70 4.12 0.64
Paris
Assimilation 106 26.8 4.03 0.38 3.51 0.47
Integration 107 27.1 4.04 0.42 4.53 0.25
Marginalisation 102 25.8 2.90 0.43 3.53 0.40
Separation 80 20.2 2.74 0.54 4.55 0.26
Total 395 3.48 0.75 4.00 0.63
J.W. Berry, C. Sabatier / International Journal of Intercultural Relations 34 (2010) 191–207 199
5.5. Perceived discrimination
The mean personal and group discrimination by samples were presented in Table 2. In general, personal discrimination islow (mean of 1.75 in Paris, and 1.71 in Montreal on a five point scale); this difference is not significant. However, groupdiscrimination is higher in Paris (2.48) than in Montreal (2.39, p< .05). Analyses (not in tables) revealed that 72% ofadolescents do not feel discriminated against at all by their peers, but 57% think they have to make more effort than theirpeers because of their origin. Within each sample, there are some variations across domains. For personal discrimination,there are significant differences for discrimination by peers (with greater discrimination perceived in Montreal) and by thepolice (with greater discrimination perceived in Paris). For group discrimination, there are more sample differences, withadolescents in Paris perceiving more discrimination in the domains of dealing with employment, lodging and social services/police.
The multiple group comparisons (Tukey post hoc test) among ethnic groups (both samples together) of perceived groupdiscrimination indicate three distinct clusters. The groups who feel the most discriminated against are the three visible andculturally distant groups, in decreasing order: Haitians, Moroccans and Algerians (Haitians: M = 3.46, SD = 0.97; Moroccans:M = 3.14, SD = 1.32; Algerians: M = 2.66, SD = 1.23). The groups that feel less discriminated against are immigrants fromEuropean countries: in increasing order, Italians and Portuguese and Greeks (Italians: M = 1.61, SD = 0.89; Portuguese:
Fig. 2. Dispersion diagram of the four classes of acculturation based upon the median.
J.W. Berry, C. Sabatier / International Journal of Intercultural Relations 34 (2010) 191–207200
M = 1.82, SD = 0.77; Greeks: M = 1.86, SD = 0.67). In between are the two Vietnamese groups and the Antilleans; althoughvisible minorities, they are familiar with the French language and culture. Living in Quebec and in France provides them witha context where cultural distance is reduced compared to the groups that are more highly discriminated against (Vietnamesein Montreal: M = 2.00, SD = 0.85; Vietnamese in Paris: M = 2.08, SD = 0.72; Antilleans: M = 2.46, SD = 1.08).
For personal discrimination, the picture is less clear, especially within the school context. All the groups in Montreal feelmore discriminated against by peers than the groups in Paris. Haitians, Greeks, Antilleans and Moroccans feel morediscriminated against by teachers than other groups. Portuguese and Vietnamese in Paris feel that they are lessdiscriminated against.
With respect to discrimination, we proposed three hypotheses. First, in both samples, youth seeking integration andassimilation would experience less discrimination than those seeking separation and marginalisation. Second, wehypothesised that immigrant youth in Montreal would experience less discrimination than those in Paris. Third, we
Table 6
Means of adaptation variables by acculturation strategies based on attitudes.
Assimilation Integration Marginalisation Separation F
M SD M SD M SD M SD
Montreal, N 65 94 80 84
Self-esteem
Rosenberg scale 3.21ab 0.41 3.38b 0.47 3.12a 0.44 3.27ab 0.52 4.55**
Emotional 4.44a 0.86 4.86b 0.58 4.42a 0.87 4.64ab 0.76 6.13***
Familial 4.55ab 0.82 4.95c 0.53 4.50a 0.73 4.79bc 0.70 7.66***
Social 4.70 0.84 4.89 0.63 4.59 0.70 4.64 0.83 2.80*
School 5.23b 0.62 5.23b 0.51 4.96a 0.60 5.22b 0.60 4.45**
Academic perf. 2.97b 1.00 2.74ab 0.82 2.49a 1.02 2.67ab 1.03 2.96*
Deviance 1.29 0.29 1.28 0.30 1.27 0.25 1.26 0.33 0.21
Paris, N 106 107 102 80
Self-esteem
Rosenberg scale 3.06 0.45 3.16 0.50 2.99 0.41 3.04 0.53 2.17
Emotional 3.65 0.51 3.75 0.60 3.58 0.48 3.69 0.59 1.66
Familial 3.77 0.84 3.90 0.83 3.59 0.82 3.66 1.06 2.41
Social 3.73a 0.57 3.98b 0.68 3.61a 0.59 3.71a 0.65 6.58***
School 3.52b 0.74 3.61b 0.75 3.30a 0.66 3.54b 0.83 3.22*
Academic perf. 2.91 1.00 2.63 0.97 2.64 0.99 2.81 0.85 2.07
Deviance 1.37 0.44 1.35 0.29 1.44 0.34 1.39 0.37 1.17
Note: Subscripts a, b and c indicate the homogeneity subsets for each variable across acculturation strategies according to Tukey’s post hoc test.* p< .05.** p< .01.*** p< .001.
Table 5
Acculturation strategies categorised by median split of acculturation orientation factor scores.
N % National Ethnic
M SD M SD
All
Assimilation 201 28.5 3.87 0.52 3.60 0.53
Integration 173 24.5 3.87 0.56 4.53 0.37
Marginalisation 153 21.7 2.91 0.52 3.64 0.51
Separation 179 25.3 2.98 0.68 4.47 0.37
Total 706 3.44 0.73 4.06 0.63
Montreal
Assimilation 86 27.0 3.87 0.51 3.61 0.56
Integration 94 29.5 3.73 0.53 4.65 0.30
Marginalisation 74 23.2 2.83 0.44 3.69 0.49
Separation 65 20.4 2.89 0.63 4.52 0.29
Total 319 3.39 0.71 4.12 0.64
Paris
Assimilation 115 29.7 3.87 0.52 3.59 0.52
Integration 79 20.4 4.03 0.54 4.38 0.39
Marginalisation 79 20.4 2.99 0.58 3.60 0.53
Separation 114 29.5 3.03 0.70 4.45 0.41
Total 387 3.48 0.75 4.01 0.62
J.W. Berry, C. Sabatier / International Journal of Intercultural Relations 34 (2010) 191–207 201
hypothesised and in both national contexts, immigrant youth experiencing more discrimination would have pooreradaptation.
5.5.1. Relationship between acculturation strategies and perceived discrimination
For the first of these hypotheses, perceived discrimination means according to acculturation strategies and samples arepresented in Table 8 and Fig. 3. The pattern of means differs between Paris and Montreal: in Paris, both personal and groupdiscrimination are highest for integration and separation, and are lowest for Assimilation and Marginalisation; in sharpcontrast, in Montreal both discrimination scores are lowest for integration (while remaining high for separation).
Table 8
Personal and group perceived discrimination according to acculturation strategies based on attitudes.
Personal Group Personal Group
N M SD M SD F p F p
All
Assimilation 171 1.49a 0.65 2.09a 0.95 11.63 0.000 13.75 0.000
Integration 199 1.71a 0.84 2.49b 1.28
Marginalisation 182 1.67a 0.69 2.19ab 1.03
Separation 164 1.99b 0.94 2.81c 1.25
Total 716 1.71 0.80 2.39 1.17
Montreal
Assimilation 65 1.58ab 0.77 2.16ab 1.19 9.09 0.000 5.98 0.001
Integration 94 1.39a 0.46 1.96a 0.96
Marginalisation 80 1.81bc 0.74 2.42bc 1.2
Separation 84 1.90c 0.85 2.63c 1.14
Total 323 1.67 0.74 2.29 1.14
Paris
Assimilation 106 1.44a 0.57 2.04a 0.77 14.74 0.000 24.73 0.000
Integration 105 1.99b 0.99 2.96b 1.34
Marginalisation 102 1.56a 0.64 2.01a 0.83
Separation 80 2.09 b 1.01 3.00b 1.34
Total 393 1.75 0.85 2.48 1.18
Note: Subscripts a, b and c indicate the homogeneity subsets for personal and group discrimination respectively according to Tukey’s post hoc test within
each context.
Table 7
Means of adaptation variables by acculturation strategies based on acculturation orientation (factor scores).
Assimilation Integration Marginalisation Separation F
M SD M SD M SD M SD
Montreal, N 86 94 74 65
Self-esteem
Rosenberg scale 3.22a 0.44 3.46b 0.44 3.06a 0.47 3.22a 0.47 11.25***
Emotional 4.53a 0.74 4.89b 0.57 4.34a 0.94 4.61ab 0.81 7.59***
Familial 4.60a 0.70 5.05b 0.49 4.50a 0.77 4.65a 0.77 11.19***
Social 4.71ab 0.71 4.94b 0.64 4.53a 0.83 4.60a 0.81 4.90**
School 5.18ab 0.59 5.31b 0.44 5.01a 0.64 5.14ab 0.63 4.09**
Academic perf. 2.88 0.99 2.72 0.85 2.49 1.01 2.69 1.03 2.14
Deviance 1.29 0.29 1.21 0.23 1.27 0.28 1.33 0.37 2.26+
Paris, N 115 79 79 114
Self-esteem
Rosenberg scale 3.00 0.47 3.14 0.46 2.97 0.44 3.14 0.50 3.24*
Emotional 3.60 0.53 3.77 0.61 3.61 0.53 3.69 0.55 1.75
Familial 3.80 0.80 3.84 0.89 3.63 0.81 3.65 1.00 1.28
Social 3.71ab 0.62 3.92b 0.70 3.61a 0.62 3.79ab 0.61 3.35*
School 3.42 0.68 3.63 0.78 3.35 0.75 3.56 0.78 2.45+
Academic perf. 2.88 0.98 2.78 0.96 2.62 1.02 2.70 0.92 1.27
Deviance 1.37 0.33 1.36 0.45 1.38 0.33 1.43 0.37 0.67
Note: Subscripts a and b indicate the homogeneity subsets for each variable across acculturation strategies according to Tukey’s post hoc test.+ p< .10.* p< .05.** p< .01.*** p< .001.
J.W. Berry, C. Sabatier / International Journal of Intercultural Relations 34 (2010) 191–207202
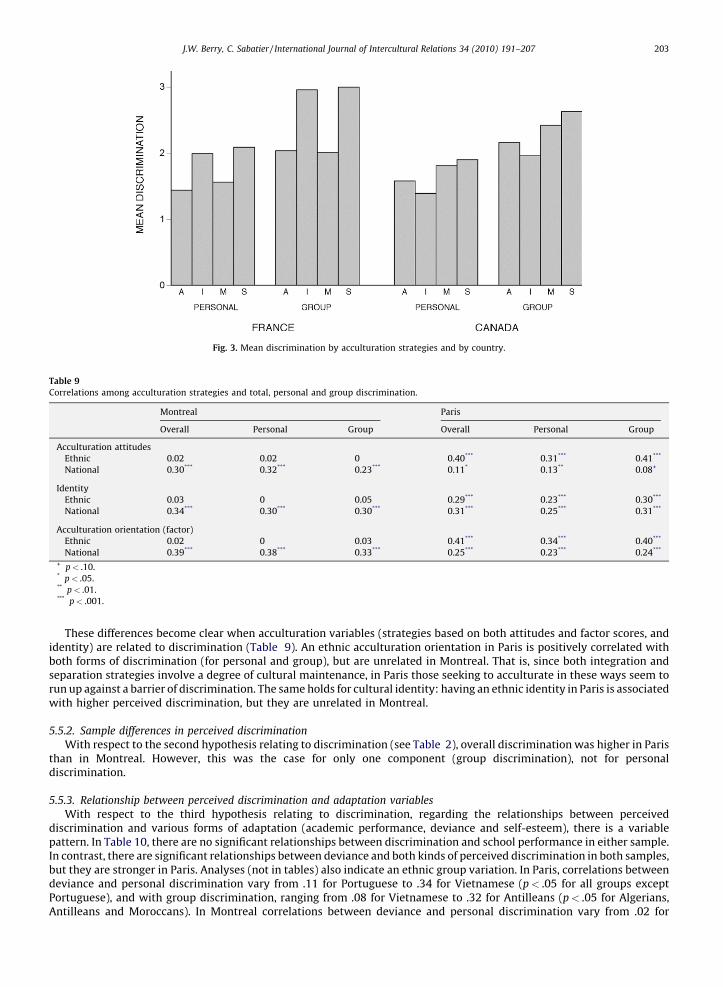
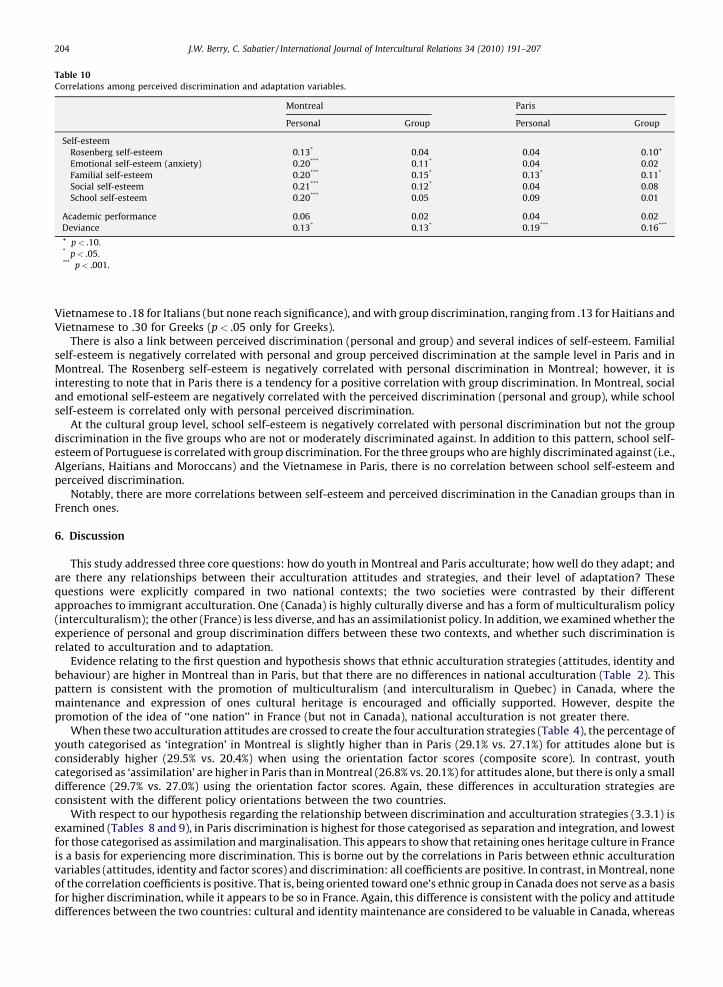
These differences become clear when acculturation variables (strategies based on both attitudes and factor scores, andidentity) are related to discrimination (Table 9). An ethnic acculturation orientation in Paris is positively correlated withboth forms of discrimination (for personal and group), but are unrelated in Montreal. That is, since both integration andseparation strategies involve a degree of cultural maintenance, in Paris those seeking to acculturate in these ways seem torun up against a barrier of discrimination. The same holds for cultural identity: having an ethnic identity in Paris is associatedwith higher perceived discrimination, but they are unrelated in Montreal.
5.5.2. Sample differences in perceived discrimination
With respect to the second hypothesis relating to discrimination (see Table 2), overall discrimination was higher in Paristhan in Montreal. However, this was the case for only one component (group discrimination), not for personaldiscrimination.
5.5.3. Relationship between perceived discrimination and adaptation variables
With respect to the third hypothesis relating to discrimination, regarding the relationships between perceiveddiscrimination and various forms of adaptation (academic performance, deviance and self-esteem), there is a variablepattern. In Table 10, there are no significant relationships between discrimination and school performance in either sample.In contrast, there are significant relationships between deviance and both kinds of perceived discrimination in both samples,but they are stronger in Paris. Analyses (not in tables) also indicate an ethnic group variation. In Paris, correlations betweendeviance and personal discrimination vary from .11 for Portuguese to .34 for Vietnamese (p< .05 for all groups exceptPortuguese), and with group discrimination, ranging from .08 for Vietnamese to .32 for Antilleans (p< .05 for Algerians,Antilleans and Moroccans). In Montreal correlations between deviance and personal discrimination vary from .02 for
Fig. 3. Mean discrimination by acculturation strategies and by country.
Table 9
Correlations among acculturation strategies and total, personal and group discrimination.
Montreal Paris
Overall Personal Group Overall Personal Group
Acculturation attitudes
Ethnic �0.02 �0.02 0 0.40*** 0.31*** 0.41***
National �0.30*** �0.32*** �0.23*** �0.11* �0.13** �0.08+
Identity
Ethnic �0.03 0 �0.05 0.29*** 0.23*** 0.30***
National �0.34*** �0.30*** �0.30*** �0.31*** �0.25*** �0.31***
Acculturation orientation (factor)
Ethnic �0.02 0 �0.03 0.41*** 0.34*** 0.40***
National �0.39*** �0.38*** �0.33*** �0.25*** �0.23*** �0.24***
+ p< .10.* p< .05.** p< .01.*** p< .001.
J.W. Berry, C. Sabatier / International Journal of Intercultural Relations 34 (2010) 191–207 203
Vietnamese to .18 for Italians (but none reach significance), and with group discrimination, ranging from .13 for Haitians andVietnamese to .30 for Greeks (p< .05 only for Greeks).
There is also a link between perceived discrimination (personal and group) and several indices of self-esteem. Familialself-esteem is negatively correlated with personal and group perceived discrimination at the sample level in Paris and inMontreal. The Rosenberg self-esteem is negatively correlated with personal discrimination in Montreal; however, it isinteresting to note that in Paris there is a tendency for a positive correlation with group discrimination. In Montreal, socialand emotional self-esteem are negatively correlated with the perceived discrimination (personal and group), while schoolself-esteem is correlated only with personal perceived discrimination.
At the cultural group level, school self-esteem is negatively correlated with personal discrimination but not the groupdiscrimination in the five groups who are not or moderately discriminated against. In addition to this pattern, school self-esteem of Portuguese is correlated with group discrimination. For the three groups who are highly discriminated against (i.e.,Algerians, Haitians and Moroccans) and the Vietnamese in Paris, there is no correlation between school self-esteem andperceived discrimination.
Notably, there are more correlations between self-esteem and perceived discrimination in the Canadian groups than inFrench ones.
6. Discussion
This study addressed three core questions: how do youth in Montreal and Paris acculturate; how well do they adapt; andare there any relationships between their acculturation attitudes and strategies, and their level of adaptation? Thesequestions were explicitly compared in two national contexts; the two societies were contrasted by their differentapproaches to immigrant acculturation. One (Canada) is highly culturally diverse and has a form of multiculturalism policy(interculturalism); the other (France) is less diverse, and has an assimilationist policy. In addition, we examined whether theexperience of personal and group discrimination differs between these two contexts, and whether such discrimination isrelated to acculturation and to adaptation.
Evidence relating to the first question and hypothesis shows that ethnic acculturation strategies (attitudes, identity andbehaviour) are higher in Montreal than in Paris, but that there are no differences in national acculturation (Table 2). Thispattern is consistent with the promotion of multiculturalism (and interculturalism in Quebec) in Canada, where themaintenance and expression of ones cultural heritage is encouraged and officially supported. However, despite thepromotion of the idea of ‘‘one nation’’ in France (but not in Canada), national acculturation is not greater there.
When these two acculturation attitudes are crossed to create the four acculturation strategies (Table 4), the percentage ofyouth categorised as ‘integration’ in Montreal is slightly higher than in Paris (29.1% vs. 27.1%) for attitudes alone but isconsiderably higher (29.5% vs. 20.4%) when using the orientation factor scores (composite score). In contrast, youthcategorised as ‘assimilation’ are higher in Paris than in Montreal (26.8% vs. 20.1%) for attitudes alone, but there is only a smalldifference (29.7% vs. 27.0%) using the orientation factor scores. Again, these differences in acculturation strategies areconsistent with the different policy orientations between the two countries.
With respect to our hypothesis regarding the relationship between discrimination and acculturation strategies (3.3.1) isexamined (Tables 8 and 9), in Paris discrimination is highest for those categorised as separation and integration, and lowestfor those categorised as assimilation and marginalisation. This appears to show that retaining ones heritage culture in Franceis a basis for experiencing more discrimination. This is borne out by the correlations in Paris between ethnic acculturationvariables (attitudes, identity and factor scores) and discrimination: all coefficients are positive. In contrast, in Montreal, noneof the correlation coefficients is positive. That is, being oriented toward one’s ethnic group in Canada does not serve as a basisfor higher discrimination, while it appears to be so in France. Again, this difference is consistent with the policy and attitudedifferences between the two countries: cultural and identity maintenance are considered to be valuable in Canada, whereas
Table 10
Correlations among perceived discrimination and adaptation variables.
Montreal Paris
Personal Group Personal Group
Self-esteem
Rosenberg self-esteem �0.13* �0.04 0.04 0.10+
Emotional self-esteem (anxiety) �0.20*** �0.11* �0.04 0.02
Familial self-esteem �0.20*** �0.15* �0.13* �0.11*
Social self-esteem �0.21*** �0.12* 0.04 0.08
School self-esteem �0.20*** �0.05 �0.09 0.01
Academic performance �0.06 �0.02 �0.04 �0.02
Deviance 0.13* 0.13* 0.19*** 0.16***
+ p< .10.* p< .05.*** p< .001.
J.W. Berry, C. Sabatier / International Journal of Intercultural Relations 34 (2010) 191–207204
in France these are in many ways more or less discouraged, the maintenance of culture is seen as an obstacle to equality ofchance. For national acculturation, as expected, all correlations with discrimination are negative in both samples. However,these negative coefficients are somewhat larger in Montreal. It appears that being oriented toward the national society is abasis for experiencing less discrimination, especially in Canada.
These different relationships in Montreal and Paris show that the finding of Branscombe, Schmitt and Harvey (1999) maybe context-dependent. In their study, the experience of discrimination among African-Americans strengthened their ethnicidentity and weakened their ties to the national society. This pattern is evident in Paris, but not in Montreal, wherediscrimination does not enhance an ethnic orientation or identity.
With respect to our hypothesis regarding sample differences in perceived discrimination (3.3.2), the overall mean scorewas higher in Paris than in Montreal; however, this difference was the case only for group discrimination, not for personaldiscrimination. This difference coincides with reports of public attitudes towards immigrants in Canada (Adams, 2007) andFrance (CNCDH, 2006). It is interesting to note that in the 13-country study, perceived discrimination was higher in Canadathan in France; this is perhaps due both to the lower number of those seeking ‘integration’ and ‘separation’ in France, amongwhom perceived discrimination is higher and to the measurement of discrimination. In the 13-country study the perceiveddiscrimination focused mainly on personal discrimination while in this study the measure focus both on personal and groupdiscrimination.
With respect to the negative relationship between discrimination and orientation towards, and identification with, thenational society, the ‘multiculturalism hypothesis’ (see Berry, 2006 for an overview) appears to be supported. Thishypothesis asserts that only when individuals are secure in their own identity will they be in a position to accept those whoare different from themselves; conversely when people are threatened (for example by pervasive discrimination) they willreciprocate their rejection by the larger society by expressing a negative view towards those who discriminate against them.This pattern is present in both samples.
With respect to sample differences in adaptation, these were assessed with two scales: Rosenberg Self-Esteem, andDeviance. For both variables, second generation youth in Montreal are more adapted than youth in Paris. Given the role ofdiscrimination in the lower adaptation reported in previous research (e.g., Berry et al., 2006), we expected that suchexperience would be related to poorer adaptation in both samples. When discrimination is related to adaptation (Table 10),only some of the correlations reached significance; but when they did, they were in the expected direction (8 were significantin Montreal, and 4 were in Paris). This pattern is consistent with earlier analyses reported by Sabatier and Berry (2008); usingmultiple regression analyses, and taking out the effects of age and gender, discrimination tended to diminish adaptationmore in Montreal than in Paris.
With respect to our second main hypothesis (3.2), does it matter how youth acculturate? The general pattern (Tables 6 and7) shows that there is significant variation across the four acculturation strategies (using both their attitudes and orientationfactor scores). This variation is present in Montreal for five of six adaptation variables using attitudes alone, and for all sixadaptation variables using factor scores. In Paris, this variation is present for two of the adaptation variables using attitudes (andfor three using factor scores). We may conclude that it does indeed matter how youth engage their acculturation.
What does this variation show? For all adaptation variables, and in both samples, those youth who are categorised as‘integration’ have numerically higher adaptation scores, and in nearly almost all cases, those who are categorised as‘marginalisation’ have lower adaptation scores. Where there are significant differences between specific acculturationstrategies, they are present mostly for the contrast between integration and marginalisation. This general patterncorresponds with much of the previous research with adults (reviewed by Berry, 1997) and with youth (Berry et al., 2006).Adaptation scores for the other two acculturation strategies (assimilation and separation) generally fall in between thesetwo end points. Sometimes one has numerically better adaptation scores, sometimes the other does; there are fewer specificsignificant differences between these two ways of acculturating. Overall, we may conclude that acculturation strategies andadaptation are related in important ways. This is relatively more the case in Montreal than in Paris.
With respect to our hypothesis regarding the relationship between discrimination and adaptation (3.3.3), the evidence(Table 10) shows that when there are significant correlations, they generally impacted adaptation negatively. For example inMontreal 9 of 14 correlations were significant (mostly for personal discrimination); and in Paris 4 of 14 correlations weresignificant (2 each for personal and group discrimination).
The finding that discrimination is high for those youth seeking to integrate in Paris (Table 8) signals an importantdivergence from the general finding in the literature (e.g., Berry et al., 2006); it is also a difference from the finding in thisstudy for Canada (where integration youth generally have the lowest discrimination). What is the situation facing youth inFrance that makes integration more a risk for discrimination? One clue is that discrimination scores are even higher for youthin Paris who are categorised as ‘separation’. Integration and separation acculturation strategies both involve a highpreference for ‘cultural maintenance’ (see Fig. 1). This preference contradicts the general policy orientation in France(favouring ‘assimilation’), and may well draw negative attention from the larger society to both the individual and theethnocultural group.
7. Conclusion
The three questions guiding this study of immigrant youth received answers that are both consistent with and divergentfrom the literature pertaining to adult immigrants. With respect to the first question, it is clear that immigrant youth hold
J.W. Berry, C. Sabatier / International Journal of Intercultural Relations 34 (2010) 191–207 205
varying views about how they wish to acculturate and about their cultural identities. The two dimensions of interest(cultural maintenance and social participation), and the fourfold conceptualisation of ways of acculturating based uponthem, appear to serve as a sensible way for youth to express their preferences. Moreover, the oft-found preference forintegration in the adult literature also appears to be supported by the distribution of responses among immigrant youth.Consistent with the view of Arends-Toth and Van de Vijver (2006), we conclude that there can be no doubt that a two-dimensional approach is most appropriate for understanding these preferences. Identifying more with one’s ethnic group isnot conceptually, nor empirically, opposed to identifying with one’s national society. The unidimensional approach, whereindividuals must choose between the two poles of acculturation strategies and cultural identities, does not capture thecomplexity of how youth work out their new lives in their new societies.
Second, there is support for the two forms of adaptation: psychological well-being and sociocultural competence areconceptually and empirically distinct among immigrant youth, and they have different predictors.
Finally, the pattern of relationships between how youth acculturate and how well they adapt largely replicates thefindings with adult immigrants. Those seeking to integrate adapt better than those who are marginalised, with assimilationand separation ways falling in between.
However, this set of relationships is stronger and more consistent in Montreal than in Paris. This difference appears tomatch the differences in public policy and public attitudes between the two societies: it is more difficult to adapt well whenone’s ethnicity is being questioned.
Finally, we acknowledge the limitations of a cross-sectional approach to the study of the process of acculturation. Ideally,longitudinal research is required to better understand the relationships, and causal links between acculturation strategiesand experiences and adaptation. To our knowledge, such a comprehensive longitudinal study has not yet been carried out. Tothe extant that structural modeling with large data sets is able to approximate causal links among variables, the results fromBerry et al. (2006, Fig. 6.2) suggest that acculturation strategies contribute to ethnic contacts, as well as to both psychologicaland sociocultural adaptations. However, by far the most important contributor to both forms of adaptation was theexperience of discrimination. If these interpretations can be generalized to the present study, we may conclude that indeedadaptation is the outcome of acculturation strategies and discrimination.
Acknowledgments
This project is supported by a grant to the authors from SSHRC (Social Sciences and Humanities Research Council, Canada)and to the second author by INSERM (Institut national de la sante et de la recherche medicale, France).
References
Adams, M. (2007). Unlikely utopia: The surprising triumph of pluralism in Canada. Toronto: Viking.Arends-Toth, J., & Van de Vijver, F. J. R. (2006). Issues in the conceptualisation and assessment of acculturation. In M. Bornstein & L. Cote (Eds.), Acculturation and
parent–child relationships (pp. 33–62). Mahwah: Lawrence Erlbaum Associates.Berry, J. W. (1974). Psychological aspects of cultural pluralism. Topics in Culture Learning, 2, 17–22.Berry, J. W. (1980). Acculturation as varieties of adaptation. In P. M. Padilla (Ed.), Acculturation: Theory, models and some findings (pp. 9–25). Boulder, CO: Westview.Berry, J. W. (1984). Multicultural policy in Canada: A social psychological analysis. Canadian Journal of Behavioural Science, 16(4), 353–370.Berry, J. W. (1997). Immigration, acculturation and adaptation. Applied Psychology: An International Review, 46(1), 5–68.Berry, J. W. (2003). Conceptual approaches to acculturation. In K. Chun, P. Balls-Organista, & G. Marin (Eds.), Acculturation: Advances in theory, measurement and
application (pp. 17–37). Washington: APA Books.Berry, J. W. (2006). Mutual attitudes among immigrants and ethnocultural groups in Canada. International Journal of Intercultural Relations, 30(6), 719–734.Berry, J. W., Kalin, R., & Taylor, D. (1977). Multiculturalism and ethnic attitudes in Canada. Ottawa: Supply and Services.Berry, J. W., Kim, U., Power, S., Young, M., & Bujaki, M. (1989). Acculturation attitudes in plural societies. Applied Psychology: An International Review, 38(2), 185–
206.Berry, J. W., Phinney, J. S., Sam, D. L., & Vedder, P. (2006). Immigrant youth in cultural transition: Acculturation, identity and adaptation across national contexts.
Mahwah, NJ: Lawrence Erlbaum Associates.Bouchard, G., & Taylor, C. (2008). Fonder l’avenir. Le temps de la conciliation. Rapport de la Commission de consultation sur les pratiques d’accommodement reliees aux
differences culturelles. Building the future: A time for reconciliation]. Montreal: Commission de consultation sur les pratiques d’accommodement reliees auxdifferences culturelles.
Bourhis, R. Y., Moıse, L. C., Perreault, S., & Senecal, S. (1997). Towards an interactive acculturation model: A social psychological approach. International Journal ofPsychology, 32(6), 369–386.
Branscombe, N. R., Schmitt, M., & Harvey, R. (1999). Perceiving pervasive discrimination among African Americans: Implications for group identification and well-being. Journal of Personality and Social Psychology, 77(1), 135–149.
CNCDH. (2006). Rapport de la Commission Nationale Consultative. Report of the national consulting committee]. Paris: La Documentation francaise.Coopersmith, S. (1981). Self-image inventory. Palo Alto: Consulting Psychologist Press.Dona, G., & Berry, J. W. (1994). Acculturation attitudes and acculturative stress of Central-American refugees. International Journal of Psychology, 29(1), 57–70.Dornbusch, S., Ritter, P., Chen, Z. Y., & Mont-Reynaud, R. (1989). Ethnic differences in family decision-making among adolescents. Paper presented at the meeting of
Society for Research in Child Development.Gil, A. G., Vega, W. A., & Dimas, J. M. (1994). Acculturative stress and personal adjustment among Hispanic adolescent boys. Journal of Community Psychology, 22(1),
43–54.Gordon, M. M. (1964). Assimilation in American life. New York: Oxford University Press.Government of Canada. (1971). Multiculturalism policy statement to the house of commons. Ottawa: Hansard.Greene, M. L., Way, N., & Pahl, K. (2006). Trajectories of perceived adult and peer discrimination among Black, Latino, and Asian American adolescents: Patterns
and psychological correlates. Developmental Psychology, 42(2), 218–238.Herz, L., & Gullone, E. (1999). The relationship between self-esteem and parenting style: A cross-cultural comparison of Australian and Vietnamese Australian
adolescents. Journal of Cross-Cultural Psychology, 30(6), 742–761.
J.W. Berry, C. Sabatier / International Journal of Intercultural Relations 34 (2010) 191–207206
Knight, G. P., Bernal, M. E., Garzza, C. A., Cota, M. K., & Ocampo, K. A. (1993). Family socialization and the ethnic identity of Mexican–American children. Journal ofCross-Cultural Psychology, 24(1), 99–114.
Laukkanen, E., Halonen, P., Aivio, A., Viinamaki, H., & Lehtonen, J. (2000). Construct validity of the offer self-image questionnaire in Finnish 13-year-oldadolescents: Differences in the self-images of boys and girls. Nordic Journal of Psychiatry, 54(6), 431–435.
Leiderman, P. H., Meldman, M. A., & Ritter, P. L. (1989). Parental and peer influences on adolescent self-esteem in a multiethnic high school population. Paperpresented at the meetings of the Society for Research in Child Development.
Nguyen, H. H., & von Eye, A. (2002). The Acculturation Scale for Vietnamese Adolescents (ASVA): A bidimensional perspective. International Journal of BehavioralDevelopment, 3(3), 202–213.
Noels, K. A., & Berry, J. W. (2006). Acculturation in Canada. In D. L. Sam & J. W. Berry (Eds.), The Cambridge handbook of acculturation psychology (pp. 274–293).Cambridge, UK: Cambridge University Press.
Offer, D., Ostrov, E., Howard, K. I., & Atknson, R. (1988). The teenage world. Adolescents’ self-image in ten countries. New York: Plenum Medical Book Co.Phinney, J. S. (1990). Ethnic identity in adolescents and adults: Review of research. Psychological Bulletin, 108(3), 499–514.Phinney, J. S. (2003). Ethnic identity and acculturation. In K. Chun, P. Balls-Organista, & G. Marin (Eds.), Acculturation: Advances in theory, measurement and
application (pp. 63–81). Washington: APA Books.Rosenberg, G. M. (1965). Society and the adolescent self-image. Princeton, NJ: Princeton University Press.Rosenthal, D. A., & Cichello, A. M. (1986). The meeting of two cultures: Ethnic identity and psychosocial adjustment of Italian–Australian adolescents. International
Journal of Psychology, 21(4/5), 487–501.Ryder, A. G., Alden, L. E., & Paulhus, D. L. (2000). Is acculturation unidimensional or bidimensional? A head-to-head comparison in the prediction of personality,
self-identity, and adjustment. Journal of Personality and Social Psychology, 79(1), 49–65.Sabatier, C., & Berry, J. W. (1994). Immigration et acculturation. In R. Y. Bourhis J.-P. Leyens (Eds.), Stereotypes, discrimination et relations intergroupes (pp. 261–291).
Stereotypes, discrimination and intergroup relationshipsBruxelles: Mardaga.Sabatier, C., & Berry, J. W. (2008). The role of family acculturation, parental style and perceived discrimination in the adaptation of second generation immigrant
youth in France and Canada. European Journal of Developmental Psychology, 5, 159–185.Sabatier, C., & Boutry, V. (2006). Acculturation in the Francophone European countries: Context and concepts. In D. L. Sam & J. W. Berry (Eds.), Cambridge handbook
of acculturation psychology (pp. 349–367). Cambridge, UK: Cambridge University Press.Stevens, G. W. J. M. , Pels, T. V. M., & Vollebergh, W. A. M. (2004). Patterns of psychological acculturation in adult and adolescent Moroccan immigrants living in the
Netherlands. Journal of Cross-Cultural Psychology, 35(6), 689–704.Tchoryk-Pelletier, P. (1989). L’adaptation des minorites ethniques. Une etude realisee au CEGEP de Saint-Laurent. Adaptation of ethnic minorities. A study in Saint-
Laurent college]. Montreal, Canada: CEGEP de Saint-Laurent. (Research report).Tremblay, G., Saucier, J.-F., & Tremblay, R. E. (2004). Identity and disruptiveness in boys: Longitudinal perspectives. Child and Adolescent Social Work Journal, 21(4),
387–406.Van de Vijver, F., Helms-Lornz, M., & Feltzer, M. J. (1999). Acculturation and cognitive performance of migrant children in the Netherlands. International Journal of
Psychology, 34(3), 149–162.Vega, W. A., Khoury, E. L., Zimmerman, R. S., Gil, A. G., & Warheit, G. J. (1995). Cultural conflicts and problem behaviors of Latino adolescents in home and school
environments. Journal of Community Psychology, 23(2), 167–179.Virta, E., Sam, D. L., & Westin, C. (2004). Adolescents with Turkish background in Norway and Sweden: A comparative study of their psychological adaptation.
Scandinavian Journal of Psychology, 45(1), 15–25.Ward, C. (1996). Acculturation. In D. Landis & R. Bhagat (Eds.), Handbook of intercultural training (2nd ed., pp. 124–147). Newbury Park, CA: Sage.
J.W. Berry, C. Sabatier / International Journal of Intercultural Relations 34 (2010) 191–207 207