AA 2Q11 Analyst Presentation
26
Second Quarter 2011 Results 23 August 2011
-
Upload
myra-azura -
Category
Documents
-
view
220 -
download
0
Transcript of AA 2Q11 Analyst Presentation
8/3/2019 AA 2Q11 Analyst Presentation
http://slidepdf.com/reader/full/aa-2q11-analyst-presentation 1/26
Second Quarter 2011 Results23 August 2011
8/3/2019 AA 2Q11 Analyst Presentation
http://slidepdf.com/reader/full/aa-2q11-analyst-presentation 2/26
Disclaimer
Information contained in our presentation is intended solely for your reference. Suchinformation is subject to change without notice, its accuracy is not guaranteed and it may notcontain all material information concerning the Company. Neither we nor our advisors makeany representation regarding, and assumes no responsibility or liability for, the accuracy orcompleteness of, or any errors or omissions in, any information contained herein.
In addition, the information may contain projections and forward-looking statements that
reflect the company’s current views with respect to future events and financial performance.These views are based on current assumptions which are subject to various risks factors andwhich may change over time. No assurance can be given that future events will occur, thatprojections will be achieved, or that the company’s assumptions are correct. Actual resultsmay differ materially from those projected.
This presentation can be distributed without any consent of the Company as this is a publicly
available announcement.
11
8/3/2019 AA 2Q11 Analyst Presentation
http://slidepdf.com/reader/full/aa-2q11-analyst-presentation 3/26
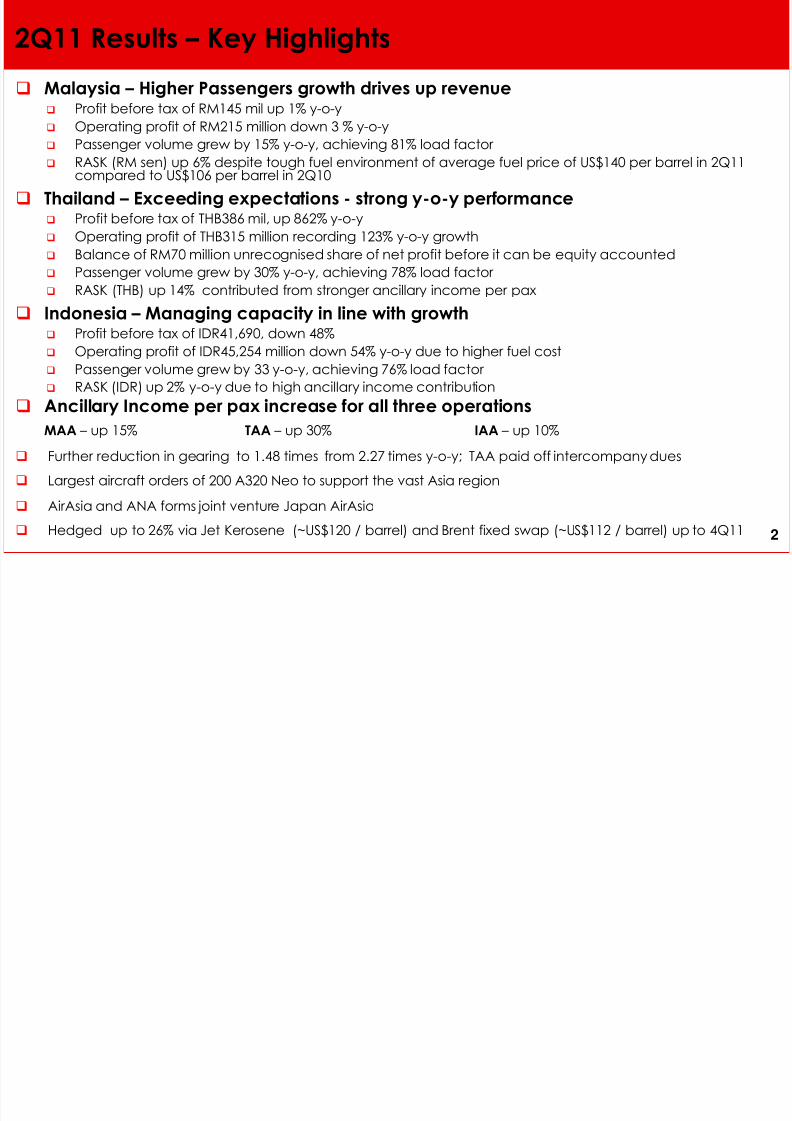
2Q11 Results – Key Highlights
2
Malaysia – Higher Passengers growth drives up revenue Profit before tax of RM145 mil up 1% y-o-y
Operating profit of RM215 million down 3 % y-o-y
Passenger volume grew by 15% y-o-y, achieving 81% load factor
RASK (RM sen) up 6% despite tough fuel environment of average fuel price of US$140 per barrel in 2Q11compared to US$106 per barrel in 2Q10
Thailand – Exceeding expectations - strong y-o-y performance Profit before tax of THB386 mil, up 862% y-o-y
Operating profit of THB315 million recording 123% y-o-y growth
Balance of RM70 million unrecognised share of net profit before it can be equity accounted
Passenger volume grew by 30% y-o-y, achieving 78% load factor RASK (THB) up 14% contributed from stronger ancillary income per pax
Indonesia – Managing capacity in line with growth Profit before tax of IDR41,690, down 48%
Operating profit of IDR45,254 million down 54% y-o-y due to higher fuel cost
Passenger volume grew by 33 y-o-y, achieving 76% load factor
RASK (IDR) up 2% y-o-y due to high ancillary income contribution
Ancillary Income per pax increase for all three operationsMAA – up 15% TAA – up 30% IAA – up 10%
Further reduction in gearing to 1.48 times from 2.27 times y-o-y; TAA paid off intercompany dues
Largest aircraft orders of 200 A320 Neo to support the vast Asia region
AirAsia and ANA forms joint venture Japan AirAsia
Hedged up to 26% via Jet Kerosene (~US$120 / barrel) and Brent fixed swap (~US$112 / barrel) up to 4Q11 2
8/3/2019 AA 2Q11 Analyst Presentation
http://slidepdf.com/reader/full/aa-2q11-analyst-presentation 4/26
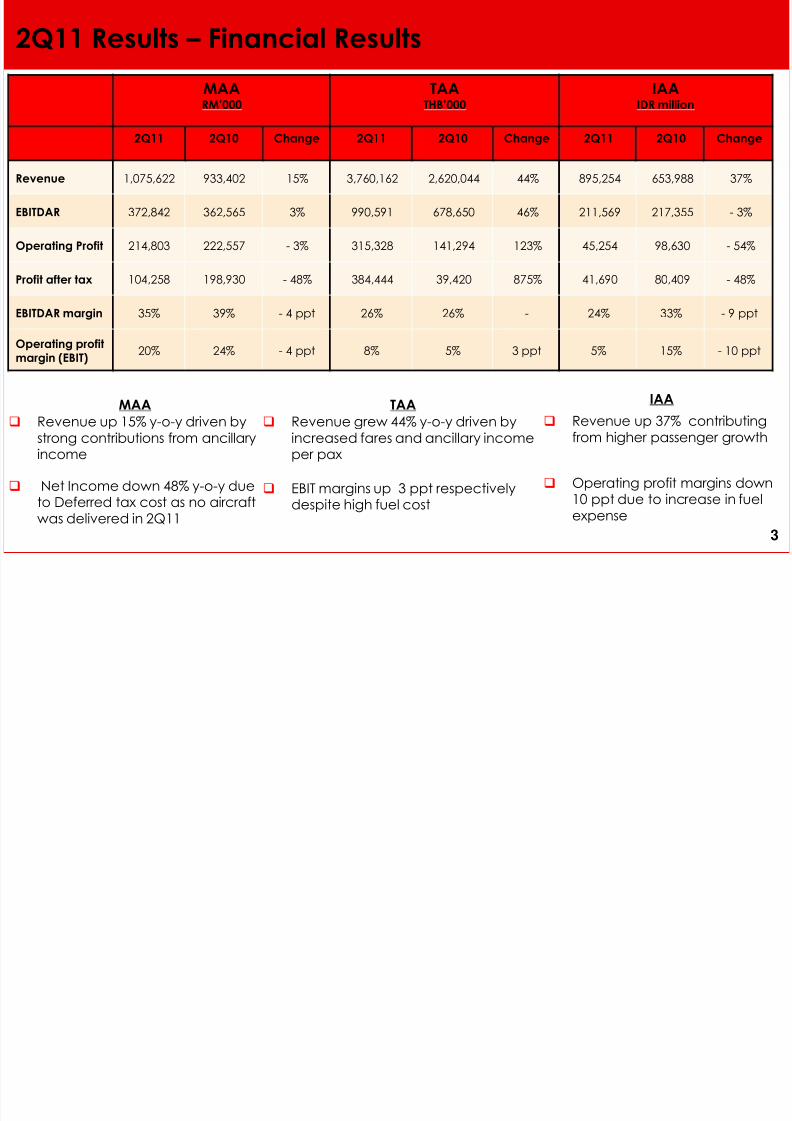
2Q11 Results – Financial Results
3
MAARM’000
TAATHB’000
IAAIDR million
2Q11 2Q10 Change 2Q11 2Q10 Change 2Q11 2Q10 Change
Revenue 1,075,622 933,402 15% 3,760,162 2,620,044 44% 895,254 653,988 37%
EBITDAR 372,842 362,565 3% 990,591 678,650 46% 211,569 217,355 - 3%
Operating Profit 214,803 222,557 - 3% 315,328 141,294 123% 45,254 98,630 - 54%
Profit after tax 104,258 198,930 - 48% 384,444 39,420 875% 41,690 80,409 - 48%
EBITDAR margin 35% 39% - 4 ppt 26% 26% - 24% 33% - 9 ppt
Operating profit
margin (EBIT)20% 24% - 4 ppt 8% 5% 3 ppt 5% 15% - 10 ppt
MAA
Revenue up 15% y-o-y driven bystrong contributions from ancillaryincome
Net Income down 48% y-o-y dueto Deferred tax cost as no aircraftwas delivered in 2Q11
TAA
Revenue grew 44% y-o-y driven byincreased fares and ancillary incomeper pax
EBIT margins up 3 ppt respectivelydespite high fuel cost
IAA
Revenue up 37% contributingfrom higher passenger growth
Operating profit margins down10 ppt due to increase in fuelexpense
3
8/3/2019 AA 2Q11 Analyst Presentation
http://slidepdf.com/reader/full/aa-2q11-analyst-presentation 5/26
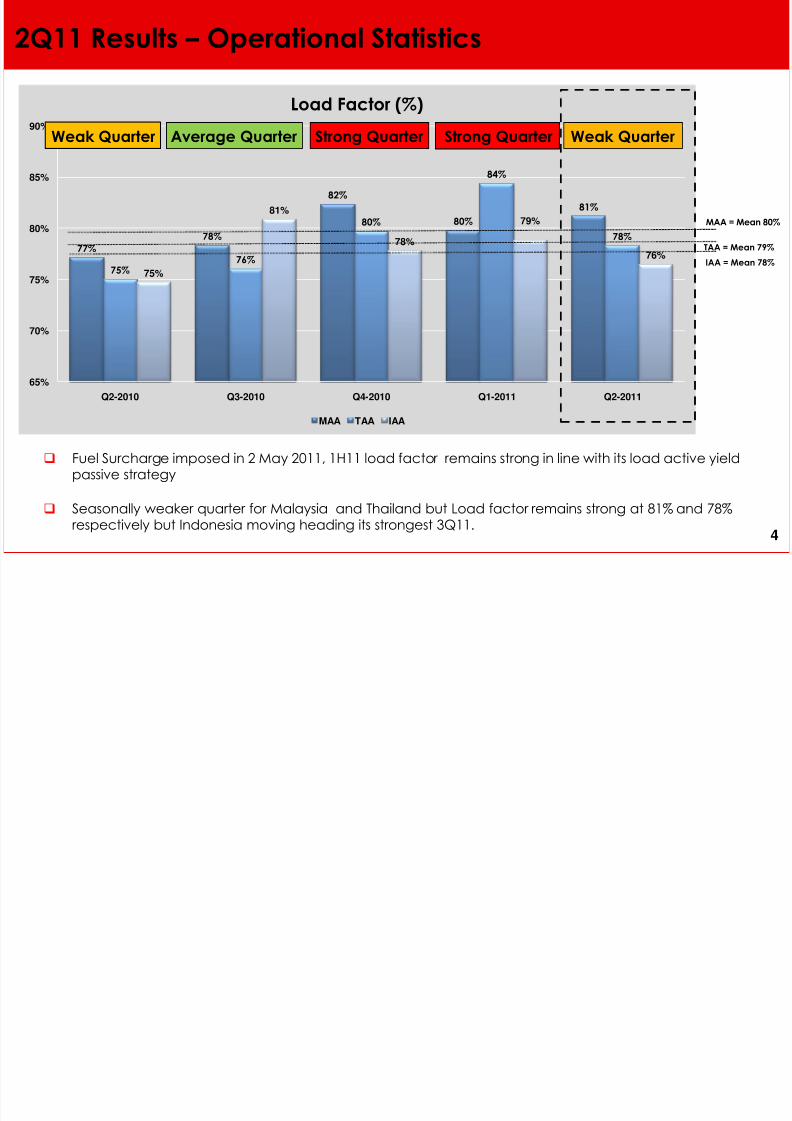
2Q11 Results – Operational Statistics
4
77%
78%
82%
80%
81%
75%76%
80%
84%
78%
75%
81%
78%
79%
76%
65%
70%
75%
80%
85%
90%
Q2-2010 Q3-2010 Q4-2010 Q1-2011 Q2-2011
Load Factor (%)
MAA TAA IAA
Average Quarter Weak QuarterStrong QuarterWeak Quarter
Fuel Surcharge imposed in 2 May 2011, 1H11 load factor remains strong in line with its load active yieldpassive strategy
Seasonally weaker quarter for Malaysia and Thailand but Load factor remains strong at 81% and 78%respectively but Indonesia moving heading its strongest 3Q11.
Strong Quarter
MAA = Mean 80%
TAA = Mean 79%
IAA = Mean 78%
4
8/3/2019 AA 2Q11 Analyst Presentation
http://slidepdf.com/reader/full/aa-2q11-analyst-presentation 6/26
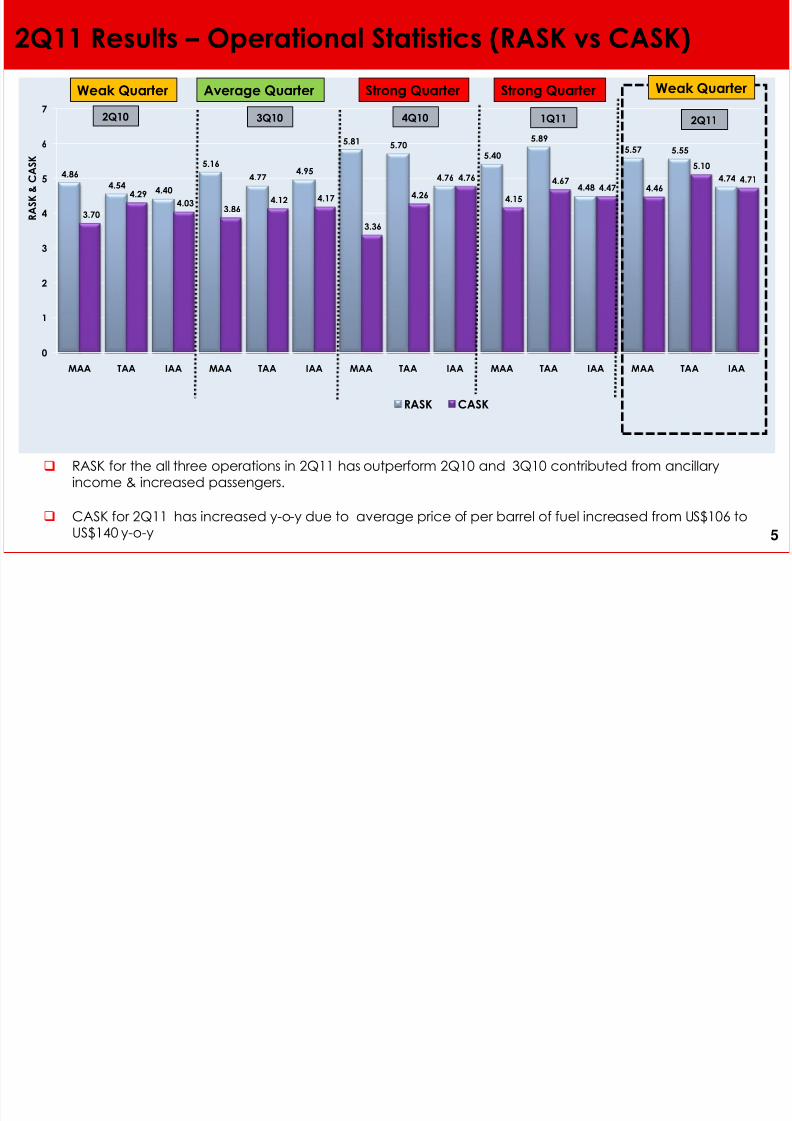
2Q11 Results – Operational Statistics (RASK vs CASK)
5
RASK for the all three operations in 2Q11 has outperform 2Q10 and 3Q10 contributed from ancillaryincome & increased passengers.
CASK for 2Q11 has increased y-o-y due to average price of per barrel of fuel increased from US$106 toUS$140 y-o-y
4.86
4.544.40
5.16
4.774.95
5.81 5.70
4.76
5.40
5.89
4.48
5.57 5.55
4.74
3.70
4.294.03
3.864.12 4.17
3.36
4.26
4.76
4.15
4.674.47 4.46
5.10
4.71
0
1
2
3
4
5
6
7
MAA TAA IAA MAA TAA IAA MAA TAA IAA MAA TAA IAA MAA TAA IAA
R A S K & C A S K
RASK CASK
2Q10 1Q114Q103Q10 2Q11
Average Quarter Strong QuarterWeak Quarter Strong Quarter Weak Quarter
5
8/3/2019 AA 2Q11 Analyst Presentation
http://slidepdf.com/reader/full/aa-2q11-analyst-presentation 7/26
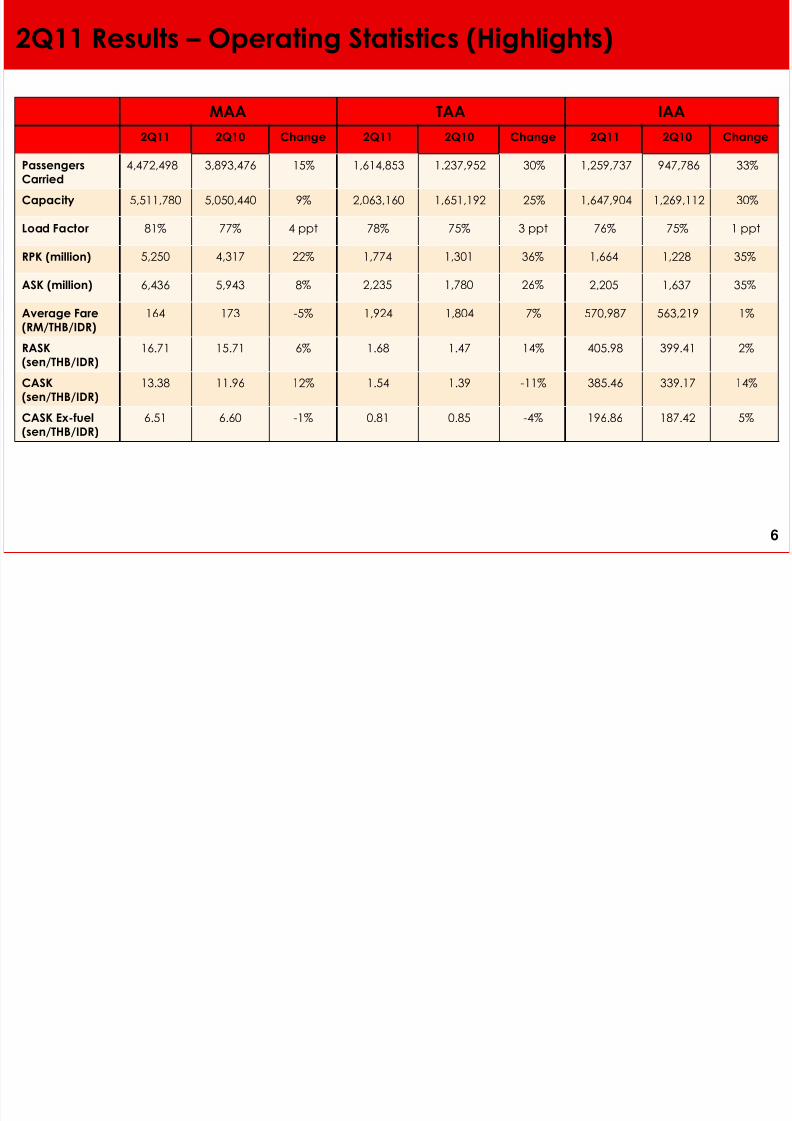
2Q11 Results – Operating Statistics (Highlights)
6
MAA TAA IAA
2Q11 2Q10 Change 2Q11 2Q10 Change 2Q11 2Q10 Change
Passengers
Carried4,472,498 3,893,476 15% 1,614,853 1.237,952 30% 1,259,737 947,786 33%
Capacity 5,511,780 5,050,440 9% 2,063,160 1,651,192 25% 1,647,904 1,269,112 30%
Load Factor 81% 77% 4 ppt 78% 75% 3 ppt 76% 75% 1 ppt
RPK (million) 5,250 4,317 22% 1,774 1,301 36% 1,664 1,228 35%
ASK (million) 6,436 5,943 8% 2,235 1,780 26% 2,205 1,637 35%
Average Fare
(RM/THB/IDR)164 173 -5% 1,924 1,804 7% 570,987 563,219 1%
RASK
(sen/THB/IDR)16.71 15.71 6% 1.68 1.47 14% 405.98 399.41 2%
CASK
(sen/THB/IDR)13.38 11.96 12% 1.54 1.39 -11% 385.46 339.17 14%
CASK Ex-fuel(sen/THB/IDR)
6.51 6.60 -1% 0.81 0.85 -4% 196.86 187.42 5%
6
8/3/2019 AA 2Q11 Analyst Presentation
http://slidepdf.com/reader/full/aa-2q11-analyst-presentation 8/26
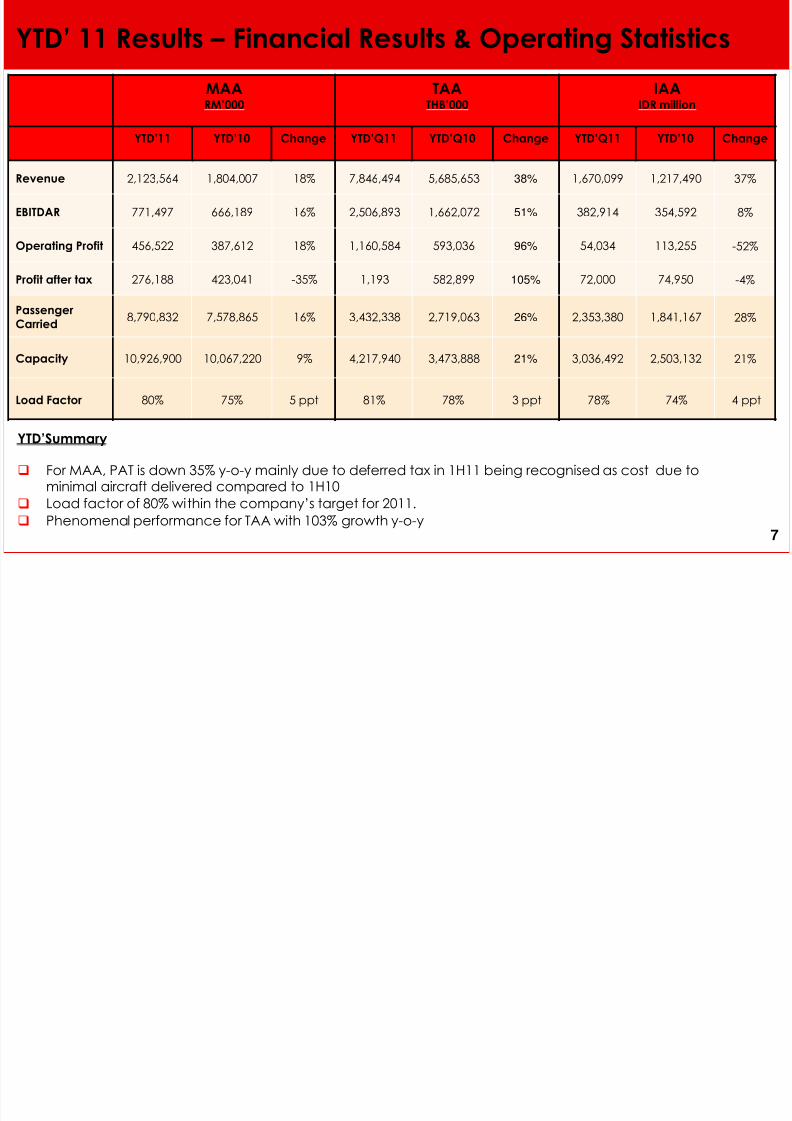
YTD’ 11 Results – Financial Results & Operating Statistics
7
MAARM’000
TAATHB’000
IAAIDR million
YTD’11 YTD’10 Change YTD’Q11 YTD’Q10 Change YTD’Q11 YTD’10 Change
Revenue 2,123,564 1,804,007 18% 7,846,494 5,685,653 38% 1,670,099 1,217,490 37%
EBITDAR 771,497 666,189 16% 2,506,893 1,662,072 51% 382,914 354,592 8%
Operating Profit 456,522 387,612 18% 1,160,584 593,036 96% 54,034 113,255 -52%
Profit after tax 276,188 423,041 -35% 1,193 582,899 105% 72,000 74,950 -4%
Passenger
Carried8,790,832 7,578,865 16% 3,432,338 2,719,063 26% 2,353,380 1,841,167 28%
Capacity 10,926,900 10,067,220 9% 4,217,940 3,473,888 21% 3,036,492 2,503,132 21%
Load Factor 80% 75% 5 ppt 81% 78% 3 ppt 78% 74% 4 ppt
YTD’Summary
For MAA, PAT is down 35% y-o-y mainly due to deferred tax in 1H11 being recognised as cost due tominimal aircraft delivered compared to 1H10
Load factor of 80% within the company’s target for 2011.
Phenomenal performance for TAA with 103% growth y-o-y7
8/3/2019 AA 2Q11 Analyst Presentation
http://slidepdf.com/reader/full/aa-2q11-analyst-presentation 9/26
CASK Breakdown
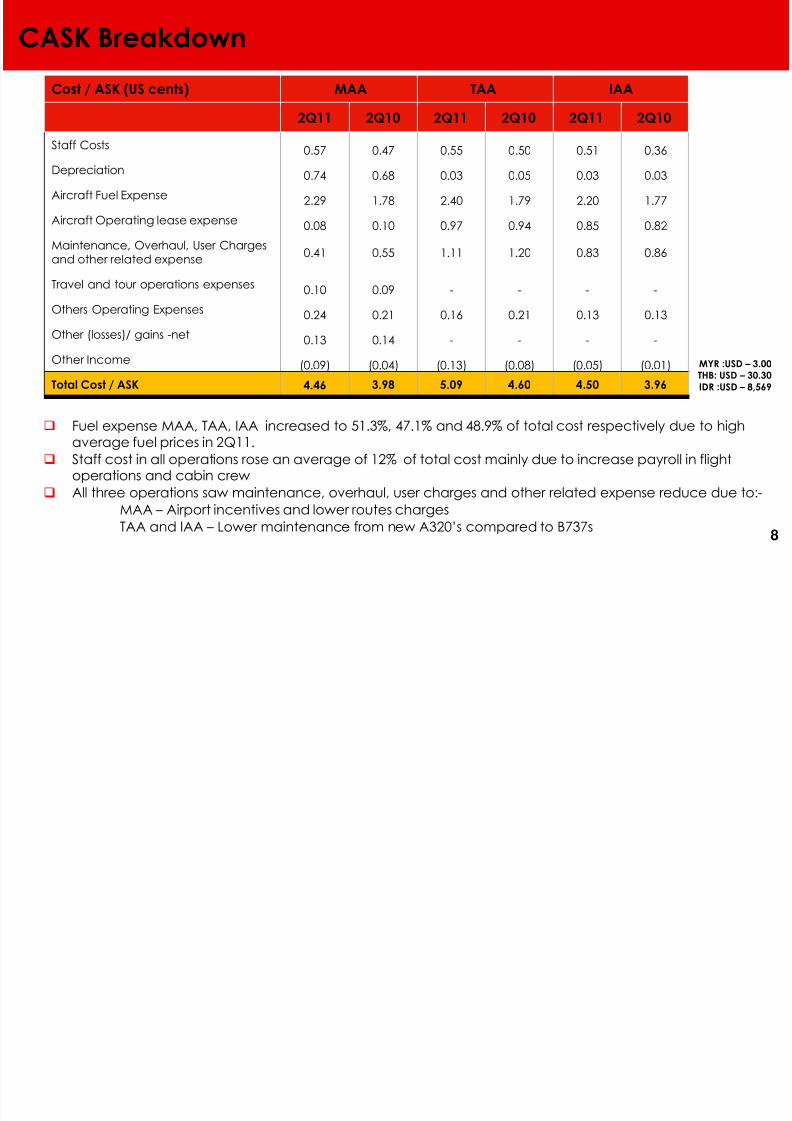
Cost / ASK (US cents) MAA TAA IAA
2Q11 2Q10 2Q11 2Q10 2Q11 2Q10
Staff Costs 0.57 0.47 0.55 0.50 0.51 0.36
Depreciation 0.74 0.68 0.03 0.05 0.03 0.03
Aircraft Fuel Expense 2.29 1.78 2.40 1.79 2.20 1.77
Aircraft Operating lease expense 0.08 0.10 0.97 0.94 0.85 0.82
Maintenance, Overhaul, User Chargesand other related expense
0.41 0.55 1.11 1.20 0.83 0.86
Travel and tour operations expenses 0.10 0.09 - - - -
Others Operating Expenses 0.24 0.21 0.16 0.21 0.13 0.13
Other (losses)/ gains -net 0.13 0.14 - - - -
Other Income (0.09) (0.04) (0.13) (0.08) (0.05) (0.01)
Total Cost / ASK 4.46 3.98 5.09 4.60 4.50 3.96
MYR :USD – 3.00THB: USD – 30.30
IDR :USD – 8,569
Fuel expense MAA, TAA, IAA increased to 51.3%, 47.1% and 48.9% of total cost respectively due to highaverage fuel prices in 2Q11.
Staff cost in all operations rose an average of 12% of total cost mainly due to increase payroll in flightoperations and cabin crew
All three operations saw maintenance, overhaul, user charges and other related expense reduce due to:-
MAA – Airport incentives and lower routes charges
TAA and IAA – Lower maintenance from new A320’s compared to B737s8
8/3/2019 AA 2Q11 Analyst Presentation
http://slidepdf.com/reader/full/aa-2q11-analyst-presentation 10/26
2Q11 Results – Ancillary Income
9
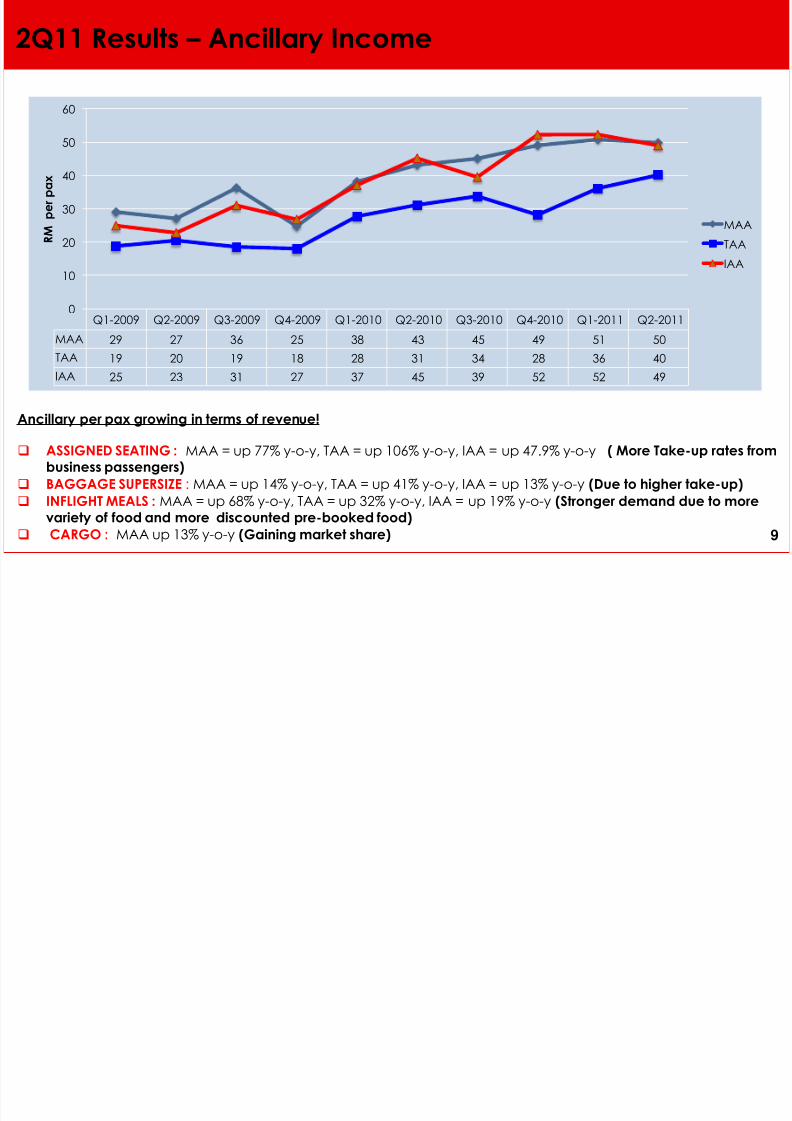
Q1-2009 Q2-2009 Q3-2009 Q4-2009 Q1-2010 Q2-2010 Q3-2010 Q4-2010 Q1-2011 Q2-2011
MAA 29 27 36 25 38 43 45 49 51 50
TAA 19 20 19 18 28 31 34 28 36 40
IAA 25 23 31 27 37 45 39 52 52 49
0
10
20
30
40
50
60
R M p e r p a x
MAA
TAA
IAA
Ancillary per pax growing in terms of revenue!
ASSIGNED SEATING : MAA = up 77% y-o-y, TAA = up 106% y-o-y, IAA = up 47.9% y-o-y ( More Take-up rates from
business passengers)
BAGGAGE SUPERSIZE : MAA = up 14% y-o-y, TAA = up 41% y-o-y, IAA = up 13% y-o-y (Due to higher take-up)
INFLIGHT MEALS : MAA = up 68% y-o-y, TAA = up 32% y-o-y, IAA = up 19% y-o-y (Stronger demand due to more
variety of food and more discounted pre-booked food)
CARGO : MAA up 13% y-o-y (Gaining market share) 9
8/3/2019 AA 2Q11 Analyst Presentation
http://slidepdf.com/reader/full/aa-2q11-analyst-presentation 11/26
2Q11 Results – Gearing Level
10
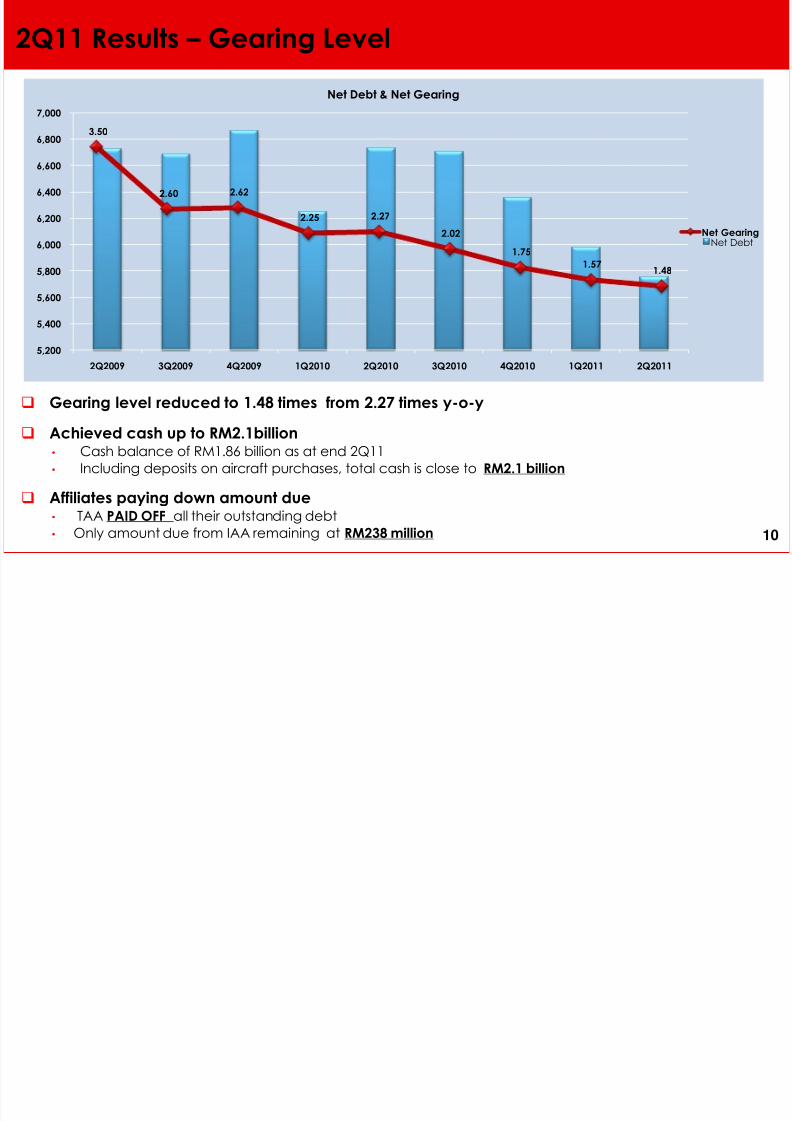
Gearing level reduced to 1.48 times from 2.27 times y-o-y
Achieved cash up to RM2.1billion• Cash balance of RM1.86 billion as at end 2Q11
• Including deposits on aircraft purchases, total cash is close to RM2.1 billion
Affiliates paying down amount due• TAA PAID OFF all their outstanding debt
• Only amount due from IAA remaining at RM238 million
5,200
5,400
5,600
5,800
6,000
6,200
6,400
6,600
6,800
7,000
2Q2009 3Q2009 4Q2009 1Q2010 2Q2010 3Q2010 4Q2010 1Q2011 2Q2011
Net Debt & Net Gearing
Net Debt
3.50
2.60 2.62
2.25 2.27
2.02
1.75
1.571.48
Net Gearing
10

8/3/2019 AA 2Q11 Analyst Presentation
http://slidepdf.com/reader/full/aa-2q11-analyst-presentation 12/26
AIRASIA
GROWTH STORY
8/3/2019 AA 2Q11 Analyst Presentation
http://slidepdf.com/reader/full/aa-2q11-analyst-presentation 13/26
Forward Bookings
12
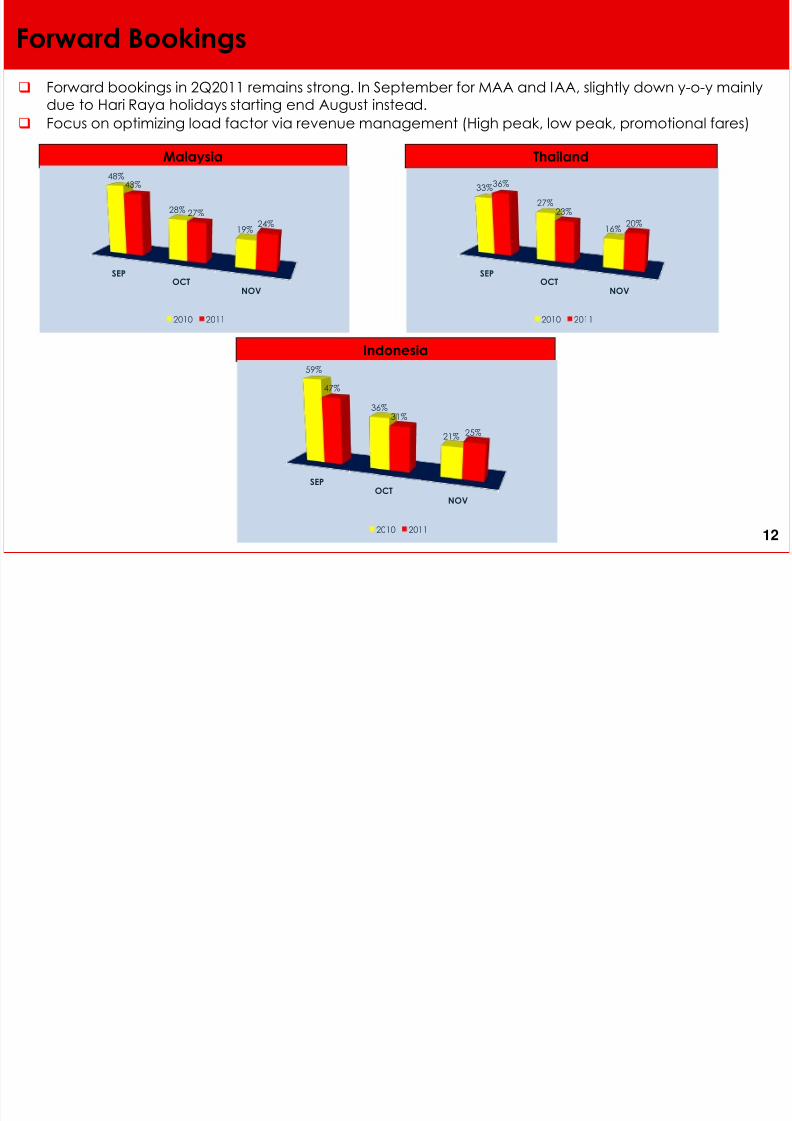
Forward bookings in 2Q2011 remains strong. In September for MAA and IAA, slightly down y-o-y mainlydue to Hari Raya holidays starting end August instead.
Focus on optimizing load factor via revenue management (High peak, low peak, promotional fares)
Thailand
Indonesia
Malaysia
SEPOCT
NOV
48%
28%
19%
43%
27%
24%
2010 2011
SEPOCT
NOV
33%
27%
16%
36%
23%
20%
2010 2011
SEPOCT
NOV
59%
36%
21%
47%
31%
25%
2010 201112
8/3/2019 AA 2Q11 Analyst Presentation
http://slidepdf.com/reader/full/aa-2q11-analyst-presentation 14/26
AirAsia’s biggest order with Airbus
13
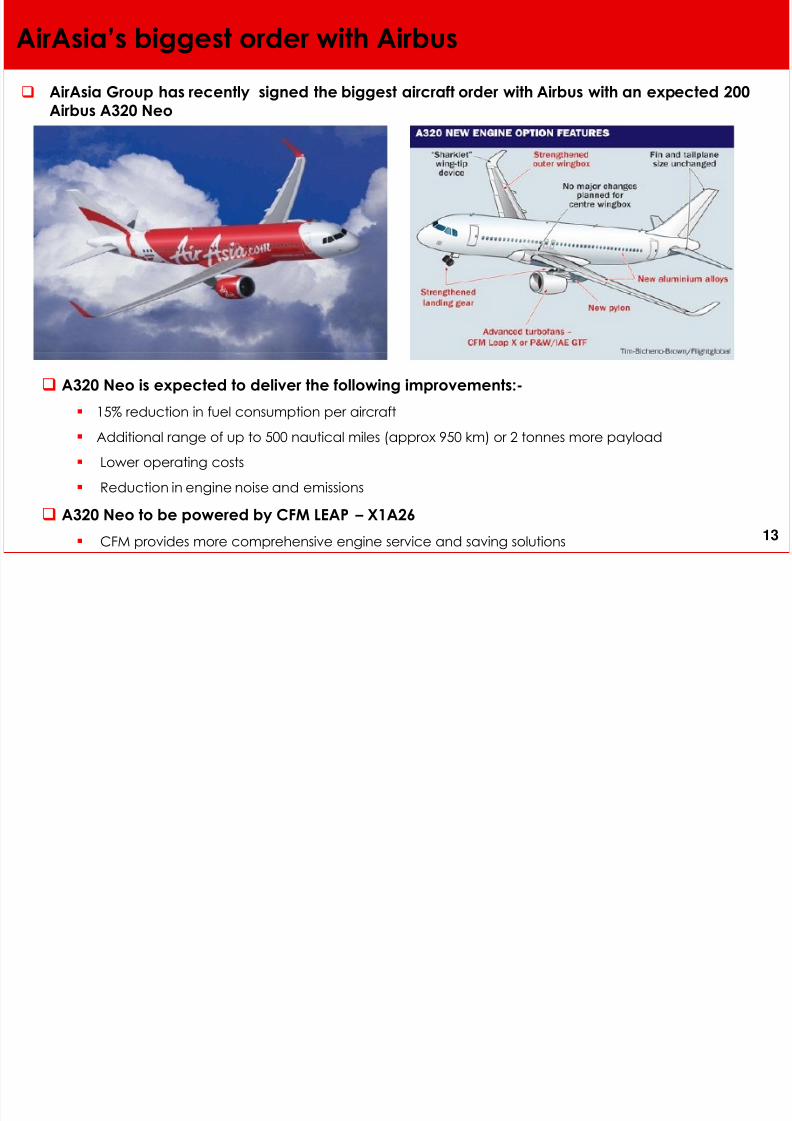
AirAsia Group has recently signed the biggest aircraft order with Airbus with an expected 200
Airbus A320 Neo
A320 Neo is expected to deliver the following improvements:-
15% reduction in fuel consumption per aircraft
Additional range of up to 500 nautical miles (approx 950 km) or 2 tonnes more payload
Lower operating costs
Reduction in engine noise and emissions
A320 Neo to be powered by CFM LEAP – X1A26
CFM provides more comprehensive engine service and saving solutions 13
8/3/2019 AA 2Q11 Analyst Presentation
http://slidepdf.com/reader/full/aa-2q11-analyst-presentation 15/26
Fleet Strategy
14
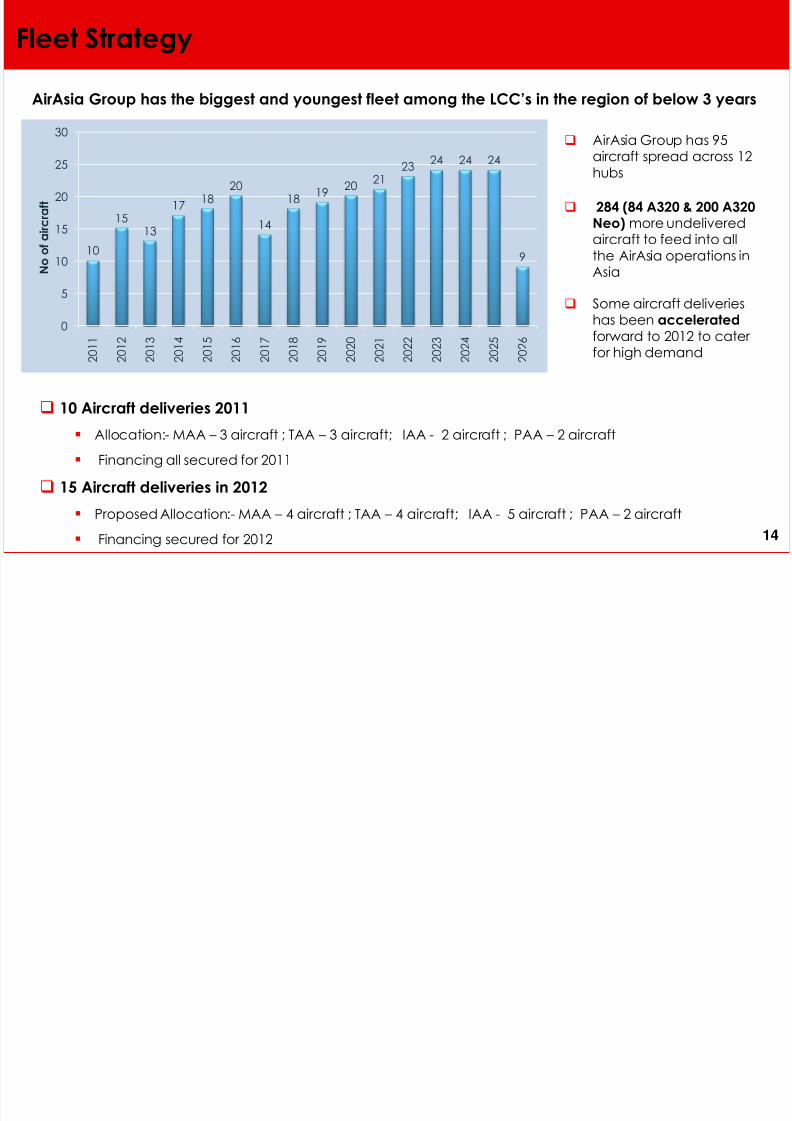
AirAsia Group has the biggest and youngest fleet among the LCC’s in the region of below 3 years
10
1513
1718
20
14
1819
2021
2324 24 24
9
0
5
10
15
20
25
30
2 0 1 1
2 0 1 2
2 0 1 3
2 0 1 4
2 0 1 5
2 0 1 6
2 0 1 7
2 0 1 8
2 0 1 9
2 0 2 0
2 0 2 1
2 0 2 2
2 0 2 3
2 0 2 4
2 0 2 5
2 0 2 6
N o o f a i r c r a f t
10 Aircraft deliveries 2011
Allocation:- MAA – 3 aircraft ; TAA – 3 aircraft; IAA - 2 aircraft ; PAA – 2 aircraft
Financing all secured for 2011
15 Aircraft deliveries in 2012
Proposed Allocation:- MAA – 4 aircraft ; TAA – 4 aircraft; IAA - 5 aircraft ; PAA – 2 aircraft
Financing secured for 2012
AirAsia Group has 95aircraft spread across 12hubs
284 (84 A320 & 200 A320Neo) more undeliveredaircraft to feed into allthe AirAsia operations inAsia
Some aircraft deliverieshas been accelerated
forward to 2012 to cater for high demand
14
8/3/2019 AA 2Q11 Analyst Presentation
http://slidepdf.com/reader/full/aa-2q11-analyst-presentation 16/26
AirAsia Joint Ventures – Recognised model
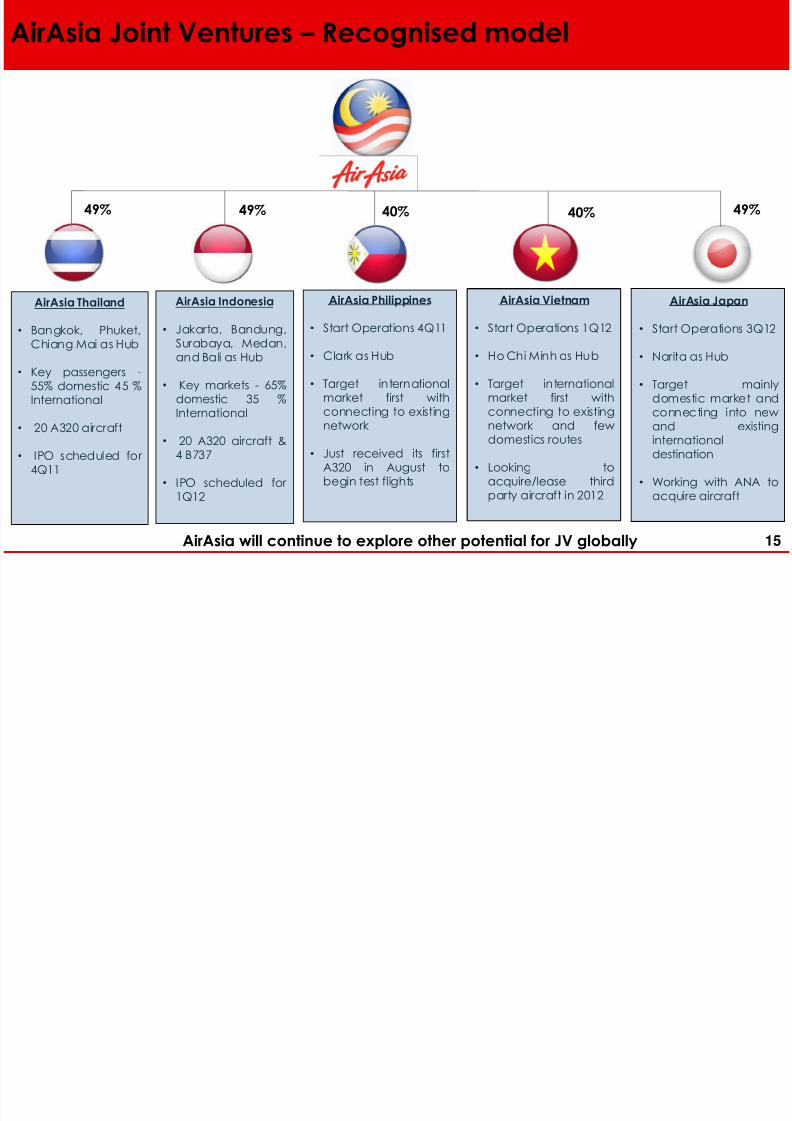
49% 49% 40% 49%40%
AirAsia Thailand
• Bangkok, Phuket,Chiang Mai as Hub
• Key passengers -55% domestic 45 %International
• 20 A320 aircraft
• IPO scheduled for 4Q11
AirAsia Indonesia
• Jakarta, Bandung,Surabaya, Medan,and Bali as Hub
• Key markets - 65%domestic 35 %
International
• 20 A320 aircraft &4 B737
• IPO scheduled for 1Q12
AirAsia Philippines
• Start Operations 4Q11
• Clark as Hub
• Target internationalmarket first withconnecting to existingnetwork
• Just received its firstA320 in August tobegin test flights
AirAsia Vietnam
• Start Operations 1Q12
• Ho Chi Minh as Hub
• Target internationalmarket first withconnecting to existingnetwork and fewdomestics routes
• Looking toacquire/lease thirdparty aircraft in 2012
AirAsia Japan
• Start Operations 3Q12
• Narita as Hub
• Target mainlydomestic market andconnecting into newand existinginternationaldestination
• Working with ANA toacquire aircraft
AirAsia will continue to explore other potential for JV globally 15
8/3/2019 AA 2Q11 Analyst Presentation
http://slidepdf.com/reader/full/aa-2q11-analyst-presentation 17/26
NEW Joint Venture - AirAsia Japan
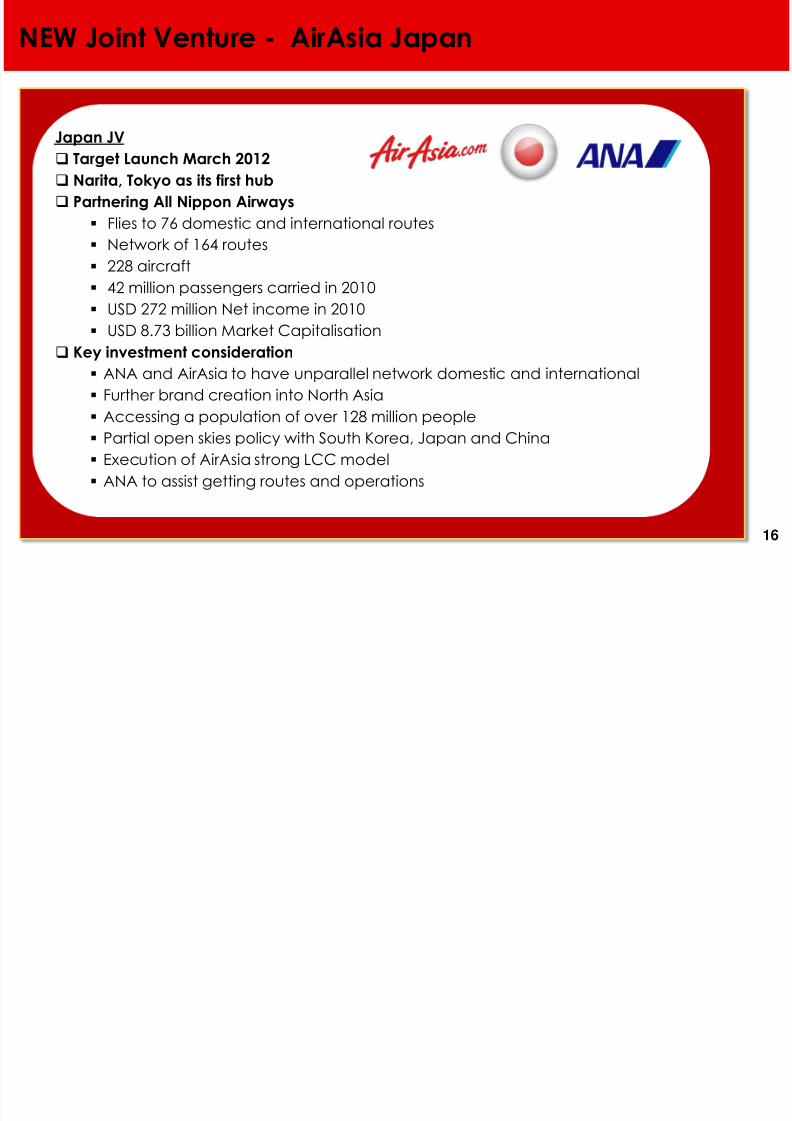
Japan JV Target Launch March 2012
Narita, Tokyo as its first hub
Partnering All Nippon Airways
Flies to 76 domestic and international routes
Network of 164 routes
228 aircraft
42 million passengers carried in 2010
USD 272 million Net income in 2010
USD 8.73 billion Market Capitalisation
Key investment consideration
ANA and AirAsia to have unparallel network domestic and international
Further brand creation into North Asia
Accessing a population of over 128 million people Partial open skies policy with South Korea, Japan and China
Execution of AirAsia strong LCC model
ANA to assist getting routes and operations
16
8/3/2019 AA 2Q11 Analyst Presentation
http://slidepdf.com/reader/full/aa-2q11-analyst-presentation 18/26
Monetising Ancillary business
Overview of AirAsia Go / Expedia JV
Launch in August
JV will combine AirAsiaGo with Expedia-branded storefronts in Japan, India, and ASEAN
-- AirAsia will contribute AA and AAX inventory and commission from ancillary sales
- - Expedia, Inc. will also contribute: hotel inventory at cost, technology solution
Capex requirements for the JV expected to be minimal
Overview of AirAsia Loyalty programme
Launch 4Q11
A programme in which members can earn points to redeem for flights and other awards
BIG will partner with merchants to allow members to earn at many places
BIG card will have a pre-paid debit card function where available (only Malaysia today),powered by a partner
Overview of AirAsia Academy JV with CAE JV has begun strategising its expansion plans
Satisfy AirAsia’s training needs but also capitalize on regional 3rd party training upside
Preferential training rates for AirAsia driven by JV’s higher asset utilization and lower
maintenance spend17
8/3/2019 AA 2Q11 Analyst Presentation
http://slidepdf.com/reader/full/aa-2q11-analyst-presentation 19/26
AirAsia an ASEAN Airline – Asean office
Key Strategies of ASEAN office
Team to position AirAsia as more than an ASEAN airline but also as an ASEAN company
Team to spearhead ASEAN initiatives in AirAsia and promote the airline as a regional brand and
huge economic contributor to the region
Liaison arm to work with governments, civic organizations, interest groups and communities for
issues concerning aviation and tourism as well as CSR projects
Team to closely monitor economic and socio-political developments in ASEAN
Our Vision
Inculcate the ASEAN ethos more deeply throughout the Group
Nurture an ASEAN “sensitivity” in all affiliates in their strategy and operations
Enhance AirAsia’s commitment to the communities of the region
Set regional direction for growth
Strategize and plan regional policies
• Regional branding
• Truly ASEAN airline and company
•Home grown, world class
18
8/3/2019 AA 2Q11 Analyst Presentation
http://slidepdf.com/reader/full/aa-2q11-analyst-presentation 20/26
Malaysia – Regional leader in aviation Industry
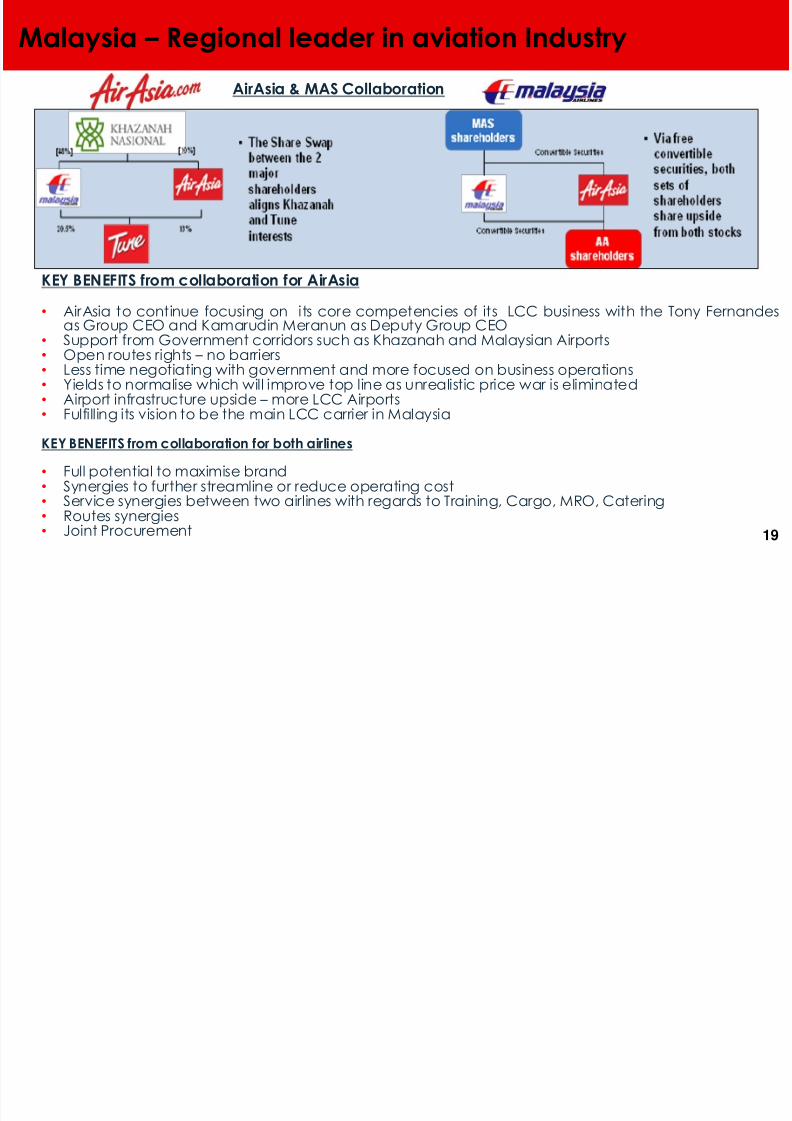
AirAsia & MAS Collaboration
KEY BENEFITS from collaboration for AirAsia
• AirAsia to continue focusing on its core competencies of its LCC business with the Tony Fernandesas Group CEO and Kamarudin Meranun as Deputy Group CEO
• Support from Government corridors such as Khazanah and Malaysian Airports• Open routes rights – no barriers• Less time negotiating with government and more focused on business operations• Yields to normalise which will improve top line as unrealistic price war is eliminated• Airport infrastructure upside – more LCC Airports•
Fulfilling its vision to be the main LCC carrier in MalaysiaKEY BENEFITS from collaboration for both airlines
• Full potential to maximise brand• Synergies to further streamline or reduce operating cost• Service synergies between two airlines with regards to Training, Cargo, MRO, Catering• Routes synergies• Joint Procurement 19
8/3/2019 AA 2Q11 Analyst Presentation
http://slidepdf.com/reader/full/aa-2q11-analyst-presentation 21/26
Key Strategies for AirAsia Group
MALAYSIA
Focus on building domestic market and strengthen other hubs
Add more frequencies on key domestic east Malaysia and trunk international routes
Focus on shorter routes – less than 3 hours
THAILAND
Building domestic market which is very profitable for Thai AirAsia
Build North Indian market from Thailand – attractive yields
Optimising fleet management to compete with other competitors
INDONESIA
Main focus on international routes; but also looking at unique domestics routes and routes
underserved by other airlines.
Focus on yield management in line with growth of domestic competitors
Plan to return all Boeing B737s by year end which will reduce cost structure
20
Our Vision
8/3/2019 AA 2Q11 Analyst Presentation
http://slidepdf.com/reader/full/aa-2q11-analyst-presentation 22/26
Our Vision
AirAsia is already a regional leader in the LCC space
• Expanding the AirAsia Brand and model to other regions
• To have unparalleled network via JV model and hubs structure
AirAsia will continue to be an independent run airline in Malaysia and the region
The management and the team at AirAsia will continue to strive to make AirAsia
become one of the world’s largest airlines
• Tony and Kamarudin to remain focus on AirAsia’s vision despite its other businessventures like Formula 1, Moto GP, Soccer, Basketball and other business ventures
• 284 aircraft to be delivered to feed into the ASEAN and Asia region
• Potential to explore further aircraft acquisition in line with growth
Forming synergistic alliances and monetising AirAsia’s business
• Synergies with other strategic airlines
• Additional partnerships for new markets; M&A
• Monetising ancillary business with strategic partners which allows management tofocus on the core business
21
8/3/2019 AA 2Q11 Analyst Presentation
http://slidepdf.com/reader/full/aa-2q11-analyst-presentation 23/26
22
Thank You

8/3/2019 AA 2Q11 Analyst Presentation
http://slidepdf.com/reader/full/aa-2q11-analyst-presentation 24/26
Appendix
2323
8/3/2019 AA 2Q11 Analyst Presentation
http://slidepdf.com/reader/full/aa-2q11-analyst-presentation 25/26
Overview
AirAsia has investments of 48.9% in both TAA and IAA The aviation laws of Thailand and Indonesia require foreign shareholdings to not exceed 50%
interest in these entities
Based on the shareholders’ agreements for these entities, TAA is considered to be a jointlycontrolled entity and IAA is considered to be an associate of AirAsia.
The basis of this consideration is due to the various covenants in the agreements whereby in thecase of TAA, key decisions are taken jointly and in the case of IAA, AirAsia has only significant
influence
Accounting Considerations AirAsia’s accounting treatment for its investments in IAA and TAA is in full compliance with
International Financial Reporting Standards (“FRS”)
The IFRS applied are FRS 131 “Accounting for Jointy Controlled Entities” (IFRS 31) which appliesto TAA and FRS 128 “ Accounting for Associates” (IFRS 28) which applies to IAA
TAA and IAA are accounted for using the equity method of accounting per the respectiveStandards
Consolidation of TAA and IAA is strictly prohibited by the IFRS unless the shareholder arrangements change, which result in AirAsia having control. AirAsia can account for all thelosses of TAA and IAA if it assumes obligations for all liabilities of TAA and IAA which willobviously be detrimental to the shareholders of AirAsia
Accounting for TAA and IAA
24
Accounting for TAA and IAA
8/3/2019 AA 2Q11 Analyst Presentation
http://slidepdf.com/reader/full/aa-2q11-analyst-presentation 26/26
25
Equity Accounting
The equity method is a method of accounting whereby the investment is initially recognisedat cost and adjusted thereafter for the post-acquisition change in the investor’s share of
net assets of the investee. The profit or loss of the investor includes the investor's share of theprofit or loss of the investee.
FRS 128 and FRS 131 provide that if an investor’s share of losses of an associate or jointlycontrolled entity equals or exceeds its interest in the associate, the investor discontinuesrecognising its share of further losses unless the investor has incurred legal or constructive
obligations or made payments on behalf of the associate. Consequently, as the share of losses for both TAA and IAA have exceeded the cost of
investment in these entities, AirAsia has in prior years fully provided for the cost of investmentin both TAA and IAA (amounting to RM12 million and RM4 million respectively), anddiscontinued its recognition of share of any further losses, as required by the Standard, as it
has not provided any legal or constructive obligations or made payments on behalf of theassociate or jointly controlled entity.
Accounting for TAA and IAA(continued)