GRUPOS VULNERABLES O DE ATENCIÓN PRIORITARIA CONSTITUCIÓN POLÍTICA DEL ECUADOR.
RESULTADOS FINALES RESULTADOS FINALES RESULTADOS FINALES RESULTADOS FINALES DE ESTUDIO DE ATENCIÓN A GRUPOS VULNERABLES DE ESTUDIO DE ATENCIÓN A GRUPOS VULNERABLES DE ESTUDIO DE ATENCIÓN A GRUPOS VULNERABLES DE ESTUDIO DE ATENCIÓN A GRUPOS VULNERABLES
2222
CONTENIDOCONTENIDOCONTENIDOCONTENIDO
INTRODUCCIÓN................................................................................................................................................................3
RESULTADOS DE LA ENCUESTA .........................................................................................................................................6
DISCRIMINACIÓN ..............................................................................................................................................................8
CALIDAD DE VIDA...........................................................................................................................................................12
GRUPOS VULNERABLES....................................................................................................................................................25
PERFIL SOCIO-DEMOGRÁFICO DE LA MUESTRA ...............................................................................................................31
CONCLUSIONES FINALES .................................................................................................................................................37
METODOLOGÍA...............................................................................................................................................................40
ANEXO A. DISTRIBUCIÓN MUESTRAL POR MUNICIPIO.......................................................................................................42
ANEXO B. DISTRIBUCIÓN MUESTRAL PARA EL DISTRITO FEDERAL.....................................................................................45
RESULTADOS FINALES RESULTADOS FINALES RESULTADOS FINALES RESULTADOS FINALES DE ESTUDIO DE ATENCIÓN A GRUPOS VULNERABLES DE ESTUDIO DE ATENCIÓN A GRUPOS VULNERABLES DE ESTUDIO DE ATENCIÓN A GRUPOS VULNERABLES DE ESTUDIO DE ATENCIÓN A GRUPOS VULNERABLES
3333
INTRODUCCIINTRODUCCIINTRODUCCIINTRODUCCIÓÓÓÓNNNN
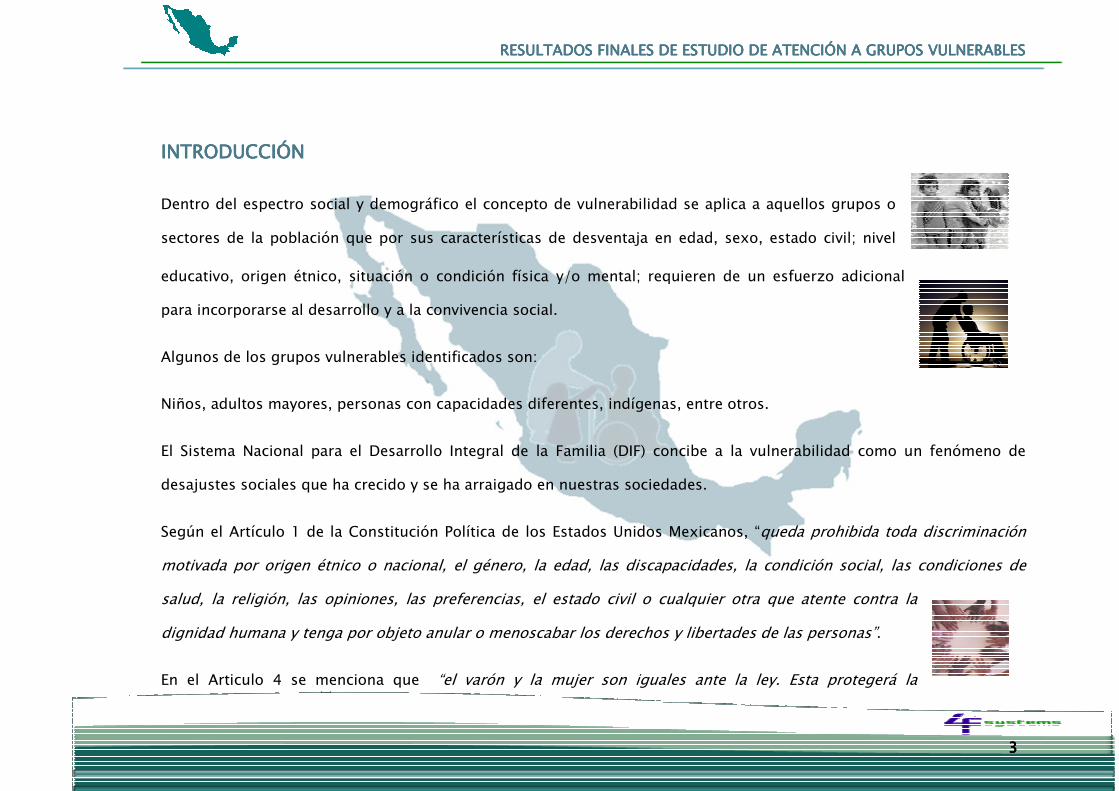
Dentro del espectro social y demográfico el concepto de vulnerabilidad se aplica a aquellos grupos o
sectores de la población que por sus características de desventaja en edad, sexo, estado civil; nivel
educativo, origen étnico, situación o condición física y/o mental; requieren de un esfuerzo adicional
para incorporarse al desarrollo y a la convivencia social.
Algunos de los grupos vulnerables identificados son:
Niños, adultos mayores, personas con capacidades diferentes, indígenas, entre otros.
El Sistema Nacional para el Desarrollo Integral de la Familia (DIF) concibe a la vulnerabilidad como un fenómeno de
desajustes sociales que ha crecido y se ha arraigado en nuestras sociedades.
Según el Artículo 1 de la Constitución Política de los Estados Unidos Mexicanos, “queda prohibida toda discriminación
motivada por origen étnico o nacional, el género, la edad, las discapacidades, la condición social, las condiciones de
salud, la religión, las opiniones, las preferencias, el estado civil o cualquier otra que atente contra la
dignidad humana y tenga por objeto anular o menoscabar los derechos y libertades de las personas”.
En el Articulo 4 se menciona que “el varón y la mujer son iguales ante la ley. Esta protegerá la
RESULTADOS FINALES RESULTADOS FINALES RESULTADOS FINALES RESULTADOS FINALES DE ESTUDIO DE ATENCIÓN A GRUPOS VULNERABLES DE ESTUDIO DE ATENCIÓN A GRUPOS VULNERABLES DE ESTUDIO DE ATENCIÓN A GRUPOS VULNERABLES DE ESTUDIO DE ATENCIÓN A GRUPOS VULNERABLES
4444
organización y el desarrollo de la familia”.
El artículo 1 de la Declaración Universal de los Derechos Humanos establece que "Todos los seres humanos nacen libres
e iguales en dignidad y derechos y, dotados como están de razón y conciencia, deben comportarse fraternalmente los
unos con los otros."
Todas las entidades federativas del país cuentan con normas jurídicas que regulan y que atienden a grupos vulnerables,
incluso en la mayoría de los casos cuentan con más de una ley.
Sin embargo, según diversos estudios, millones de mexicanos se encuentran en situación de vulnerabilidad y
discriminación.
Este trabajo presenta la percepción de la ciudadanía con respecto al conocimiento que se tiene de la atención a grupos
vulnerables en el país, así como la opinión acerca de la discriminación en México, además de la evaluación de ciertos
aspectos de la calidad de vida de los encuestados.
Fuentes:
http://info4.juridicas.unam.mx/ijure/fed/9/2.htm?s
http://archivos.diputados.gob.mx/Centros_Estudio/Cesop/Eje_tematico/8_gvulnerables.htm
http://www.lasnoticiasmexico.com/54929.html
RESULTADOS FINALES RESULTADOS FINALES RESULTADOS FINALES RESULTADOS FINALES DE ESTUDIO DE ATENCIÓN A GRUPOS VULNERABLES DE ESTUDIO DE ATENCIÓN A GRUPOS VULNERABLES DE ESTUDIO DE ATENCIÓN A GRUPOS VULNERABLES DE ESTUDIO DE ATENCIÓN A GRUPOS VULNERABLES
5555
http://www3.diputados.gob.mx/camara/001_diputados/008_comisioneslx/001_ordinarias/003_atencion_a_grupos_vuln
erables/002_grupos_vulnerables
www.dif.gob.mx
www.cinu.org.mx/prensa/especiales/2003/dh_2003/gruposvulnerables.pdf
Imágenes:
http://aristotelizar.com/web/contra-la-discriminacion-2/2008/08/13/
http://hellengarcia.spaces.live.com/Blog/cns!186A04109491AE8D!2582.entry
http://www.orione2007.com.ar/sitio/index.php?option=com_content&task=view&id=235
RESULTADOS FINALES RESULTADOS FINALES RESULTADOS FINALES RESULTADOS FINALES DE ESTUDIO DE ATENCIÓN A GRUPOS VULNERABLES DE ESTUDIO DE ATENCIÓN A GRUPOS VULNERABLES DE ESTUDIO DE ATENCIÓN A GRUPOS VULNERABLES DE ESTUDIO DE ATENCIÓN A GRUPOS VULNERABLES
6666
RESULTADOS DE LA ENCUESTARESULTADOS DE LA ENCUESTARESULTADOS DE LA ENCUESTARESULTADOS DE LA ENCUESTA
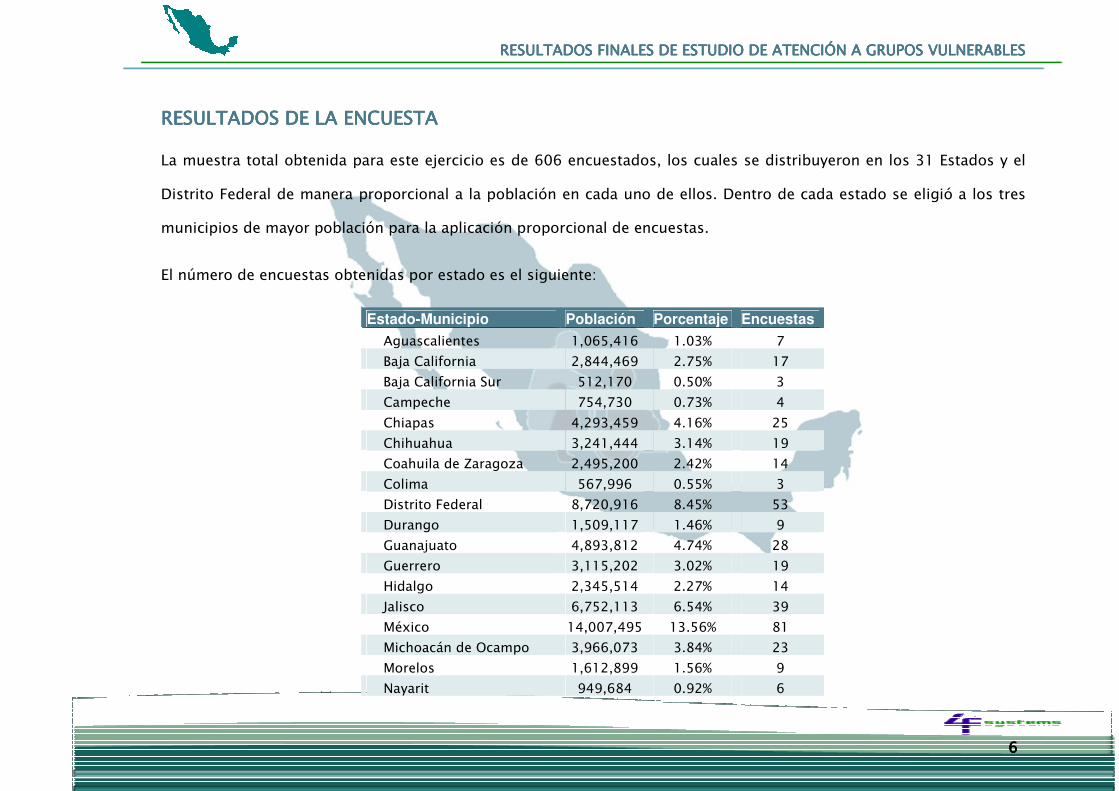
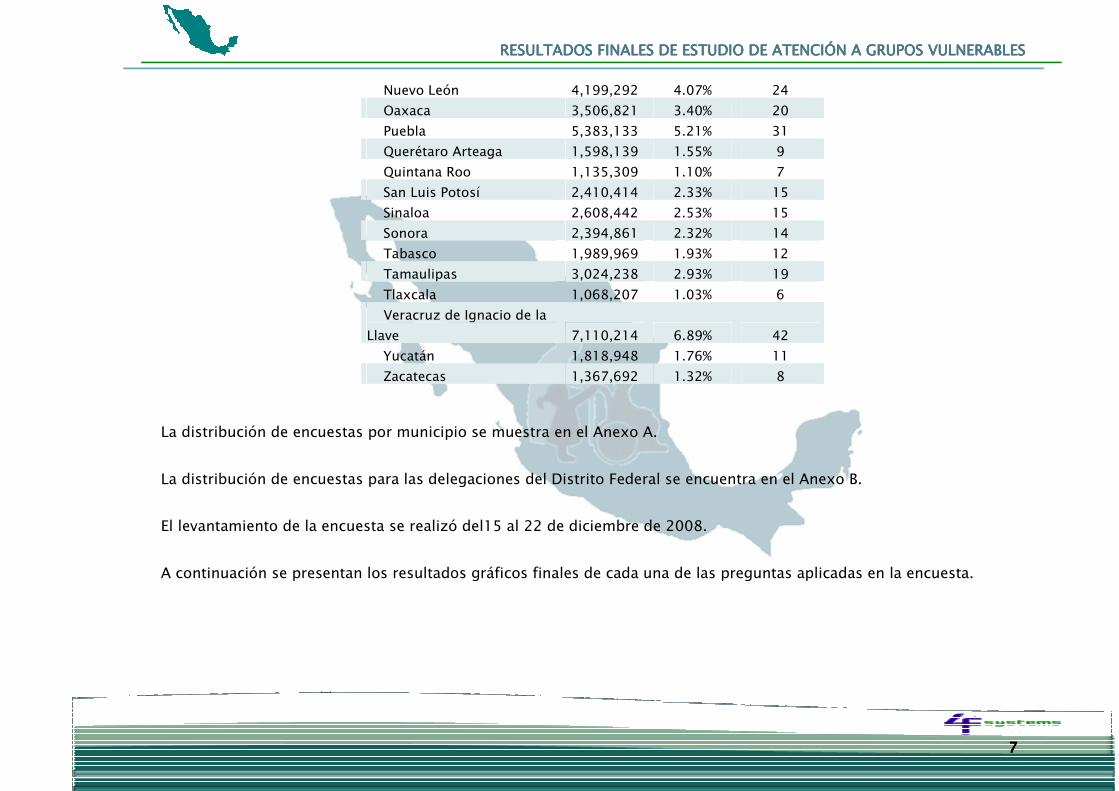
La muestra total obtenida para este ejercicio es de 606 encuestados, los cuales se distribuyeron en los 31 Estados y el
Distrito Federal de manera proporcional a la población en cada uno de ellos. Dentro de cada estado se eligió a los tres
municipios de mayor población para la aplicación proporcional de encuestas.
El número de encuestas obtenidas por estado es el siguiente:
Estado-Municipio Población Porcentaje Encuestas
Aguascalientes 1,065,416 1.03% 7
Baja California 2,844,469 2.75% 17
Baja California Sur 512,170 0.50% 3
Campeche 754,730 0.73% 4
Chiapas 4,293,459 4.16% 25
Chihuahua 3,241,444 3.14% 19
Coahuila de Zaragoza 2,495,200 2.42% 14
Colima 567,996 0.55% 3
Distrito Federal 8,720,916 8.45% 53
Durango 1,509,117 1.46% 9
Guanajuato 4,893,812 4.74% 28
Guerrero 3,115,202 3.02% 19
Hidalgo 2,345,514 2.27% 14
Jalisco 6,752,113 6.54% 39
México 14,007,495 13.56% 81
Michoacán de Ocampo 3,966,073 3.84% 23
Morelos 1,612,899 1.56% 9
Nayarit 949,684 0.92% 6
RESULTADOS FINALES RESULTADOS FINALES RESULTADOS FINALES RESULTADOS FINALES DE ESTUDIO DE ATENCIÓN A GRUPOS VULNERABLES DE ESTUDIO DE ATENCIÓN A GRUPOS VULNERABLES DE ESTUDIO DE ATENCIÓN A GRUPOS VULNERABLES DE ESTUDIO DE ATENCIÓN A GRUPOS VULNERABLES
7777
Nuevo León 4,199,292 4.07% 24
Oaxaca 3,506,821 3.40% 20
Puebla 5,383,133 5.21% 31
Querétaro Arteaga 1,598,139 1.55% 9
Quintana Roo 1,135,309 1.10% 7
San Luis Potosí 2,410,414 2.33% 15
Sinaloa 2,608,442 2.53% 15
Sonora 2,394,861 2.32% 14
Tabasco 1,989,969 1.93% 12
Tamaulipas 3,024,238 2.93% 19
Tlaxcala 1,068,207 1.03% 6
Veracruz de Ignacio de la
Llave 7,110,214 6.89% 42
Yucatán 1,818,948 1.76% 11
Zacatecas 1,367,692 1.32% 8
La distribución de encuestas por municipio se muestra en el Anexo A.
La distribución de encuestas para las delegaciones del Distrito Federal se encuentra en el Anexo B.
El levantamiento de la encuesta se realizó del15 al 22 de diciembre de 2008.
A continuación se presentan los resultados gráficos finales de cada una de las preguntas aplicadas en la encuesta.
RESULTADOS FINALES RESULTADOS FINALES RESULTADOS FINALES RESULTADOS FINALES DE ESTUDIO DE ATENCIÓN A GRUPOS VULNERABLES DE ESTUDIO DE ATENCIÓN A GRUPOS VULNERABLES DE ESTUDIO DE ATENCIÓN A GRUPOS VULNERABLES DE ESTUDIO DE ATENCIÓN A GRUPOS VULNERABLES
8888
NS/NC = No sabe ó No contestó
DISCRIMINACIÓN DISCRIMINACIÓN DISCRIMINACIÓN DISCRIMINACIÓN
RESULTADOS FINALES RESULTADOS FINALES RESULTADOS FINALES RESULTADOS FINALES DE ESTUDIO DE ATENCIÓN A GRUPOS VULNERABLES DE ESTUDIO DE ATENCIÓN A GRUPOS VULNERABLES DE ESTUDIO DE ATENCIÓN A GRUPOS VULNERABLES DE ESTUDIO DE ATENCIÓN A GRUPOS VULNERABLES
9999 NS/NC = No sabe ó No contestó
RESULTADOS FINALES RESULTADOS FINALES RESULTADOS FINALES RESULTADOS FINALES DE ESTUDIO DE ATENCIÓN A GRUPOS VULNERABLES DE ESTUDIO DE ATENCIÓN A GRUPOS VULNERABLES DE ESTUDIO DE ATENCIÓN A GRUPOS VULNERABLES DE ESTUDIO DE ATENCIÓN A GRUPOS VULNERABLES
1111
0000
NS/NC = No sabe ó No contestó
RESULTADOS FINALES RESULTADOS FINALES RESULTADOS FINALES RESULTADOS FINALES DE ESTUDIO DE ATENCIÓN A GRUPOS VULNERABLES DE ESTUDIO DE ATENCIÓN A GRUPOS VULNERABLES DE ESTUDIO DE ATENCIÓN A GRUPOS VULNERABLES DE ESTUDIO DE ATENCIÓN A GRUPOS VULNERABLES
1111
1111
NS/NC = No sabe ó No contestó
RESULTADOS FINALES RESULTADOS FINALES RESULTADOS FINALES RESULTADOS FINALES DE ESTUDIO DE ATENCIÓN A GRUPOS VULNERABLES DE ESTUDIO DE ATENCIÓN A GRUPOS VULNERABLES DE ESTUDIO DE ATENCIÓN A GRUPOS VULNERABLES DE ESTUDIO DE ATENCIÓN A GRUPOS VULNERABLES
1111
2222
CALIDAD DE VIDA CALIDAD DE VIDA CALIDAD DE VIDA CALIDAD DE VIDA

RESULTADOS FINALES RESULTADOS FINALES RESULTADOS FINALES RESULTADOS FINALES DE ESTUDIO DE ATENCIÓN A GRUPOS VULNERABLES DE ESTUDIO DE ATENCIÓN A GRUPOS VULNERABLES DE ESTUDIO DE ATENCIÓN A GRUPOS VULNERABLES DE ESTUDIO DE ATENCIÓN A GRUPOS VULNERABLES
1111
3333
NS/NC = No sabe ó No contestó
44.9%44.9%44.9%44.9%
4.54.54.54.5%%%%

RESULTADOS FINALES RESULTADOS FINALES RESULTADOS FINALES RESULTADOS FINALES DE ESTUDIO DE ATENCIÓN A GRUPOS VULNERABLES DE ESTUDIO DE ATENCIÓN A GRUPOS VULNERABLES DE ESTUDIO DE ATENCIÓN A GRUPOS VULNERABLES DE ESTUDIO DE ATENCIÓN A GRUPOS VULNERABLES
1111
4444 NS/NC = No sabe ó No contestó
PromedioPromedioPromedioPromedio
7.717.717.717.71

RESULTADOS FINALES RESULTADOS FINALES RESULTADOS FINALES RESULTADOS FINALES DE ESTUDIO DE ATENCIÓN A GRUPOS VULNERABLES DE ESTUDIO DE ATENCIÓN A GRUPOS VULNERABLES DE ESTUDIO DE ATENCIÓN A GRUPOS VULNERABLES DE ESTUDIO DE ATENCIÓN A GRUPOS VULNERABLES
1111
5555
NS/NC = No sabe ó No contestó
Promedio
6.226.226.226.22

RESULTADOS FINALES RESULTADOS FINALES RESULTADOS FINALES RESULTADOS FINALES DE ESTUDIO DE ATENCIÓN A GRUPOS VULNERABLES DE ESTUDIO DE ATENCIÓN A GRUPOS VULNERABLES DE ESTUDIO DE ATENCIÓN A GRUPOS VULNERABLES DE ESTUDIO DE ATENCIÓN A GRUPOS VULNERABLES
1111
6666 NS/NC = No sabe ó No contestó
Promedio
6.816.816.816.81

RESULTADOS FINALES RESULTADOS FINALES RESULTADOS FINALES RESULTADOS FINALES DE ESTUDIO DE ATENCIÓN A GRUPOS VULNERABLES DE ESTUDIO DE ATENCIÓN A GRUPOS VULNERABLES DE ESTUDIO DE ATENCIÓN A GRUPOS VULNERABLES DE ESTUDIO DE ATENCIÓN A GRUPOS VULNERABLES
1111
7777

RESULTADOS FINALES RESULTADOS FINALES RESULTADOS FINALES RESULTADOS FINALES DE ESTUDIO DE ATENCIÓN A GRUPOS VULNERABLES DE ESTUDIO DE ATENCIÓN A GRUPOS VULNERABLES DE ESTUDIO DE ATENCIÓN A GRUPOS VULNERABLES DE ESTUDIO DE ATENCIÓN A GRUPOS VULNERABLES
1111
8888
NS/NC = No sabe ó No contestó
Promedio
6.676.676.676.67

RESULTADOS FINALES RESULTADOS FINALES RESULTADOS FINALES RESULTADOS FINALES DE ESTUDIO DE ATENCIÓN A GRUPOS VULNERABLES DE ESTUDIO DE ATENCIÓN A GRUPOS VULNERABLES DE ESTUDIO DE ATENCIÓN A GRUPOS VULNERABLES DE ESTUDIO DE ATENCIÓN A GRUPOS VULNERABLES
1111
9999
NS/NC = No sabe ó No contestó
Fácil/ Muy fácil
50%
Difícil/ Muy difícil
43%
NS/NC7%

RESULTADOS FINALES RESULTADOS FINALES RESULTADOS FINALES RESULTADOS FINALES DE ESTUDIO DE ATENCIÓN A GRUPOS VULNERABLES DE ESTUDIO DE ATENCIÓN A GRUPOS VULNERABLES DE ESTUDIO DE ATENCIÓN A GRUPOS VULNERABLES DE ESTUDIO DE ATENCIÓN A GRUPOS VULNERABLES
2222
0000
NS/NC = No sabe ó No contestó
Fácil/ Muy fácil0.07
Difícil/Muy Díficil 90.6%
NS/NC0.02

RESULTADOS FINALES RESULTADOS FINALES RESULTADOS FINALES RESULTADOS FINALES DE ESTUDIO DE ATENCIÓN A GRUPOS VULNERABLES DE ESTUDIO DE ATENCIÓN A GRUPOS VULNERABLES DE ESTUDIO DE ATENCIÓN A GRUPOS VULNERABLES DE ESTUDIO DE ATENCIÓN A GRUPOS VULNERABLES
2222
1111
NS/NC = No sabe ó No contestó
32.532.532.532.5%%%% 30.230.230.230.2%%%%

RESULTADOS FINALES RESULTADOS FINALES RESULTADOS FINALES RESULTADOS FINALES DE ESTUDIO DE ATENCIÓN A GRUPOS VULNERABLES DE ESTUDIO DE ATENCIÓN A GRUPOS VULNERABLES DE ESTUDIO DE ATENCIÓN A GRUPOS VULNERABLES DE ESTUDIO DE ATENCIÓN A GRUPOS VULNERABLES
2222
2222
NS/NC = No sabe ó No contestó
Segura/ Muy
Segura
36.5%
Insegura/ Muy
Insegura
60.6%
NS/NC3.0%

RESULTADOS FINALES RESULTADOS FINALES RESULTADOS FINALES RESULTADOS FINALES DE ESTUDIO DE ATENCIÓN A GRUPOS VULNERABLES DE ESTUDIO DE ATENCIÓN A GRUPOS VULNERABLES DE ESTUDIO DE ATENCIÓN A GRUPOS VULNERABLES DE ESTUDIO DE ATENCIÓN A GRUPOS VULNERABLES
2222
3333 NS/NC = No sabe ó No contestó

RESULTADOS FINALES RESULTADOS FINALES RESULTADOS FINALES RESULTADOS FINALES DE ESTUDIO DE ATENCIÓN A GRUPOS VULNERABLES DE ESTUDIO DE ATENCIÓN A GRUPOS VULNERABLES DE ESTUDIO DE ATENCIÓN A GRUPOS VULNERABLES DE ESTUDIO DE ATENCIÓN A GRUPOS VULNERABLES
2222
4444
NS/NC = No sabe ó No contestó

RESULTADOS FINALES RESULTADOS FINALES RESULTADOS FINALES RESULTADOS FINALES DE ESTUDIO DE ATENCIÓN A GRUPOS VULNERABLES DE ESTUDIO DE ATENCIÓN A GRUPOS VULNERABLES DE ESTUDIO DE ATENCIÓN A GRUPOS VULNERABLES DE ESTUDIO DE ATENCIÓN A GRUPOS VULNERABLES
2222
5555
GRUPOS VULNERABLESGRUPOS VULNERABLESGRUPOS VULNERABLESGRUPOS VULNERABLES

RESULTADOS FINALES RESULTADOS FINALES RESULTADOS FINALES RESULTADOS FINALES DE ESTUDIO DE ATENCIÓN A GRUPOS VULNERABLES DE ESTUDIO DE ATENCIÓN A GRUPOS VULNERABLES DE ESTUDIO DE ATENCIÓN A GRUPOS VULNERABLES DE ESTUDIO DE ATENCIÓN A GRUPOS VULNERABLES
2222
6666
NS/NC = No sabe ó No contestó

RESULTADOS FINALES RESULTADOS FINALES RESULTADOS FINALES RESULTADOS FINALES DE ESTUDIO DE ATENCIÓN A GRUPOS VULNERABLES DE ESTUDIO DE ATENCIÓN A GRUPOS VULNERABLES DE ESTUDIO DE ATENCIÓN A GRUPOS VULNERABLES DE ESTUDIO DE ATENCIÓN A GRUPOS VULNERABLES
2222
7777
NS/NC = No sabe ó No contestó

RESULTADOS FINALES RESULTADOS FINALES RESULTADOS FINALES RESULTADOS FINALES DE ESTUDIO DE ATENCIÓN A GRUPOS VULNERABLES DE ESTUDIO DE ATENCIÓN A GRUPOS VULNERABLES DE ESTUDIO DE ATENCIÓN A GRUPOS VULNERABLES DE ESTUDIO DE ATENCIÓN A GRUPOS VULNERABLES
2222
8888
NS/NC = No sabe ó No contestó

RESULTADOS FINALES RESULTADOS FINALES RESULTADOS FINALES RESULTADOS FINALES DE ESTUDIO DE ATENCIÓN A GRUPOS VULNERABLES DE ESTUDIO DE ATENCIÓN A GRUPOS VULNERABLES DE ESTUDIO DE ATENCIÓN A GRUPOS VULNERABLES DE ESTUDIO DE ATENCIÓN A GRUPOS VULNERABLES
2222
9999
NS/NC = No sabe ó No contestó

RESULTADOS FINALES RESULTADOS FINALES RESULTADOS FINALES RESULTADOS FINALES DE ESTUDIO DE ATENCIÓN A GRUPOS VULNERABLES DE ESTUDIO DE ATENCIÓN A GRUPOS VULNERABLES DE ESTUDIO DE ATENCIÓN A GRUPOS VULNERABLES DE ESTUDIO DE ATENCIÓN A GRUPOS VULNERABLES
3333
0000
NS/NC = No sabe ó No contestó

RESULTADOS FINALES RESULTADOS FINALES RESULTADOS FINALES RESULTADOS FINALES DE ESTUDIO DE ATENCIÓN A GRUPOS VULNERABLES DE ESTUDIO DE ATENCIÓN A GRUPOS VULNERABLES DE ESTUDIO DE ATENCIÓN A GRUPOS VULNERABLES DE ESTUDIO DE ATENCIÓN A GRUPOS VULNERABLES
3333
1111
NS/NC = No sabe ó No contestó
PPPPERFIL ERFIL ERFIL ERFIL SOCIOSOCIOSOCIOSOCIO----DEMOGDEMOGDEMOGDEMOGRÁFICO DE LA MUESTRARÁFICO DE LA MUESTRARÁFICO DE LA MUESTRARÁFICO DE LA MUESTRA

RESULTADOS FINALES RESULTADOS FINALES RESULTADOS FINALES RESULTADOS FINALES DE ESTUDIO DE ATENCIÓN A GRUPOS VULNERABLES DE ESTUDIO DE ATENCIÓN A GRUPOS VULNERABLES DE ESTUDIO DE ATENCIÓN A GRUPOS VULNERABLES DE ESTUDIO DE ATENCIÓN A GRUPOS VULNERABLES
3333
2222 NS/NC = No sabe ó No contestó

RESULTADOS FINALES RESULTADOS FINALES RESULTADOS FINALES RESULTADOS FINALES DE ESTUDIO DE ATENCIÓN A GRUPOS VULNERABLES DE ESTUDIO DE ATENCIÓN A GRUPOS VULNERABLES DE ESTUDIO DE ATENCIÓN A GRUPOS VULNERABLES DE ESTUDIO DE ATENCIÓN A GRUPOS VULNERABLES
3333
3333
NS/NC = No sabe ó No contestó

RESULTADOS FINALES RESULTADOS FINALES RESULTADOS FINALES RESULTADOS FINALES DE ESTUDIO DE ATENCIÓN A GRUPOS VULNERABLES DE ESTUDIO DE ATENCIÓN A GRUPOS VULNERABLES DE ESTUDIO DE ATENCIÓN A GRUPOS VULNERABLES DE ESTUDIO DE ATENCIÓN A GRUPOS VULNERABLES
3333
4444 NS/NC = No sabe ó No contestó

RESULTADOS FINALES RESULTADOS FINALES RESULTADOS FINALES RESULTADOS FINALES DE ESTUDIO DE ATENCIÓN A GRUPOS VULNERABLES DE ESTUDIO DE ATENCIÓN A GRUPOS VULNERABLES DE ESTUDIO DE ATENCIÓN A GRUPOS VULNERABLES DE ESTUDIO DE ATENCIÓN A GRUPOS VULNERABLES
3333
5555
NS/NC = No sabe ó No contestó

RESULTADOS FINALES RESULTADOS FINALES RESULTADOS FINALES RESULTADOS FINALES DE ESTUDIO DE ATENCIÓN A GRUPOS VULNERABLES DE ESTUDIO DE ATENCIÓN A GRUPOS VULNERABLES DE ESTUDIO DE ATENCIÓN A GRUPOS VULNERABLES DE ESTUDIO DE ATENCIÓN A GRUPOS VULNERABLES
3333
6666
NS/NC = No sabe ó No contestó

RESULTADOS FINALES RESULTADOS FINALES RESULTADOS FINALES RESULTADOS FINALES DE ESTUDIO DE ATENCIÓN A GRUPOS VULNERABLES DE ESTUDIO DE ATENCIÓN A GRUPOS VULNERABLES DE ESTUDIO DE ATENCIÓN A GRUPOS VULNERABLES DE ESTUDIO DE ATENCIÓN A GRUPOS VULNERABLES
3333
7777
CONCLUSIONES FINALESCONCLUSIONES FINALESCONCLUSIONES FINALESCONCLUSIONES FINALES
� Discriminación Discriminación Discriminación Discriminación
La discriminación una situación en la que una persona o grupo es tratada de forma desfavorable a causa de prejuicios,
generalmente por pertenecer a una categoría social distinta. Por lo general los grupos vulnerables son más propensos a
sufrir discriminación.
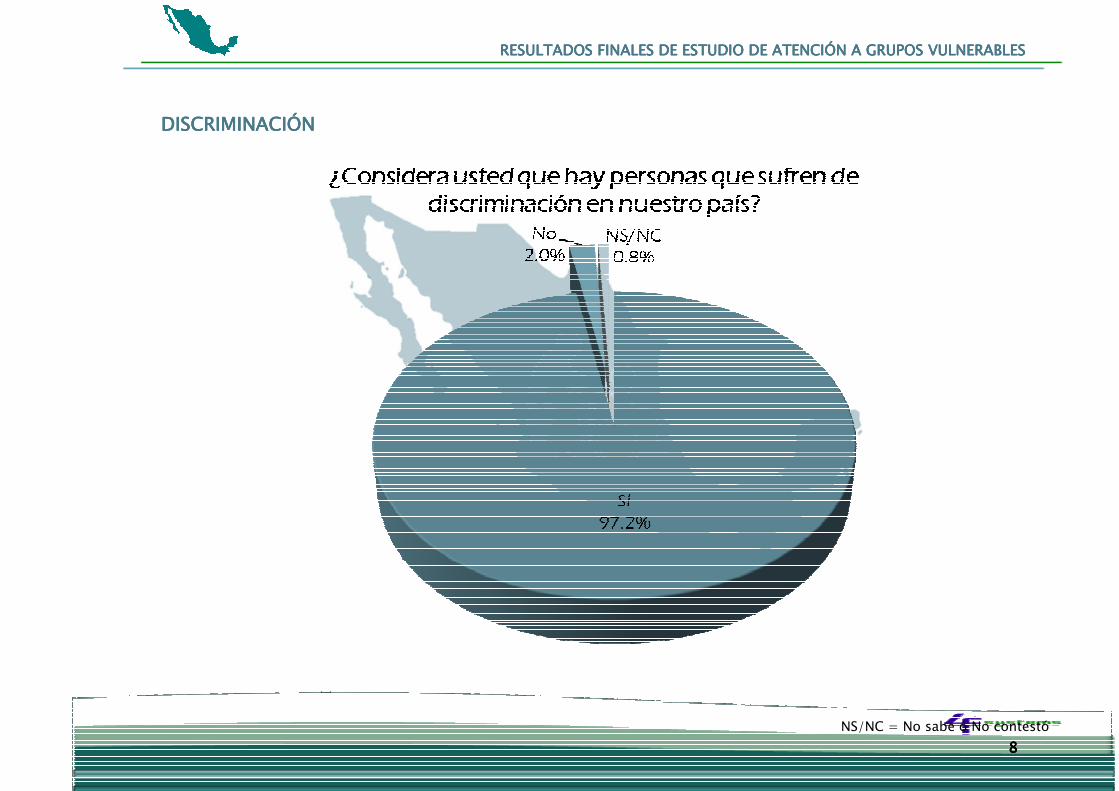
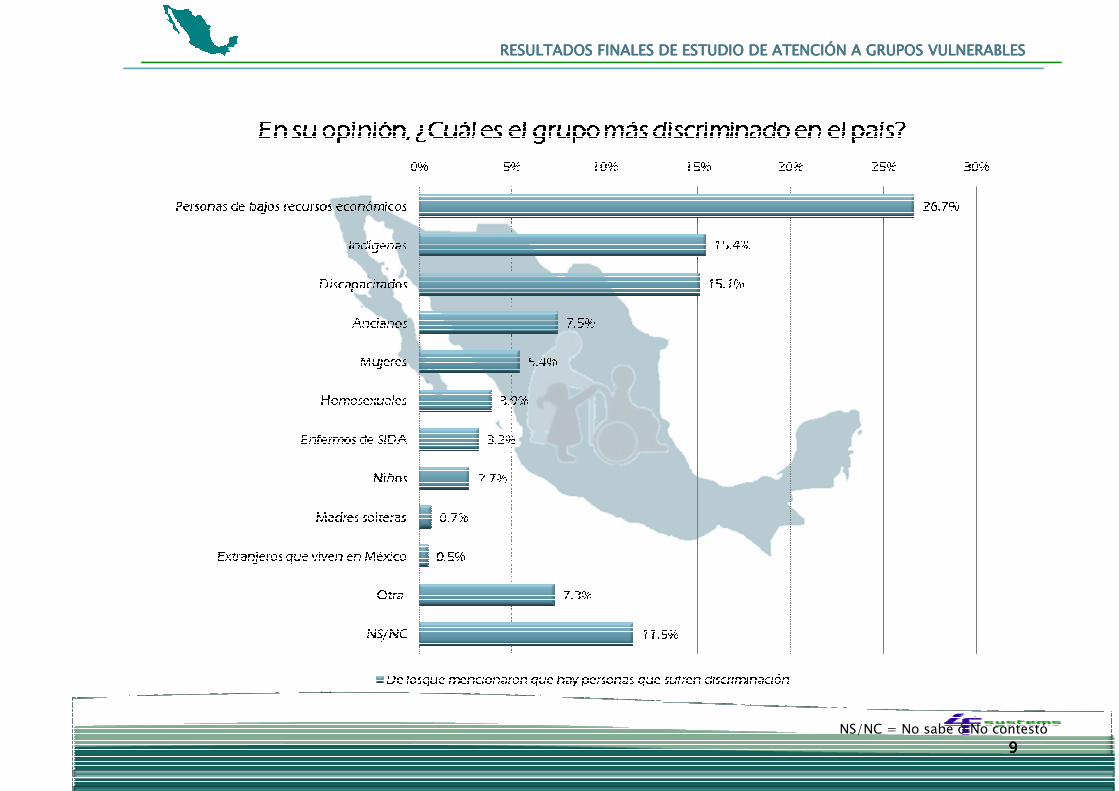
El 97.2% de las personas encuestadas consideran que hay personas que sufren de discriminación. El grupo considerado
por los encuestados como el más discriminado en el país son las personas de bajos recursos económicos. Sin embargo,
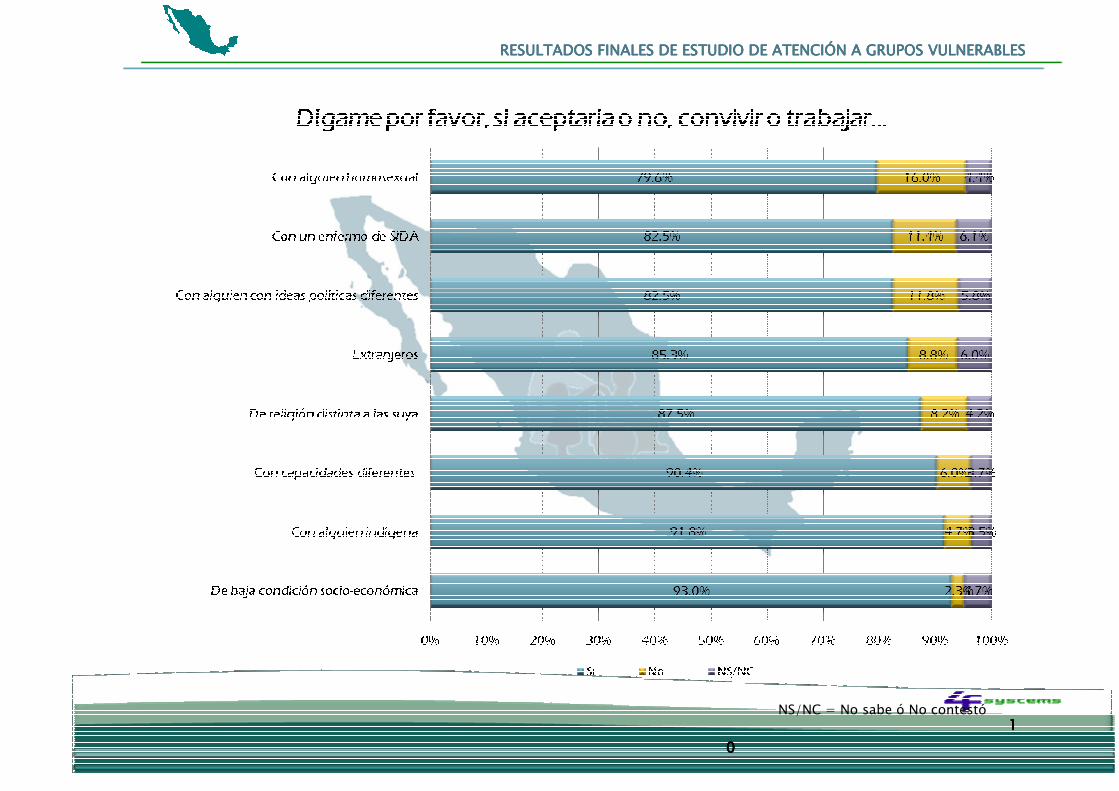
el 93% aceptaría convivir o trabajar con alguien de baja condición socio-económica. En este sentido, el grupo que tuvo
mayor porcentaje de no aceptación es de las personas homosexuales, con un 16% de las menciones.
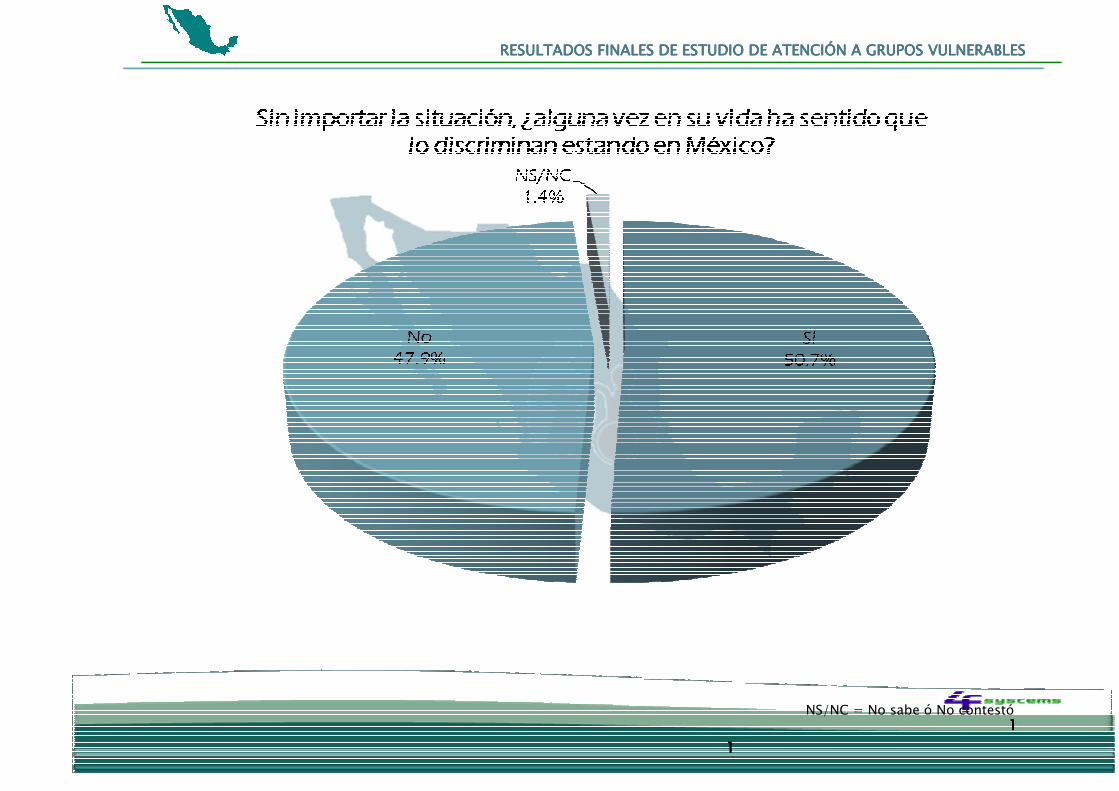
Una de cada dos personas ha sentido alguna vez que lo discriminan estando en México.
� Calidad de vidaCalidad de vidaCalidad de vidaCalidad de vida
El 44.95 de los encuestados opinan que se vive bien o muy bien en su comunidad, en cambio solamente el 4.5%
considera que se vive mal o muy mal. Casi la mitad de los encuestados opina que se vive de una forma regular.
Se consideraron algunos aspectos que influyen en la calidad de vida de los mexicanos. La calificación promedio del
estado de salud de las personas fue de 7.71. El nivel académico de las escuelas tuvo una calificación promedio de 6.67.

RESULTADOS FINALES RESULTADOS FINALES RESULTADOS FINALES RESULTADOS FINALES DE ESTUDIO DE ATENCIÓN A GRUPOS VULNERABLES DE ESTUDIO DE ATENCIÓN A GRUPOS VULNERABLES DE ESTUDIO DE ATENCIÓN A GRUPOS VULNERABLES DE ESTUDIO DE ATENCIÓN A GRUPOS VULNERABLES
3333
8888
En cuanto a los servicios no gubernamentales se tuvo una media de calificación de 6.81. El aspecto peor evaluado fue la
calidad de los servicios públicos con un promedio de 6.22.
Con respecto a la facilidad de vivir en una casa habitación que cubra las necesidades de la familia de los encuestados, el
50% considera que es fácil o muy fácil, y el 43% lo contrario. Nueve de cada diez personas consideran que es difícil o
muy difícil encontrar un trabajo adecuado en la comunidad que habitan.
En cuanto al acceso a un servicio de salud adecuado cuando es necesario, la opinión se encuentra dividida. El 32.5% de
los encuestados opinan que es fácil o muy fácil contar con servicio médico adecuado, 35.1% opina que la facilidad es
regular, en cambio el 30.2% considera que es difícil o muy difícil tener el servicio.
En lo referente a la seguridad, tres de cada cinco encuestados considera que su comunidad es Insegura o muy insegura.
� Grupos vGrupos vGrupos vGrupos vulnerablesulnerablesulnerablesulnerables
El 38.1% manifestó conocer a alguien que insulte o golpee a su pareja, 16.3% a alguien que golpee o insulte a padres
ancianos y el 27.9% sabe de situaciones en que un niño es maltratado por sus padres.
Con respecto a los obstáculos que tienen las mujeres para salir adelante, el 13.9 dijo que el principal obstáculo es el se
mujer y 13.2% mencionó el machismo. 11.6% considera que las mujeres no tienen ningún obstáculo. Hablando de los
derechos laborales de las mujeres, el 88.4% apoya que las mujeres sean contratadas por empresas, z pesar de estar
embarazadas.

RESULTADOS FINALES RESULTADOS FINALES RESULTADOS FINALES RESULTADOS FINALES DE ESTUDIO DE ATENCIÓN A GRUPOS VULNERABLES DE ESTUDIO DE ATENCIÓN A GRUPOS VULNERABLES DE ESTUDIO DE ATENCIÓN A GRUPOS VULNERABLES DE ESTUDIO DE ATENCIÓN A GRUPOS VULNERABLES
3333
9999

RESULTADOS FINALES RESULTADOS FINALES RESULTADOS FINALES RESULTADOS FINALES DE ESTUDIO DE ATENCIÓN A GRUPOS VULNERABLES DE ESTUDIO DE ATENCIÓN A GRUPOS VULNERABLES DE ESTUDIO DE ATENCIÓN A GRUPOS VULNERABLES DE ESTUDIO DE ATENCIÓN A GRUPOS VULNERABLES
4444
0000
METODOLOGÍMETODOLOGÍMETODOLOGÍMETODOLOGÍAAAA
Tipo de encuestaTipo de encuestaTipo de encuestaTipo de encuesta Encuesta Telefónica Nacional
PoblaciónPoblaciónPoblaciónPoblación de de de de estudioestudioestudioestudio Ciudadanos hombres y mujeres mayores de 18 años en hogares que cuentan con línea
telefónica. Según datos del censo de población y vivienda de 2005 del INEGI,
aproximadamente el 48.8% de los hogares en el país cuentan con línea telefónica
FechaFechaFechaFecha de de de de levantamientolevantamientolevantamientolevantamiento Del 15 al 22 de diciembre de 2008
Tamaño de muestra Tamaño de muestra Tamaño de muestra Tamaño de muestra 606 ciudadanos del país que cuentan con línea telefónica.
Esquema de Esquema de Esquema de Esquema de selecciónselecciónselecciónselección de de de de
muestramuestramuestramuestra
La distribución de la muestra se realizó de manera proporcional a la población de cada
uno de los estados, dentro de los cuales se utilizó información de INEGI para elegir a los
tres municipios que concentran la mayor población (excluyendo el Distrito Federal).
Técnica de recolección Técnica de recolección Técnica de recolección Técnica de recolección
de datosde datosde datosde datos
El estudio se realizo vía telefónica, usando cuestionario previamente elaborado. La
captura de los resultados de cada encuesta se realizó tiempo real (durante cada una de
las llamadas) en una aplicación diseñada especialmente para la campaña por personal
dedicado al desarrollo de software. El cuestionario fue aplicado por personal capacitado
en uso de equipo telefónico y aplicación de encuesta.
Diseño y exploración de Diseño y exploración de Diseño y exploración de Diseño y exploración de
resresresresultadosultadosultadosultados
Subgerencia de Operaciones de Contact Center
Método de estimación Método de estimación Método de estimación Método de estimación Los resultados presentados son frecuencias simples.

RESULTADOS FINALES RESULTADOS FINALES RESULTADOS FINALES RESULTADOS FINALES DE ESTUDIO DE ATENCIÓN A GRUPOS VULNERABLES DE ESTUDIO DE ATENCIÓN A GRUPOS VULNERABLES DE ESTUDIO DE ATENCIÓN A GRUPOS VULNERABLES DE ESTUDIO DE ATENCIÓN A GRUPOS VULNERABLES
4444
1111
de resultadosde resultadosde resultadosde resultados
Intervalo de Confianza y Intervalo de Confianza y Intervalo de Confianza y Intervalo de Confianza y
error muestral máximoerror muestral máximoerror muestral máximoerror muestral máximo
Si bien cada porcentaje presentado tiene su propio error asociado, el diseño de la
muestra garantiza que al menos 95 de cada 100 veces, el error no sobrepasa el 3.98 %.
En estudios de opinión pública, además del error de estimación, se debe considerar la
posible existencia de errores ocasionados por el fraseo e incidencias en el trabajo de
campo.

RESULTADOS FINALES RESULTADOS FINALES RESULTADOS FINALES RESULTADOS FINALES DE ESTUDIO DE ATENCIÓN A GRUPOS VULNERABLES DE ESTUDIO DE ATENCIÓN A GRUPOS VULNERABLES DE ESTUDIO DE ATENCIÓN A GRUPOS VULNERABLES DE ESTUDIO DE ATENCIÓN A GRUPOS VULNERABLES
4444
2222
ANEXO A. DISTRIBUCIÓN MUESTRAL POR MUNICIPIOANEXO A. DISTRIBUCIÓN MUESTRAL POR MUNICIPIOANEXO A. DISTRIBUCIÓN MUESTRAL POR MUNICIPIOANEXO A. DISTRIBUCIÓN MUESTRAL POR MUNICIPIO
EstadoEstadoEstadoEstado----MunicipioMunicipioMunicipioMunicipio PoblaciónPoblaciónPoblaciónPoblación PorcentajePorcentajePorcentajePorcentaje EncuestasEncuestasEncuestasEncuestas
Aguascalientes 1,065,416 1.03% 7
Aguascalientes 723,043 68% 5
Jesús María 82,623 8% 2
Baja California 2,844,469 2.75% 17
Tijuana 1,410,700 50% 10
Mexicali 855,962 30% 7
Baja California Sur 512,170 0.50% 3
La Paz 219,596 43% 2
Los Cabos 164,162 32% 1
Campeche 754,730 0.73% 4
Campeche 238,850 32% 2
Carmen 199,988 26% 1
Champotón 76,116 10% 1
Chiapas 4,293,459 4.16% 25
Tuxtla Gutiérrez 503,320 12% 14
Tapachula 282,420 7% 7
Ocosingo 170,280 4% 4
Chihuahua 3,241,444 3.14% 19
Juárez 1,313,338 41% 11
Chihuahua 758,791 23% 7
Cuauhtémoc 134,785 4% 1
Coahuila de 2,495,200 2.42% 14
EstadoEstadoEstadoEstado----MunicipioMunicipioMunicipioMunicipio PoblaciónPoblaciónPoblaciónPoblación PorcentajePorcentajePorcentajePorcentaje EncuestasEncuestasEncuestasEncuestas
Zaragoza
Saltillo 648,929 26% 6
Torreón 577,477 23% 6
Monclova 200,160 8% 2
Colima 567,996 0.55% 3
Manzanillo 137,842 24% 2
Colima 132,273 23% 1
Distrito Federal 8,720,916 8.45% 53
Durango 1,509,117 1.46% 9
Durango 526,659 35% 5
Gómez Palacio 304,515 20% 3
Lerdo 129,191 9% 1
Guanajuato 4,893,812 4.74% 28
León 1,278,087 26% 17
Irapuato 463,103 9% 6
Celaya 415,869 8% 5
Guerrero 3,115,202 3.02% 19
Acapulco de Juárez 717,766 23% 12
Chilpancingo de los
Bravo 214,219 7% 4
Iguala de la
Independencia 128,444 4% 3
Hidalgo 2,345,514 2.27% 14

RESULTADOS FINALES RESULTADOS FINALES RESULTADOS FINALES RESULTADOS FINALES DE ESTUDIO DE ATENCIÓN A GRUPOS VULNERABLES DE ESTUDIO DE ATENCIÓN A GRUPOS VULNERABLES DE ESTUDIO DE ATENCIÓN A GRUPOS VULNERABLES DE ESTUDIO DE ATENCIÓN A GRUPOS VULNERABLES
4444
3333
EstadoEstadoEstadoEstado----MunicipioMunicipioMunicipioMunicipio PoblaciónPoblaciónPoblaciónPoblación PorcentajePorcentajePorcentajePorcentaje EncuestasEncuestasEncuestasEncuestas
Pachuca de Soto 275,578 12% 7
Tulancingo de Bravo 129,935 6% 4
Huejutla de Reyes 115,786 5% 3
Jalisco 6,752,113 6.54% 39
Guadalajara 1,600,940 24% 19
Zapopan 1,155,790 17% 13
Tlaquepaque 563,006 8% 7
México 14,007,495 13.56% 81
Ecatepec de Morelos 1,688,258 12% 38
Nezahualcóyotl 1,140,528 8% 26
Naucalpan de Juárez 821,442 6% 17
Michoacán de
Ocampo 3,966,073 3.84% 23
Morelia 684,145 17% 14
Uruapan 279,229 7% 6
Zamora 170,748 4% 3
Morelos 1,612,899 1.56% 9
Cuernavaca 349,102 22% 5
Jiutepec 181,317 11% 2
Cuautla 160,285 10% 2
Nayarit 949,684 0.92% 6
Tepic 336,403 35% 4
Santiago Ixcuintla 84,314 9% 1
Bahía de Banderas 83,739 9% 1
Nuevo León 4,199,292 4.07% 24
Monterrey 1,133,814 27% 12
Guadalupe 691,931 16% 7
San Nicolás de los
Garza 476,761 11% 5
EstadoEstadoEstadoEstado----MunicipioMunicipioMunicipioMunicipio PoblaciónPoblaciónPoblaciónPoblación PorcentajePorcentajePorcentajePorcentaje EncuestasEncuestasEncuestasEncuestas
Oaxaca 3,506,821 3.40% 20
Oaxaca de Juárez 265,006 8% 11
San Juan Bautista
Tuxtepec 144,555 4% 6
Juchitán de Zaragoza 85,869 2% 3
Puebla 5,383,133 5.21% 31
Puebla 1,485,941 28% 25
Tehuacán 260,923 5% 4
San Martín
Texmelucan 130,316 2% 2
Querétaro Arteaga 1,598,139 1.55% 9
Querétaro 734,139 46% 6
San Juan del Río 208,462 13% 2
Corregidora 104,218 7% 1
Quintana Roo 1,135,309 1.10% 7
Benito Juárez 572,973 50% 5
Othón P. Blanco 219,763 19% 2
San Luis Potosí 2,410,414 2.33% 15
San Luis Potosí 730,950 30% 9
Soledad de Graciano
Sánchez 226,803 9% 3
Ciudad Valles 156,859 7% 3
Sinaloa 2,608,442 2.53% 15
Culiacán 793,730 30% 7
Mazatlán 403,888 15% 4
Ahome 388,344 15% 4
Sonora 2,394,861 2.32% 14
Hermosillo 701,838 29% 8
Cajeme 375,800 16% 4

RESULTADOS FINALES RESULTADOS FINALES RESULTADOS FINALES RESULTADOS FINALES DE ESTUDIO DE ATENCIÓN A GRUPOS VULNERABLES DE ESTUDIO DE ATENCIÓN A GRUPOS VULNERABLES DE ESTUDIO DE ATENCIÓN A GRUPOS VULNERABLES DE ESTUDIO DE ATENCIÓN A GRUPOS VULNERABLES
4444
4444
EstadoEstadoEstadoEstado----MunicipioMunicipioMunicipioMunicipio PoblaciónPoblaciónPoblaciónPoblación PorcentajePorcentajePorcentajePorcentaje EncuestasEncuestasEncuestasEncuestas
Nogales 193,517 8% 2
Tabasco 1,989,969 1.93% 12
Centro 558,524 28% 7
Cárdenas 219,563 11% 3
Comalcalco 173,773 9% 2
Tamaulipas 3,024,238 2.93% 19
Reynosa 526,888 17% 7
Matamoros 462,157 15% 7
Nuevo Laredo 355,827 12% 5
Tlaxcala 1,068,207 1.03% 6
Tlaxcala 83,748 8% 2
Huamantla 77,076 7% 2
Apizaco 73,097 7% 2
EstadoEstadoEstadoEstado----MunicipioMunicipioMunicipioMunicipio PoblaciónPoblaciónPoblaciónPoblación PorcentajePorcentajePorcentajePorcentaje EncuestasEncuestasEncuestasEncuestas
Veracruz de
Ignacio de la Llave 7,110,214 6.89% 42
Veracruz 512,310 7% 17
Xalapa 413,136 6% 14
Coatzacoalcos 280,363 4% 11
Yucatán 1,818,948 1.76% 11
Mérida 781,146 43% 9
Tizimín 69,553 4% 1
Valladolid 68,863 4% 1
Zacatecas 1,367,692 1.32% 8
Fresnillo 196,538 14% 3
Zacatecas 132,035 10% 3
Guadalupe 129,387 9% 2

RESULTADOS FINALES RESULTADOS FINALES RESULTADOS FINALES RESULTADOS FINALES DE ESTUDIO DE ATENCIÓN A GRUPOS VULNERABLES DE ESTUDIO DE ATENCIÓN A GRUPOS VULNERABLES DE ESTUDIO DE ATENCIÓN A GRUPOS VULNERABLES DE ESTUDIO DE ATENCIÓN A GRUPOS VULNERABLES
4444
5555
ANEXO B. DISTRIBUCIÓN MUESTRAL PARA EL DISTRITO FEDERALANEXO B. DISTRIBUCIÓN MUESTRAL PARA EL DISTRITO FEDERALANEXO B. DISTRIBUCIÓN MUESTRAL PARA EL DISTRITO FEDERALANEXO B. DISTRIBUCIÓN MUESTRAL PARA EL DISTRITO FEDERAL
DelegaciónDelegaciónDelegaciónDelegación PoblaciónPoblaciónPoblaciónPoblación Porcentaje Porcentaje Porcentaje Porcentaje
Muestra Muestra Muestra Muestra
equitativamente equitativamente equitativamente equitativamente
distribuidadistribuidadistribuidadistribuida
Iztapalapa 1,820,888 21% 4
Gustavo A. Madero 1,193,161 14% 4
Álvaro Obregón 706,567 8% 4
Coyoacán 628,063 7% 4
Tlalpan 607,545 7% 3
Cuauhtémoc 521,348 6% 3
Venustiano Carranza 447,459 5% 3
Azcapotzalco 425,298 5% 3
Xochimilco 404,458 5% 3
Iztacalco 395,025 5% 4
Benito Juárez 355,017 4% 3
Miguel Hidalgo 353,534 4% 3
Tláhuac 344,106 4% 3
La Magdalena Contreras 228,927 3% 3
Cuajimalpa de Morelos 173,625 2% 3
Milpa Alta 115,895 1% 3
Total Total Total Total 53535353

RESULTADOS FINALES RESULTADOS FINALES RESULTADOS FINALES RESULTADOS FINALES DE ESTUDIO DE ATENCIÓN A GRUPOS VULNERABLES DE ESTUDIO DE ATENCIÓN A GRUPOS VULNERABLES DE ESTUDIO DE ATENCIÓN A GRUPOS VULNERABLES DE ESTUDIO DE ATENCIÓN A GRUPOS VULNERABLES
4444
6666